
Abstract
Objective
This study was performed to examine the value of computed tomography-based texture assessment for characterizing different types of ovarian neoplasms.
Methods
This retrospective study involved 225 patients with histopathologically confirmed ovarian tumors after surgical resection. Two different data sets of thick (5-mm) slices (during regular and portal venous phases) were analyzed. Raw data analysis, principal component analysis, linear discriminant analysis, and nonlinear discriminant analysis were performed to classify ovarian tumors. The radiologist’s misclassification rate was compared with the MaZda (texture analysis software) findings. The results were validated with the neural network classifier. Receiver operating characteristic curves were analyzed to determine the performances of different parameters.
Results
Nonlinear discriminant analysis had a lower misclassification rate than the other analyses. Thirty texture parameters significantly differed between the two groups. In the training set, WavEnLH_s-3 and WavEnHL_s-3 were the optimal texture features during the regular phase, while WavEnHH_s-4 and Kurtosis seemed to be the most discriminative features during the portal venous phase. In the validation test, benign versus malignant tumors and benign versus borderline lesions were well-distinguished.
Conclusions
Computed tomography-based texture features provide a useful imaging signature that may assist in differentiating benign, borderline, and early-stage ovarian cancer.
Introduction
Ovarian neoplasms include benign, borderline, and cancerous lesions based on histopathology. 1 Among them, borderline ovarian tumors (BOTs) show mild nuclear atypia and cell proliferation without stromal invasion, and their biological behavior falls between that of cancerous and benign tumors. 2 Early-stage ovarian cancer (OC) (International Federation of Gynecology and Obstetrics [FIGO] stage I–II) has a significantly higher 5-year survival rate than other types of epithelial OC, 3 and it accounts for approximately 25% of all ovarian neoplasms.4,5
Ovarian tumors are usually treated surgically, and the operative plan depends on the lesion type. Benign, borderline, and malignant neoplasms often have different management plans because a conservative or fertility-sparing operation can be an option if desired. 6 However, the preoperative differentiation among benign, borderline, and early-stage malignant ovarian neoplasms has always been a clinical challenge because imaging cannot accurately and effectively identify these lesions. Perioperative frozen sections can guide gynecologists in selecting the optimal surgery for a given patient. A robust systematic review revealed that the concordance rates between frozen section findings and final diagnoses were 94%, 79%, and 99% for benign, borderline, and cancerous lesions, respectively. 7 However, intraoperative frozen section assessment has well-known limitations in diagnosing lesions such as BOTs, mucinous ovarian tumors, and large tumors. 8 Therefore, preoperative and qualitative diagnosis and accurate prediction of the lesion type are crucially important for designing the best therapeutic approach.
Computed tomography (CT) uses acceptable radiation doses and is broadly applied for preoperative ovarian tumor assessment. However, the quantitative CT features that are useful for preoperative diagnosis of ovarian tumor types have rarely been examined. With the great advances that have been made in digital technologies, a new graphics assessment tool called texture analysis has been developed for analyzing medical images based on quantitative analysis of grayscale distribution parameters, inter-pixel relations, and spatial parameters. 9
Texture analysis is attracting growing attention in CT-based texture analysis, which can help to evaluate and quantify tumor heterogeneity. Such a tool could noninvasively detect aggressive and treatment-resistant lesions. 10
The texture features of ovarian tumors have been examined in few reports, mostly those focusing on magnetic resonance imaging and/or ultrasound. However, CT texture assessment has not been evaluated to determine its value in histologically grouping ovarian tumors.11,12 We hypothesized that there are differences in the intrinsic heterogeneity among benign, borderline, and cancerous lesions and that these differences can be reflected by CT-based texture features. Therefore, we performed the present study to comparatively assess the CT-based texture parameters of benign tumors, borderline lesions, and early-stage OC and to generate a machine learning model for characterizing ovarian tumors.
Materials and methods
The reporting of this retrospective study conforms to the STARD guidelines.13,14
The present study was approved by the Institutional Research Board of Guangxi Medical University Affiliated Cancer Hospital (approval no. 2021-ky-114). All patients provided written informed consent. Consecutive patients ultimately diagnosed with benign tumors, borderline lesions, or early-stage OC from December 2015 to December 2020 were analyzed. The inclusion criteria were confirmation of an ovarian tumor by surgical resection or biopsy, availability of patient data, and complete CT data and medical history. The exclusion criteria were an ovarian mass that either had a longest diameter of <1 cm or was undetectable on CT images; pronounced CT image artifacts precluding delineation of the region of interest (ROI); secondary ovarian tumors; other cancers detected in the past 5 years; and presurgical treatments, including chemotherapy, radiotherapy, and/or local therapy. The study flowchart is presented in Figure 1. In total, 225 patients were finally included in this study. Their ages ranged from 12 to 89 years (mean, 46.87 ± 15.2 years). The training set comprised 73 early malignant tumors, 35 borderline tumors, and 78 benign tumors (Table 1). Based on the above-listed eligibility criteria, 17 early malignant tumors, 5 borderline tumors, and 17 benign tumors diagnosed in 2020 were enrolled in the validation set.

Study flowchart.
Demographic and clinical characteristics of patients with benign, borderline, and malignant ovarian neoplasm in the training set.

Data are presented as n (%) or n.
FIGO, International Federation of Gynecology and Obstetrics.
aBased on the 2014 World Health Organization classification of tumors of female reproductive organs.
bBased on the 2014 FIGO staging system.
High-resolution CT was carried out with 64-row detector (Discovery CT750 HD; GE Healthcare, Chicago, IL, USA) and 128-channel CT (Discovery CT750; GE Healthcare) scanners using the following parameters: field of view, 25 cm; matrix, 512 × 512; tube voltage, 120 kVp; tube current, 200 to 400 mA; rotation, 0.5 s, pitch, 0.984:1; and interval, 1.3 mm. The contrast agent (iodine, 350 mg/mL) was administered at a dose of 2 mL/kg (but not exceeding 100 mL) and rate of 2 mL/s. The portal venous phase (PVP) of contrast-enhanced CT images was obtained. The slice thickness was 0.625 mm, and image reconstruction to 5-mm thickness was carried out. All CT data were anonymized prior to upload to the texture analysis software (V4.6; Instytut Elektroniki, http://www.eletel.p.lodz.pl/mazda/).
The CT images were reviewed by two radiologists with 3 and 30 years of experience in abdominal CT data analysis, respectively. The radiologists were blinded to the patients’ data and performed the classifications in an independent manner.
A picture archiving and communication system was utilized for image storage. The slice with the greatest tumor diameter underwent exportation as a .bmp file. ROIs were consensually delineated by two evaluators: the images that most overtly displayed the tumor boundary were utilized for drawing the ROI, which was copied and pasted onto another image with necessary adjustments; the two-dimensional ROI was then manually placed within the lesion boundary (Figure 2). In challenging cases (obscure lesions on CT scans), magnetic resonance imaging was applied when available.
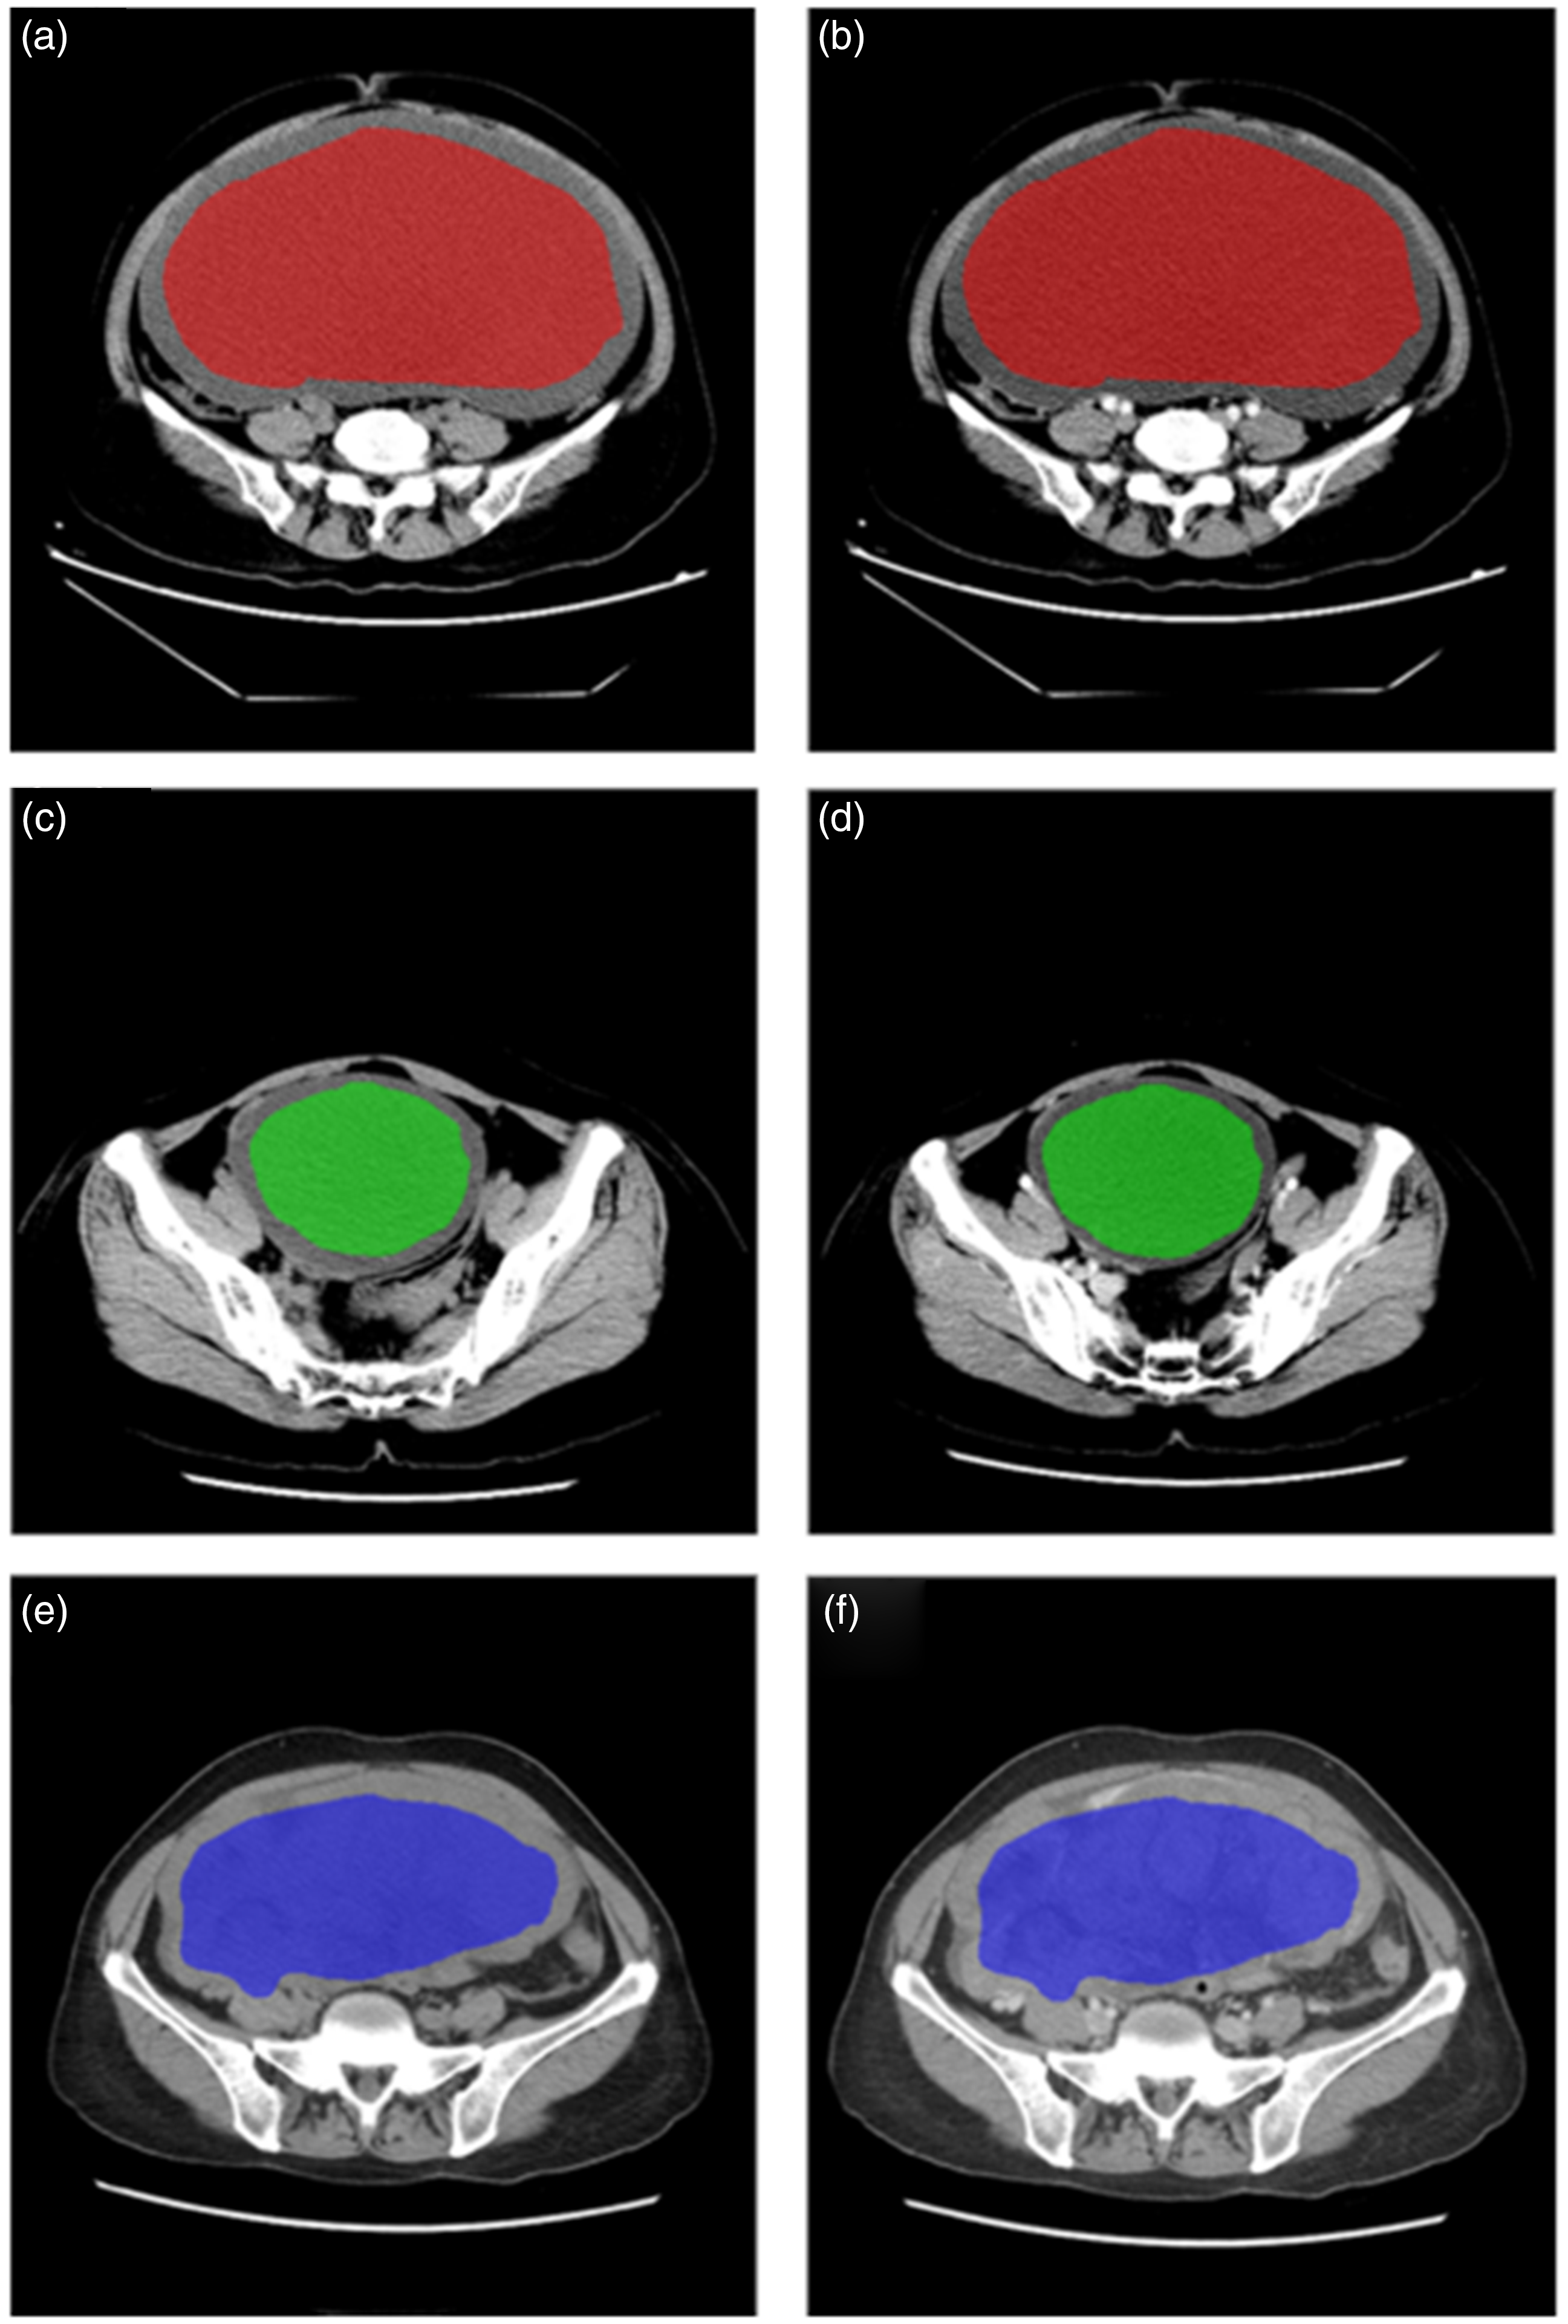
(a, b) Images of a 31-year-old woman with an ovarian serous benign tumor. Regular and portal venous phase (PVP) images show the main lesion in the red region of interest (ROI). (c, d) Images of a 45-year-old woman with an ovarian serous borderline lesion. Regular and PVP images show the main lesion in the green ROI and (e, f) Images of a 67-year-old woman with an ovarian seromucinous borderline lesion. Regular and PVP images show the main mass in the blue ROI.
A texture analysis of axial regular and enhanced CT scans in the PVP was carried out. CT-based texture analysis was performed with MaZda v4.6, which is a commercially available software. 15 The image gray-level intensity was normalized as reported previously. This package included image processing, extraction, and selection of texture features. To minimize the influence of contrast and brightness variation, image gray-level intensity normalization was performed using a method that normalizes image intensities within a range (µ − 3 δ, µ + 3 δ; µ, mean gray level value; δ, standard deviation; both µ and δ are computed separately for every ROI) in MaZda. 16
MaZda helped to compute roughly 300 texture parameters based on the image histogram, co-occurrence matrix (COM), run-length matrix, image gradient, auto-regressive model, and Haar wavelet (WAV). Fisher’s coefficient (F), classification error probability combined with average correlation coefficients (P), and mutual information (M) were jointly applied (FPM) to identify the 30 texture parameters with the greatest potential in distinguishing lesions.
The 30 parameters were obtained from the target images and further processed and classified with module B11 of MaZda. The image reflecting the greatest lesion area was selected, with the lesion boundary consensually delineated by the above-mentioned radiologists.
The feature standardization option of module B11 was utilized (mean value by standard deviation). Raw data analysis (RDA), principal component analysis (PCA), linear discriminant analysis (LDA), and nonlinear discriminant analysis (NDA) were performed for all image subsets to group the texture features. The default neural network features of module B11 were applied. Nearest-neighbor classification was carried out to assess raw data, with the most expressive and discriminating parameters determined by PCA and LDA, respectively. NDA was performed to classify the features by an artificial neural network. These classification procedures were conducted by using RDA, PCA, LDA, and NDA on module B11, and misclassification rates were calculated.
Additionally, a senior radiologist blinded to the software analysis and histopathological diagnoses grouped the cases into benign, BOT, and early malignant cases in an independent fashion, and the misclassification rate was determined. After comparing the RDA, PCA, LDA, and NDA results for the misclassification rate, the method with the highest accuracy was compared with the radiologist’s findings.
The validation set was examined based on the same 30 texture parameters, and misclassification rates were determined.
Parametric tests were performed to assess continuous variables due to the central limit theorem of conformity. 17 Numerical data with normal and skewed distributions are presented as mean ± standard deviation and median with interquartile range, respectively, and were compared using the independent-samples t-test and the Mann–Whitney U-test, respectively. Categorical data were compared using Pearson’s chi-square test or Fisher’s exact test. Qualitative data were analyzed with the chi-square test. The independent-samples t-test or independent Mann–Whitney U test was utilized to determine whether the 30 texture parameters obtained from each phase had significant differences among benign, BOT, and early malignant cases. Receiver operator characteristic curve analysis was performed to determine the areas under the receiver operating characteristic curves (AUCs). A p-value of <0.05 indicated statistical significance. SPSS 26.0 (IBM Corp., Armonk, NY, USA) was utilized for data analysis.
Results
Clinicopathologic findings in the training set
In total, 186 individuals were included in the training set (Table 1). The median ages of patients with benign lesions, BOTs, and early malignant lesions were 43.5 (range, 16–76), 48.7 (range, 15–78), and 48.9 (range, 12–80) years, respectively (p < 0.001). Table 1 summarizes all clinicopathologic features. Most lesions were of epithelial origin. The early malignant cancers included 57 stage I and 16 stage II cases, whereas the borderline lesions included 27 stage I and 8 stage II cases. Table 2 summarizes the morphological parameters of all ovarian lesions. The configuration, maximum diameter of the lesions, and number of loculi were significantly different between any two types (p < 0.05).
Morphological CT parameters of ovarian lesions in the training set.

CT, computed tomography.
Data are presented as n.
*Different values among the three groups.
Training set
Table 3 shows the grouping data for benign versus borderline, borderline versus early malignant, and benign versus early malignant lesions in various imaging phases based on MaZda. In the comparison of RDA, PCA, LDA, and NDA, NDA showed the lowest misclassification rate. The lowest misclassification rate was 5/151 (3.31%), which occurred with NDA of the regular phase in differentiating between benign and early malignant cases. However, the misclassification rates were similar in NDA between the regular phase and PVP for distinguishing between borderline and early malignant cases and between benign and early malignant cases. Of these methods, NDA had a lower misclassification rate than RDA, PCA, and LDA. Additionally, in both the regular phase and PVP, the four methods significantly differed in distinguishing among benign, borderline, and early malignant cases (p < 0.01). The lowest misclassification rate obtained by the radiologist was 29.03% (54/186) in differential diagnosis between benign and early malignant cases; this rate was markedly higher than that of NDA for all sequences (p < 0.05).
Misclassification rates in the training set for ovarian tumor grouping using FPM.

Data are presented as number of misclassifications/total cases (%). In total, 186 cases were included in the training set. RDA, PCA, LDA, and NDA were utilized for assessment in the regular and portal venous phases. Classifications were performed according to FPM.
FPM, combination of Fisher’s coefficient (F), classification error probability and average correlation coefficients (P), and mutual information (M); BOT, borderline ovarian tumor; LDA, linear discriminant analysis; NDA, nonlinear discriminant analysis; PCA, principal component analysis; RDA, raw data analysis.
AUCs were determined for all texture parameters showing significant differences; those with an AUC of >0.7 are shown in Table 4. WAV-based and COM-based parameters had good classification values. There were four WAV-based and one COM-based feature in the PVP (WavEnHH_s-4, WavEnHH_s-5, WavEnHL_s-3, WavEnHL_s-4, and Kurtosis) and four WAV-based features in the regular phase (WavEnHH_s-4, WavEnLH_s-3, WavEnHL_s-2, and WavEnHL_s-3). The most discriminating features were WavEnLH_s-3 (WAV) and WavEnHL_s-3 (WAV) in the regular phase for distinguishing between benign and borderline cases (WavEnLH_s-3: AUC, 0.846) (Figure 3(a)) and between benign and early malignant cases (WavEnHL_s-3: AUC, 0.857) (Figure 3(b)). WavEnHH_s-4 and Kurtosis were the most discriminating features in the PVP for distinguishing between benign and borderline cases (WavEnHH_s-4: AUC, 0.791) (Figure 3(c)) and between borderline and early malignant cases (Kurtosis: AUC, 0.700) (Figure 3(d)).
Texture parameters with AUCs>0.7 and P values based on the independent Mann-Whitney U test in the training set.
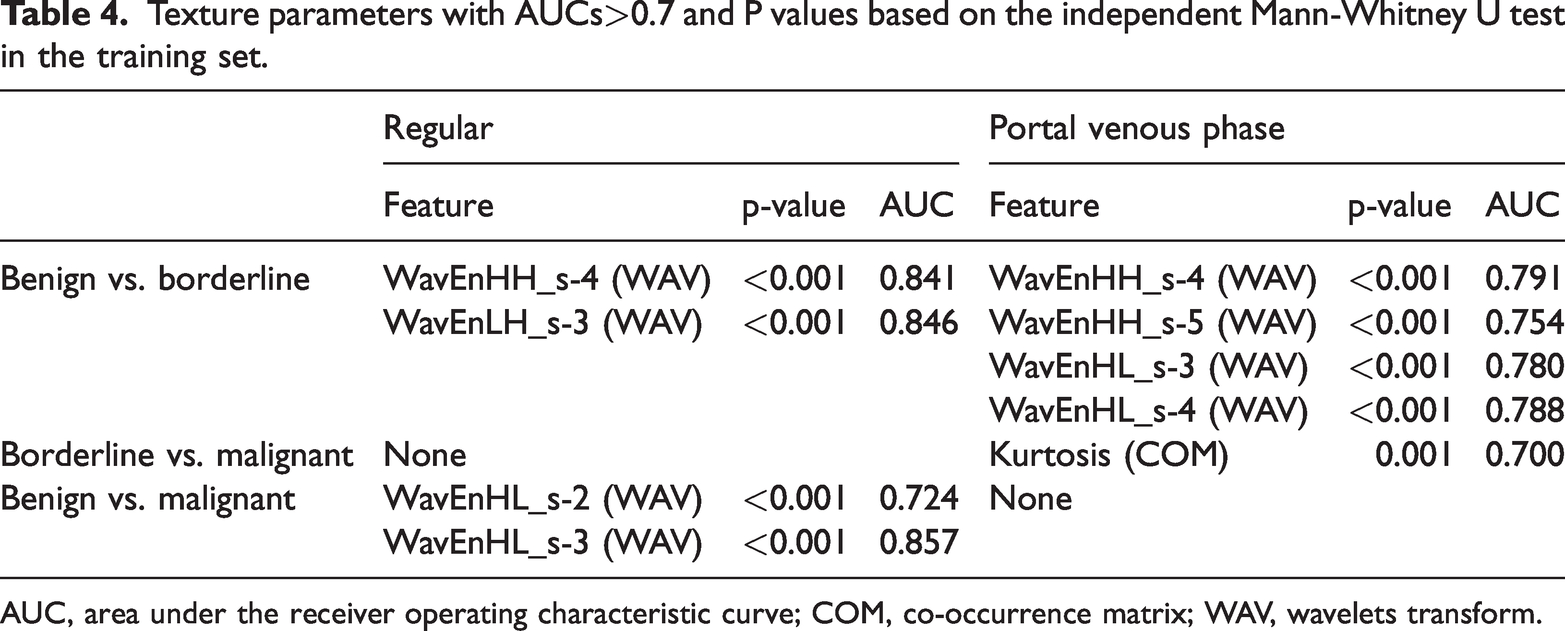
AUC, area under the receiver operating characteristic curve; COM, co-occurrence matrix; WAV, wavelets transform.

(a) Receiver operator characteristic (ROC) curve for WavEnLH_s-3 on regular images in the training set. (b) ROC curve for WavEnHL_s-3 on regular images in the training set. (c) ROC for WavEnHH_s-4 on portal venous phase (PVP) images in the training set and (d) ROC for Kurtosis on PVP images in the training set.
Validation set
Table 5 summarizes the grouping results in the validation set for different CT scan phases. These validation data accurately distinguished between benign and borderline cases in the regular phase [misclassification rate: 0.0% (0/22)], between borderline and early malignant cases [misclassification rate: 4.5% (1/22)], and between benign and early malignant cases [misclassification rate: 0.0% (0/34)]. However, regular phase and PVP data were not markedly different.
Misclassification rates of the validation set for differentiating ovarian neoplasms.

Data are presented as number of misclassifications/total cases (%). In total, 39 cases were included in the validation set. The neural network classifier was utilized for assessment with the module B11.
Figure 4 shows the results of WavEnLH_s-3, WavEnHL_s-3, WavEnHH_s-4, and Kurtosis in differentiating benign, borderline, and early malignant cases in the validation set. The performances of WavEnLH_s-3, WavEnHL_s-3, and WavEnHH_s-4 remained good in the external validation. In the regular phase, WavEnLH_s-3 distinguished between benign and borderline cases (WavEnLH_s-3: AUC, 0.824) (Figure 4(a)) while WavEnHL_s-3 distinguished between benign and early malignant cases (WavEnHL_s-3: AUC, 0.720) (Figure 4(b)) with the highest performances. In the PVP, WavEnHH_s-4 best distinguished between benign and borderline cases (WavEnHH_s-4: AUC, 0.800) (Figure 4(c)). However, Kurtosis extracted from the PVP did not differ significantly between borderline and early malignant cases (Kurtosis: AUC, 0.765) (Figure 4(d)).

(a) Receiver operator characteristic (ROC) curve for WavEnLH_s-3 on regular images in the validation set. (b) ROC for WavEnHL_s-3 on regular images in the validation set. (c) ROC for WavEnHH_s-4 on portal venous phase (PVP) images in the validation set and (d) ROC for Kurtosis on PVP images in the validation set.
Discussion
Summary of main results
In the present study, by analyzing the texture features of CT images of ovarian tumors in the regular phase and PVP, we found that use of the radiomics features based on CT texture assessment could help to distinguish among benign, borderline, and early malignant cases. Different statistical techniques (i.e., RDA, PCA, LDA, and NDA) were used for differentiating benign, borderline, and early malignant cases based on regular and PVP images in the training set. As shown above, NDA had a markedly lower misclassification rate than the other methods in the regular phase and PVP (p < 0.01) for differentiating benign, borderline, and cancerous ovarian neoplasms. The goal of NDA is to identify a nonlinear transformation of various feature vectors for projecting the input patterns on a space (potentially with lower dimensionality, as for PCA and LDA) in which linear separation occurs. The texture features of regular images showed the lowest misdiagnosis rates of 7.08% and 3.31% for benign versus borderline and benign versus malignant, respectively, and therefore had the best performance in distinguishing among them. However, the texture features obtained from PVP images better distinguished between borderline and cancerous neoplasms (misdiagnosis rate: 15.74%).
In this study, four texture feature classifications (WavEnLH_s-3, WavEnHL_s-3, WavEnHH_s-4, and Kurtosis) were vital factors for characterizing benign, borderline, and early malignant cases. As shown above, compared with borderline cases, Kurtosis in the PVP was markedly elevated for early-stage OC, suggesting that the PVP value’s maximum frequency is remarkably elevated; in other words, microvascular perfusion areas are starkly greater in early-stage OC than in borderline cases. The above results corroborate previous observations in other cancers. 18 Unfortunately, Kurtosis did not exhibit a statistically significant difference in differentiating borderline and early-stage OC in the validation set. The reason may be the relatively small number of cases in the validation set. As shown above, WavEnLH_s-3 values were markedly higher in borderline than in benign cases, WavEnHL_s-3 was higher in early malignant than in benign cases, and WavEnHH_s-4 was higher in borderline than in benign cases. Wavelet transform could identify fine structural details not detectable by the naked eye (e.g., by amplifying subtle intensity variations between areas while representing homogeneity intensity within an area). Therefore, the histopathological properties of ovarian neoplasms might be associated with frequency signals in CT, which deserves further investigation.
Results in the context of published literature
CT is widely utilized for evaluating the severity of disease and monitoring the therapeutic response in patients with ovarian tumors. Radiologists routinely perform subjective assessments of CT scans according to their experience for diagnosing or evaluating ovarian tumors. 19 Tumor heterogeneity is an essential property of cancer and is driven by highly altered tissue architecture due to infiltrated cells, necrosis, anomalous angiogenesis, and myxoid alterations. 20 Tumor heterogeneity evaluated by CT-based texture assessment is a novel tool for postprocessing CT data and generating novel quantitation features that associate qualitative and/or quantitative imaging data with diagnosis, staging, prognostication, and treatment-response assessment in various cancers.21–23
In previous studies, CT texture assessment was considered to provide promising imaging biomarkers of OC, helping to predict histopathological features, therapeutic response, and prognosis.24–26 Among statistical techniques, NDA has been shown to be effective for assessing texture features in various diseases,27,28 consistent with the results of the present study. Among the many features, Wavelet transform, a routine tool for texture analysis, converts signals from the time domain to the frequency domain, revealing the tissue characteristic properties of enhancement kinetics. It is a potent tool for distinguishing non-malignant from cancerous lesions. 29 Kurtosis reflects the peak of the gray-scale histogram based on the tissue pixel distribution and indicates the PVP size at maximum frequency. 30 To date, however, CT-based texture analysis has not been applied to compare benign, BOT, and early malignant ovarian neoplasms.
Strengths and weaknesses
This study focused on the preoperative differentiation and evaluation of ovarian neoplasms through texture analysis of CT radiomics; i.e., we investigated the diagnostic performance of texture for characterizing ovarian tumors. The results showed for the first time that CT texture features could distinguish among benign, borderline, and early-stage malignant ovarian neoplasms. This will allow doctors to more effectively assess the properties of ovarian neoplasms by CT examination.
This study had several limitations. First, it was a single-center trial involving a limited number of patients. Additionally, standardized and consistent CT parameters were applied, decreasing the generalizability of the study findings.
Implications for practice and future research
In conclusion, CT texture features could distinguish among benign, borderline, and early-stage malignant ovarian neoplasms, and NDA showed the lowest misclassification rate for both regular and PVP images. Regular images might be more informative for distinguishing between benign and borderline cases or between benign and early malignant cases, as demonstrated in the training and validation sets. Kurtosis is an optimal texture feature on PVP images for distinguishing between borderline and early-stage OC. WAV-based parameters were shown to be most discriminative.
Research Data
sj-pdf-1-imr-10.1177_03000605221150139 - Supplemental material for Computed tomography-based texture assessment for the differentiation of benign, borderline, and early-stage malignant ovarian neoplasms
Research Data for Computed tomography-based texture assessment for the differentiation of benign, borderline, and early-stage malignant ovarian neoplasms by Ziying He, Jia Chen, Fei Yang, Xinwei Pan and Chanzhen Liu in Journal of International Medical Research
Research Data
sj-pdf-2-imr-10.1177_03000605221150139 - Supplemental material for Computed tomography-based texture assessment for the differentiation of benign, borderline, and early-stage malignant ovarian neoplasms
Research Data for Computed tomography-based texture assessment for the differentiation of benign, borderline, and early-stage malignant ovarian neoplasms by Ziying He, Jia Chen, Fei Yang, Xinwei Pan and Chanzhen Liu in Journal of International Medical Research
Footnotes
Author contributions
CL and PW were responsible for the conception and design of the experiments. HY, JC, and FY contributed to the acquisition, analysis, and interpretation of the data. HY and JC wrote the manuscript. All authors have read and approved the final manuscript.
Data availability statement
The data used to support the findings of this study are available from the corresponding author upon request.
Declaration of conflicting interests
The authors declare that there is no conflict of interest.
Funding
The authors disclose receipt of the following financial support for the research, authorship, and/or publication of this article: This work was supported in part by grants from the Natural Science Foundation of Guangxi Zhuang Autonomous Region (nos. 2018GXNSFBA138048 and 2019GXNSFAA245073).
References
Supplementary Material
Please find the following supplemental material available below.
For Open Access articles published under a Creative Commons License, all supplemental material carries the same license as the article it is associated with.
For non-Open Access articles published, all supplemental material carries a non-exclusive license, and permission requests for re-use of supplemental material or any part of supplemental material shall be sent directly to the copyright owner as specified in the copyright notice associated with the article.