
Abstract
Objective
To identify key genes involved in occurrence and development of polycystic ovary syndrome (PCOS).
Methods
By downloading the GSE85932 dataset from the GEO database, we used bioinformatical analysis to analyse differentially expressed genes (DEGs) from blood samples of eight women with PCOS and eight matched controls. Following bioinformatic analysis, we performed a cross-sectional study of serum samples taken from 79 women with PCOS and 36 healthy controls.
Results
From the 178 DEGs identified by bioinformatical analysis, 15 genes were identified as significant, and of these, ORM1 and ORM2 were selected for further verification as potential biomarkers for PCOS. Serum ORM1 and ORM2 levels were significantly increased in women with PCOS, and had a high diagnostic value. ORM1 and ORM2 were positively correlated with testosterone, cholesterol, and triglycerides. ORM1 levels were negatively correlated with high density lipoprotein (HDL) while ORM2 levels showed no significant correlation.
Conclusions
ORM may be an effective biomarker for the diagnosis of PCOS and its monitoring may be a useful therapeutic strategy.
Keywords
Introduction
Polycystic ovary syndrome (PCOS), the most common endocrine disorder in reproductive-age women, is characterized by an irregular menstrual cycle, anovulation, hyperandrogenism, and polycystic-appearing ovaries, and is the main cause of female infertility. 1 PCOS is a multifactorial, polygenic, systemic, inflammatory, autoimmune disease, and is difficult to diagnose. 2 Its aetiology involves both genetic and environmental factors, and an unhealthy lifestyle, diet, infectious mediators, polymorphism or any nucleotide change, increase the risk of PCOS. 3 Lifestyle corrections, to prevent aberrant immune activation and minimize exposure to inflammatory mediators, appear to reduce the occurrence rate of PCOS.4,5
Orosomucoid (ORM) is an acute phase protein that has been shown to have a role in anti-inflammatory, immunomodulating, and angiogenic pathways. 6 ORM exists in two variants (ORM1 [α-1 acid glycoprotein] and ORM2 [α-2 acid glycoprotein]) that share similar biological properties and 90% gene sequence identity. However, ORM1 is the main component of serum ORM and has a five-fold higher concentration in plasma than ORM2.6–8 While ORM is mainly synthesized in liver, it is also produced in other tissues.9,10 ORM1 has been reported to be elevated in several diseases, such as bladder cancer, 11 rheumatoid arthritis, 12 chronic heart failure, 13 hepatocellular carcinoma, 14 lung cancer, 7 and pancreatic cancer. 15 ORM2 has been found to have aberrant expression in Crohn’s disease, 16 liver disease, 6 Alzheimer's disease, Parkinson's disease, amyotrophic lateral sclerosis, and multiple sclerosis. 17
To our knowledge, there are few studies that have investigated the potential role of ORM in PCOS. However, because ORM has a role in modulating the activity of immune system during an acute-phase reaction, it may well be involved in the development of PCOS. By analysing gene expression profiles of peripheral blood of women with PCOS, we hoped to screen and identify genes that are crucial in the pathogenesis of PCOS.
Methods
Bioinformatic analysis
By downloading the GSE85932 dataset from the GEO database, (https://www.ncbi.nlm.nih.gov/gds) using the GEO2R tool (http://www.ncbi.nlm.nih.gov/geo/geo2r/) bioinformatical analysis was used to analyse differentially expressed genes (DEGs) from the blood of eight women with PCOS and eight matched controls. Controls were matched by age and body mass index (BMI). Microarray data were obtained using the GPL22361 Agilent platform. From the preliminary data, the dataset was corrected for background, quantile normalization, and log transformation.
KEGG and GO analysis
Kyoto Encyclopaedia of Gene and Genome (KEGG) pathway and gene ontology (GO) analysis by the Database for Annotation, Visualization and Integrated Discovery (DAVID) were used to explore potential functions and mechanism of DEGs. Results were presented as KEGG pathway-enriched genes and the GO classification in terms of cellular components (CC), biological process (BP) and molecular function (MF). Statistical significance was defined at P < 0.05 and fold change ≥2.
Blood sample collection and preparation
The cross-sectional part of this study was conducted at Second Affiliated Hospital of Henan University of Traditional Chinese Medicine, Zhengzhou, China. The study followed guidelines outlined in the Standards for Reporting Diagnostic Accuracy (STARD) statement, 18 and was approved by the hospital’s Human Research Ethics Committee. Subjects provided written informed consent and patient data were anonymized prior to analysis.
In total, 115 female subjects (79 with PCOS and 36 healthy controls) were recruited between December 2021 and May 2022. All enrolled subjects met the following inclusion criteria: between 22 and 35 years of age; body mass index (BMI) between 18 and 25 kg/m2; had both ovaries; had not received any hormones or treatment for PCOS. Subjects with PCOS were diagnosed according to the criteria of the revised 2003 Rotterdam Consensus (European Society of Human Reproduction and Embryology/American Society for Reproductive Medicine criteria). 19 For inclusion, subjects with PCOS met at least two of the following criteria: (1) clinical and /or biochemical evidence of hyperandrogenism; (2) oligo-amenorrhea or chronic anovulation; (3) ultrasound appearance of polycystic ovaries after exclusion of other disorders of ovulatory dysfunction and hyperandrogenaemia. The control group was recruited from subjects who attended the hospital for a routine, medical check-up. For inclusion they met the following criteria: had a regular menstrual cycle length; did not have a disease affecting gonadotropin and sex steroid secretion, clearance, or excretion; had no signs of hyperandrogenaemia.
Blood samples were collected from the subjects in the early morning following an overnight fasting of approximately 12 h. The samples were immediately centrifuged and the supernatants stored at −80°C for further analysis.
Enzyme-linked immunosorbent assay (ELISA) analysis
The concentrations of ORM1 and ORM2 in serum were measured with a commercially available ELISA kit (Jianglai biological, Shanghai) according to the manufacturer’s instructions. Serum samples were added to plates coated with the antibody and then incubated with horseradish peroxidase (HRP)-conjugated antibody at 37°C for 45 min. After washing, the absorbance value was read at 450 nm. Concentrations of ORM1 and ORM2 were measured according to a standard curve created using the suppliers’ lyophilized human ORM1 and ORM2.
Laboratory evaluations
Blood biochemistry (including total cholesterol, triglyceride and high-density lipoprotein cholesterol [HDL-C]) was determined using an autoanalyzer (Abbott Laboratories 16000). Hormonal profile, (including luteinizing hormone, follicle-stimulating hormone and total testosterone) was assessed by an electrochemiluminescence immunoassay using an automated analyser (Abbottt Laboratories 4000i analyser).
Statistical analyses
Statistical analysis of the serum samples was performed using SPSS software (version 22.0 for Windows®; SPSS Inc., Chicago, IL, USA). A P-value <0.05 was considered to indicate statistical significance. The student’s t-test and Mann-Whitney test were used for normally and non-normally distributed variables, respectively. Receiver operating characteristic (ROC) curve analysis was applied to define optimal diagnostic cutoffs and diagnostic performance given by the area under the curve (AUC), evaluating sensitivity and specificity. Pearson’s correlation analysis was used to analyse correlations between serum ORM levels and several laboratory parameters.
Results
Screening for DEGs
From the dataset GSE85932 which included 16 blood samples, eight from subjects with PCOS and eight from matched controls we identified 178 DEGs of which 110 genes were up-regulated and 68 were down-regulated (Figure 1).

(a) Volcano plot of differentially expressed genes (DEGs). The plot compared the DEGs between PCOS patients and controls from the dataset. Red represents increased expression, green represents decreased expression, orange represents log fold change (FC) ≥−1 and log FC ≤ 1 1, and blue represents the remaining genes in the array that were not significantly changed and (b) Expression levels of ORM1 and ORM2 in each sample. Red represents high expression and green represents low expression.
KEGG and GO analysis of DEGs
The GO cellular components analysis, showed involvement of DEGs in extracellular exosomes activity (GO:0070062) and extracellular region activity (GO:0005576) (Table 1 and Figure 2). Biological process analysis showed DEGs were mainly enriched in virus defence response (GO:0051607) and immune response (GO:0006955). Molecular function analysis showed involvement of DEGs in zinc ion binding (GO: 0008270) and double-stranded RNA binding (GO: 0003725). The KEGG pathway enrichment analysis showed association of DEGs in herpes simplex infection (hsa05168), haematopoietic cell lineage (hsa04640) and influenza A (hsa05164).
Enrichment analysis of differentially expressed genes (DEGs) by GO terms (biological process [BP], cellular components [CC], molecular functions [MF]), and KEGG pathway.

GO, Gene Ontology; KEGG, Kyoto Encyclopaedia of Genes and Genomes.
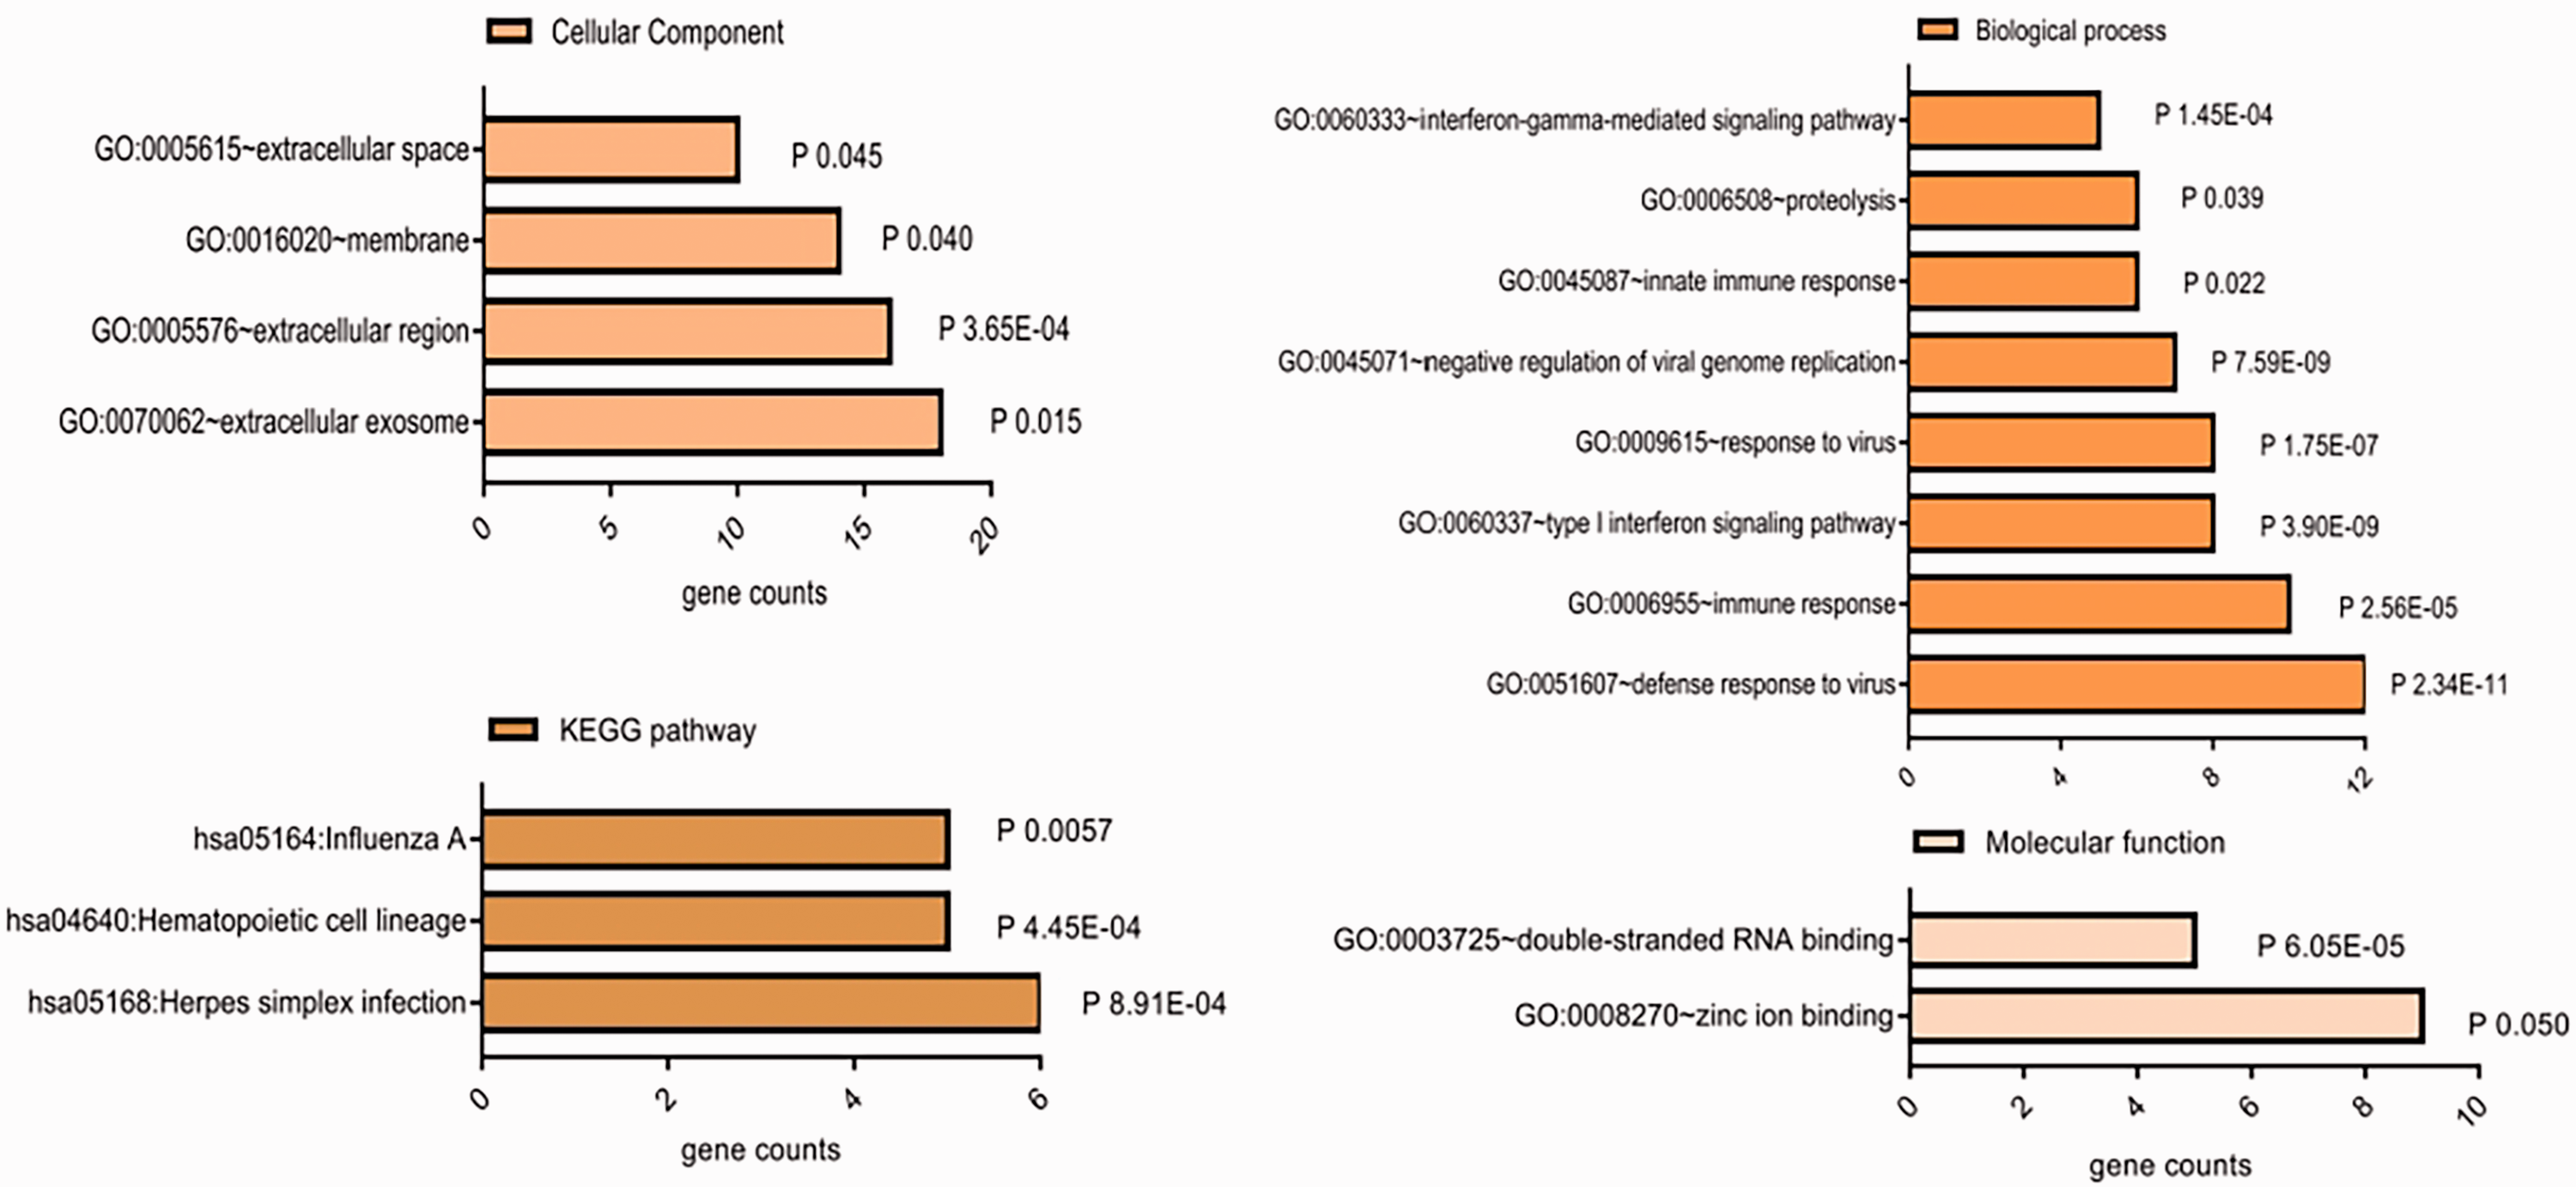
Kyoto Encyclopaedia of Gene and Genome (KEGG) pathway and gene ontology (GO) analysis by the Database for Annotation, Visualization and Integrated Discovery (DAVID) were used to explore the functions and mechanism of differentially expressed genes (DEGs). Significance was defined at P < 0.05.
With the limited screening conditions of −1 ≥log FC ≤ 1, and P < 0.05, we identified 15 significant DEGs (Table 2). From these DEGs, we selected two (ORM1 and ORM2) for further verification as potential biomarkers for PCOS.
Annotations of the 15 differentially expressed genes (DEGs) with significant fold differential expression and P < 0.05.

FC, fold change; Adj, adjusted for error rate (q value).
Measurement of ORM and biochemical parameters in serum samples
Serum samples were available from 79 subjects with PCOS and 36 healthy controls. By comparison with the control group, the PCOS group had statistically significantly higher levels of ORM1 and ORM2 (P < 0.001 and P < 0.05, respectively) (Table 3). These findings were in accordance with the bioinformatical analysis. In addition, the PCOS group had statistically significantly different levels of luteinising hormone (LH) and follicle stimulating hormone (FSH) compared with the control group and the corresponding LH/FSH ratio was significantly greater (Table 3).
Serum levels of ORM and several hormonal variables.

Data are expressed as mean ± standard deviation.
LH: Luteinizing hormone; FSH: Follicle-stimulating hormone.
ROC curve analysis was used for the assessment of various parameters as diagnostic markers for discriminating subjects with PCOS (Figure. 3 and Table 4). The optimal cut offs for ORM1 and ORM2 were 429 ng/ml, and 3.68 pg/ml, respectively. The AUCs for ORM1 and ORM2 were 0.72 (95% confidence interval [CI]: 0.61–0.83) and 0.64 (95%CI: 0.53–0.768) respectively. For ORM1, the sensitivity and specificity were 80% and 61%, respectively. ORM2 had a higher sensitivity compared with ORM1, but a lower specificity (92% and 36%, respectively).

Receiver operating characteristic (ROC) curve of serum ORM1, ORM2, LH, FSH and various combinations. LH: Luteinizing hormone; FSH: Follicle-stimulating hormone.
Diagnostic efficiency and cut-off values for each index and combined indices.

LH: Luteinizing hormone; FSH: Follicle-stimulating hormone; − not calculated.
The diagnostic cut off values, sensitivity, specificity, and AUC for LH, FSH, LH/FSH and combinations of these hormonal parameters with ORM, were also determined (Table 4). ORM2 had similar diagnostic sensitivity and specificity to FSH. The greatest AUC was for the combination of ORM1 + ORM2 + LH + FSH + LH/FSH (0.89; 95% CI: 0.83–0.95) with a sensitivity and specificity of 87% and 75%, respectively.
Correlation analysis showed that ORM1 levels were positively correlated with testosterone (P < 0.0001), total cholesterol (P < 0.0001), triglyceride (P = 0.005) and negatively correlated with HDL-C (P = 0.01). (Table 5). By contrast, ORM2 levels were positively correlated with testosterone (P < 0.0001), total cholesterol (P < 0.0001) and triglyceride (P = 0.001). However, there was no relationship between ORM2 and HDL-C (Table 6).
Association of ORM1 with hormonal and metabolic variables.
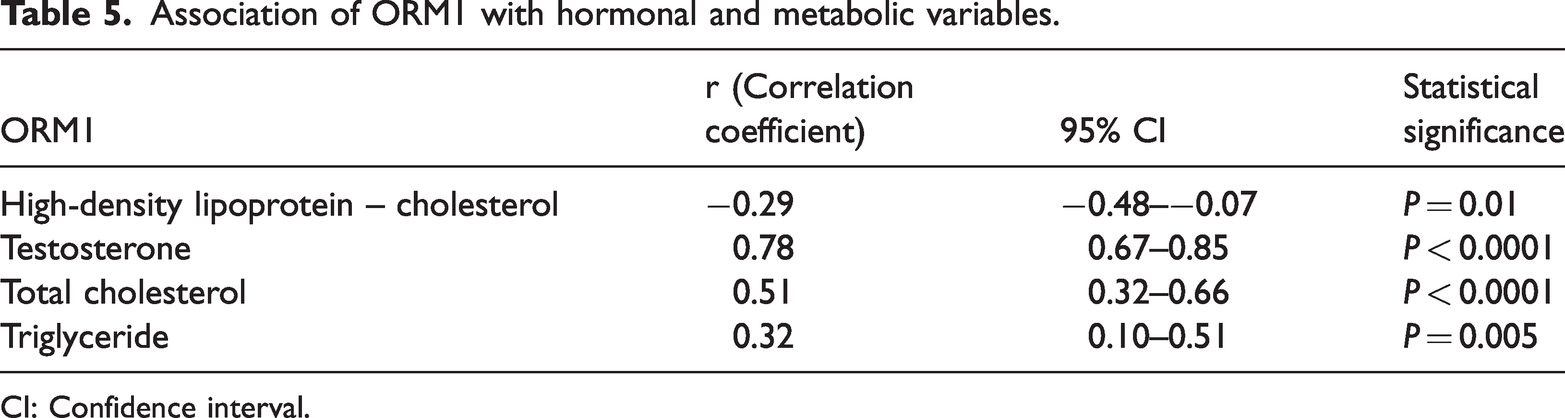
CI: Confidence interval.
Association of ORM2 with hormonal and metabolic variables.

CI: Confidence interval; ns, not statistically significant.
Discussion
Genetic factors, accumulation of environmental factors, and mitochondrial dysfunction, are reported to be common causes of PCOS. 20 Complications of this disease, such as obesity, cardiovascular disease, diabetes, infertility, metabolic syndrome, non-alcoholic liver disease and cancer seriously affect patients’ physical and mental health. 21 Currently, the diagnostic criteria for PCOS are based on expert consensus not evidence and include anovulation or oligoovulation, clinical and/or biochemical hyperandrogenism and polycystic ovarian changes on ultrasound. While serum levels of Anti-Müllerian hormone (AMH) are closely correlated with ovarian reserve function in both healthy women and women with PCOS, they have low diagnostic sensitivity and specificity for the diagnosis of PCOS alone. 22 Therefore, there is a need to identify diagnostic biomarkers for early detection and prognosis of PCOS. To this end, our objective for this study was to identify key genes involved in occurrence and development of PCOS.
Previous studies have reported that serum ORM1 is a diagnostic biomarker for lung cancer,7,23pancreatic cancer, 15 liver cancer. 14 Serum ORM1 has also been shown to be a biomarker for predicting resistance to targeted therapy in epidermal growth factor receptor (EGFR)-positive lung adenocarcinoma. 24 Urinary levels of ORM1 have been shown to be biomarker for hepatitis B virus-related liver cancer, 25 and elevated levels of ORM1 have been observed in the urine of patients with chronic heart failure. 13 High levels of urinary ORM1 have also been shown to be a useful biomarker for bladder cancer with high diagnostic sensitivity and specificity, and they are positively correlated with the pathological typing of the cancer. 11 In liver tissues, studies have shown that ORM2 was highly expressed, but downregulated in liver tumour tissues, suggesting that this is an important factor in the development of liver cancer. 26 Furthermore, studies have found that the level of ORM2 in the urine of patients with rheumatoid arthritis is elevated and correlated with disease activity. 27 ORM2 may also serve as a potential diagnostic marker in colorectal cancer. 16
We used the dataset GSE85932 from the GEO database and the GEO2R statistical tool to identify DEGs from serum of subjects with PCOS. In total, we identified 110 up-regulated genes and 68 down-regulated genes. We used GO and KEGG enrichment analysis to determine the functional annotation of these genes. We found the biological processes of these DEGs was mainly enriched in the virus defence response. The cellular composition was concentrated in exosomes and the molecular function was concentrated in zinc ion binding. The cell signalling pathway was concentrated in herpes simplex infection. According to our standard criteria (−1 ≥ log FC ≤ 1, and P < 0.05), 15 genes were identified as significant. Of these we selected two (ORM1 and ORM2) for further verification as potential biomarkers for PCOS.
Following bioinformatic analysis, we performed a cross-sectional study and analysed serum samples from women with PCOS and controls. We found that serum ORM1 and ORM 2 levels were significantly elevated in subjects with PCOS compared with controls. In addition, ROC curve analysis showed that serum ORM1 and ORM2 levels had a diagnostic value in PCOS. Indeed, combining serum ORM1, ORM2, LH and FSH levels could improve the diagnostic efficiency of PCOS. Furthermore, serum ORM1 and ORM2 levels were positively correlated with serum testosterone, cholesterol and triglyceride levels. Serum ORM1 levels were negatively correlated with HDL-C, while ORM2 levels showed no significant correlation. Consistent with the results of this present study, a previous study found that by comparison with controls, women with PCOS had higher serum ORM1 levels, which were positively correlated with testosterone, erythrocyte sedimentation rate, C-reactive protein, and negatively correlated with sex hormone-binding globulin, HDL, and glucose/insulin ratio. 28
This study had several limitations. For example, our sample size was relatively small and we had an unequal number of women with PCOS and controls. Moreover, we did not investigate associations with other clinical characteristics of PCOS such as age, BMI, or concomitant diseases. Further, follow-up experiments are required to confirm our findings. Nevertheless, in this study the differential expression of ORM1 and ORM2 in PCOS, the diagnostic efficiency of PCOS, and the judgment of the diagnostic value of ORM combined with LH and FSH were verified by bioinformatics and preliminary experiments. In conclusion, ORM may be an effective biomarker for the diagnosis of PCOS and its monitoring may be a useful therapeutic strategy.
Supplemental Material
sj-pdf-1-imr-10.1177_03000605221147444 - Supplemental material for Screening and verification of genes related to polycystic ovary syndrome
Supplemental material, sj-pdf-1-imr-10.1177_03000605221147444 for Screening and verification of genes related to polycystic ovary syndrome by Xuebing Li, Chunxia Wang, Heng Yang, Dongxu Pei, Yuchun Liu, Sha Yan and Yongwei Li in Journal of International Medical Research
Supplemental Material
sj-pdf-2-imr-10.1177_03000605221147444 - Supplemental material for Screening and verification of genes related to polycystic ovary syndrome
Supplemental material, sj-pdf-2-imr-10.1177_03000605221147444 for Screening and verification of genes related to polycystic ovary syndrome by Xuebing Li, Chunxia Wang, Heng Yang, Dongxu Pei, Yuchun Liu, Sha Yan and Yongwei Li in Journal of International Medical Research
Footnotes
Declaration of conflicting interests
The authors declare that there are no conflicts of interest.
Funding
The authors disclose receipt of the following financial support for the research, authorship, and/or publication of this article: This work was supported by Traditional Chinese Medicine Administration of Henan Province (2019ZY2033).
References
Supplementary Material
Please find the following supplemental material available below.
For Open Access articles published under a Creative Commons License, all supplemental material carries the same license as the article it is associated with.
For non-Open Access articles published, all supplemental material carries a non-exclusive license, and permission requests for re-use of supplemental material or any part of supplemental material shall be sent directly to the copyright owner as specified in the copyright notice associated with the article.