
Abstract
Objective
This study aimed to analyze the status of hypoxia in non-rapid eye movement (NREM) sleep in children with otitis media with effusion (OME).
Methods
A total of 232 children with OME and/or adenotonsillar hypertrophy were enrolled in this retrospective study between August 2020 and November 2021. Polysomnographic monitoring was carried out, and the differences in polysomnographic results between the experimental group (children with OME and adenotonsillar hypertrophy) and control group (children with adenotonsillar hypertrophy only) were compared.
Results
The lowest oxygen saturation level during sleep was significantly lower in the experimental group (n = 36) than in the control group (n = 196). However, the apnea-hypopnea index, respiratory disorder index, apnea index, obstructive apnea index, obstructive apnea-hypopnea index, and mixed apnea-hypopnea index were significantly higher in the experimental group than in the control group. More importantly, the apnea-hypopnea index, the oxygen desaturation index, oxygen desaturation events, the average heart rate during NREM sleep, and the NREM stage in total sleep time were also significantly higher in the experimental group than in the control group.
Conclusions
Hypoxia during NREM sleep may affect the severity of OME in children.
Keywords
Introduction
Otitis media with effusion (OME) is characterized by middle ear effusion and hearing loss. OME is the most common cause of acquired hearing loss in preschool children. 1 Eustachian tube dysfunction, respiratory tract infection, craniofacial malformation, laryngopharyngeal reflux, and an immune response are the main causes of OME. 2 Adenoidal hypertrophy in children is often accompanied by tonsillar hypertrophy, resulting in upper respiratory tract obstruction, which is closely related to OME. 3 The adenoid tissue in the nasopharynx mechanically compresses the pharyngeal orifice of the eustachian tube, resulting in limitation of its ventilation and drainage function. 4 The adenoid, which is lymphoid tissue, releases inflammatory transmitters and cytokines, such as histamines, prostaglandin, matrix metalloproteinase-9, and tissue of inhibitor of metalloproteinase-1, which can cause eustachian tube and middle ear mucosa edema and promote remodeling of the extracellular matrix. This process then further aggravates mechanical obstruction of the eustachian tube, causing OME.5,6 Adenoidectomy can greatly improve the remission rate of OME, and adenoidectomy along with tympanotomy tube insertion can simultaneously reduce the repeated grommet insertion rate in children with OME.7,8
Currently, there have been only a few relevant studies and conclusions regarding whether severe hypoxia during sleep occurs in children with OME. Braun et al. found that there was no difference in the apnea-hypopnea index (AHI), apnea index (AI), hypopnea index (HI), snoring index, or nocturnal lowest oxygen saturation (LSaO2) between children with OME and the control group. 9 By comparing obstructive sleep apnea (OSA)-18 scores before and after adenoidectomy, Huang et al. found that children with OME were more likely to have OSA symptoms and related adverse effects on the quality of life. 10 Therefore, adenoidectomy could effectively improve the sleep symptoms of these patients. On the basis of the above-mentioned research, we analyzed the sleep symptoms of children with OME and/or adenotonsillar hypertrophy using polysomnographic (PSG) monitoring, which is an objective detection method, to examine the relationship between hypoxia during sleep and OME. Our findings will provide a theoretical basis for further understanding the formation mechanism of OME.
Materials and methods
Experimental design
The clinical data of 232 children with OME and/or adenotonsillar hypertrophy who were enrolled in the Department of Otolaryngology-Head and Neck Surgery of the Second Affiliated Hospital of Xi’an Jiaotong University between August 2020 and November 2021 were selected consecutively and analyzed retrospectively. All of the children with OME and adenotonsillar hypertrophy were categorized as the experimental group, and children with adenotonsillar hypertrophy only were categorized as the control group. Additionally, we de-identified all details of the children so that they could not be identified. The reporting of this study conforms to the STROBE guidelines. 11
The inclusion criteria were as follows: (1) age of 2 to 14 years, (2) severe OSA symptoms or persistent OME for more than 3 months; and (3) adenotonsillectomy. The exclusion criteria were as follows: (1) use of antibiotics within 4 weeks before the operation, (2) congenital abnormalities of craniofacial structure or neuromuscular regulation, and (3) the presence of chronic diseases, such as autoimmune diseases, diabetes, and malignancies.
The diagnostic criteria of OME were as follows: (1) light pink or dark red tympanic membrane invagination was observed under otoscopy, the tympanic membrane was bulging outward, or there was a visible liquid level and/or bubbles, and the activity of the tympanic membrane disappeared under tympanic otoscopy; (2) a B or C curve was shown by a tympanic immittance diagram; and (3) an abnormal average value of air conduction hearing threshold of the affected ear at 0.3 to 5.0 kHz of 35 to 65 dB. The diagnostic criteria of adenotonsillar hypertrophy were an adenoid/nasopharynx (A/N) ratio >0.60 or a pharyngeal airway space width ≤10 mm on an X-ray of the nasopharynx (cranial lateral position).
Data collection
Information regarding age, sex, body mass index (BMI), neck circumference, and waist circumference of the enrolled children was collected from an electronic medical record system (Donghua Software Co., Ltd., Beijing, China). Concurrently, the results of electronic laryngoscopy, acoustic immittance, the pure tone hearing threshold, nasopharyngeal X-ray film, and PSG were collected.
PSG
Before the operation, PSG was monitored by a multi-channel sleep monitor (Grael, Condi, Australia) all night and recorded continuously and synchronously for 8 hours. The severity of hypoxia during sleep was evaluated, and the differences between the PSG results of the experimental and control groups were compared. The monitoring parameters consisted of an electroencephalogram (18 leads), electrooculogram (two leads), mandibular electromyography (two leads), electrocardiogram, oronasal airflow, fingertip oxygen saturation, and respiratory movement, mainly including the following aspects. To examine oxygen saturation, we evaluated nocturnal LSaO2, the oxygen desaturation index (ODI), oxygen desaturation events, the duration of oxygen saturation < 90% (T90%), and the average oxygen saturation in rapid eye movement (REM) sleep and in NREM sleep. To examine ventilation and airflow, we evaluated the AHI, AI, HI, respiratory disorder index (RDI), obstructive apnea index (OAI), obstructive apnea-hypopnea index (OAHI), central apnea index, central apnea-hypopnea index, mixed apnea index, and mixed AHI. To examine sleep quality, we evaluated REM and NREM sleep latency (S1, S2, and S3) and the proportion of REM and NREM sleep in the total sleep time. To examine heart rate, we evaluated the lowest, highest, and average heart rates in REM and NREM sleep (S1, S2, and S3). An OAHI ≥1/hour combined with an LSaO2 < 92% was used as a pediatric OSA-hypopnea syndrome diagnostic criterion. 12
Ethical statement
The parents of all of the children provided written informed consent. The study was performed in accordance with the Declaration of Helsinki and approved by the Ethics Committee of the Second Affiliated Hospital of Xi’an Jiaotong University (approval number: 20200085).
Statistical analysis
IBM SPSS (version 22.0; IBM Corp., Armonk, NY, USA) was used for the statistical analysis. Pearson’s chi-square test was used to compare the classified data. When continuous variables conformed to normality and homogeneity of variance, a t-test or one-way analysis of variance was used for comparison between two groups or among multiple groups. Otherwise, the Mann–Whitney U test or Wilcoxon signed rank test was used. The statistical power analysis of the indicators in the study was performed using Power and Sample Size Tool (http://powerandsample size.com/Calculators), and the sample size was calculated with PASS version 2021 (REACHSOFT, Atlanta, GA, USA). Spearman correlation analysis was used to analyze the correlation between the main monitoring parameters of PSG and the results of acoustic immittance. Statistical significance was set at P < 0.05.
Results
Clinical characteristics of children with OME
Age (P < 0.001), BMI (P = 0.021), waist circumference (P < 0.001), pharyngeal airway space width (P < 0.001), hemoglobin concentrations (P = 0.024), mean corpuscular hemoglobin concentration (P = 0.002), tympanic cavity pressure (P < 0.001), and acoustic compliance (P = 0.014) were significantly lower in the experimental group (n = 36) than in the control group (n = 196). However, the A/N ratio (P < 0.001) and tympanic pressure gradient (P = 0.001) in the experimental group were significantly higher than those in the control group.
Based on the nature of middle ear effusion, all patients with OME in the experimental group were divided into the serous effusion group (n = 18), mucous effusion group (n = 12), and dry ear group (n = 6). There were no significant differences in all the indices including acoustic immittance results among the three groups. Furthermore, all patients with OME in the experimental group were divided into the unilateral OME group (n = 16, 44.44%) and the bilateral OME group (n = 20, 55.56%) according to the diseased side of middle ear effusion. The tympanic pressure gradient in the unilateral OME group was lower than that in the bilateral OME group (P < 0.001). However, the BMI and acoustic compliance value in the unilateral OME group were significantly higher than those in the bilateral OME group (both P < 0.05) (Table 1).
Clinical characteristics of patients in the OME groups and control group.
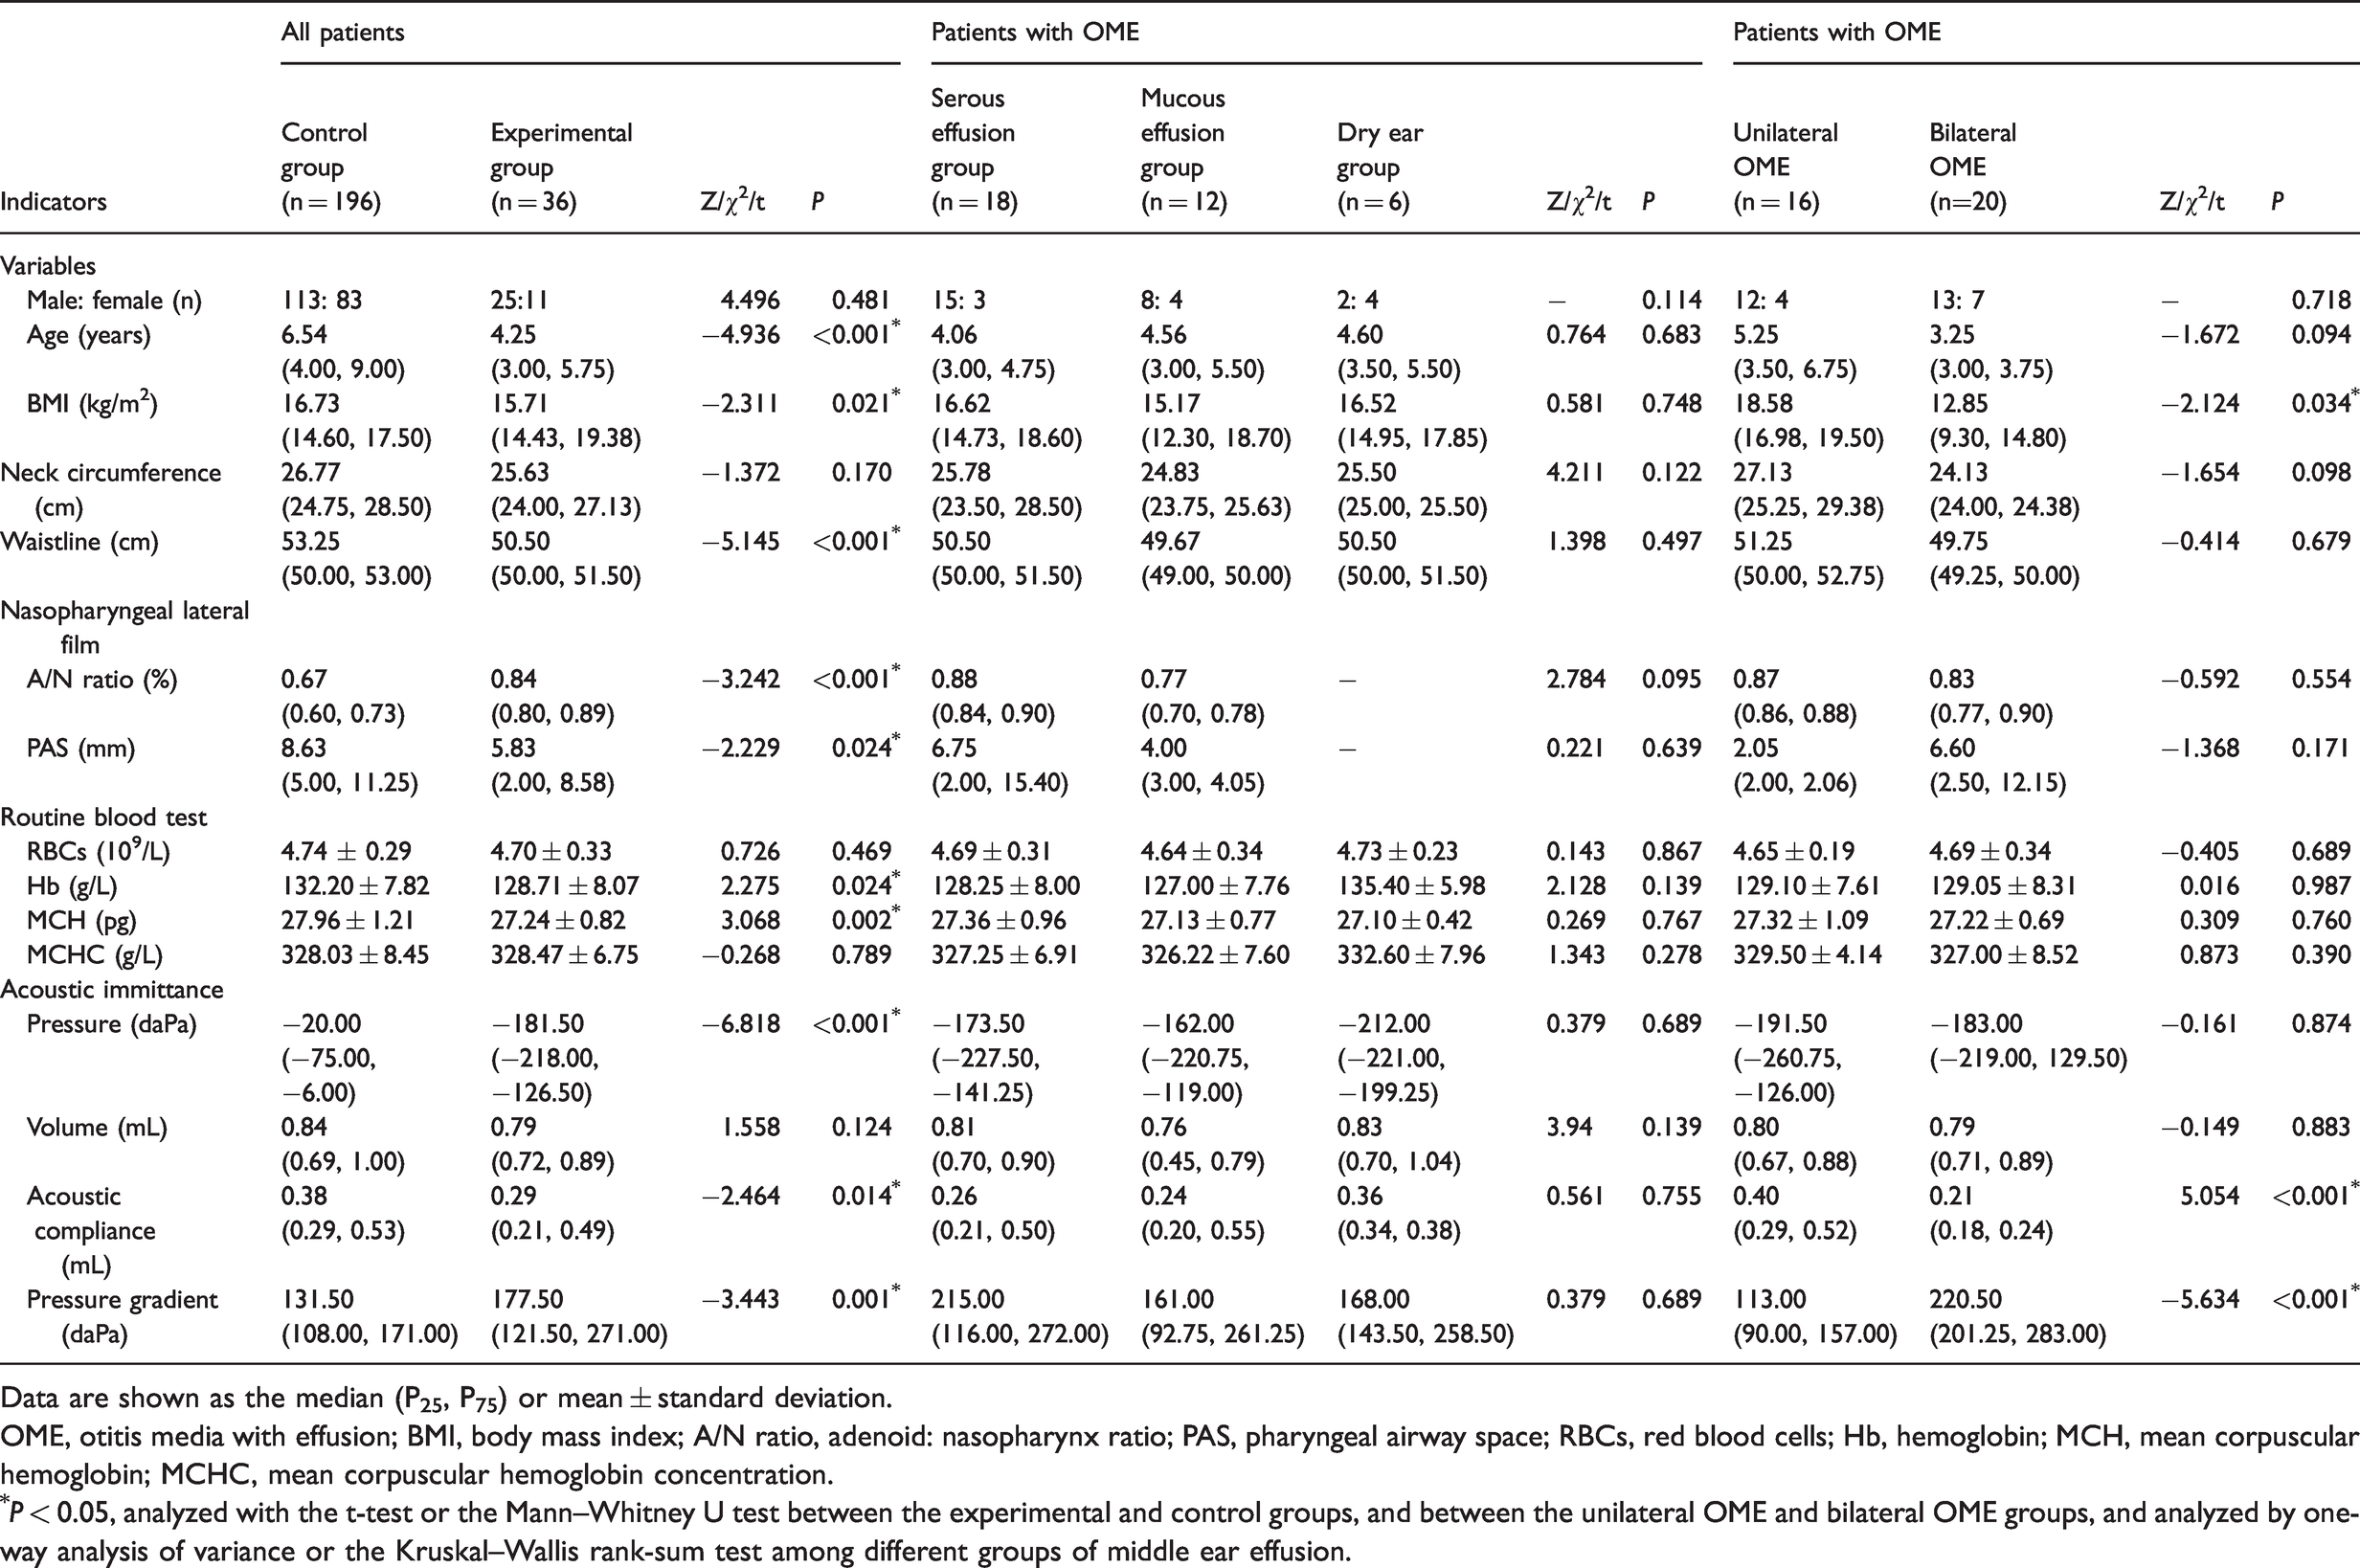
Data are shown as the median (P25, P75) or mean ± standard deviation.
OME, otitis media with effusion; BMI, body mass index; A/N ratio, adenoid: nasopharynx ratio; PAS, pharyngeal airway space; RBCs, red blood cells; Hb, hemoglobin; MCH, mean corpuscular hemoglobin; MCHC, mean corpuscular hemoglobin concentration.
*P < 0.05, analyzed with the t-test or the Mann–Whitney U test between the experimental and control groups, and between the unilateral OME and bilateral OME groups, and analyzed by one-way analysis of variance or the Kruskal–Wallis rank-sum test among different groups of middle ear effusion.
Characteristics of ventilation and blood oxygen indices during sleep in children with OME
There was no significant difference in the incidence of OSA between the experimental group and the control group (80.56% vs 72.45%), and the total average blood oxygen saturation was similar in the two groups. However, the nocturnal LSaO2 in the experimental group was significantly lower than that in the control group (P = 0.031). Blood oxygen indices, such as the ODI (P = 0.021) and oxygen desaturation events (P = 0.015), and ventilation indices, such as the AHI (P = 0.027), RDI (P = 0.028), AI (P = 0.040), OAI (P = 0.039), OAHI (P = 0.028), and mixed AHI (P = 0.037) in the experimental group were significantly higher than those in the control group (Table 2). Additionally, the statistical power of the indices mentioned above was higher than 0.90.
Comparison of polysomnographic-related indices between the experimental and control groups.

Data are shown as the median (P25, P75).
*P < 0.05, analyzed with the Mann–Whitney U test between the experimental and control groups.
The term “latency period” refers to the time from falling asleep to REM/NREM asleep appearing on the monitoring screen.
S1, S2, and S3 indicate the corresponding times of NREM phase 1, NREM phase 2, and NREM phase 3.
LSaO2, nocturnal lowest oxygen saturation; REM, rapid eye movement; NREM, non-rapid eye movement; TST, total sleep time.
Characteristics of NREM sleep in children with OME
PSG showed that related indices of NREM sleep in children with OME in the experimental group were significantly higher than those in the control group, including the ODI in NREM sleep (P = 0.011), oxygen desaturation events in NREM (P = 0.006), T90% in NREM sleep (P = 0.017), the AHI in NREM sleep (P = 0.002), NREM stage (% total sleep time) (P = 0.009), the average heart rate in NREM sleep (P < 0.001), S1 average heart rate (P = 0.021), S2 average heart rate (P < 0.001), S3 average heart rate (P = 0.021), and S2 maximum heart rate (P = 0.047) (Table 2). Except for T90%, and S1 and S3 average heart rate, the power of the parameters was greater than 0.80.
Comparison of PSG monitoring results of children with OME in different subgroups
Children with OME in the experimental group were analyzed according to the diseased side of middle ear effusion. There were no significant differences in PSG monitoring results between the unilateral and bilateral OME groups. According to the nature of middle ear effusion, the total ODI (P = 0.028), ODI in NREM sleep (P = 0.035), and S2 maximum heart rate (P = 0.029) were the highest in the serous effusion group, followed by the mucous effusion group and the dry ear group (Table 3).
Comparison of polysomnographic indices among the otitis media with effusion groups with different properties of middle ear effusion.

Data are shown as the median (P25, P75).
*P < 0.05, analyzed with one-way analysis of variance or the Kruskal–Wallis rank-sum test among different groups of middle ear effusion. There is no significant difference if the superscript letters by median values are identical among the different groups; if the superscript letters are not the same, the difference is significant.
S1, S2, and S3 indicate the corresponding times of NREM phase 1, NREM phase 2, and NREM phase 3.
NREM, non-rapid eye movement; REM, rapid eye movement.
Correlation analysis between tympanic cavity pressure and ventilation indices and blood oxygen indices during sleep in children with OME
The correlation analysis between acoustic immittance and PSG results showed that there was a moderate negative correlation between tympanic cavity pressure and nocturnal LSaO2 in the experimental group (rs = −0.453, P = 0.023), while there was a weak positive correlation in the control group (rs = 0.187, P = 0.014). In addition, the tympanic volume in the experimental group was positively correlated with the total ODI (rs = 0.385, P = 0.036) and ODI in NREM sleep (rs = 0.367, P = 0.046), but there was no significant correlation in the control group. Interestingly, the tympanic pressure gradient was positively correlated with the mean heart rate in NREM sleep and the S2 average heart rate in the experimental group (rs = 0.461, P = 0.020; rs = 0.490, P = 0.013, respectively) and in the control group (rs = 0.226, P = 0.003; rs = 0.225, P = 0.003, respectively), but the association was strongest in the experimental group.
Discussion
The quality of sleep and cognitive behavior of children with OME are often greatly impaired because of the continuous hypoxic state. Adenoid hypertrophy is a common cause of OME, and the incidence of middle ear effusion increases with an increase of adenoid volume. 13 Adenoid hypertrophy can cause eustachian tube dysfunction and lead to the formation of negative pressure in the middle ear cavity, thus inducing the release of hypoxia-inducible factor-1α, vascular endothelial growth factor(VEGF), and other cytokines. This release results in middle ear effusion due to vascular proliferation and increased vascular permeability through the hypoxia-inducible factor-VEGF pathway, which was determined in an OME animal model using trichloroacetic acid to cauterize the pharyngeal orifice of the eustachian tube.14–16 In addition, transforming growth factor-β may promote the progression of chronic OME by upregulating the expression of its downstream factors (e.g., VEGF, tumor necrosis factor-α, interleukin-1β, and other hypoxia-related factors) in middle ear epithelial cells as shown by an established transforming growth-interacting factor gene knockout OME mouse model. 17 These findings further indicate the important role of middle ear hypoxia in the occurrence of OME. Moreover, adenoid hypertrophy blocks the upper airway and results in apnea and decreased blood oxygen saturation during sleep. Long-term repetition of this process easily causes hypoxemia and abnormal metabolism, indirectly affecting the supply of terminal branches of the cochlea and other organs sensitive to hypoxia. 18
In this study, we found that nocturnal LSaO2 in the OME group was significantly lower than that in the control group, while the total average blood oxygen saturation was similar in the two groups. Shen 19 et al. found that the minimum oxygen saturation of arterial blood (Min SaO2, equivalent to the nocturnal LSaO2) was reduced in various degrees of OSA compared with non-OSA (72.24%–76.48% vs. 82.09%). They also found that the mean blood oxygen saturation (equivalent to total average blood oxygen saturation in our study) was much lower in the severe OSA group than in the control group, which is partly similar to our results. An LSaO2 < 92% was used as one of the diagnostic criterion for pediatric OSA-hypopnea syndrome in our study. Our finding that LSaO2 was lower in the OME group than in the control group suggested that children with OME in this study had a strong possibility of being diagnosed with OSA. 12 Moreover, the correlation between negative pressure in the tympanic cavity and nocturnal LSaO2 in the experimental group was stronger than that in the control group. This finding indicates that children with OME have more severe hypoventilation, systemic hypoxia, and middle ear hypoxia during sleep, which also suggests that hypoxia during sleep plays an important role in the occurrence of OME. Ahmed et al. 20 found that the AHI in REM sleep was moderately, negatively correlated with middle ear pressure in children with OSA (r = −0.265), but this was not found in our study (rs = 0.161). This discrepancy between studies may be due to the fact that our patients had adenotonsillar hypertrophy-related OME rather than OSA.
Furthermore, several indices of PSG related to ventilation (AHI, RDI, AI, OAI, and OAHI) in children with OME in the experimental group were significantly higher than those in the control group in this study. These factors are associated with adenoid hypertrophy, which is a common etiology of OME and OSA. 10 Adenoid hypertrophy can lead to narrow pharyngeal cavity structure in children, and the supporting effect of the upper respiratory tract in children is weak, which easily results in hypopnea and even OSA.21,22 Eustachian tube dysfunction and primary adenoid infection caused by adenoid hypertrophy can also lead to OME. 23 Therefore, the significant differences found in obstructive-related indices in children with OME compared with the control group are not surprising.
Ahmed et al. 20 found that, in children, an increasing severity of OSA is associated with a negative middle ear pressure, which suggests that negative pressure associated with OSA is transmitted to the middle ear. However, the differences between REM sleep and non-REM sleep in children with OME are unclear. Interestingly, in our study, the proportion of the NREM stage in total sleep time, the AHI in NREM sleep, the ODI in NREM sleep, oxygen desaturation events in NREM sleep, the average heart rate in NREM sleep (including S1–S3 average heart rate), and T90 in NREM sleep in the experimental group were significantly higher than those in the control group. However, there was no similar trend in these indices in REM sleep. This finding suggests that sleep disorders and hypoxia in NREM sleep of children with OME are more serious than those in REM sleep. This possibility is consistent with the results of Joosten et al.’s study who found that patients with NREM-based OSA had worse ventilatory function, higher loop gain, and much higher susceptibility to sleep breathing events in NREM sleep than in REM sleep. 24 In addition, we also found that T90 in NREM sleep of children with OME was positively correlated with negative pressure in the tympanic cavity, but the corresponding indices in REM sleep were not correlated. This finding suggests that hypoxia in NREM sleep, rather than in REM sleep, is correlated with hypoxia in the tympanic cavity. Therefore, hypoxia during NREM sleep may play an important role in the formation of middle ear effusion in children with OME.
In this study, the incidence of bilateral OME was higher than that of unilateral OME in children with OME and adenotonsillar hypertrophy, but there was no significant difference in PSG monitoring indices between these groups. These findings are similar to those reported by Nwosu et al. 25 In addition, there was no significant difference in the results of acoustic immittance among OME children with different types of middle ear effusion, but the ODI in NREM sleep and the S2 maximum heart rate in the serous effusion group were significantly higher than those in the dry ear group. These findings suggests that hypoxia in NREM sleep is related to the formation of middle ear effusion in children with OME. Bhutta et al. 26 conducted a genome-wide transcriptional analysis of leukocytes in middle ear effusion of children with OME. They found that the genes related to hypoxia and inflammatory pathways, including VEGF ligands (VEGF-A and VEGF-B), VEGF receptors ( KDR and Flt1), and adaptor proteins (neuropilin 1, neuropilin 2, and hypoxia-inducible factor-1α) were mainly upregulated in serous and mucinous effusions. Furthermore, surgery can also reduce hypoxia and inflammation of the middle ear cavity in the OME mouse model. 27 However, no studies have determined the relationships of different middle ear effusions and hypoxia-related genes.
There are some limitations to our study. First, the number of children with OME in the experimental group was relatively small, which resulted in low statistical power. Furthermore, this was a descriptive study, which only suggested that hypoxia in NREM sleep affects the severity of OME, but the exact causal relationship is still unclear. Therefore, prospective cohort studies need to be designed to confirm the effect of hypoxia on OME during NREM sleep. Finally, the determination of hypoxia in NREM sleep only depended on PSG monitoring. Therefore, more objective indicators, such as blood gas analysis, may be required to support our data.
Research Data
sj-pdf-1-imr-10.1177_03000605221133659 - Research Data for Hypoxia in non-rapid eye movement sleep in children with otitis media with effusion
Research Data, sj-pdf-1-imr-10.1177_03000605221133659 for Hypoxia in non-rapid eye movement sleep in children with otitis media with effusion by Qing-Qing Zhang, Rui-Xin Guo, Meng Xie, Yin Qiang, Yao Shi, Xiao-Hong Liu, Long Cheng, Hai-Qin Liu and Hua-Nan Luo in Journal of International Medical Research
Footnotes
Author contributions
Qing-Qing Zhang and Rui-Xin Guo designed the study. Meng Xie, Yin Qiang, and Yao Shi conducted the study, and collected and analyzed the data. Xiao-Hong Liu and Long Cheng drafted the manuscript. Hai-Qin Liu provided expert consultation and suggestions. Hua-nan Luo conceived the study, participated in its design and coordination, and helped to review the manuscript. All authors reviewed the final version of the manuscript.
Data availability statement
The data of this study are available from the corresponding author upon reasonable request.
Declaration of conflicting interest
The authors declare that there is no conflict of interest.
Funding
The authors disclosed receipt of the following financial support for the research, authorship, and/or publication of this article: This work was supported by the National Natural Science Foundation of China (82171129), the Special Research Fund for Talents Training in the Second Affiliated Hospital of Xi’an Jiaotong University (RC [GG] 201707), and the Natural Science Foundation Group-style Aided Tibet Medical Project of Tibet Autonomous Region (XZ2019ZR-ZY72 [Z]).
References
Supplementary Material
Please find the following supplemental material available below.
For Open Access articles published under a Creative Commons License, all supplemental material carries the same license as the article it is associated with.
For non-Open Access articles published, all supplemental material carries a non-exclusive license, and permission requests for re-use of supplemental material or any part of supplemental material shall be sent directly to the copyright owner as specified in the copyright notice associated with the article.