
Abstract
Objective
The protein encoded by mitogen-inducible gene 6 (MIG6) plays an essential role in the regulation of cholesterol homeostasis and bile acid synthesis in mice. However, the physiological functions of MIG6 remain poorly understood in humans. Therefore, we aimed to evaluate the relationship between the serum MIG6 concentration and low-density lipoprotein (LDL)-cholesterol in patients undergoing cholesterol-lowering treatment.
Methods
We performed a non-randomized, prospective controlled trial. In total, 63 patients with type 2 diabetes and hypercholesterolemia were treated using either rosuvastatin monotherapy or rosuvastatin/ezetimibe combination therapy for 12 weeks. We then compared their serum lipid and MIG6 concentrations before and after treatment.
Results
The serum LDL-cholesterol concentration of the participants significantly decreased and the concentration of MIG6 significantly increased during treatment. In addition, higher pre-treatment serum concentrations of MIG6 were associated with larger reductions in LDL-cholesterol, regardless of the therapeutic agent used.
Conclusions
Serum MIG6 concentration significantly increases alongside the reduction in LDL-cholesterol achieved using cholesterol-lowering therapies in patients with diabetes and hypercholesterolemia. This is the first study to provide evidence that MIG6 may be involved in human cholesterol metabolism.
Keywords
Introduction
The 50-kDa cytoplasmic protein encoded by mitogen-inducible gene 6 (MIG6; ERBB receptor feedback inhibitor 1, receptor-associated late transducer, or gene 33) is a negative regulator of epidermal growth factor receptor (EGFR). The gene is located on chromosome 1p36.231–4 and protein expression is induced by various mitogens and hormones.5–8 MIG6 contains several essential protein-protein interaction domains, a Cdc42- and Rac-interactive binding domain, an Src homology 3-binding domain, a 14-3-3-binding domain, and an EGFR-binding domain.9,10 MIG6 is expressed in the liver, uterus, lung, kidney, heart, and other tissues.11,12 Previously, we generated a Mig6 conditional hepatic knockout mouse model using the Albumin-Cre system (AlbCre/+ Mig6f/f; Mig6d/d) 13 that exhibited hepatomegaly and fatty liver, caused by a dysregulation of cholesterol homeostasis and bile acid synthesis.
Although the physiologic significance of MIG6 in human serum remains poorly understood, we hypothesized that it is involved in cholesterol metabolism in humans, as in mice. Therefore, we first aimed to evaluate the effects of statin-based anti-hypercholesterolemia therapy on the serum MIG6 concentrations of patients with type 2 diabetes mellitus (DM), and second, we aimed to characterize the relationships of serum MIG6 concentration with the reduction in LDL-cholesterol and the type of hypercholesterolemia therapy used in the patients.
Patients and Methods
Participants
We performed a non-randomized, prospective controlled trial of patients recruited at the Outpatient clinic of the Division of Endocrinology and Metabolism of Chungnam National University Hospital (Daejeon, South Korea) between May 2019 and December 2020. The inclusion criteria were as follows: age >18 years, presence of type 2 diabetes, serum LDL-cholesterol concentration ≥2.59 mmol/L, absence of alcohol or drug abuse, absence of any clinical sign of infection or inflammation, and absence of pregnancy. The participants were treated with either rosuvastatin monotherapy (5 mg/day, n = 32) or rosuvastatin/ezetimibe combination therapy (5 mg/10 mg daily, n = 31) for 12 weeks to lower their serum LDL-cholesterol concentrations below 2.59 mmol/L, according to the guidelines in use in Korea. 14 The participants were allocated to one of the two treatment regimens alternately in the order in which they agreed to participate in the study. We then measured their serum lipid and MIG6 concentrations before and after 12 weeks of treatment.
The experimental protocol conformed to the World Medical Association Declaration of Helsinki and the Institutional Review Board of Chungnam National University Hospital (Daejeon, South Korea) approved the study protocol on 8 November 2018 (number CNUH 2018-10-030-001). Written informed consent was obtained from all the participants. The study is registered in CRIS (Clinical Research Information Service, https://cris.nih.go.kr) with the registration number KCT0003477. The reporting of the study conforms to the CONSORT statement. 15
Measurements of biochemical parameters
Blood samples were collected into EDTA tubes in the morning after an overnight fast of >8 hours, then the serum concentrations of high-density lipoprotein-cholesterol, LDL-cholesterol, total cholesterol, and triglycerides for each of the participants were measured using a blood chemistry analyzer (Hitachi 747; Hitachi, Tokyo, Japan). Their serum insulin concentrations were quantified using an immunoradiometric assay kit (DIAsource INS-IRMA Kit; DIAsource, Louvain-la-Neuve, Belgium) and their glycosylated hemoglobin (HbA1c) was measured using high-performance liquid chromatography (Bio-Rad Laboratories, Hercules, CA, USA). Homeostasis model assessment of insulin resistance (HOMA-IR) was calculated as fasting serum insulin (μU/mL) ×fasting plasma glucose (mmol/L)/22.5. DM was defined using the American Diabetes Association criteria. 16
Measurement of serum MIG6 concentration
Serum MIG6 concentration was measured using a commercially available quantitative sandwich ELISA kit (No. EH14434; Wuhan Fine Biotech Co., Wuhan, China).
Statistical analyses
Continuous variables are expressed as means ± standard deviations, and between-group differences were assessed using Student’s t-test or the Mann–Whitney U test. Categorical variables are expressed as counts and percentages, and between-group differences were assessed using the chi-square test. Statistical analyses were conducted using SPSS Statistics, version 25.0 (IBM Corp., Armonk, NY, USA). Statistical significance was accepted in two-tailed testing when P < 0.05.
Results
Baseline characteristics of the study participants
Seventy patients were initially recruited, but seven were excluded because of screening failure (n = 3), non-compliance (n = 3), or refusal to participate (n = 1 patient). Therefore, 63 patients were included in the study. The baseline clinical characteristics of the rosuvastatin monotherapy group (R group) and the rosuvastatin/ezetimibe combination group (RE group) were compared (Table 1). The mean age of the participants in the R group was 58.31 ± 12.86 years (range, 31–83 years) and that of the participants in the RE group was 56.77 ± 10.87 years (range, 35–78 years). There were 13 men (40.6%) in the R group and 18 men (58.0%) in the RE group. The mean durations of diabetes were 5.17 ± 1.5 years in the R group and 3.08 ± 0.9 years in the RE group (P = 0.233). There were no differences between the two groups in several of the biochemical parameters, including HbA1c and the fasting glucose and insulin concentrations, and therefore in HOMA-IR.
Baseline characteristics of the participants.

Data are mean ± standard deviation or number (%) and were analyzed using Student’s t-test or the Mann–Whitney U-test. R group, rosuvastatin monotherapy group; RE group, rosuvastatin/ezetimibe combination therapy group; DM, diabetes mellitus; HbA1c, glycosylated hemoglobin; HOMA-IR, homeostasis model assessment of insulin resistance; LDL, low-density lipoprotein; HDL, high-density lipoprotein; AST, aspartate aminotransferase activity; ALT, alanine aminotransferase activity.
Changes in the LDL-cholesterol and MIG6 concentrations during treatment with rosuvastatin or rosuvastatin/ezetimibe
All the participants completed the planned 12-week period of medication, then their LDL-cholesterol concentrations were measured. This confirmed a statistically significant decrease (from 3.517 ± 0.649 mmol/L to 2.059 ± 0.732 mmol/L, P < 0.001). In addition, the serum MIG6 concentration was measured, and found to show a significant increase during treatment (from 4.26 ± 2.23 ng/mL to 11.96 ± 6.04 ng/mL, P < 0.001). Thus, as the LDL-cholesterol concentration decreased during treatment, the MIG6 concentration significantly increased (Figure 1). The changes in the LDL-cholesterol and MIG6 concentrations were analyzed according to the treatment regimen, which showed that the LDL-cholesterol concentration was more substantially reduced in the RE group than in the R group (from 3.594 ± 0.666 mmol/L to 2.389 ± 0.807 mmol/L, P < 0.001 in the R group; from 3.505 ± 0.480 mmol/L to 1.830 ± 0.517 mmol/L, P < 0.001 in the RE group; P = 0.003 for the comparison of the R and RE groups). The MIG6 concentration significantly increased during the 12 weeks of treatment in both groups (from 3.77 ± 1.40 ng/mL to 12.09 ± 6.21 ng/mL, P < 0.001 in the R group; from 4.77 ± 2.78 ng/mL to 11.82 ± 5.96 ng/mL, P < 0.001 in the RE group), but did not significantly differ between the two groups after treatment (Figure 2).

Changes in LDL-cholesterol and MIG6 concentrations during the statin-based treatment of hypercholesterolemia. (a) LDL-cholesterol concentration before and after 12 weeks of treatment. (b) MIG6 concentration before and after 12 weeks of treatment. Data are mean ± SEM and were analyzed using Student’s t-test. *Before vs. After, P < 0.05. LDL, low-density lipoprotein; MIG6, protein encoded by mitogen-inducible gene 6.

Changes in LDL-cholesterol and MIG6 concentrations during treatment with rosuvastatin or rosuvastatin/ezetimibe. (a) LDL-cholesterol concentration before and after 12 weeks of treatment in the two groups. (b) MIG6 concentrations before and after 12 weeks of treatment in the two groups. R group, rosuvastatin monotherapy group; RE group, rosuvastatin/ezetimibe combination group; LDL, low-density lipoprotein; MIG6, protein encoded by mitogen-inducible gene 6. Data are mean ± SEM and were analyzed using Student’s t-test or the Mann–Whitney U test. * Before vs. After, P < 0.05; **R group vs. RE group, P < 0.05.
Change in MIG6, analyzed according to the reduction in LDL-cholesterol
Next, the participants were allocated to two groups according to the reduction in LDL-cholesterol concentration achieved (LDL-C reduction ≥50% group, n = 21 vs. LDL-C reduction <50% group, n = 42). In both groups, the MIG6 concentration significantly increased during treatment (from 5.03 ± 3.15 ng/mL to 11.10 ± 5.68 ng/mL, P < 0.001 in the LDL-C reduction ≥50% group; from 3.87 ± 1.49 ng/mL to 12.38 ± 6.24 ng/mL, P < 0.001 in the LDL-C reduction <50% group). Because there was no difference in the MIG6 concentration after treatment (P = 0.481), MIG6 could not be used to distinguish individuals with a superior response to cholesterol-lowering treatment (Figure 3).
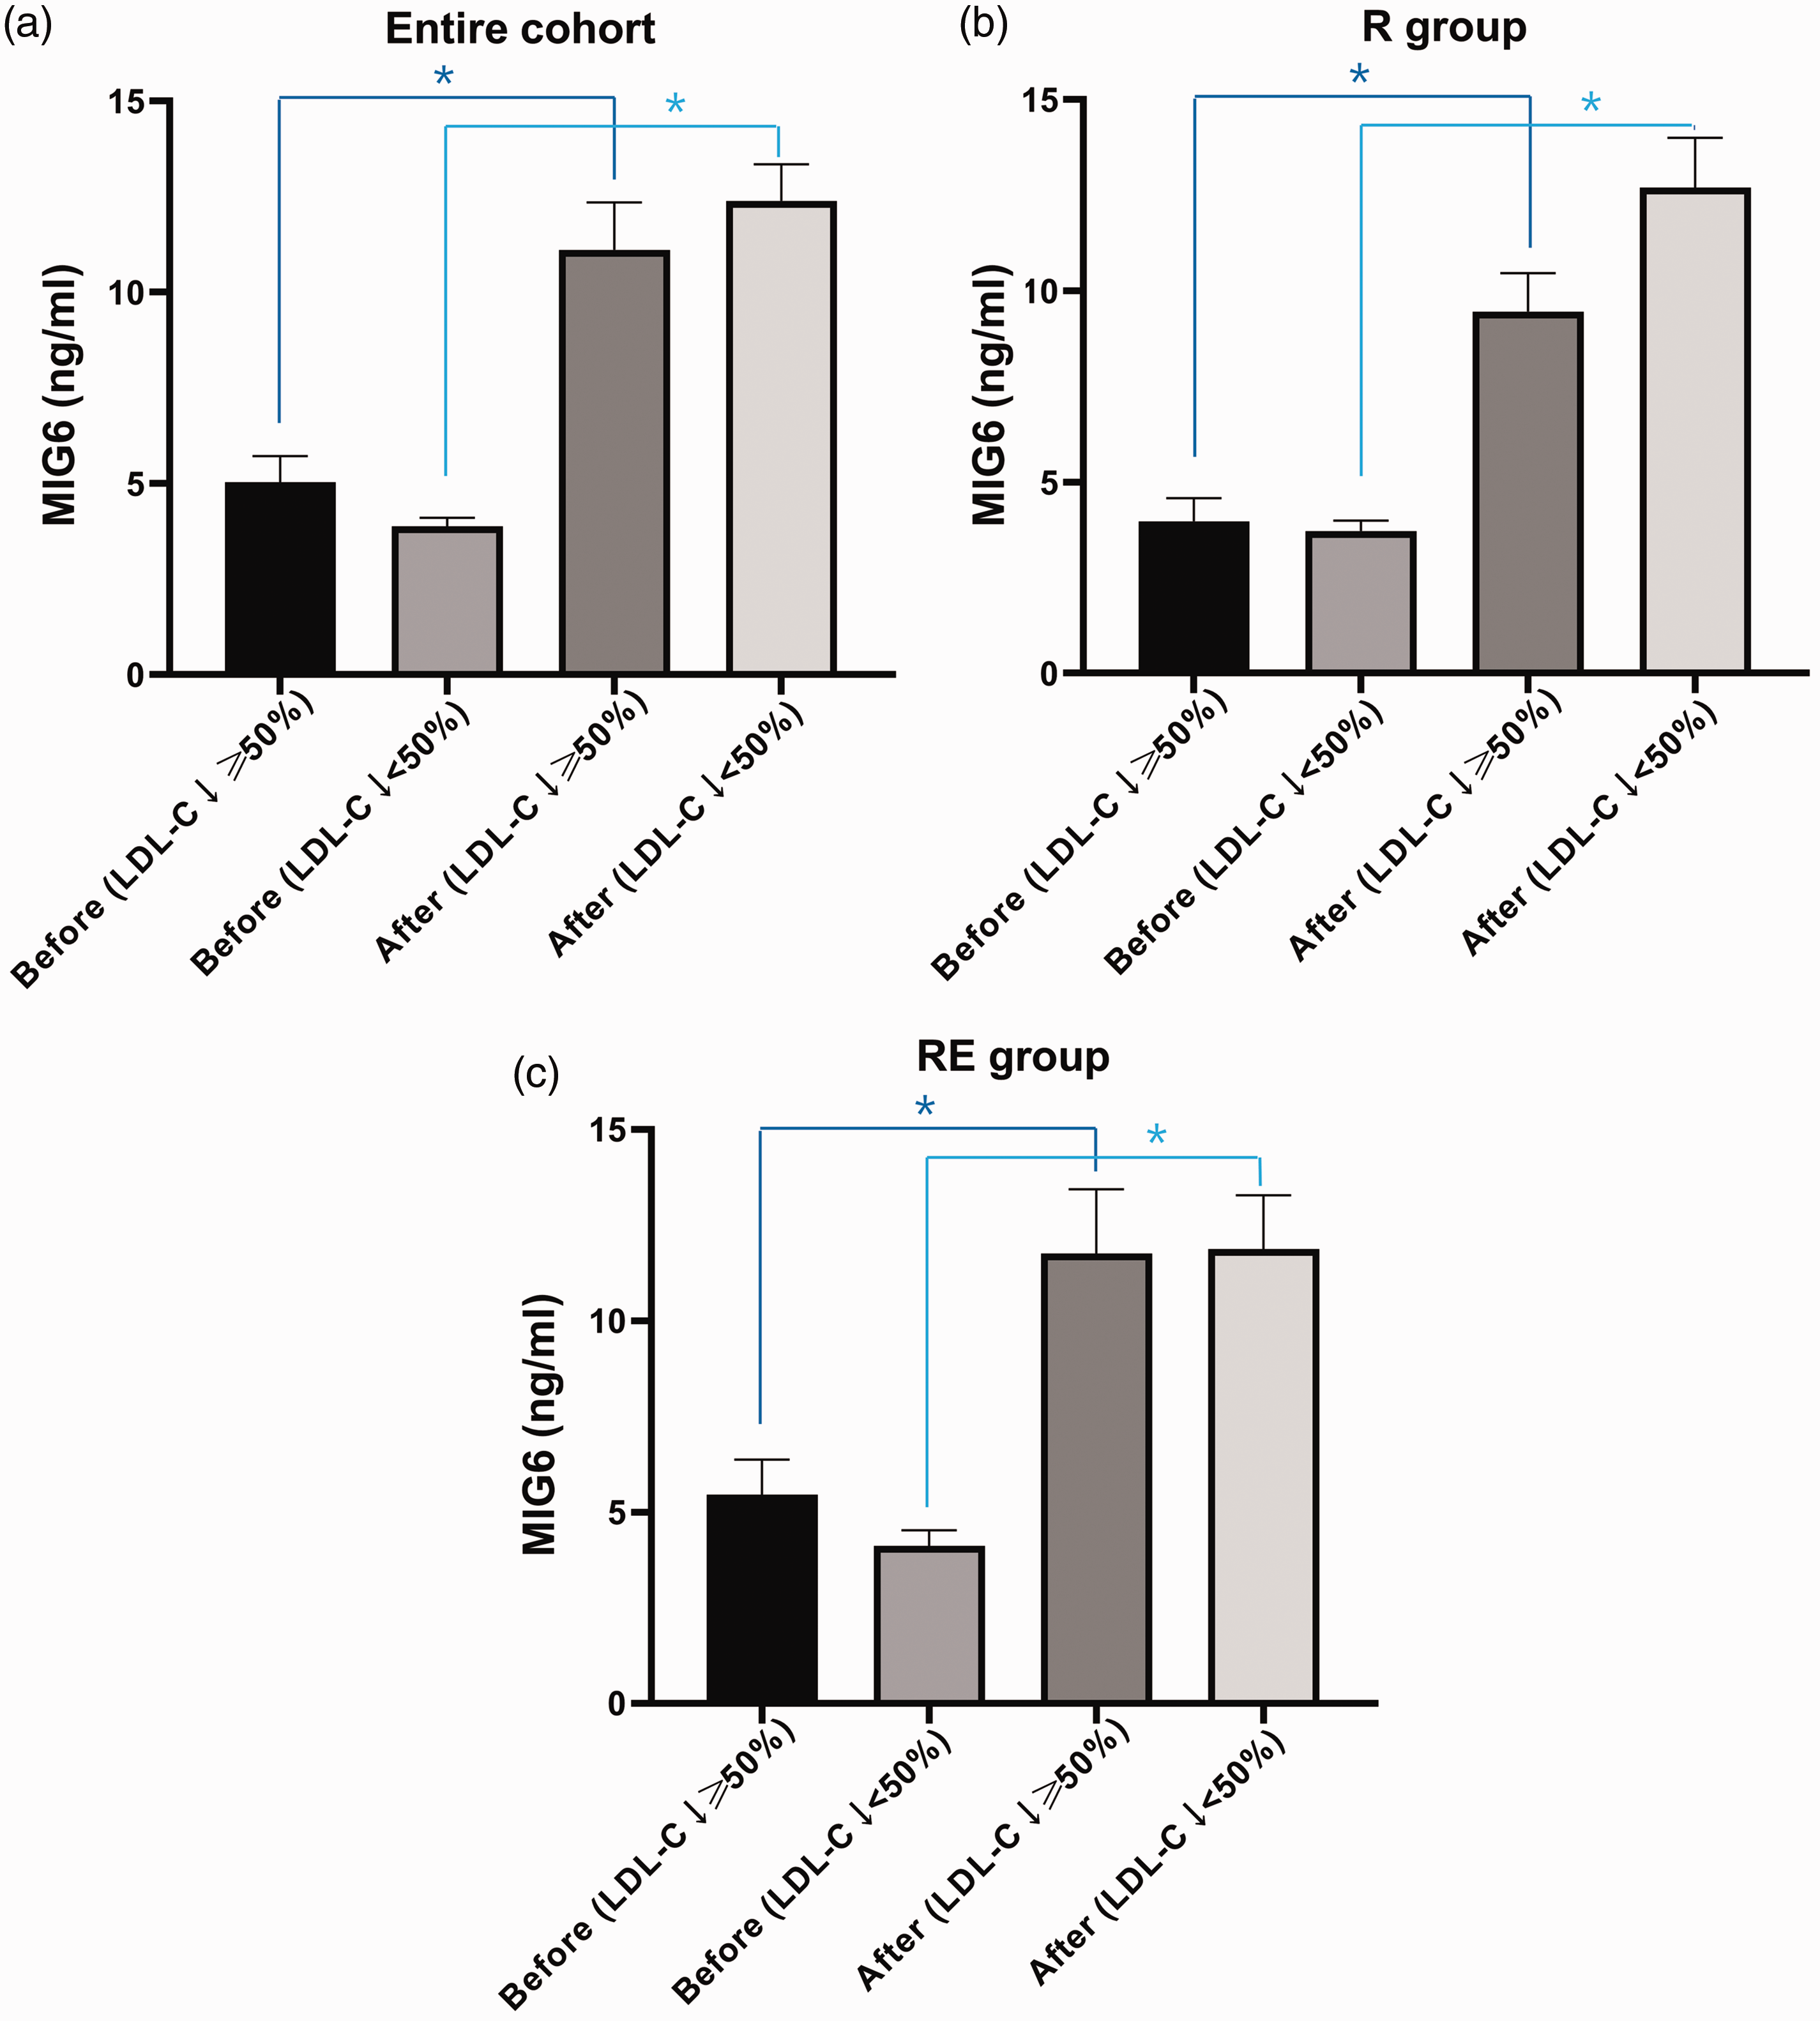
MIG6 concentration before and after treatment in participants categorized according to the size of the reduction in LDL-cholesterol. (a) Entire cohort, (b) R group, and (c) RE group. R group, rosuvastatin monotherapy group; RE group, rosuvastatin/ezetimibe combination group; LDL-C ↓ ≥50%, LDL-C reduction ≥50% group; LDL-C ↓ <50%, LDL-C reduction <50% group. LDL, low-density lipoprotein cholesterol; MIG6, protein encoded by mitogen-inducible gene 6. Data are mean ± SEM and were analyzed using Student’s t-test or the Mann–Whitney U test. * Before vs. After, P < 0.05.
Participants in the R group were next allocated to two groups according to their reduction in LDL-cholesterol (LDL-C reduction ≥50% R group, n = 6 vs. LDL-C reduction <50% R group, n = 26). In both groups, the MIG6 concentration significantly increased during treatment (from 3.97 ± 1.49 ng/mL to 9.45 ± 2.47 ng/mL, P = 0.009 in the LDL-C reduction ≥50% R group; from 3.72 ± 1.40 ng/mL to 12.69 ± 6.67 ng/mL, P < 0.001 in the LDL-C reduction <50% R group), and the MIG6 concentration after treatment did not significantly differ (P = 0.331). The participants in the RE group were also allocated to two groups according to the reduction in LDL-cholesterol (LDL-C reduction ≥50% RE group, n = 15 vs. LDL-C reduction <50% RE group, n = 16), and the MIG6 concentrations significantly increased during treatment in both (from 5.45 ± 3.56 ng/mL to 11.76 ± 6.51 ng/mL, P = 0.003 in the LDL-C reduction ≥50% RE group; from 4.12 ± 1.64 ng/mL to 11.88 ± 5.62 ng/mL, P < 0.001 in the LDL-C reduction <50% RE group), but did not significantly differ between the groups following treatment (P = 0.861).
Reduction in LDL-cholesterol, analyzed according to the basal MIG6 concentration
The participants were next allocated to two groups according to their basal serum MIG6 concentration, irrespective of treatment: an upper half group (high basal MIG6 concentration, n = 31) and a lower half group (low basal MIG6 group, n = 32). Table 2 lists the baseline characteristics of the participants in each group. The LDL-cholesterol concentrations of both groups significantly decreased during treatment (from 3.568 ± 0.744 mmol/L to 1.856 ± 0.701 mmol/L, P < 0.001 in the high basal MIG6 group; from 3.533 ± 0.487 mmol/L to 2.344 ± 0.494 mmol/L, P < 0.001 in the low basal MIG6 group). Notably, the LDL-cholesterol concentration was substantially lower after treatment in the high basal MIG6 group than in the low basal MIG6 group, confirming a superior treatment response (P = 0.012; Figure 4).
Baseline characteristics of the participants in the High and Low Basal MIG6 Groups.

Data are mean ± SD and were analyzed using Student’s t-test or the Mann–Whitney U-test. DM, diabetes mellitus; HbA1c, glycosylated hemoglobin; HOMA-IR, homeostatic model assessment of insulin resistance; LDL, low-density lipoprotein; HDL, high-density lipoprotein; AST, aspartate aminotransferase activity; ALT, alanine aminotransferase activity; MIG6, protein encoded by mitogen-inducible gene 6.

Effects of cholesterol-lowering treatment in participants categorized according to their pre-treatment MIG6 concentrations. (a) Entire cohort, (b) R group, (c) RE group. R group, rosuvastatin monotherapy group; RE group, rosuvastatin/ezetimibe combination group; basal MIG6 Hi, high basal MIG6 group; basal MIG6 Lo, low basal MIG6 group. LDL, low-density lipoprotein; MIG6, protein encoded by mitogen-inducible gene 6. Data are mean ± SEM and were analyzed using Student’s t-test or the Mann–Whitney U test. *Before vs. After, P < 0.05; **basal MIG6 Hi vs. basal MIG6 Lo, P < 0.05.
Next, participants in the R group were allocated to a high basal MIG6 R group (n = 16) or a low basal MIG6 R group (n = 16) in a similar fashion. The LDL-cholesterol concentration of each group was significantly reduced by treatment (from 3.645 ± 0.986 mmol/L to 2.080 ± 0.878 mmol/L, P < 0.001 in the high basal MIG6 R group; from 3.543 ± 0.611 mmol/L to 2.657 ± 0.451 mmol/L, P = 0.003 in the low basal MIG6 R group), but the concentrations after treatment did not significantly differ between the groups (P = 0.088). Finally, the participants in the RE group were allocated to a high basal MIG6 RE group (n = 16) or a low basal MIG6 RE group (n = 15) in a similar fashion. The LDL-cholesterol concentrations of both groups were significantly reduced by treatment (from 3.408 ± 0.476 mmol/L to 1.736 ± 0.514 mmol/L, P < 0.001 in the high basal MIG6 RE group; from 3.609 ± 0.551 mmol/L to 1.931 ± 0.474 mmol/L, P < 0.001 in the low basal MIG6 low RE group), but as for the R group, the concentrations after treatment did not significantly differ between the groups (P = 0.384).
Discussion
In the present study, we have evaluated the relationship between the serum MIG6 and LDL-cholesterol concentrations during cholesterol-lowering treatment in patients with DM. Rosuvastatin monotherapy or rosuvastatin/ezetimibe combination therapy for 12 weeks was associated with significant increases in MIG6 concentration, alongside reductions in LDL-cholesterol. In addition, a high pre-treatment serum MIG6 concentration was associated with a larger reduction in LDL-cholesterol concentration, irrespective of the therapeutic regimen used.
MIG6 is a non-kinase scaffolding adaptor protein that is found in the cytosol and acts as a negative feedback inhibitor of EGFR signaling through a direct interaction with this receptor.9,12 It has roles in the stress response, tissue homeostasis, and cancer development, which implies that it may be critical for the regulation of many cellular responses. However, its biologic and pathophysiologic roles in human diseases require further investigation. Previously, we showed that the hepatic deletion of Mig6 in mice induces fatty liver and disrupts cholesterol homeostasis by upregulating the EGFR signaling pathway during the consumption of a high-fat diet. 16 Therefore, MIG6 may play a role in mediating the hepatic metabolic defects, such as insulin resistance and cholesterol dysregulation, that are associated with type 2 DM.
We hypothesized that LDL-cholesterol-lowering therapy in patients with type 2 DM and hypercholesterolemia would alter their circulating MIG6 concentrations if this molecule is involved in insulin resistance and hypercholesterolemia. Therefore, we also aimed to determine whether the size of the reduction in LDL-cholesterol or the treatment regimen used would affect the change in MIG6 concentration. First, we compared the changes in LDL-cholesterol concentration during 12 weeks of treatment in the R and RE groups, and found reductions in both groups, consistent with the results of previous studies. 18 The reduction was larger in the RE group, because this group administered ezetimibe in addition to the same dose of rosuvastatin administered to the R group. In a study conducted by Lee and others, 47.1% of patients who achieved a reduction in LDL-cholesterol ≥50% during 8 weeks of administration of rosuvastatin 5 mg/day and 76.5% achieved similar reductions when administering rosuvastatin 5 mg + ezetimibe 10 mg/day. 19 The disparity in these and the present findings may relate to differences in the duration of treatment and characteristics of the groups before treatment; for example, the higher HOMA-IR in the previous study.
We also assessed the change in MIG6 concentration during cholesterol-lowering treatment in the entire cohort, and found that this significantly increased. However, although the LDL-cholesterol-lowering effect of RE was superior, the post-treatment MIG6 concentrations did not differ between the groups. In addition to inhibiting the absorption of cholesterol, and thereby lowering the circulating LDL-C concentration, ezetimibe has an additional positive effect on metabolic disorders. Many previous studies have shown that ezetimibe therapy significantly reduces the concentration of high-sensitivity C-reactive protein, a marker of atherosclerotic diseases, and adiponectin, an marker of obesity that regulates lipid and glucose metabolism.20,21 Therefore, the authors hypothesized that the pleiotropic effects of ezetimibe would include an influence on MIG6 concentration, but they did not identify such an effect. Although the drug treatments caused similar reductions in LDL-cholesterol, we conducted additional analyses to determine whether the serum MIG6 concentration would reflect the size of the reduction. A good treatment response was defined as a reduction in LDL-cholesterol of >50% and an inadequate response as a reduction of <50%. However, we found that the MIG6 concentration after treatment did not differ between the groups, even after stratification of the response in the R and RE groups according to the size of the reduction in LDL-C. Thus, in patients who achieve a substantial reduction in LDL-cholesterol, there is no further increase in serum MIG6 concentration.
In metabolic diseases such as diabetes and hypercholesterolemia, the EGFR pathways are excessively activated; therefore, the inhibition of these pathways may represent a potential treatment.13,22 In a previous study, we found that the serum cholesterol concentration decreased during treatment with an EGFR tyrosine kinase inhibitor in patients with lung cancer who had activating EGFR mutations. 23 Therefore, an increase in MIG6, an antagonist of EGFR, would be expected to be associated with the amelioration of metabolic abnormalities. In the present study, we have confirmed that the serum MIG6 concentration significantly increases during the treatment of hypercholesterolemia using a combination of a statin and ezetimibe. In addition, we have previously shown that excessive activation of EGFR signaling, induced by hepatic MIG6 knockout, causes an increase in serum LDL-cholesterol in mice, eventually creating a condition similar to the hypercholesterolemia of people with diabetes. 16 A high circulating concentration of MIG6 would be expected to suppress EGFR pathway activation; therefore, we hypothesized that if the pre-treatment MIG6 concentration were high, the effect of cholesterol-lowering treatment would be more substantial. To test this hypothesis, the participants were allocated to two groups on the basis of their median pre-treatment MIG6 concentrations. In the high MIG6 group, the pre-treatment MIG6 concentration was high, the LDL-cholesterol concentration was significantly lower after treatment, and there was a superior therapeutic effect. The same finding was made individually in the R and RE groups, but the concentration of LDL-cholesterol after treatment did not differ according to the MIG6 concentration before treatment. Thus, patients with a high pre-treatment MIG6 concentration might expect a more substantial reduction in LDL-cholesterol in response to medication. Although further research is needed, the pre-treatment MIG6 concentration may have potential for use as a marker of a good response to cholesterol-lowering treatment.
The present study had several limitations. First, the administration of rosuvastatin 5 mg or rosuvastatin 5 mg + ezetimibe 10 mg had differing effects on LDL-cholesterol concentration. Therefore, it remains to be determined whether the different changes in MIG6 concentration were related to the differing effects of LDL-cholesterol or constituted an independent effect. To answer this question, the effects of the two regimens should be compared following dose adjustments to ensure similar changes in LDL-cholesterol. Second, we did not compare the effects of multiple statins; therefore, further research involving other statins is needed to perform this comparison. Third, this was not a randomized controlled study. A well-designed, randomized study should be performed to exclude the influence of selection bias and confirm the effects of each drug treatment. Finally, this study was of 63 people recruited at a single institution and lasted 12 weeks. In addition, we did not perform a sample size calculation; therefore, the relatively small sample size may have affected the significance of the findings. Long-term, large-scale, multi-center trials should be conducted to confirm the relationships between cardiovascular outcomes and the changes in the serum concentration of MIG6.
In conclusion, we have shown that the treatment of patients with hypercholesterolemia and concomitant type 2 DM using rosuvastatin and ezetimibe increases the circulating MIG6 concentration. This is the first study to show that MIG6 is associated with cholesterol metabolism in humans, as previously shown in mice.
Supplemental Material
sj-pdf-1-imr-10.1177_03000605221085079 - Supplemental material for Serum MIG6 concentration is increased by cholesterol-lowering treatment in patients with type 2 diabetes mellitus and hypercholesterolemia
Supplemental material, sj-pdf-1-imr-10.1177_03000605221085079 for Serum MIG6 concentration is increased by cholesterol-lowering treatment in patients with type 2 diabetes mellitus and hypercholesterolemia by Jun Choul Lee, Ji Min Kim, Kyong Hye Joung, Seon Mee Kang, Hyun Jin Kim and Bon Jeong Ku in Journal of International Medical Research
Footnotes
Acknowledgement
We would like to express our appreciation to Dr. In Sun Kwon for her assistance with the statistical analyses.
Author Contributions
Conception and design: JCL, JMK, BJK. Provision of study materials or patients: JCL, KHJ, HJK, BJK. Collection and assembly of data: JCL, JMK, SMK, BJK. Data analysis and interpretation: all authors. Manuscript writing: all authors. Final approval of manuscript: all authors.
Declaration of conflicting interests
The authors declare that there is no conflict of interest.
Funding
The authors disclosed receipt of the following financial support for the research, authorship, and publication of this article: This research was supported by the Daejeon and Chungcheong Branch of the Korean Endocrine Society (grant no. 2021).
References
Supplementary Material
Please find the following supplemental material available below.
For Open Access articles published under a Creative Commons License, all supplemental material carries the same license as the article it is associated with.
For non-Open Access articles published, all supplemental material carries a non-exclusive license, and permission requests for re-use of supplemental material or any part of supplemental material shall be sent directly to the copyright owner as specified in the copyright notice associated with the article.