
Abstract
Objective
To evaluate the accuracy of respiratory mechanics using dynamic signal analysis during noninvasive pressure support ventilation (PSV).
Methods
A Respironics V60 ventilator was connected to an active lung simulator to model normal, restrictive, obstructive, and mixed obstructive and restrictive profiles. The PSV was adjusted to maintain tidal volumes (VT) that achieved 5.0, 7.0, and 10.0 mL/kg body weight, and the positive end-expiration pressure (PEEP) was set to 5 cmH2O. Ventilator performance was evaluated by measuring the flow, airway pressure, and volume. The system compliance (Crs) and airway resistance (inspiratory and expiratory resistance, Rinsp and Rexp, respectively) were calculated.
Results
Under active breathing conditions, the Crs was overestimated in the normal and restrictive models, and it decreased with an increasing pressure support (PS) level. The Rinsp calculated error was approximately 10% at 10.0 mL/kg of VT, and similar results were obtained for the calculated Rexp at 7.0 mL/kg of VT.
Conclusion
Using dynamic signal analysis, appropriate tidal volume was beneficial for Rrs, especially for estimating Rexp during assisted ventilation. The Crs measurement was also relatively accurate in obstructive conditions.
Keywords
Background
Mechanical ventilation is a lifesaving intervention that has been widely used in the management of critically ill patients for more than 50 years. 1 Analysis of individual respiratory mechanics is beneficial to guide the ventilator setting under the conditions of pulmonary protective mechanical ventilation. 2 Recently, in the analysis of respiratory mechanics, the focus has changed from static to dynamic conditions. 3 “Static” or “quasi-static” conditions mean that respiratory mechanics are assessed under no airflow, which is typically achieved using an end-inspiratory and an end-expiratory pause. 4 “Dynamic” conditions indicate that measurements are performed under the conditions of no flow interruption during mechanical ventilation. 5 The advantage of dynamic analysis is that respiratory maneuvers such as zero-flow occlusion and interrupting the patient’s spontaneous breathing are not required.
Noninvasive positive-pressure ventilation (NPPV) is applied in patients with mild-to-moderate respiratory failure because relatively stable spontaneous breathing is necessary due to the air leaks that are inevitable when using a face mask. 6 Pressure support ventilation (PSV) is one of the most commonly used modalities in noninvasive ventilation, and is a partial support ventilation mode that requires the patient’s inspiratory effort to trigger ventilation.
The dynamic signal analysis approach has been introduced in recent years, and it has been considerably refined by improvements in static measurement; this addresses the need for an accurate method to estimate lung mechanics.7,8 Pulmonary compliance is assessed when the patient is passive during the inhalation or exhalation phase if patient effort is detected during this phase.9,10 Airway resistance is measured during both the inhalation and exhalation phases. Resistance changes with the level of flow through the tube for which it is being measured; the higher the flow through the resistive path, the higher is the resistance in that path and vice versa. 11 In this situation, the information presented to the user represents the maximum resistance that is experienced by the patient during the breathing phases. For lung compliance, resistance is estimated during both breath phases, but the estimate can be more accurately made when the patient is inactive during the respiration cycle for which the estimate is determined. 12 Because patients are usually relatively passive during the exhalation phase, estimates that are obtained during this phase are considered to be useful.
Despite the wealth of knowledge from the previous publications that are described above, it remains unclear whether respiratory mechanics could be more accurately assessed during PSV using the dynamic analysis approach in different lung disease models. We hypothesized that sampling the respiratory data can improve the precision of estimating the mechanics of the respiratory system. Therefore, we aimed to evaluate the measurement of dynamic mechanics to test this approach during PSV with air leak in different lung models.
Methods
Procedure
An NPPV ventilator (Respironics V60 Bilevel Ventilator; Philips Respironics, Murrysville, PA, USA) was connected to an ASL 5000 breathing simulator (IngMar Medical Ltd., Pittsburgh, PA, USA) by a standard disposable corrugated circuit (length, 1.8 m). All tests were performed using a dry circuit, and all humidifiers and heat and moisture exchangers were removed. All tests were conducted in October 2018. The average altitude of the test area was 3 to 5 m, daytime temperature was 22 to 25°C, and the relative humidity was 80% to 85%. There was no obvious convection indoors. No people or animals were used in this study, so ethics approval was not required.
Lung models
The ASL 5000 breathing simulator that was used in this study features a computerized lung simulator comprising a piston moving in a cylinder. The simulator comprised a single compartment on the basis of a report by Beloncle and colleagues. 13 The respiratory mechanics conditions were adjusted to simulate an adult patient (65–70 kg body weight) who is placed in the semi-recumbent position (incline of 45°). The following four respiratory mechanics conditions were preset: 1) obstructive: same inspiratory and expiratory resistance (Rrs) (inspiratory resistance [Rinsp] = expiratory resistance [Rexp] = 20 cmH2O/L · s−1) and static compliance (Crs) at 50 mL/cmH2O with a breathing rate of 15 breaths/minute; 2) severely restrictive: Rinsp = Rexp = 10 cmH2O/L·s−1 and static Crs at 25 mL/cmH2O with a breathing rate of 30 breaths/minute; 3) mixed obstructive and restrictive: Rinsp = Rexp = 20 cmH2O/L·s−1 and static Crs at 25 mL/cmH2O with a breathing rate of 15 breaths/minute; and 4) normal: Rinsp = Rexp= 5 cm H2O/L·s−1 and static Crs at 50 mL/cmH2O with a breathing rate of 15 breaths/minute. The inspiratory times were 0.8 s and 1.6 s for the severely restrictive and the remaining three conditions, respectively.13–15 The parameters that are described below were based on a previous report. 16 The patient’s inspiratory effort was −5 cmH2O for the normal, obstructive, and mixed obstructive/restrictive conditions, and −10 cmH2O was used for the severely restrictive condition. Pressure reduction that was produced in 300 ms following the initiation of an obstructed inspiratory effort was −3.6 cmH2O. A semi-sinusoidal inspiratory waveform was selected, which each had rise and release times each of 50% and an inspiratory hold time of 0%. The simulator integrates user-controlled leaks using a plateau exhalation valve (PEV). Air leak was controlled between 24 and 26 L/minute with 20 cmH2O peak airway pressure; the inspired oxygen fraction (FIO2) was maintained at 0.21 for various measurements.
The patient–mask interface was simulated using a mannequin head. An oronasal facemask without exhalation ports (BestFit™; Curative Medical Inc., Santa Clara, CA, USA) was fastened firmly to the mannequin head using standard straps. Endotracheal tubes (inner diameter, 22 mm) were placed in the mouth and nostrils of the face mask to direct the gas from the mask to the simulator. A leak flow below 1 to 2 L/minute was obtained at a positive pressure of 20 cmH2O after PEV removal (Fig S1).
Ventilator settings
First, four passive breathing conditions were simulated. A Hamilton C3 ventilator (Hamilton Medical AG, Bonaduz, Switzerland), which was linked to the lung simulator without a facemask and PEV. The ventilator was calibrated and configured in the volume-controlled ventilation (VCV) mode. Then, it was configured in the pressure-controlled ventilation (PCV) mode. Finally, active conditions with a spontaneous effort were simulated, and a Respironics V60 Bilevel Ventilator (Philips) was connected to the lung simulator with a facemask and PEV, and the device was configured in the PSV mode. The pressure control (PC) and pressure support (PS) levels were adjusted for the ventilator to obtain tidal volumes (VT) that achieved 5.0, 7.0, and 10.0 mL/kg body weight outputs, and the positive end-expiration pressure (PEEP) was set at 5.0 cmH2O. A backup respiratory rate of 10 breaths/minute was used, and the maximal duration of the inspiratory phase was 2.0 s. A shorter inspiratory rise time was selected, which avoided overshoot.17,18 Trigger sensitivity and cycling criteria were auto-adjusted (digital Auto-Trak™, Philips Respironics). 16
Data collection
After baseline airway pressure stabilization, air leaks from the PEV were added to the system, with ≥5 minutes allowed for ventilator/simulator synchronization. In case of synchronization failure, we changed the sensitivity and/or inspiratory effort in the system. If the ventilator and simulator could not be synchronized despite the changes, the ventilator was considered to be unfit for assisted ventilation at that level of the leak. Upon stabilization, breaths were recorded at 1-minute intervals. After each setting adjustment, seven measurements were recorded per patient. All breaths were assessed offline using the software provided with the breathing simulator.
In the PCV and PSV mode, peak inspiratory flow (PIF), end-inspiration pressure (EIP), inspiratory time (TI), and expiratory tidal volume (VTE) were measured by the simulator. Peak expiratory flow (PEF) and total PEEP were recorded in the expiration phase. The driving pressure (ΔP) was calculated as EIP − PEEP (Fig S2).
The parameters of respiratory mechanics were assessed as major determinants of the interaction between the patient and ventilator. Crs was calculated as the ratio between VT and driving pressure (ΔP). Equation 1 below represents this relationship:

Inspiratory resistance (Rinsp) was calculated using the following two clinically useful equations:


Statistical analysis
Data are presented as the mean ± standard deviation (
Results
Estimated vs. measured compliance (Crs) in various models at different tidal volume levels
The measurement results of dynamic mechanics at all VT levels under passive and active breathing conditions are summarized in Tables 1 to 4. Crs and Rrs (Rinsp and Rexp) were calculated using Equations 1 to 5, as described above, with PEEP maintained at a constant level at end-expiration. In the passive breathing condition, the calculated Crs value was similar to the preset value at all VT levels except in the obstructive model. In the active breathing condition, the Crs was always overestimated in the normal adult, restrictive models; the difference between the calculated and preset values was significant in the PSV mode at a VT of 5.0 mL/kg (P < 0.001; Tables 1 and 3). An elevated PS level was associated with larger VT, and the measured Crs value greatly decreased with an increase in the PS (P < 0.001; Figure 1).
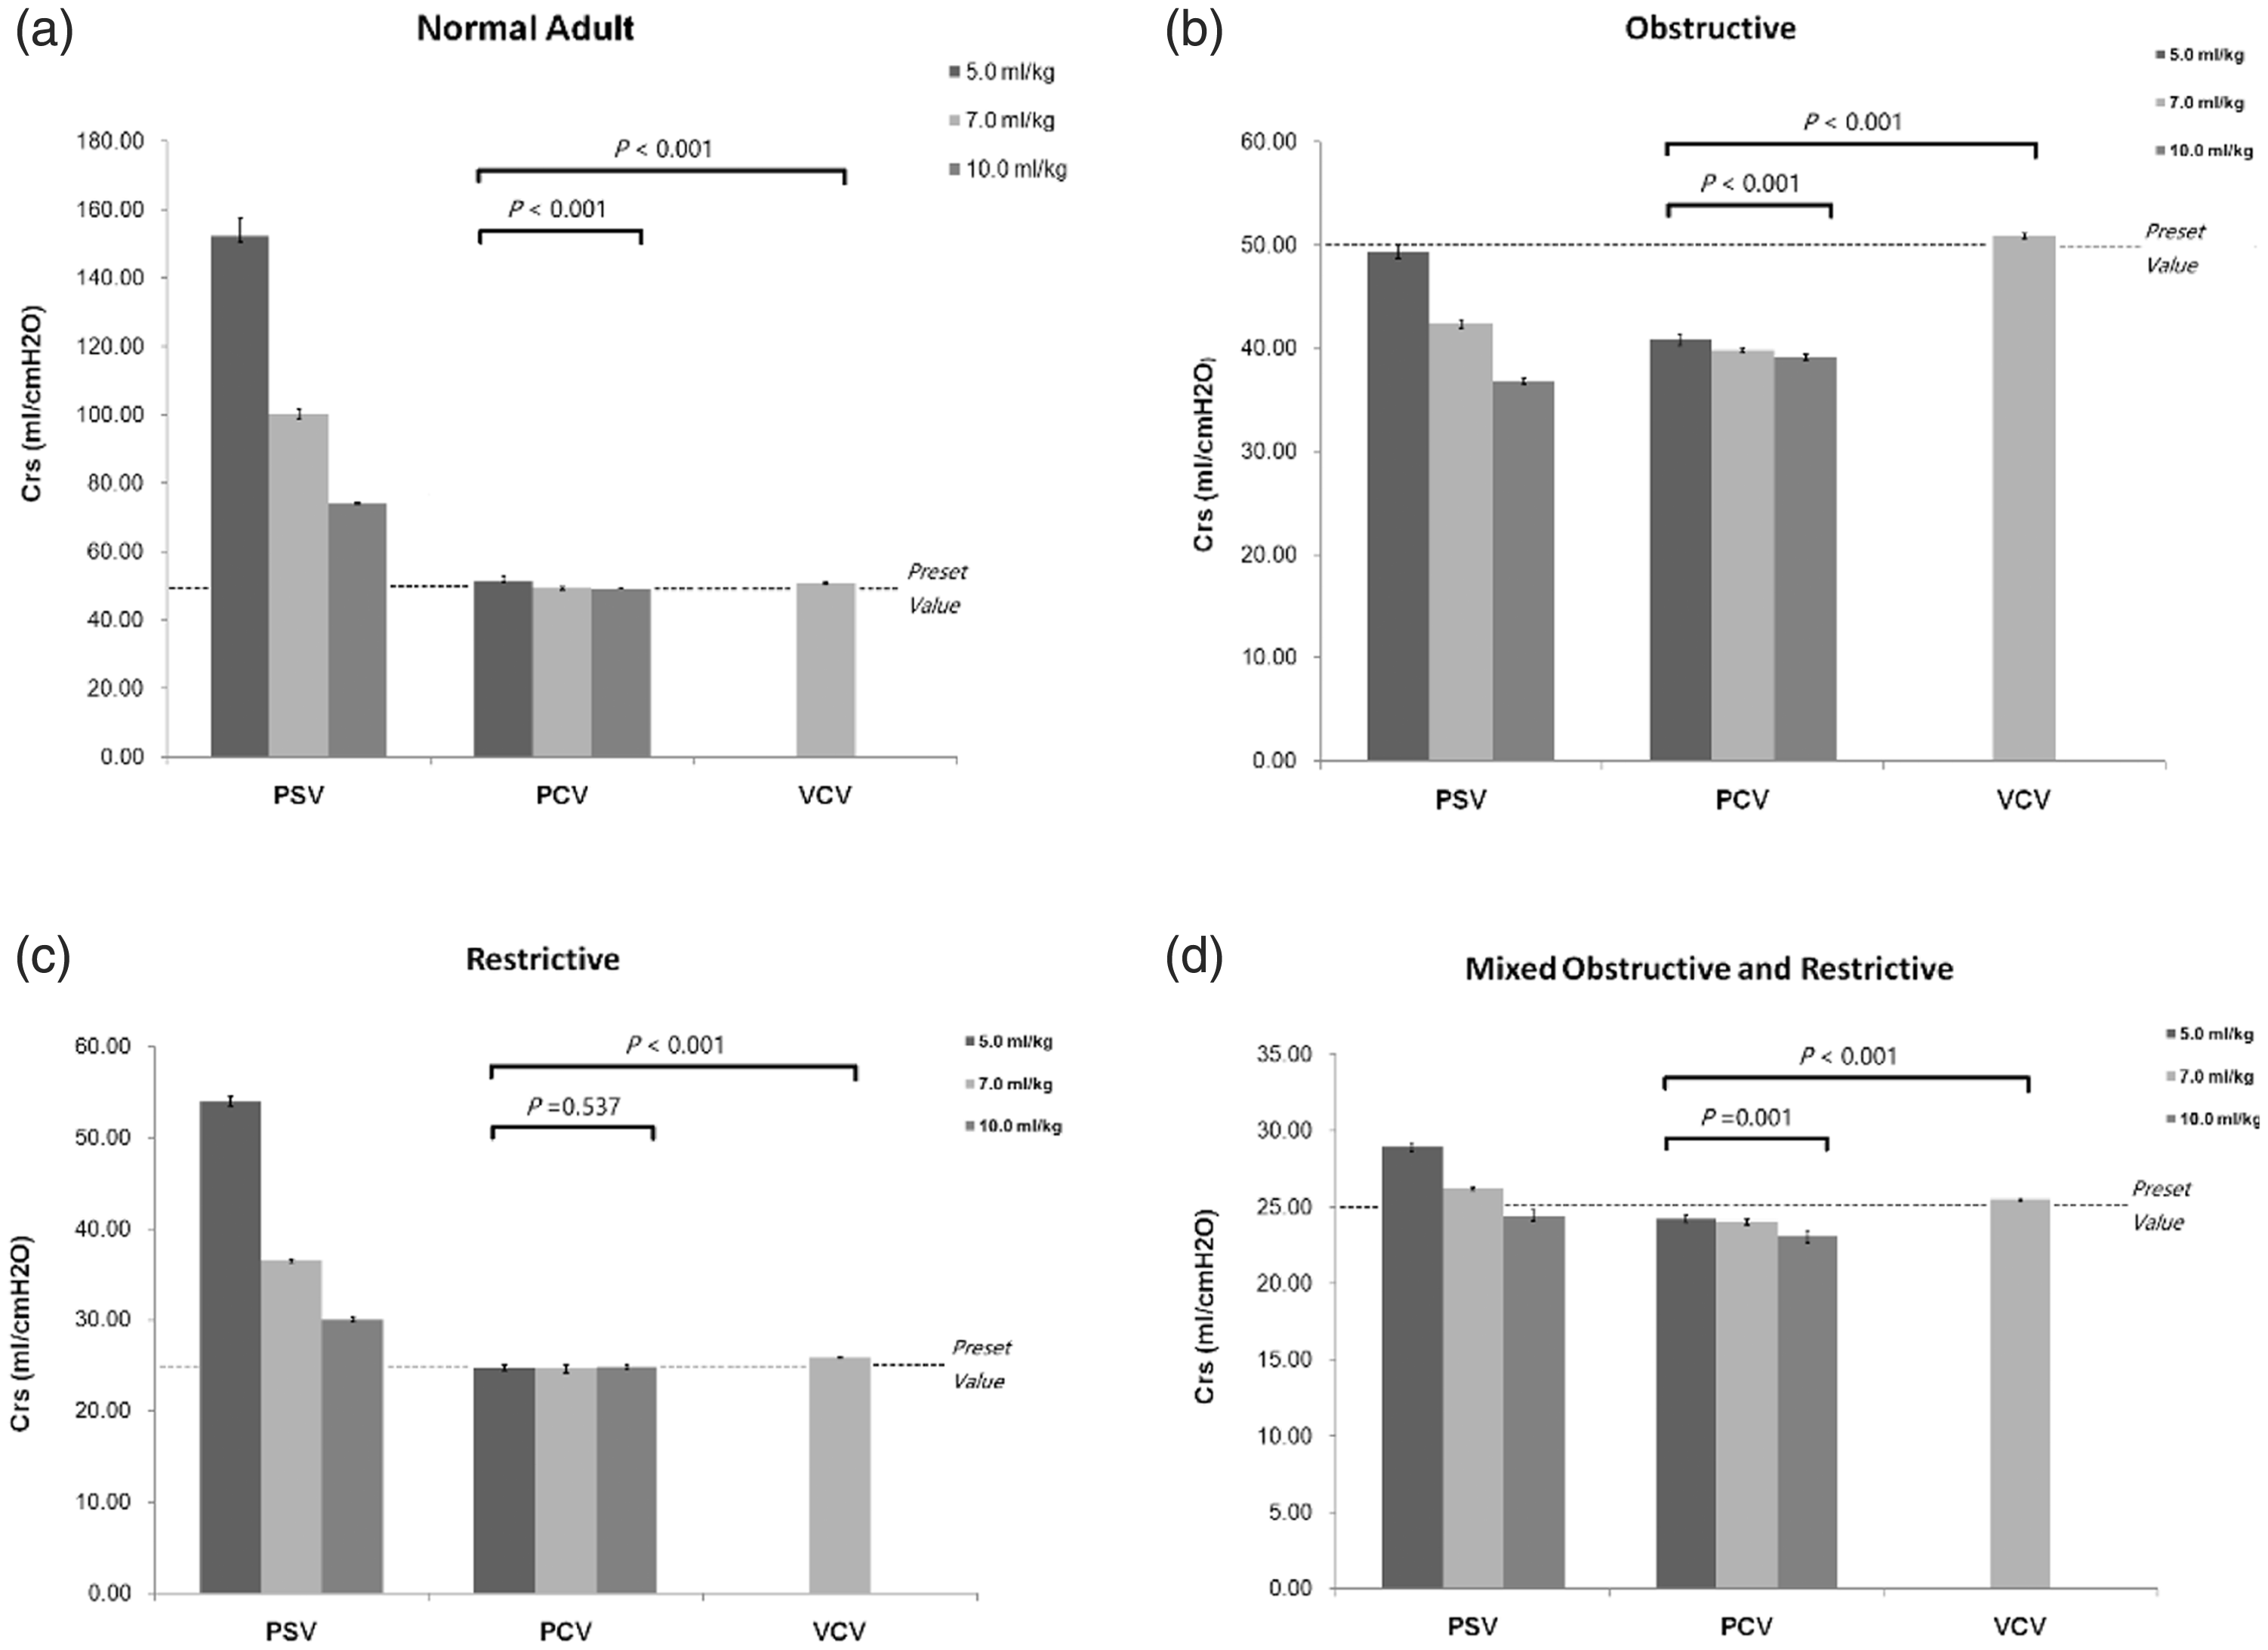
Comparison of compliance (Crs) in various models during the controlled and assisted ventilatory mode. Normal adult (A), obstructive (B), restrictive (C), and mixed (D) models are shown. Data are presented as the mean ± SD. P < 0.01 vs. PSV for all pairwise comparisons. The dotted line in the figure represents the preset value of Crs.
Comparison of VCV (test), PCV, and PSV in the normal adult lung model.
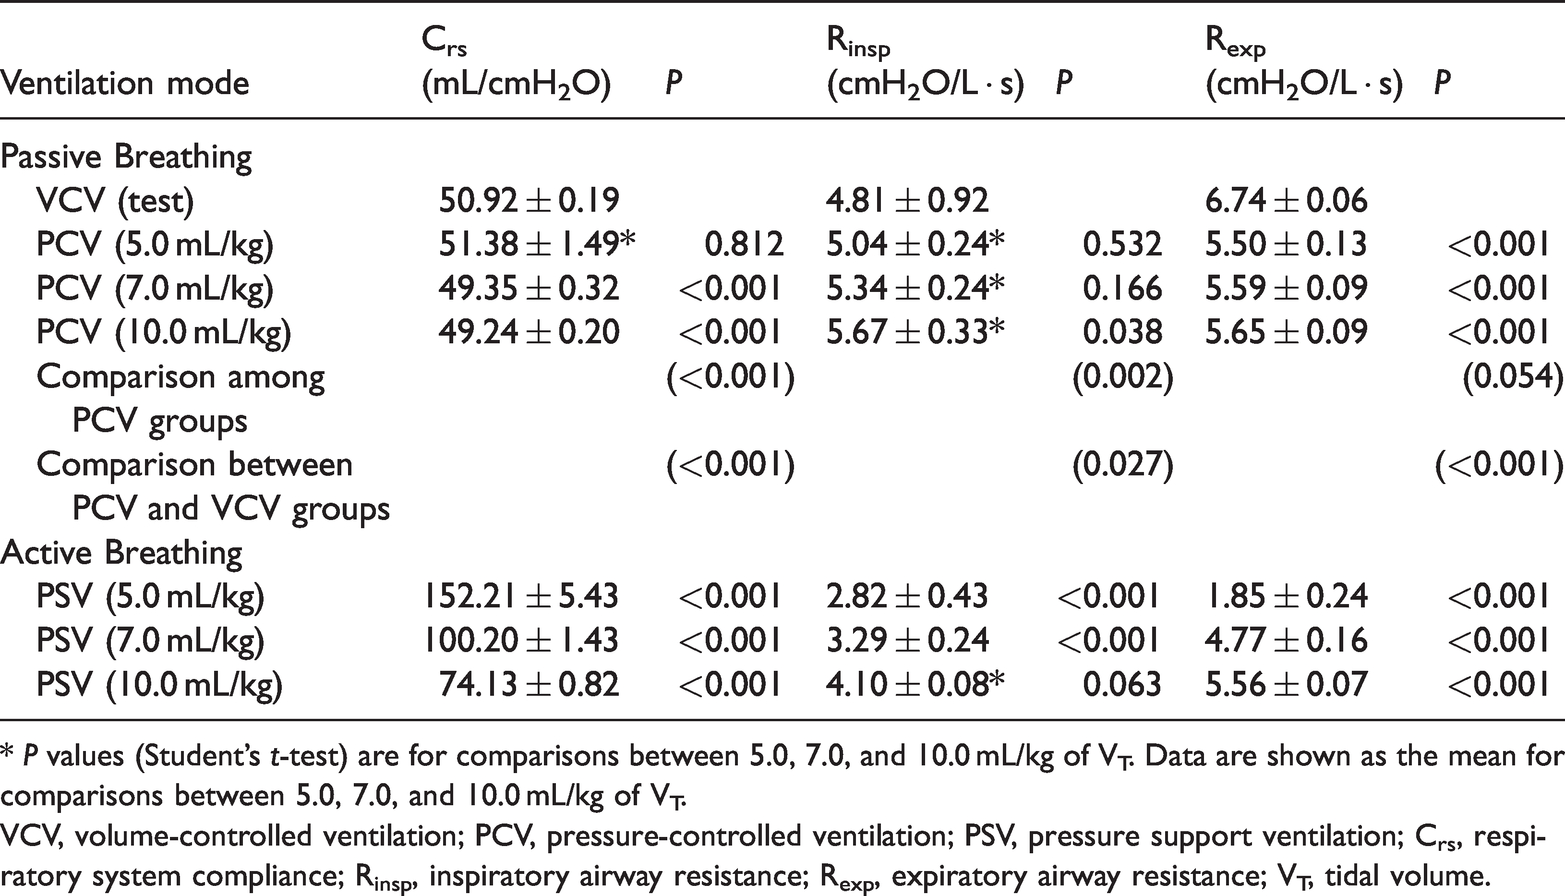
* P values (Student’s t-test) are for comparisons between 5.0, 7.0, and 10.0 mL/kg of VT. Data are shown as the mean for comparisons between 5.0, 7.0, and 10.0 mL/kg of VT.
VCV, volume-controlled ventilation; PCV, pressure-controlled ventilation; PSV, pressure support ventilation; Crs, respiratory system compliance; Rinsp, inspiratory airway resistance; Rexp, expiratory airway resistance; VT, tidal volume.
Statistics using the paired t-test between VCV (test), PCV, and PSV in severely restrictive lung respiratory model.
*P values (Student’s t-test) are for comparisons between 5.0, 7.0, and 10.0 mL/kg of VT. Data are shown as the mean for comparisons between 5.0 and are the results of seven measurements/cases.
VCV, volume-controlled ventilation; PCV, pressure-controlled ventilation; PSV, pressure support ventilation; Crs, respiratory system compliance; Rinsp, inspiratory airway resistance; Rexp, expiratory airway resistance; VT, tidal volume.
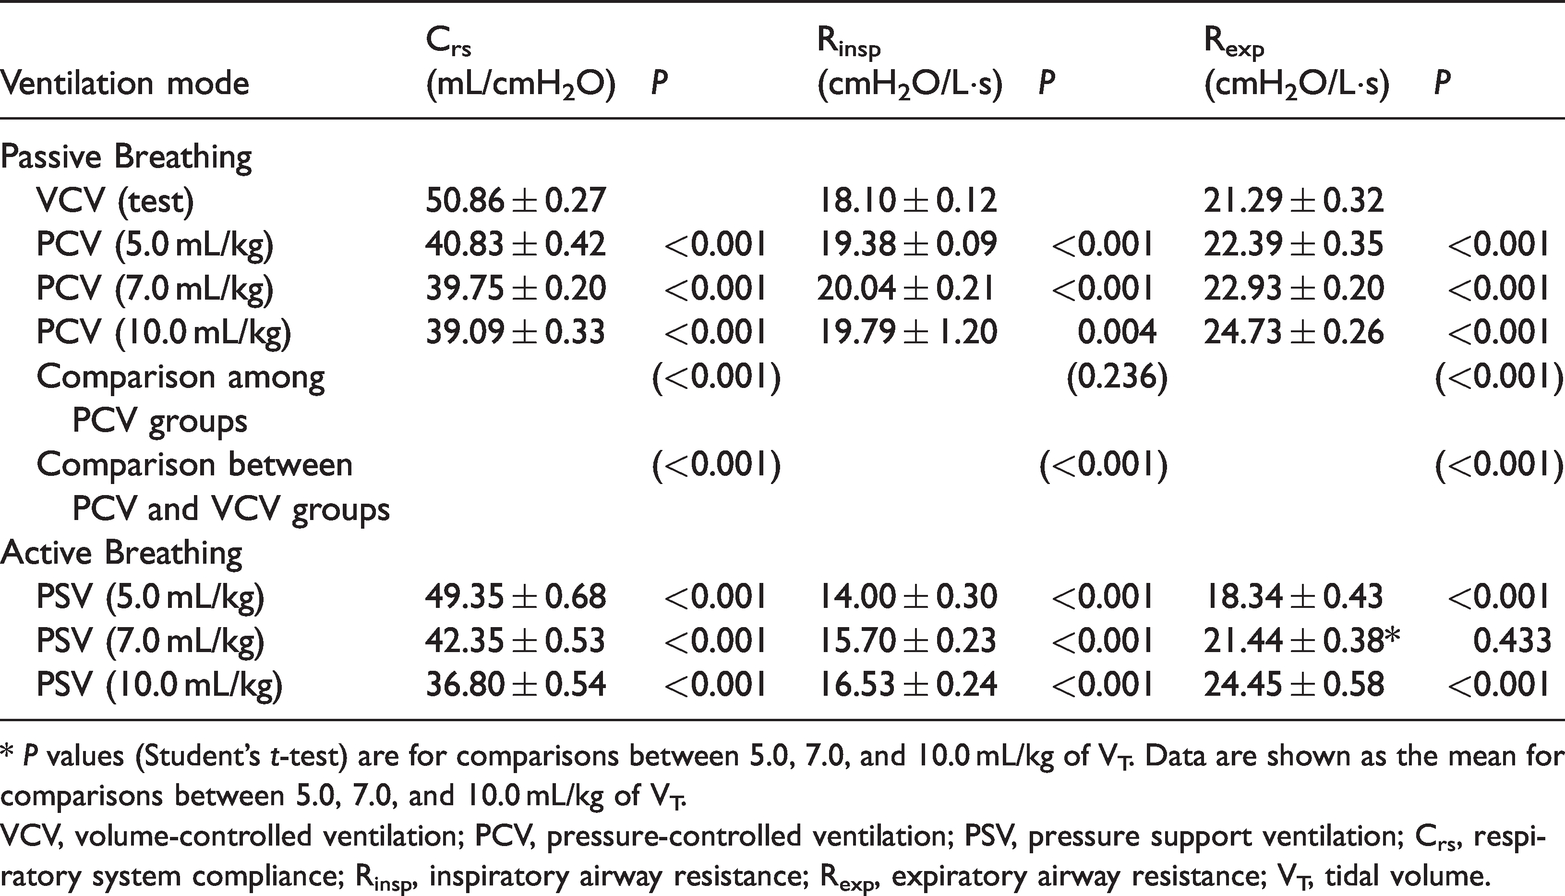
Statistics using the paired t-test between VCV (test), PCV, and PSV in the obstructive lung respiratory model.

* P values (Student’s t-test) are for comparisons between 5.0, 7.0, and 10.0 mL/kg of VT. Data are shown as the mean for comparisons between 5.0, 7.0, and 10.0 mL/kg of VT.
VCV, volume-controlled ventilation; PCV, pressure-controlled ventilation; PSV, pressure support ventilation; Crs, respiratory system compliance; Rinsp, inspiratory airway resistance; Rexp, expiratory airway resistance; VT, tidal volume.
Statistics using the paired t-test between VCV (test), PCV, and PSV in mixed obstructive and restrictive lung.

* P values (Student’s t-test) are for comparisons between 5.0, 7.0, and 10.0 mL/kg of VT. Data are shown as the mean ± standard deviation and are the results of seven measurements/cases.
VCV, volume-controlled ventilation; PCV, pressure-controlled ventilation; PSV, pressure support ventilation; Crs, respiratory system compliance; Rinsp, inspiratory airway resistance; Rexp, expiratory airway resistance; VT, tidal volume.
Estimated vs. measured inspiratory and expiratory resistance in various models at different tidal volume levels
In the passive breathing condition, the calculated and preset values of Rinsp were similar in all lung models despite changes in the tidal volume. During assisted ventilation, Rinsp was always underestimated when it was observed at 5.0 mL/kg of VT in all lung models. The calculated value of Rinsp generally increased with the VT increments. At 10.0 mL/kg of VT, the calculated error was approximately 10% under obstructive conditions.
Similar results were obtained for the calculated Rexp during PS ventilation. The difference between calculated and preset values was reduced remarkably in the three conditions at 7.0 mL/kg of VT (P < 0.001; Figure 2).

Comparison of inspiratory (Rinsp) and expiratory (Rexp) resistance in various models during controlled and assisted ventilatory modes. Normal adult (A), obstructive (B), restrictive (C), and mixed (D) models are shown. Data are presented as the mean ± SD. P < 0.01 vs. PSV for all pairwise comparisons. The dotted line in the figure represents the preset value of Rrs.
Discussion
In this bench study, we obtained three main findings. First, during assisted ventilation, the accuracy of the calculated value for respiratory mechanics (Rrs and Crs) was affected by the VT and interference from spontaneous breathing. Second, in the passive breathing condition, the calculated Crs was similar to the preset value at all VT levels except in the obstructive model. Finally, in three of the disease conditions, the calculated Rinsp error was approximately 10% in the PSV mode with 10.0 mL/kg of VT, while the calculated error of Rexp was <10% at 7.0 mL/kg of VT.
Several recent studies have investigated breathing dynamics in spontaneously breathing patients. One study investigated the effects of respiratory mechanics on the diaphragm function in patients with an acute exacerbation of chronic obstructive pulmonary disease (COPD) who were experiencing noninvasive ventilation (NIV) failure. 20 They stated that the ventilatory strategy and the pharmacological approach might be able to empty the lung. Therefore, the lung volume that was measured during controlled ventilation might represent static hyperinflation, but it does not correspond to the lung volume that was achieved during the spontaneous breathing trial, which is subject to dynamic hyperinflation. Similarly, Stahl et al. 21 hypothesized that dynamic and static respiratory measurements provided different information in acute respiratory failure. They found that both compliance and recruitment can be assessed simultaneously in dynamic respiratory mechanics during incremental PEEP, and dynamic mechanics were deemed to be more appropriate than static mechanics as a diagnostic tool in ventilated patients. Another study measured respiratory mechanics in acute respiratory distress syndrome (ARDS) patients by comparing ventilator settings and relevant physiological variables before and after performing the measurements, which revealed that ventilator setting changes that were based on the results of measurements improved the oxygenation index and significantly reduced the risk of overdistention. 22
Currently, many mechanical ventilators provide a brief end-inspiration and end-expiration occlusion that allows measurements with no flow and a static tidal volume. Static measurements are performed using a standard and classic method in which data represent the static mechanical properties of the respiratory system. It is essential to disallow patient effort, whether due to disease, sedation, or paralysis, during static measurements of invasive mandatory mechanical ventilation.23–25 In addition, it is assumed that the respiratory system compliance is linear in a breathing cycle for calculating static compliance.26,27 However, inspiratory effort always exists during noninvasive ventilation in spontaneously breathing patients. The airway pressure generated by inspiratory muscles (Pmus) mainly depends on diaphragm activity and the driving pressure output by the ventilator. Because Pmus varies over time and has different shapes among individuals, analyzing such respiratory system mechanics is difficult without implanting an esophageal catheter and/or using occlusion methods.28,29
In intubated patients with spontaneous breathing, the use of occlusion methods have recently been proposed to reliably estimate the Pmus 30 followed by a reliable estimation of respiratory system compliance. 31 However, the use of occlusion methods is unreliable during noninvasive ventilation via facemask. Thus, analysis of breathing dynamics in spontaneously breathing patients becomes an interesting field of research to explore.
With recent advances in monitoring technology and sophisticated software, dynamic measurements can assess the mechanical characteristics of the respiratory system during variable gas flow. Online estimation at the bedside is a helpful diagnostic tool for assisting therapeutic decisions and adjusting the ventilator settings.32,33 Dynamic measurements include the run-away method and the least square fitting (LSF) technique. The run-away method was first proposed by Younes et al. 34 to analyze lung mechanics. In a situation with run-away occurrence, the whole respiratory system is unstable, and larger tidal volume and higher inspiratory flow are frequently observed. Therefore, the patient feels uncomfortable and is unable to tolerate mechanical ventilatory support. Although this technique may provide satisfactory results, it is not optimal for bedside monitoring. 35 Recursive least squares (RLS) is a modified LSF technique that derives values for Crs and Rrs by solving the linear regression equation, in which airway pressure (Paw), VT, and flow measurements were sampled multiple times (up to 100–200 Hz) and recorded during the respiratory cycle. To overcome the difficulties in estimating mechanics in spontaneously breathing subjects by the RLS method, Zhao et al.36,37 developed an RLS method called the adaptive time slice method (ATSM).
During pressure-preset ventilation modes such as PSV, the airway pressure waveform is rectangular while inspiratory flow varies; the dynamics of lung filling and emptying can be precisely described by exponential equations, and they are affected by ventilation parameters and respiratory system characteristics. 15 Iotti et al. 38 found that the level of PS could affect the calculated Crs value. In a previous study with a low PS level and high spontaneous breathing activity, the calculated Crs was overestimated while the Rrs was underestimated; similar Crs values were obtained at equal VT during PSV with controlled mandatory ventilation (CMV) at constant inspiratory flow. 38 In the present bench study, the lung simulator was set to simulate an adult with a normal body weight (65–70 kg), assuming that the static Crs and Rrs values remained constant throughout any given breath. We demonstrated that the calculated Crs gradually decreased with an increase in the PS. At a tidal volume of 7.0 mL/kg only, the error in the calculated Crs was ≤20% using the preset value in obstructive conditions.
The advantage of PSV is that the variable inspiratory flow can meet the patient’s demand and improve comfort. PSV must be triggered by the patient’s inspiratory effort. Usually, the patient’s effort is detected by a pressure trigger or a flow trigger. During noninvasive ventilation, the most used trigger mechanism on Respironics BiPAP devices is the flow shape–signal technique, which applies a mathematical model that is derived from the flow and pressure signals, with better tolerance and reduced trigger asynchrony.13,39 On the basis of this technique, breath initiation during NPPV is more likely to be triggered by a flow change and not by a pressure alteration in the ventilator circuit. When assisted ventilation is activated and the airway pressure starts to increase, the initial flow is not zero. In this case, the measured inspiratory resistance would be more accurate using the modified equation. As shown above, the measurement error for Rinsp was less than 15% of the corresponding preset values at 10.0 mL/kg of VT in the obstructive model, and measurement error for Rexp was <10% at 7.0 mL/kg of VT in all lung models.
The dynamic signal analysis approach was selected because it requires neither special maneuvers nor particular flow patterns, and does not rely on the amplitude and shape of the Pmus. However, the Crs calculation is restricted to the tidal volume and inspiratory effort because the equation represents the ratio between tidal volume and driving pressure, which is defined as the difference between plateau pressure and total PEEP. 40 In this bench study, the simulator was ventilated in the pressure-limited mode with an exponential decay of the inspiratory flow waveform. The driving pressure was calculated as EIP − PEEP. During PCV/PSV, Paw is constant at the end-inspiration phase, while the inspiratory flow is gradually reduced from the PIF, and EIP is obtained when the inhalation shifts to exhalation. Inspiratory and expiratory resistance were calculated using modified specific equations across the entire respiratory cycle.
The objective of our bench study was to assess the impacts of inspiratory effort and tidal volume on the estimation of respiratory mechanics during noninvasive assisted ventilation. This is a novel study that used a dedicated NPPV ventilator, which exhibits better synchronization than intensive care unit (ICU) ventilators with the simulator. 41 The main limitation of this bench study was that we selected a linear model, which assumes that the Crs and Rrs remain constant throughout the respiratory cycle and that these values are constant in the equation of motion. In addition, the lung simulator was calibrated and configured using an ICU ventilator in the VCV mode (Hamilton C3). A previous bench study revealed that dedicated NPPV ventilators (such as the V60 Bilevel Ventilator), which are equipped with a special-designed electromagnetic valve and leak compensation algorithm, exhibited more homogeneous behavior than ICU ventilators on patient–ventilator synchrony despite the presence of air leaks. 41 These experimental conditions may not replicate what occurs in the clinical setting. Finally, we designed several respiratory mechanics and only two levels of inspiratory effort for investigation in the present study. Therefore, the findings of the current study should be verified in clinical trials.
Conclusions
In the present bench study, we first estimated the respiratory mechanics using a modified dynamic signal analysis approach to determine compliance and resistance in spontaneously breathing patients under PSV using a breathing simulator. Unlike the occlusion method, the modified dynamic analysis approach is effective and can continuously monitor respiratory mechanics (especially Rrs) in lung disease conditions during noninvasive assisted ventilation. It is important to adjust the tidal volume level and pool the respiratory data for consecutive breaths. The estimated accuracy of the system compliance and expiratory resistance depends on the volume status (e.g. 7.0 mL/kg) in obstructive patients.
Supplemental Material
sj-pdf-1-imr-10.1177_0300060521992184 - Supplemental material for Accuracy of the dynamic signal analysis approach in respiratory mechanics during noninvasive pressure support ventilation: a bench study
Supplemental material, sj-pdf-1-imr-10.1177_0300060521992184 for Accuracy of the dynamic signal analysis approach in respiratory mechanics during noninvasive pressure support ventilation: a bench study by Yuqing Chen, Yueyang Yuan, Hai Zhang, Feng Li and Xin Zhou in Journal of International Medical Research
Footnotes
Authors’ contributions
Chen YQ contributed to the conception and drafted the work or substantively revised it. Yuan YY contributed to the design of the work. Zhang H contributed to the data acquisition and analysis. Li F and Zhou X contributed to interpretation of the data. All authors read and approved the final manuscript.
Declaration of conflicting interest
The authors declare that there is no conflict of interest.
Funding
This study was funded by the “Star of Jiaotong University” program of Shanghai Jiao Tong University Medical and Industrial Cross Research Fund Project (grant no YG2019ZDB08).
Supplemental Material
Supplemental material for this article is available online.
References
Supplementary Material
Please find the following supplemental material available below.
For Open Access articles published under a Creative Commons License, all supplemental material carries the same license as the article it is associated with.
For non-Open Access articles published, all supplemental material carries a non-exclusive license, and permission requests for re-use of supplemental material or any part of supplemental material shall be sent directly to the copyright owner as specified in the copyright notice associated with the article.