
Abstract
Objective
Traditional approaches that involve measuring the height and volume of the pituitary by magnetic resonance imaging (MRI) are unreliable. We investigated the use of a more accurate method using texture analysis to evaluate idiopathic central precocious puberty (ICPP) by MRI.
Methods
In total, 352 texture features of the pituitary were extracted from 12 healthy girls and 18 girls with ICPP. A LASSO regression model and linear regression model were used to create the prediction model. Pearson’s correlation analysis and receiver operating characteristic curves were used to evaluate the predictive performance.
Results
The radiomics score had a significant linear relationship with the luteinizing hormone concentration and the luteinizing hormone/follicle-stimulating hormone ratio. The radiomics score showed better predictive performance than traditional pituitary measurements. The area under the curve of the radiomics score, pituitary height, and variable combinations was 0.759 (95% confidence interval [CI], 0.583–0.936), 0.681 (95% CI, 0.483–0.878), and 0.829 (95% CI, 0.681–0.976), respectively.
Conclusion
Combination of the radiomics score with pituitary height measurements allows for better evaluation of the pituitary during diagnostic imaging, indicating satisfactory potential for efficacy assessments.
Keywords
Introduction
Precocious puberty (PP) is defined as accelerated development and the attainment of secondary sexual characteristics before 8 years of age in girls and before 9 years of age in boys. 1 Idiopathic central PP (ICPP) without central nervous system lesions or genetic mutations accounts for the majority of PP cases and represents the most common type found in girls. 2 The development of PP involves a series of complex physiological changes that are primarily regulated by the gonadal hormones; its onset can be affected by many factors, including genetic, nutritional, environmental, and socioeconomic factors.
The pituitary plays a vital role in the hypothalamic–pituitary–gonadal axis because it is a functional endocrine organ in the human body. The gonadotropin-releasing hormone (GnRH) stimulation test is the gold standard for identification of ICPP,3,4 whereas imaging analysis is crucial for evaluating the pituitary. Elster et al. 5 first measured the height and shape of the pituitary by magnetic resonance imaging (MRI) to examine the age-related changes of this gland. Based on their findings, the authors divided the upper edge of the pituitary gland into five levels. This classification system has facilitated the current diagnosis of and research into PP. Later, researchers identified sex-related differences in the pituitary gland by measuring its volume. 6 However, these methods do not serve as quantitative indicators of PP and are associated with poor diagnostic performance.
Radiomics features are mathematical parameters used to evaluate the inter-relationships between the pixels during imaging analysis. Thus, in principle, texture analysis is a technique used to evaluate the position and intensity of signal features and their gray-level intensity in digital images. 7 Digital imaging data obtained by an institution’s radiology department contain sufficient texture information to aid in making clinical diagnoses. Texture can be changed by histological factors; these changes are microscopic and cannot be assessed visually. However, they can be adequately quantified by texture analysis. This approach has been used to classify the pathology of diseases such as those affecting the breast, kidney, liver, thyroid, heart, brain, and lung.8–10
Texture parameters have even been widely used to aid in cancer diagnosis; however, few authors have applied these parameters in pituitary research. The anterior and posterior pituitary have different volumes and signals, and these signals can also differ based on age and sex. Imaging features extracted from the pituitary can be described based on characteristics such as intensity histogram, shape, and texture patterns. In the present study, we measured the differences in these features between a healthy control group and an ICPP group; we also sought to determine a more accurate imaging biomarker for ICPP.
Materials and methods
Study cohorts
From 2016 to 2019, we prospectively collected the data of 30 girls aged 6 to 9 years without central nervous system lesions and other systemic or psychological diseases. Girls who had conditions or features that might cause PP, such as thyroid, adrenal gland, or hereditary diseases, were excluded before testing was performed. The girls were divided into an ICPP group and control group. Those in the ICPP group had Tanner stage >II physical development (i.e., the presence of breast buds and pubic hair) and growth acceleration (height velocity of >2 standard deviation score), and their GnRH stimulation test showed a luteinizing hormone (LH) peak of >5 mU/mL and an LH peak/follicle-stimulating hormone (FSH) peak ratio of >0.6. The LH and FSH concentrations were measured by chemiluminescence immunoassay (IMMULITE 2000; Siemens, Munich, Germany) at 30, 60, 90, and 120 minutes after injection of GnRH. The girls in the control group did not exhibit growth acceleration, breast development, or pubic hair.
The study protocol was approved by the Ethics Committee of the Zhejiang Provincial People’s Hospital. All children’s parents provided written informed consent to enroll their children in the study, and all children provided verbal assent in accordance with the tenets of the Declaration of Helsinki.
Data acquisition
For the high-resolution T1-weighted imaging (T1WI) sequences, we used a GE Discovery 3T scanner with an 8-channel head coil containing 192 slices with a repetition time of 6.8 ms, echo time of 3 ms, flip angle of 12°, 1-mm slice thickness, 256 × 256 matrix, and field of view of 216 × 216. We checked the image quality and excluded data that featured visible head motion artifacts and signal noises caused by the skull base.
Region of interest (ROI) selection
We determined the boundary of the pituitary and surrounding structure based on the findings reported by Satogami et al. 11 The pituitary gland is located in the pituitary fossa in the center of the middle cranial fossa and is divided into three parts: the adenohypophysis (anterior pituitary), neurohypophysis (posterior pituitary), and pituitary stalk. It is surrounded by the sphenoid bone, which exhibits hypointensity on both T1WI and T2-weighted imaging (T2WI), at its inferior, anterior, and posterior boundaries. The upper part of the pituitary is the stalk, which is surrounded by cerebrospinal fluid and exhibits hyperintensity on T2WI; the stalk is connected to the hypothalamus through the infundibular region. The lateral aspects of the pituitary lie adjacent to the cavernous sinuses and demonstrate lower isointensity than the anterior pituitary on T1WI. We used ITK-SNAP (www.itksnap.org/pmwiki/pmwiki.php) to manually mark the ROI on high-resolution T1WI; the ROI contained the anterior and posterior pituitary (Figure 1). The ROIs for the reconstructed sagittal, coronal, and transverse planes were determined by two experienced neuroradiologists. We also measured the pituitary height (PH) in the median sagittal slice.

The regions of interest of the pituitary were manually marked on high-resolution T1-weighted images containing both the anterior and posterior pituitary.
Intraobserver and interobserver agreement
The intraobserver and interobserver agreements of feature extraction were evaluated using the intraclass correlation coefficient (ICC). We initially chose 20 random high-solute T1-weighted images for ROI segmentation and feature extraction. The ROI segmentation was independently performed by two experienced radiologists. The intraobserver ICC was computed by comparing two extractions of Reader A (with 10 years’ experience in neural MRI). The interobserver ICC was computed by comparing the extraction of a second reader (Reader B, with 15 years’ experience in neural MRI) and the first extraction of Reader A.
Texture extraction and selection
AnalysisKit software (GE Healthcare, Chicago, IL, USA) was used to extract and select the texture parameters. The 352 texture parameters our team extracted included histogram parameters, form factors, gray-level co-occurrence matrix (GLCM) parameters, and run-length matrix (RLM) parameters. Z-score transformation was used to remove the unit limits of the data for each feature before feature selection. The “glmnet” package in R version 3.3.1 statistical software (R Foundation for Statistical Computing, Vienna, Austria) was used for LASSO logistic regression model analysis. We used the LASSO logistic regression model to select the most important predictive features (Figure 2) and to construct a radiomics signature in the training set. Therefore, the radiomics signature was obtained by performing a regression model for these two features. The prediction model was then created using linear regression.

Ten-fold cross-validation via minimum criteria was used in the tuning parameter (λ) selection of the LASSO model. The partial likelihood deviance was plotted versus log (λ). Dotted vertical lines were drawn at the optimal values using the minimum criteria and the 1 – standard error criteria. Two features were selected with the smallest binomial deviance.
Statistical analysis
The statistical analysis was conducted using R version 3.3.1 (R Foundation for Statistical Computing). The two-sided statistical significance level was set at P < 0.05. The multivariate binary logistic regression was conducted with the “rms” package. Additional statistical analyses were performed with IBM SPSS Statistics for Windows, Version 23.0 (IBM Corp., Armonk, NY, USA). We used the independent t-test and Mann–Whitney test to identify differences in the characteristics between the two groups.
We performed multiple linear regressions with stepwise variable selection to detect significant associations with the LH concentration and LH/FSH ratio. We considered P < 0.05 to be statistically significant. The discriminative capability of the model was measured using the receiver operating characteristics (ROC) curve and area under the curve (AUC). To estimate the prediction error and confidence interval for both groups, a 1000-iteration bootstrap analysis was used in both the ICPP and control groups to further test the model. 12
Results
Group characteristics
Thirty girls aged 6 to 9 years were included in this study (ICPP group, n = 18; control group, n = 12). Two-independent-samples t-tests showed no significant difference in age, weight, or body mass index between the two groups. However, the Mann–Whitney test showed significant differences in the Tanner stage (P < 0.001), LH concentration (P < 0.001), and LH/FSH ratio (P < 0.001). The findings of these analyses are shown in Table 1.
Demographic and endocrinological data of girls in the ICPP and control groups.
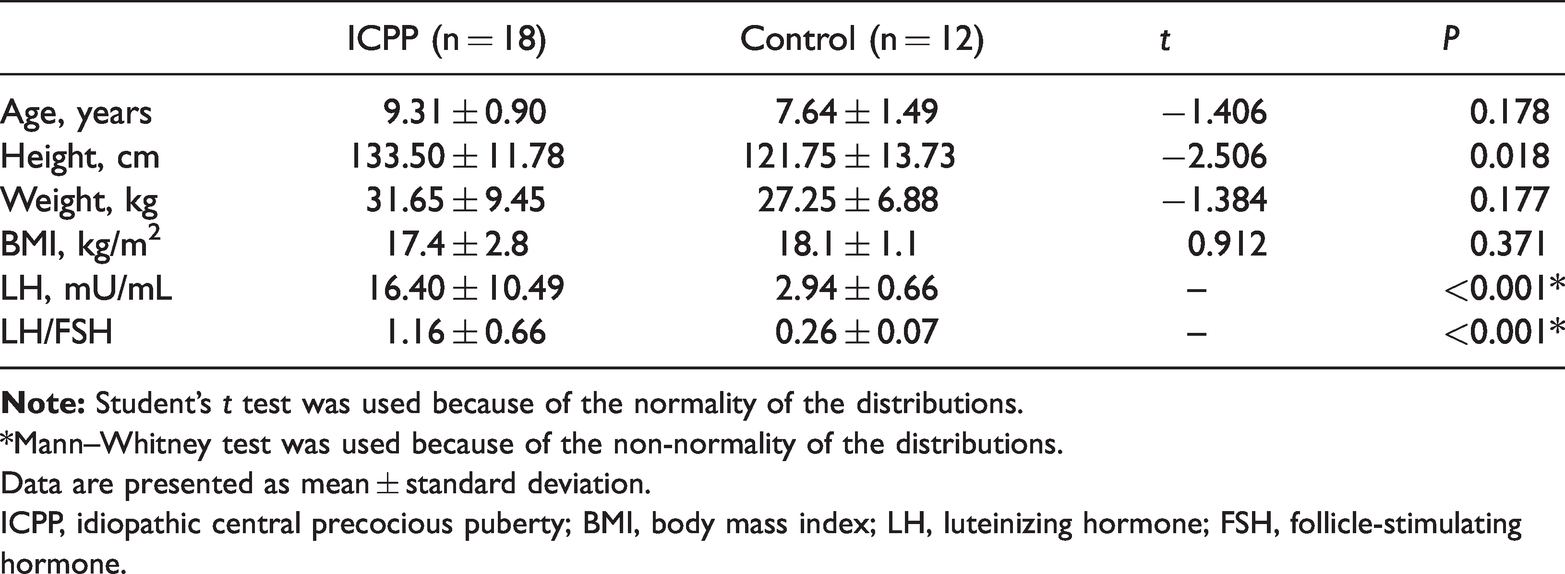
*Mann–Whitney test was used because of the non-normality of the distributions.
Data are presented as mean ± standard deviation.
ICPP, idiopathic central precocious puberty; BMI, body mass index; LH, luteinizing hormone; FSH, follicle-stimulating hormone.
Intraobserver and interobserver agreement
An ICC of >0.75 was considered to indicate good agreement, and the remaining image segmentation was performed by Reader A. The intraobserver ICC calculated based on two measurements of Reader A ranged from 0.856 to 0.963. The interobserver agreement between the two readers ranged from 0.784 to 0.925. These results indicated favorable intraobserver and interobserver feature extraction reproducibility.
Radiomics score
The following formula was used to calculate the radiomics score:

where “SD” indicates that the value reflects the standard deviation among the different relationships.
Statistical analysis results
Comparison of texture features
We extracted the volume and surface area of the pituitary as forming factors to measure the morphological changes between the ICPP and control groups. We selected 2 forming factors among 352 texture parameters to represent the volume and surface area of the pituitary. No significant morphological differences were found between the two groups (Table 2). As in our previous experience, the PH was significantly different between the two groups (P < 0.05). However, we also found in the present study that the radiomics score was significantly different between the two groups (Table 2). The findings of this analysis are shown in Figure 3.
Statistical results of form factors and texture features.

Note: Student's t tests were calculated due to the normality of the distributions.
Data are presented as mean ± standard deviation.
ICPP, idiopathic central precocious puberty.
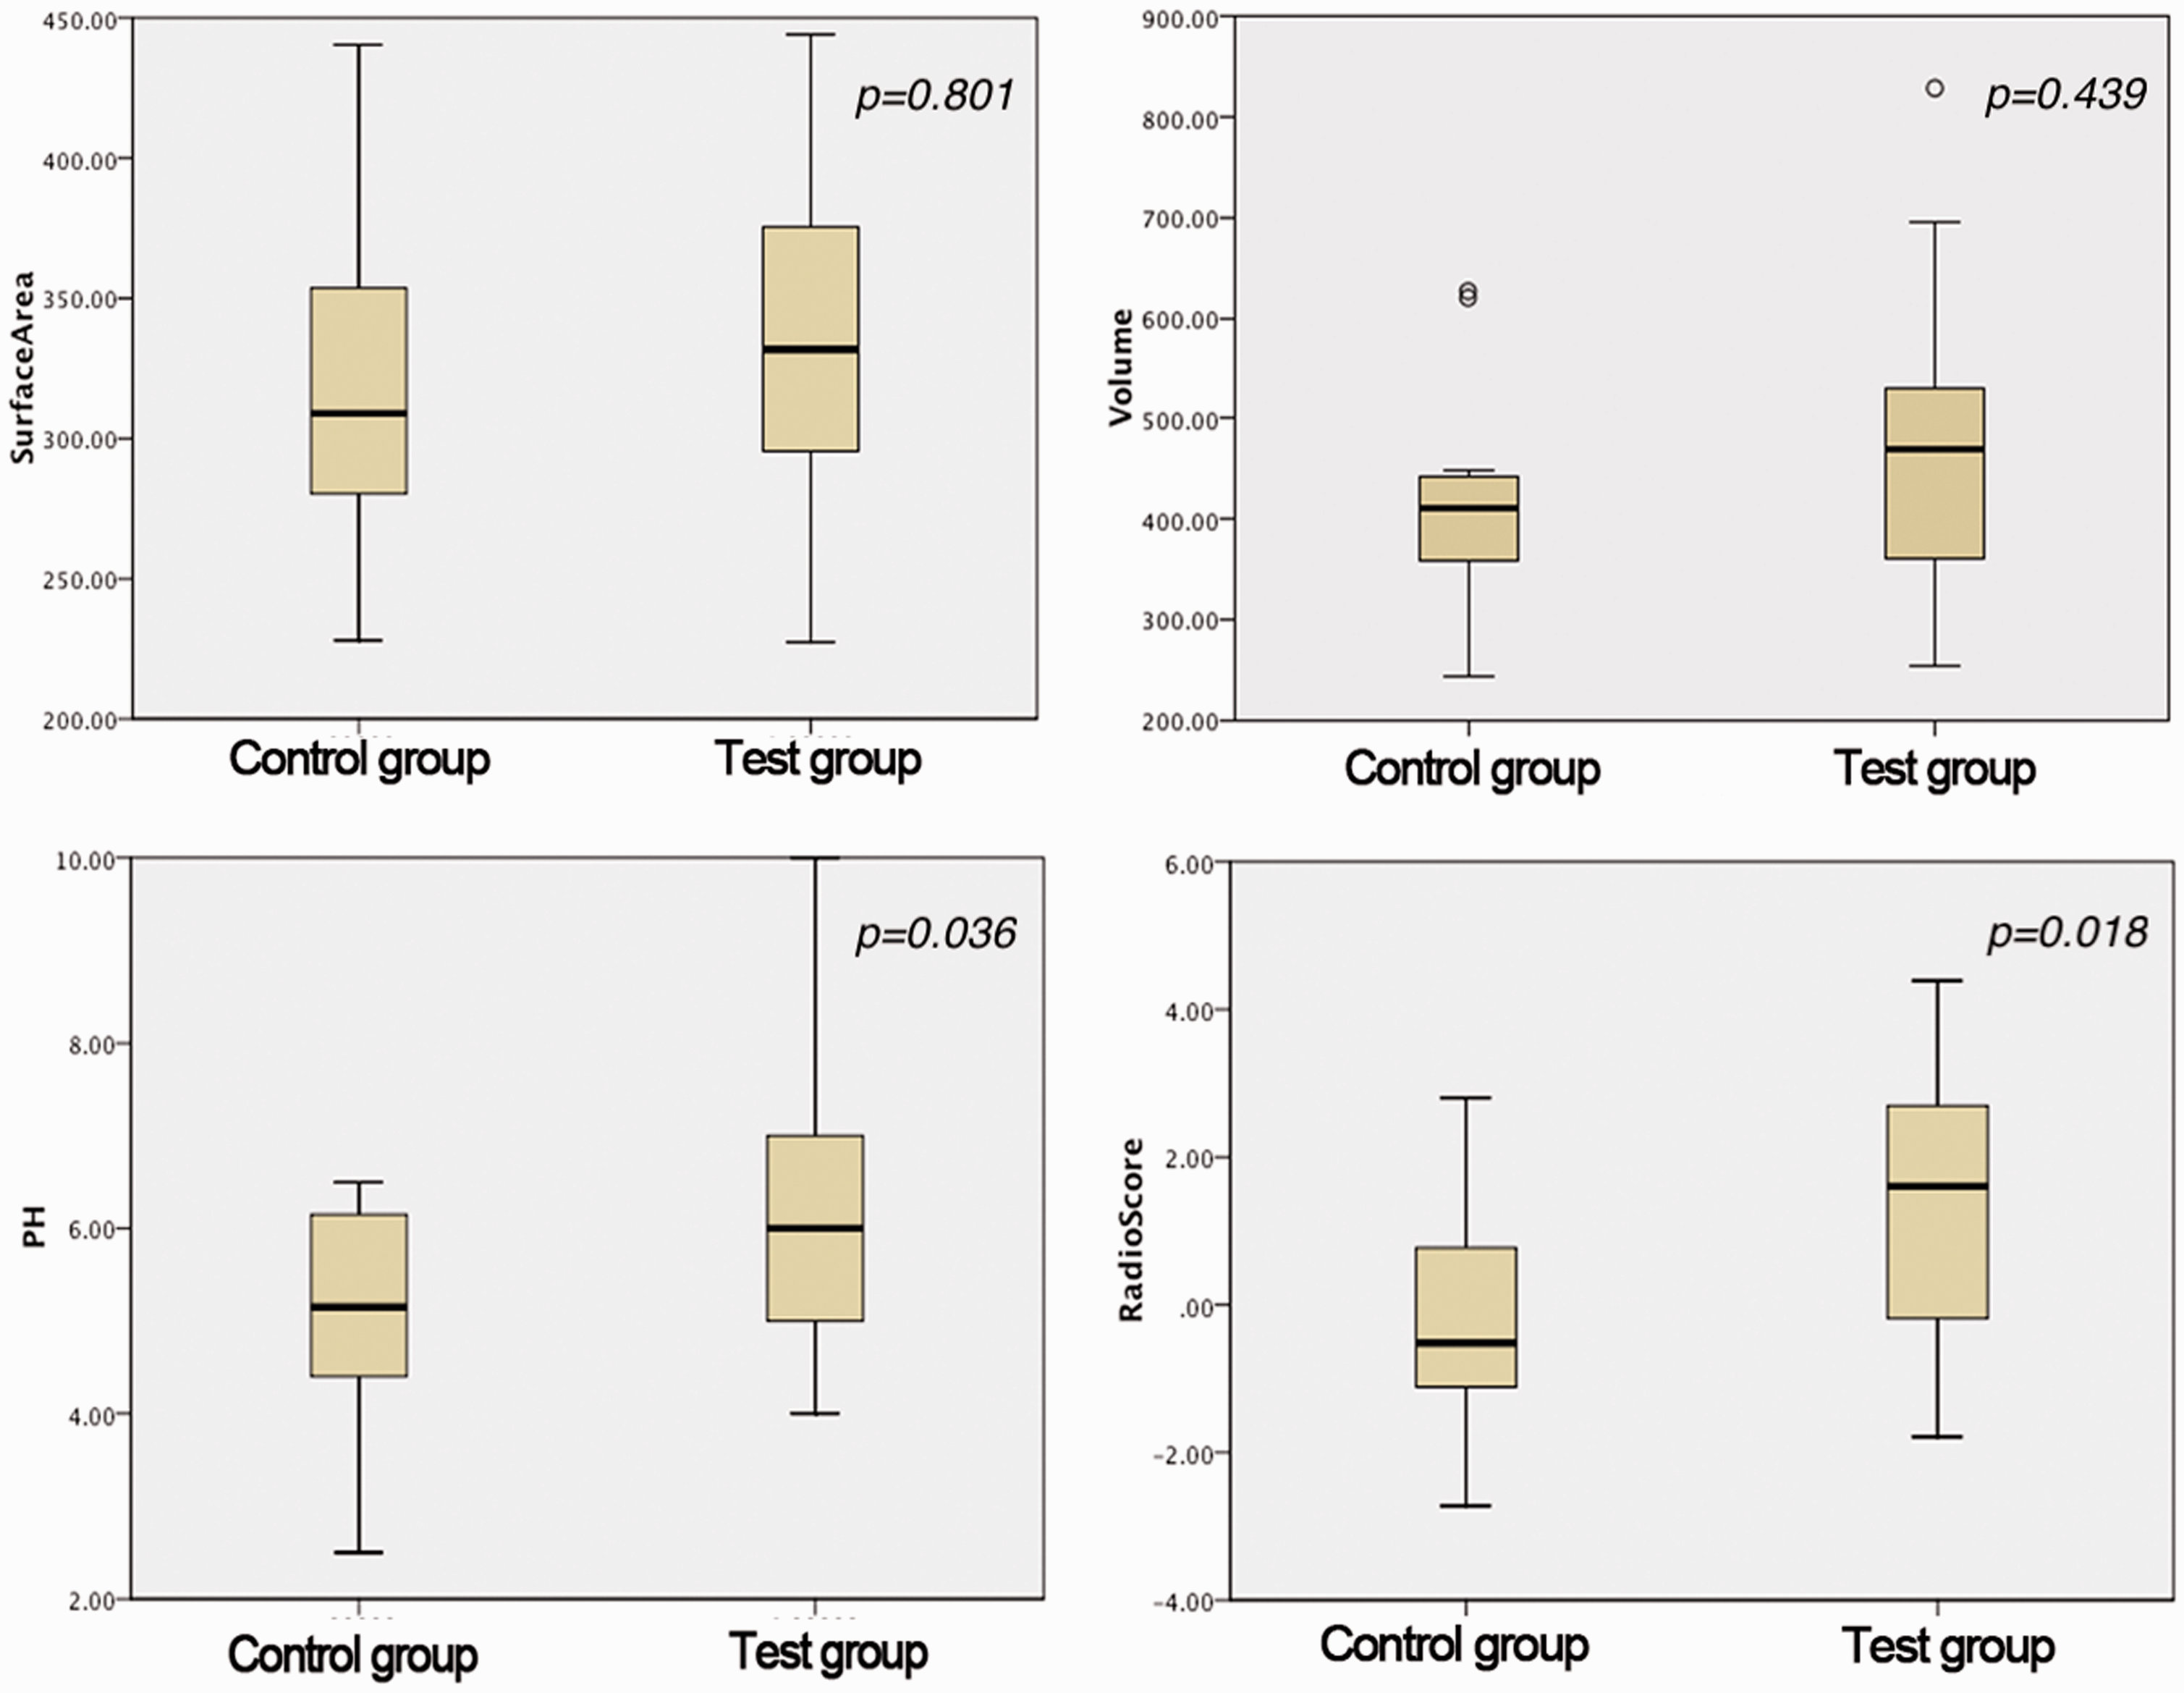
Four sets of data were in accordance with the normal distribution, and there was no statistically significant difference in morphological features (volume and surface area). Both PH and the radiomics score showed significant differences between the two groups.
Linear regression from radiomics score and hormone concentrations
The linear regression model showed that the radiomics score was a predictor of the LH peak (after stimulation test) and the LH/FSH ratio (after stimulation test). The radiomics score had a significant linear relationship with the LH concentration (regression coefficient = 2.556, adjusted R2 = 0.171, P = 0.013) and LH/FSH ratio (regression coefficient = 0.145, adjusted R2 = 0.125, P = 0.032) (Figure 4).

The model showed that the radiomics score had a significant linear relationship with the LH concentration (regression coefficient = 2.556, adjusted R2 = 0.171, P = 0.013) and the LH/FSH ratio (regression coefficient = 0.145, adjusted R2 = 0.125, P = 0.032).
Diagnostic performance of PH and radiomics score
ROC curves were plotted for PH, the radiomics score, and a combination of predictive variables to compare the detection performance (Figure 5). The combination of predictive variables was calculated from the logistic regression. The following formula was used: combination predictive variable = PH + radiomics score × 0.517/0.629. The AUC of the radiomics score, PH, and combination of variables was 0.759 (95% confidence interval [CI], 0.583–0.936), 0.681 (95% CI, 0.483–878), and 0.829 (95% CI, 0.681–0.976), respectively. The cut-off points of the ROC curve were obtained by maximizing the Youden index, and the associated criteria of tests were −0.361, 6.5, and 1.320. The sensitivity was 77.78 (95% CI, 52.4–93.6), 33.33 (95% CI, 13.3–59.0), and 66.67 (95% CI, 41.0–86.7), and the specificity was 66.67 (95% CI, 34.9–90.1), 100 (95% CI, 73.5–100), and 100 (95% CI, 73.5–100). These values were consistent with the AUC values calculated using the 1000-times bootstrap analysis (mean ± standard deviation: radiomics score, 0.759 ± 0.029; pituitary, 0.681 ± 0.036; and combination of variables, 0.829 ± 0.026). The radiomics signature showed more favorable predictive performance than PH.

The area under the curve of the radiomics score, PH, and combination variables was 0.759 (95% CI, 0.583–0.936), 0.681 (95% CI, 0.483–0.878) and 0.829 (95% CI, 0.681–0.976).
Discussion
This study showed that radiomics signatures that were selected and constructed by LASSO and regression models were correlated with gonadal hormone concentrations. Further, the radiomics texture showed decent discriminative ability of the radiomics signatures to identify girls with ICPP.
The GnRH stimulation test is the gold standard for establishing a clinical diagnosis of ICPP.3,4 The test requires collection of multiple blood samples to measure hormone concentrations, and it is thus uncomfortable and costly for patients. Traditional diagnostic imaging for ICPP involves measuring the height, shape, and volume of the pituitary. Elster et al. 5 first pointed out that the height and shape of the pituitary were correlated with pubertal development. They observed that the PH significantly increases with age and that the upper edge of the pituitary gland gradually rises upward and tends to be a spherical shape during adolescence. Sharafuddin et al. 13 further introduced the use of pituitary volume measurement for diagnosis of ICPP. The authors found that secondary sex characteristics, a PH of >4.2 mm, a nearly spherical shape (grade 4–5), and a midsagittal cross-sectional area of >29.1 mm2 were strongly suggestive of premature activation of the hypothalamic–pituitary–gonadal axis in children. In our study, the radiomics signatures had better performance than traditional pituitary measurements for ICPP during diagnostic imaging. The histological alterations present in some illnesses may bring about texture changes in MRI. These changes can be quantified by texture analysis, providing microscopic information that cannot be assessed visually.7,14,15
Radiomics analysis had been widely used during diagnosis and evaluation. Biologically related MRI features can reflect organ-level tumor data variations and distributions, offering an opportunity to observe spatial variations and the temporal evolution of tumors. 16 For example, measurement of the spatial distance has been employed to quantitatively explore brain tumor heterogeneity. 17 Kovalev et al. 18 used extended multi-sort co-occurrence matrices, which involve intensity, gradient, and uniform anisotropic image features, to differentiate between healthy brains and those with white-matter encephalopathy and Alzheimer’s disease. Herlidou-Même et al. 19 used texture parameters based on histogram, co-occurrence matrix, gradient, and RLM findings to distinguish between the different brain tissues (white matter, gray matter, cerebrospinal fluid, tumors, and edema) on three different MRI units. Recent studies have used MRI texture analysis to evaluate and preoperatively identify pituitary adenomas.20,21 In the present study, the parameters extracted and selected by our model were based on second-order statistics; this allowed for identification of more detailed features than a histogram, which is based on first-order statistics.
The two radiomics signatures selected by the regression model belonged to the GLCM parameters and RLM parameters, respectively. The former represents the joint probability with which certain sets of pixels contain certain gray-level values. The latter is defined as the number of runs with gray-level pixels (i) and the run length (j) for a given direction (θ). Both signatures exhibit certain differentiating power of images. The inverse difference moment represents the homogeneity of the image. This is a measurement used to assess the randomness of image intensity; the value is high when the local gray level is uniform. RLM parameters reflect the texture of an image (either “thick” or “thin”). Short-run emphasis measures the short-length texture of the image; the value is higher when the image has more short-length textures. Run-length nonuniformity measures the comparability of any runs in the image; the value is high when the two groups of images feature a similar ratio of long- and short-run textures. Texture differences can be used to explain the heterogeneity of cells found when studying tumors. In the present study, the differences in pituitary texture may have been related to the cell distribution of the anterior lobe and to the hormone storage of the posterior lobe.
We used AnalysisKit software (GE Healthcare) to extract these parameters and establish the radiomics model to predict ICPP, which is unlike the previous macroscopic methods used to measure and evaluate the pituitary. We employed texture analysis based on second-order statistics to compare the homogeneity and uniformity of the gray-level intensity between the two groups (control and ICPP groups). This is the first time this method has been used, and it revealed the correlation between gonadal hormone concentrations and the texture parameters of the pituitary. This holds great potential for further research.
Limitations
This study has some limitations. First, the number of participants was relatively small; only the predictive ability of the radiomics score was evaluated. Building a prediction model and validating it with a larger sample size is mandatory. Second, the pituitary gland is divided into the adenohypophysis and neurohypophysis. On the one hand, the pituitary volume is too small to perform accurate segmentation; on the other hand, pituitary texture heterogeneity may explain the differences in the signal between the anterior and posterior lobes. We will solve this problem by maintaining the signal-to-noise ratio and reducing the field of view during MRI scans. Finally, we did not apply gray-level discretization, which will influence the texture matrix calculation. We will process gray-level discretization in a subsequent study. Despite these limitations, we hope that our experiences will contribute to future MRI evaluations of the pituitary in patients suspected to have ICPP. Future work will focus on building a predictive model and validating that model.
Conclusions
The radiomics signature provided quantitative indicators that can be used in the preliminary screening of ICPP and to analyze the imaging features of the pituitary. Our study indicates that radiomics-based diagnosis and assessment may be more accurate than traditional imaging measurements of the pituitary. Therefore, the combination of a radiomics score with PH measurements can enhance the diagnostic imaging and evaluation of the pituitary.
Footnotes
Acknowledgements
English-language editing of this manuscript was provided by Journal Prep Services. The authors thank Peipei for providing statistical assistance.
Declaration of conflicting interest
The authors declare that there is no conflict of interest.
Funding
This work was supported by the National Natural Science Foundation of China (No. 81871337), the Health Commission for Zhejiang Province (Nos. 2020RC002 and 2020KY406), and the Key Laboratory of Clinical Cancer Pharmacology and Toxicology Research of Zhejiang Province (No. 2020E10021).