
Abstract
Objective
Automated systems are needed for the rapid and accurate diagnosis of Pseudomonas-associated nosocomial infections among critically ill patients admitted to the intensive care unit. We assessed the performance of TDR-300B and VITEK®2 for the identification of P. aeruginosa using VITEK®-MS as the gold standard.
Methods
This analytical study employed a cross-sectional approach. First, 44 clinical isolates of P. aeruginosa were collected and refreshed. Next, a single colony of oxidase-positive, gram-negative rods (30 samples) was inoculated into a TDR-300B NF-64 card and VITEK®2 GN cassette for each isolate. Finally, bacterial identification was performed using VITEK®-MS for comparative analysis.
Results
Compared with the results for VITEK®-MS, the congruence rates for TDR-300B and VITEK®2 were 80.76% (21/26) and 92.30% (24/26), respectively. Further, high sensitivity was observed for TDR-300B and VITEK®2 (95.45% and 100%, respectively). In addition, TDR-300B had a lower positive predictive value and accuracy than VITEK®2, albeit without significance.
Conclusions
Conclusively, there were no significant differences regarding the diagnostic efficiency of TDR-300B and VITEK®2 for P. aeruginosa.
Introduction
Pseudomonas aeruginosa is a ubiquitous, Gram-negative opportunistic pathogen capable of thriving under myriad environmental conditions. 1 It causes serious nosocomial/hospital-acquired infections in humans, especially in those with compromised immune systems or pre-existing diseases. 2 The pathogen is the most commonly isolated microorganism in the clinical specimens of patients with respiratory tract infections, primarily including patients admitted to the intensive care unit (ICU) and those receiving mechanical ventilation. These patients are likely to experience ventilator-associated pneumonia, leading to high mortality rates.3–6 Further, the emergence of multidrug-resistant (MDR) strains has increased the incidence of life-threatening Pseudomonas infection globally. Therefore, it is critical to compare and assess the capability of the available diagnostics for identifying MDR strains in clinical samples.7–11
An efficient disease management program relies on the rapid and accurate diagnosis of causative agents. Unfortunately, this is hampered by the complexity and variability of sample types and volumes and analytical processes involved in routine testing procedures. With the advent of advanced diagnostics, most microbiology work-up algorithms are automated and computerized. 12 These systems generate faster and more precise results. VITEK®2 (BioMerieux, Marcy-l’Étoile, France) and TDR-300B (Mindray, Shenzhen, China) are highly efficient and robust bacterial diagnostic systems. Although there is substantial evidence for the reliability of VITEK®2 for bacterial identification, scarce data on the performance of the TDR-300B biochemical test array have been reported.13–16 In the present study, we evaluated and compared the diagnostic capability of TDR-300B and VITEK®2 to VITEK®-MS for the accurate identification of P. aeruginosa using clinical specimens.
Materials and methods
Study outline and specimen
This analytical study, which employed a cross-sectional approach, was performed to correlate the identification capabilities of TDR-300B and VITEK®2 in comparison with VITEK®-MS (BioMerieux). Forty-four clinical samples were procured from patients, especially those admitted to the ICU of Atma Jaya Catholic University of Indonesia (North Jakarta, Indonesia), between 2015 and 2018. These samples mainly comprised sputum samples along with non-sputum samples, including those from the appendix, blood, feces, eye scab, pus, throat, and urine. The samples were stored at −20°C until further use. Bacterial isolation was performed in a fully equipped microbiology laboratory (Microbiology Department, School of Medicine and Health Science, Atma Jaya Catholic University of Indonesia) according to standard procedures and guidelines. 17
Research ethics and patient consent
Clinical specimens were obtained with the prior informed consent of each patient. 18 The present study was performed according to the standard guidelines and approval of the Departmental Ethical Committee of the School of Medicine and Health Science, Atma Jaya Catholic University of Indonesia (Ethical approval number: 11/05/KEP-FKUAJ/2017).
Microbiology work-up and bacterial isolation
Phenotype identification exploits the observable morphological (e.g, cell shape, size, and arrangement, colony features, cell motility), cultural (e.g., size, shape, surface, elevation, edged, opacity, color, hemolysis, consistency), and biochemical characteristics (metabolic properties) of a microorganism using a manual, semi-automated, or automated technique. Conventionally, these include Gram staining, assessments of growth characteristics on solid-nutrient agar medium (e.g., blood agar, MacConkey agar), and biochemical metabolic tests (e.g., indole production test, citrate utilization test, oxidase test). 19
In all cases, microbial growth was allowed at 35 ± 2°C for 18–24 hours. After phenotype characterization, a single colony was isolated for each isolate and processed for further analysis.
Bacterial identification
The Gram-negative, oxidase-positive rods selected on blood agar and MacConkey agar were subjected to the semi-automated TDR-300B and fully automated VITEK®2 methods of identification. In this study, P. aeruginosa ATCC 27853 was used as a reference strain for identification using TDR-300B, VITEK®2, and VITEK®-MS.
In the semi-automated TDR-300B instrument, there are separate devices for specimen insertion, inoculation, incubation, and analysis with a manual loading of the specimen in each device. Specifically, the inoculated cultures (on the non-fermentative [NF]-64 card) are incubated outside the instrument. On the contrary, VITEK®2 is a fully automated instrument that allows microbial analysis and antimicrobial sensitivity tests on the same device. Both instruments perform automated identification and antimicrobial sensitivity test analysis.20,21
Inoculum preparation
Single colonies on the nutrient agar slant were selected and suspended in 2.5 mL of 0.45% sterile saline to adjust the bacterial suspension to a 0.5 McFarland turbidity standard using a densitometer (BioMérieux) according to the manufacturer’s instructions. Each bacterial suspension was prepared within 30 minutes of inoculation into the NF-64 card/gram-negative (GN) cassette for identification by TDR-300B or VITEK®2 (Figure 1). 22
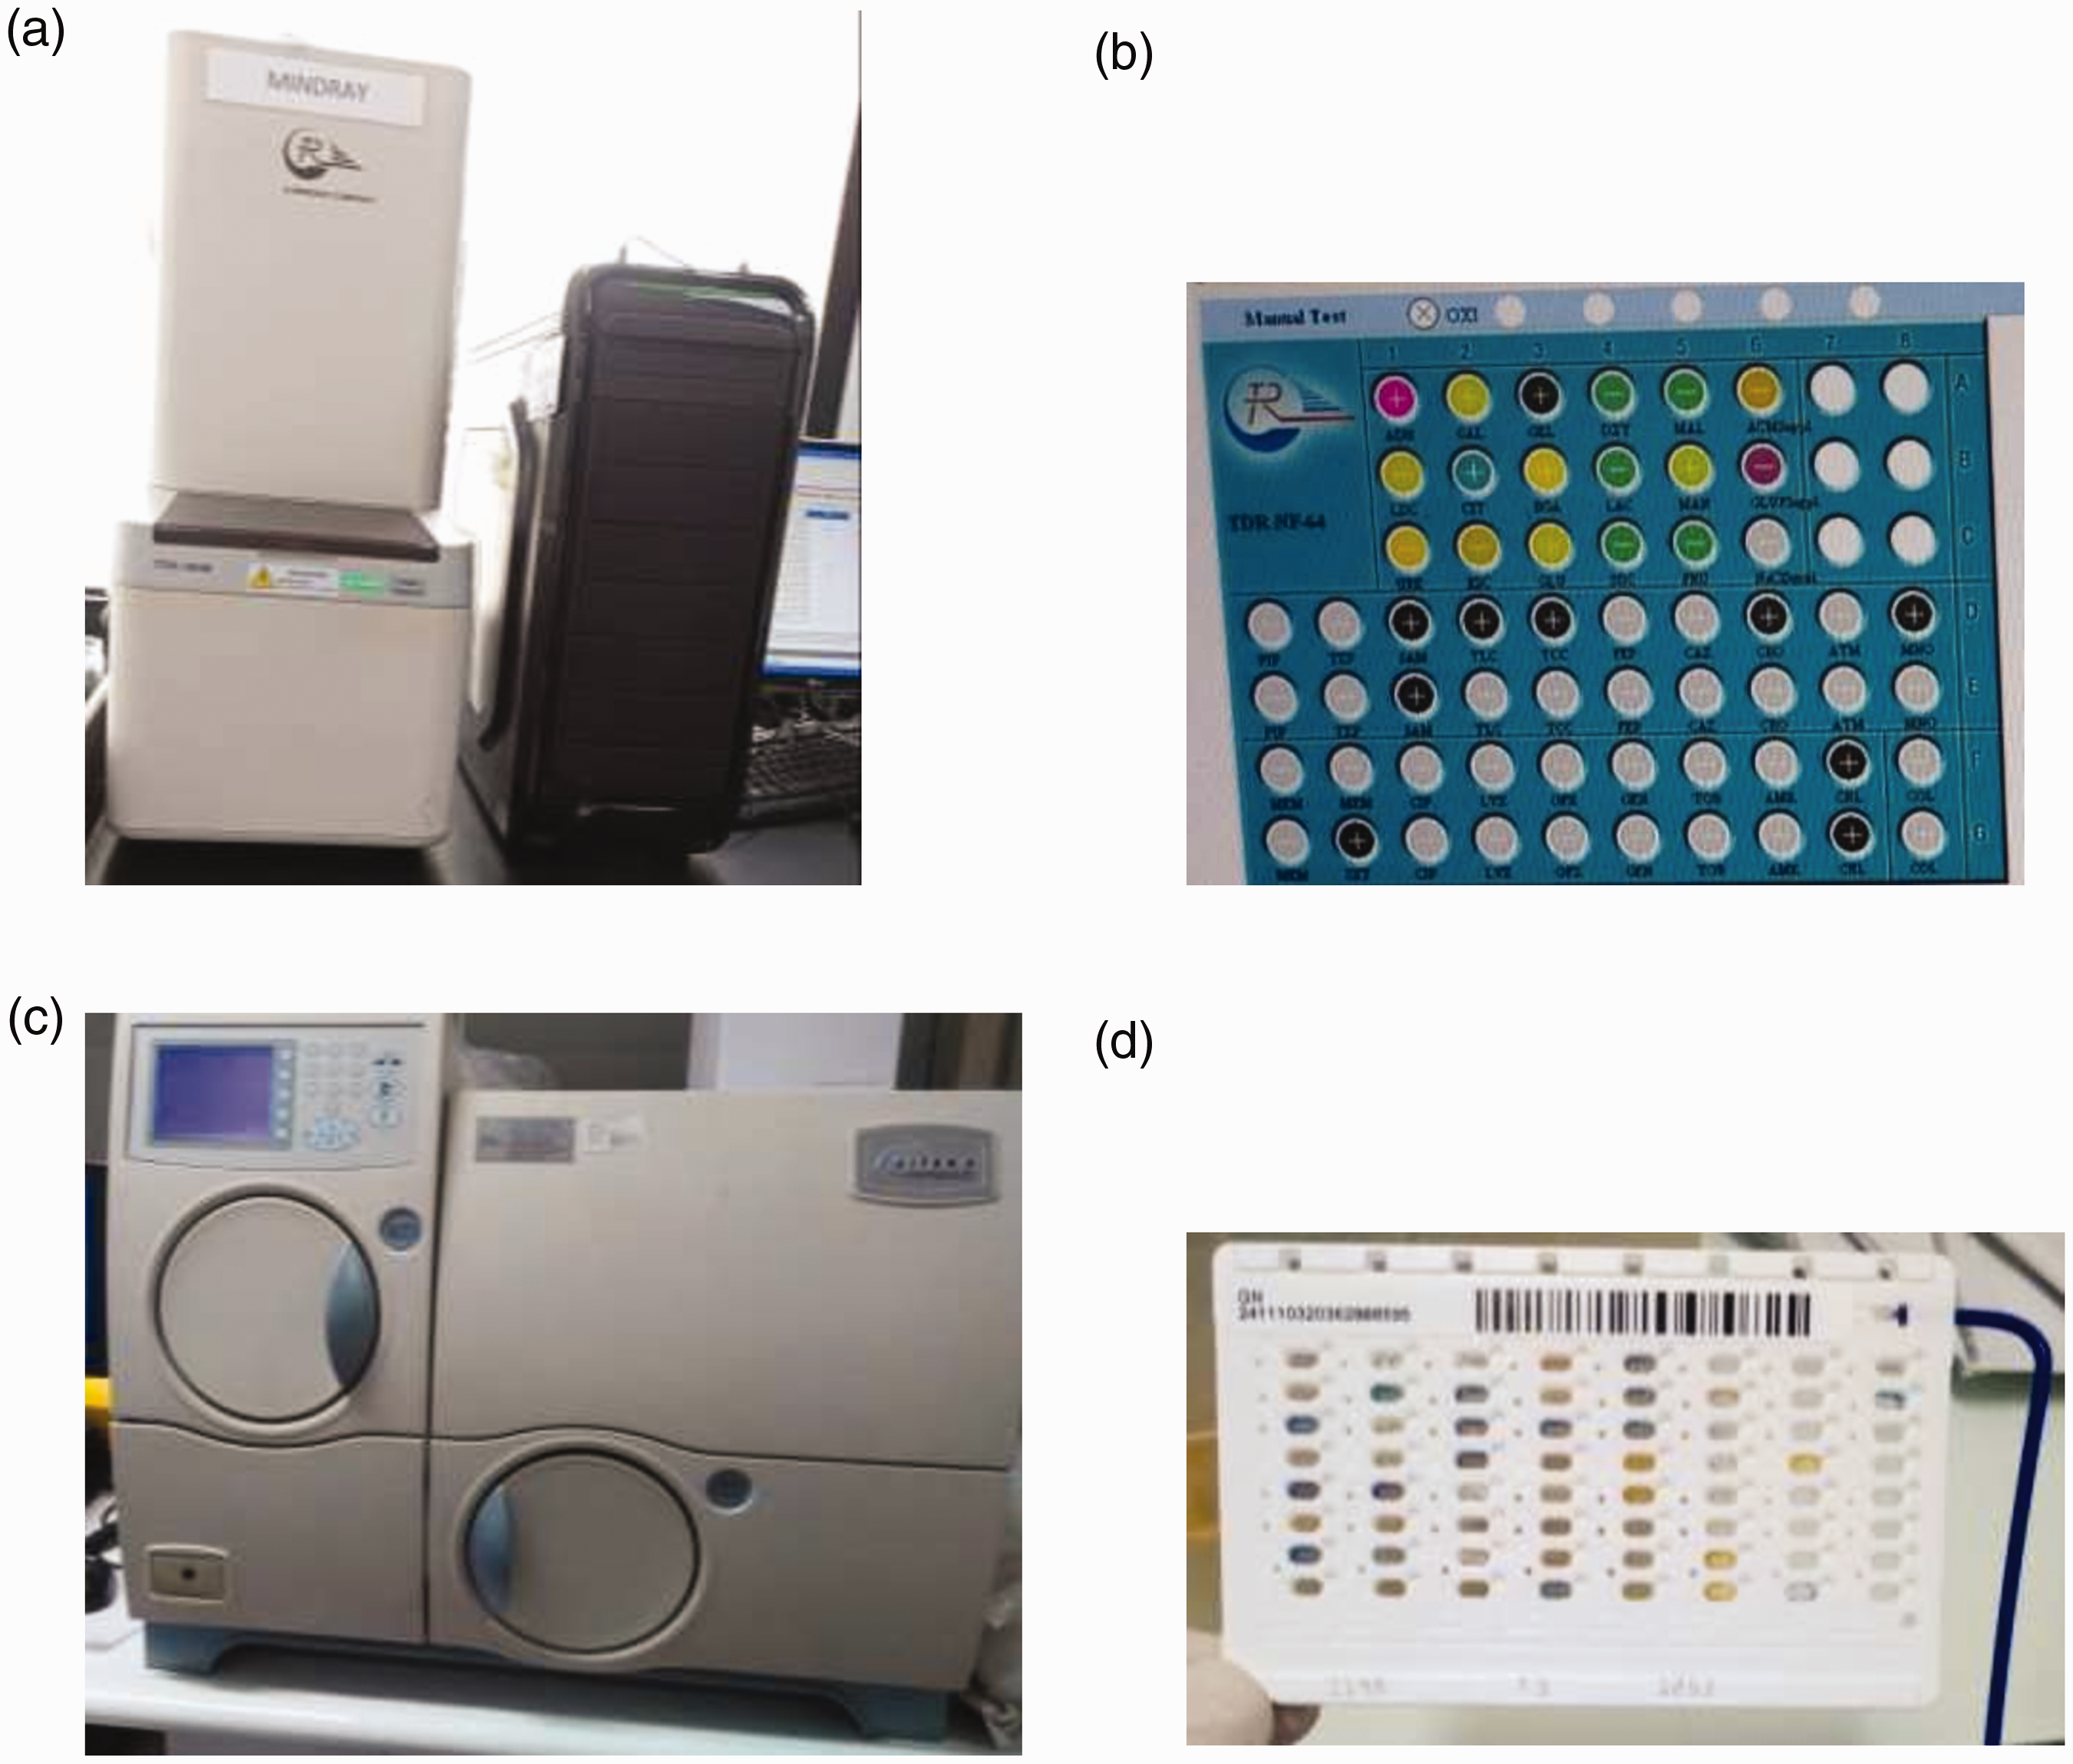
(a) TDR-300B and its (b) NF-64 card. (c) VITEK®2 and its (d) GN cassette
TDR-300B semi-automated identification method
Colonies on a nutrient agar slant were made suspended in a 0.5 McFarland solution and inoculated in the NF-64 card. The biochemical test array of the NF-64 card, which allows for 18 biochemical tests simultaneously, is presented in Table 1. The inoculated card was then incubated at 35 ± 2°C for 18 to 24 hours. TDR-300B Microorganism Analysis System version 1.0.0.7 software (Mindray) was used for reading.
Biochemical test array of the TDR-300B NF-64 card.

NF, non-fermentative.
VITEK®2 automated identification method
Bacterial suspensions (0.5–0.63 McFarland) were prepared and inoculated in the GN cassette. The biochemical test array of the GN cassette is presented in Table 2. The analysis was performed using VITEK®2 software version 07.01 (BioMérieux).
Biochemical test array of the VITEK®2 GN cassette.

GN, gram-negative.
VITEK®-MS standard automated identification method
VITEK®-MS was used as a gold standard for the identification of P. aeruginosa. Pure isolates were prepared on nutrient agar followed by a direct cell profiling for gram-negative bacteria. Accordingly, a single colony was selected for each isolate and spotted directly onto the target slide, which was immediately overlaid with the matrix solution. Finally, spectral analysis was performed using the Knowledge Base version 3.0 database and SpectraIdentifier R2.1.0 software (BioMérieux).
Statistical analysis
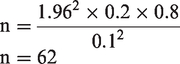
In this study, the sample size (n) was calculated as follows:

The accuracy interval applied was equal to 95%, and then Zα was 1.96. Using these values, the target sample size was calculated as follows:
The congruence between TDR-300B and VITEK®2 was analyzed using the interrater reliability test. Results were reported as the percent of agreement (Pa) or kappa value. Fisher’s exact test and Bayes’ formula were applied to compare the results obtained using TDR-300B and VITEK®2 with those obtained using VITEK®-MS.
The final identification results for TDR-300B and VITEK®2 were classified as (a) correct identification of an organism at the genus and species levels, (b) misidentified because of an incorrect identification, and (c) not identified when an acceptable level of identification was not achieved.
Results
Forty-four clinical isolates labeled as P. aeruginosa were retrieved in this study. After phenotype characterization, only 30 isolates could be processed for further analysis. The selected colonies were off-white, undulate, convex, medium, mucous, β-hemolytic, gram-negative bacilli with a negative MacConkey test and positive oxidase activity.
Performance of TDR-300B in the identification of P. aeruginosa
The accuracy of TDR-300B in the identification of P. aeruginosa was 87.09% (27/31 samples) at the genus and species levels, including the control strain (Table 3). The average probability of the phenotype, based on 18 biochemical tests, was 96.14% (confidence interval [CI] = 95%; standard deviation [SD] = 8.1%; variance = 0.66%). Among the 27 isolates identified as P. aeruginosa, four isolates had a probability value below the deviation range. In addition, these isolates exhibited different biochemical activities in the galactose, 2-nitrophenyl-β-
Identification of P. aeruginosa by TDR-300B, VITEK®2, and VITEK®MS.

Performance of VITEK®2 in the identification of P. aeruginosa
VITEK®2 correctly identified P. aeruginosa in 28 samples, including the control strain, giving an accuracy of 96.77% (30/31 isolates) at the genus level and 90.32% (28/31 isolates) at the species level (Table 3). The average probability of the phenotype based on 47 biochemical tests was 96.97% (CI = 95%; SD = 3.98%; variance = 0.16%). Among the 28 isolates identified as P. aeruginosa, one isolate had a probability value below the deviation range. Additionally, differences were observed in the biochemical reactions for β-N-acetyl-glucosaminidase,
TDR-300B versus VITEK®2
The congruency values for TDR-300B and VITEK®2 at the genus and species levels were 83.87% (26/31 isolates) and 80.64% (25/31 isolates), respectively (Table 3). This incongruence at the species level occurred because of a mismatch for two isolates, namely P. aeruginosa and P. putida. In the biochemical test arrays in TDR-300B (NF-64 card) and VITEK®2 (GN cassette), similar results were obtained for only nine tests: xylose, glucose fermentation, mannitol, urea, glucose oxidation, maltose, sodium citrate, sucrose, and lysine (Table 4). Because most of these tests produced either positive or negative results using TDR-300B (NF-64 card) and VITEK®2 (GN cassette), only Pa could be evaluated. Both the NF-64 card and GN cassette generated negative results for the urea (70.96%), glucose oxidation (90.32%), maltose (93.54%), sodium citrate (93.54%), sucrose (93.54%), and lysine tests (96.77%) with a good to almost perfect Pa (Pa > 60%) for these tests (Table 4). Furthermore, none to fair Pa (Pa < 0% to 45%) was observed for the xylose (6.5%), glucose fermentation (29.03%), and mannitol tests (42.85%) (Table 4). In addition, the TDR-300B NF-64 card produced more positive results for these biochemical tests than the VITEK®2 GN cassette (Table 4).
Agreement for nine biochemical tests between TDR-300B and VITEK®2.
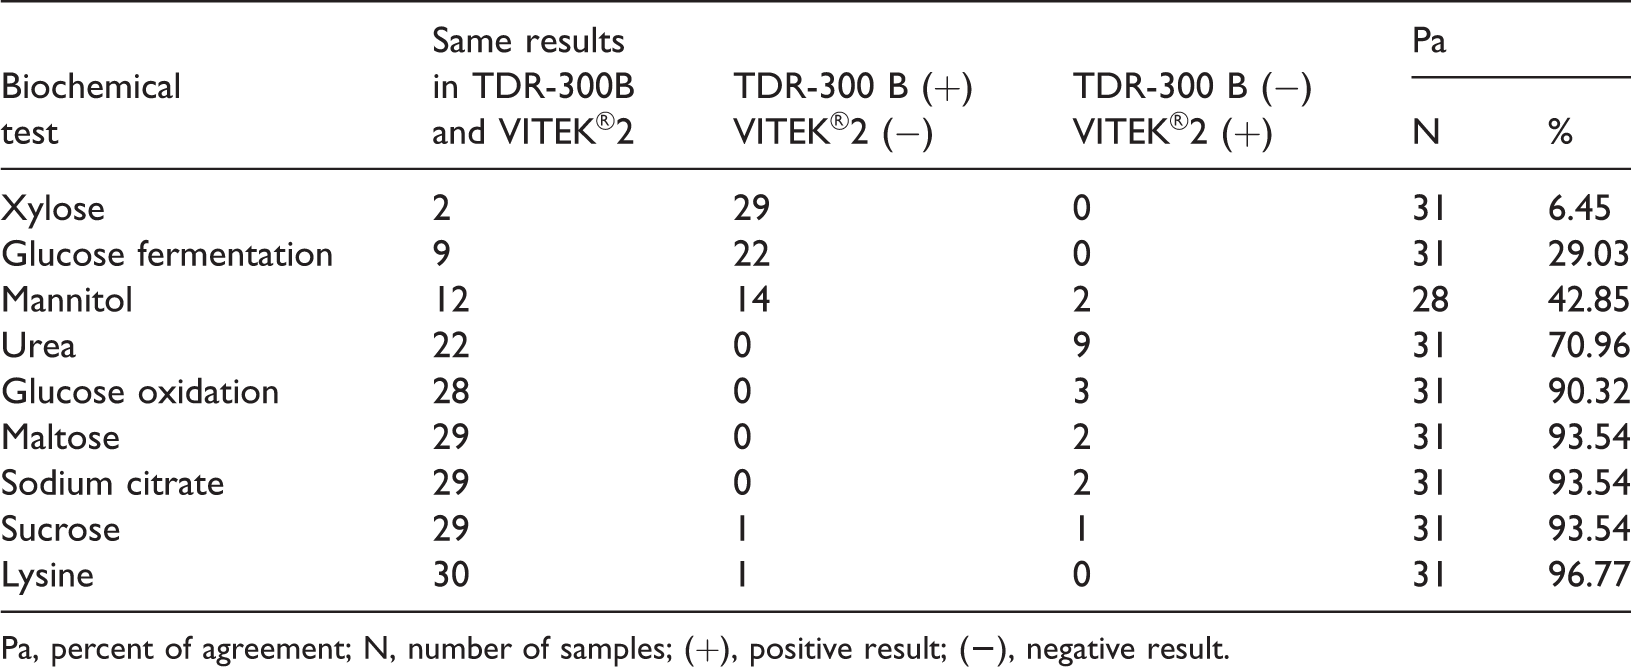
Pa, percent of agreement; N, number of samples; (+), positive result; (
VITEK®-MS was also employed for the identification of the retrieved clinical isolates. Of the 31 clinical isolates, 25 samples were identified as P. aeruginosa, one was identified as P. putida, and the others were labeled as ‘not identified’ (Table 3). In this context, ‘not identified’ implies that an acceptable level of identification was not achieved. Although the positivity rate was 100% (26/26) at the genus level, it was 96.15% (25/26) at the species level.
Relative to VITEK®-MS, TDR-300B exhibited congruence for 84.61% (22/26) and 80.76% (21/26) of the samples at the genus and species levels, respectively. The incongruence at the species level resulted from the misidentification of five isolates: S. putrefaciens, C. meningosepticum, S. maltophilia, A. baumannii, and P. aeruginosa. These were identified as P. aeruginosa (four isolates) or P. putida (one) by VITEK®-MS. Further, VITEK®2 had congruence rates of 96.15% (25/26) and 92.3% (24/26) at the genus and species levels, respectively. The incongruence at the species level resulted from two misidentified isolates, namely B. pseudomallei and P. putida. On the contrary, these were identified as P. aeruginosa by VITEK®-MS.
The diagnostic capabilities of TDR-300B and VITEK®2 were compared with those of VITEK®-MS. Although TDR-300B had high sensitivity (95.45%), the value was 100% for VITEK®2 (Table 5). In addition, TDR-300B had a numerically lower positive predictive value (PPV) and accuracy (84% and 80.77%, respectively) than VITEK®2 (92% and 92.31%, respectively). However, the differences were not significant according to Fisher’s exact test. Thus, there were no significant differences observed in the diagnostic capabilities of TDR-300B and VITEK®2 regarding the identification of P. aeruginosa in the clinical isolates.
Diagnostic capability of TDR-300B and VITEK®2 compared with VITEK®MS.

PPV, positive predictive value; CI, confidence interval; SD, standard deviation.
Discussion
P. aeruginosa is a clinically important bacterium that is frequently isolated from the clinical specimens of patients admitted to the ICU. 2 In the present study, the congruence of TDR-300B and VITEK®2 was high at the genus and species levels, i.e., 83.87% (26/31 isolates) and 80.64% (25/31 isolates), respectively (Table 3). The incongruence at the species level was 19.35% (6/31 isolates), which occurred because of a mismatch for six isolates, namely S. putrefaciens, B. pseudomallei, P. aeruginosa, C. meningosepticum, S. maltophilia, and A. baumannii. In terms of the identification of P. aeruginosa, TDR-300B and VITEK®2 had similar average probabilities (96.14% and 96.97%, respectively). The species tested exhibited a biochemical test pattern with a high CI. The databases and biochemical contents in each card contributed to the identification results for the bacterial species. The TDR-300B NF-64 card, with only 18 biochemical tests, displayed a greater tendency to misidentify P. aeruginosa as than VITEK®2 featuring the GN-cassette (47 biochemical tests). Moreover, agreement was observed for only nine biochemical tests between TDR-300B and VITEK®2. Although good to perfect Pa was noted for six tests (maltose, lysine, sodium citrate, glucose oxidation, sucrose, and urea), a low Pa was observed for the mannitol, glucose fermentation, and xylose tests.
Paim et al. 23 investigated the performance of VITEK®2 for the identification of gram-positive cocci and compared the results with the conventional methods of identification. Their results illustrated that VITEK®2 correctly identified Staphylococcus, Enterococcus, and Streptococcus isolates at the genus (97.1%) and species levels (77.9%). These results corroborated the findings of Ligozzi et al., 22 who found that VITEK®2 identified S. aureus, S. agalactiae, S. pneumoniae, E. faecalis, and S. haemolyticus with >90% accuracy at the species level. Wani et al. 24 reported an overall concordance of 91.1% for the manual conventional method versus VITEK®2 in the identification of gram-negative bacteria. Concordant identification was observed for Klebsiella pneumoniae, Acinetobacter lwoffii, Citrobacter freundii, Enterobacter cloacae, P. aeruginosa, and Salmonella enterica subsp. enterica serotype Typhimurium isolates. O’Hara et al. and Hernandez et al.25,26 compared the accuracy of VITEK®2 against MicroScan WalkAway® SI for bacterial identification. In their analyses, 54 bacterial strains including 20 gram-positive cocci and 34 gram-negative rods were isolated from hospitalized patients. In total, 89.5% of isolates were correctly identified at the species level by both systems. Although there is substantial evidence of the reliability of VITEK®2 for bacterial identification, scarce information about the performance of the TDR-300B biochemical test array has been reported.13–16 In the present study, VITEK®2 had higher sensitivity (100%), accuracy (92.31%), and PPV (92.00%) than TDR-300B (95.45%, 80.77%, and 84.00%, respectively). Furthermore, Fisher’s exact test revealed no significant differences between TDR-300B and VITEK®2. Because only isolates previously identified as P. aeruginosa were included in the present study, specificity and negative predictive value were not calculated.
Certain limitations of this study must be noted. This pilot study was conducted using limited available samples (sputum samples along with non-sputum samples such as the appendix, blood, feces, eye scab, pus, throat, and urine) procured from patients, particularly those admitted to the ICU of Atma Jaya Catholic University of Indonesia, between 2015 and 2018. To our dismay, only 44 clinical isolates (labeled as P. aeruginosa) were retrieved in this study after applying the inclusion criteria. The limited number of samples may have affected the statistical accuracy of the results, which could be overcome with a larger number of samples.
The correct identification of microbial species relies on a combination of approaches including phenotypic and molecular techniques. In this pilot study, the isolates were identified using TDR-300B and VITEK®2 biochemical test-based diagnostic systems, and the results were compared with those of VITEK®-MS, an automated MALDI-TOF mass spectrometry method. Although VITEK®-MS is a robust, rapid, accurate, and cost-effective diagnostic platform, molecular tests are entrusted for the final confirmation of the identified species.27–29 Unfortunately, in a developing country such as Indonesia, it is not feasible to adopt a combination of various approaches because of economic constraints and thus, biochemical diagnostics are preferred in routine microbial diagnosis. Finally, employing molecular tests for the confirmation of all isolates used for the comparison of the diagnostic systems is emphasized, which is a limitation of this study.
Conclusion
There were no significant differences observed between TDR-300B and VITEK®2 in the identification of P. aeruginosa using clinical samples. However, further studies focused on the identification of a relatively large number of clinical isolates using a combination of phenotypic and molecular approaches are required for a statistically significant comparative analysis of these biochemical test-based diagnostic systems.
Footnotes
Acknowledgements
We thank the School of Medicine, Atma Jaya Catholic University of Indonesia for providing all necessary support. We are grateful to Dr. Lely Saptawati of Moewardi Hospital (Surakarta, Indonesia) for experimental support.
Declaration of conflicting interest
The authors declare that there is no conflict of interest.
Funding
This research received no specific grant from any funding agency in the public, commercial, or not-for-profit sectors.
Author contributions
LHM, ET, and HP: Conceptualization, visualization, methodology, validation, and data curation. SJ: Formal analysis, data curation, original draft preparation, review, and editing. DE and TR: Methodology, data curation, and formal analysis. LHM: Supervision. All authors contributed significantly to the study, and all authors have approved the final manuscript.
Data availability
All relevant data is present in the manuscript, and the same is accessible for the peer-review process.