
Abstract
Objective
To examine the value of ultrasound (US) in the diagnosis of carpal tunnel syndrome (CTS) in the Vietnamese population.
Methods
This prospective cross-sectional study involved 42 wrists of 25 patients with idiopathic CTS evaluated by US. In addition, 38 wrists of 22 healthy volunteers were included as the control group.
Results
Significant differences in the median nerve cross-sectional area (CSA) at different levels were found between patients with CTS and controls. Using a cut-off value of 9.5 mm2 for the median nerve CSA at the pisiform (p-CSA), US had a sensitivity and specificity of 95.2% and 97.4%, respectively, for the diagnosis of CTS. Area under the curve analysis revealed a sensitivity and specificity of 100% and 95.4%, respectively, for the prediction of severe CTS using a p-CSA of >15.5 mm2.
Conclusions
The median nerve CSA is a highly accurate parameter in the diagnosis of CTS. We recommend using a p-CSA of >9.5 mm2 as a diagnostic criterion for CTS and a p-CSA of >15.5 mm2 as a marker for severe CTS in the Vietnamese population.
Research Registry number: 7261
Keywords
Introduction
Carpal tunnel syndrome (CTS), also known as median nerve entrapment syndrome at the wrist level, is the most common type of peripheral nerve compression. 1 Among the United States population, the annual prevalence and incidence of CTS is 3% to 8% and 100 to 300/100,000, respectively.2,3 CTS is common among women, with most cases occurring in those aged 46 to 60 years. 4 Most affected patients have primary CTS (also known as idiopathic CTS). According to the American Association of Neuromuscular & Electrodiagnostic Medicine, a clinical diagnosis of CTS is based on functional signs and physical tests, and in suspected cases, an electrophysiological study is indicated to achieve a definitive diagnosis. 5 However, electrophysiological studies are unable to distinguish primary CTS from secondary CTS. Therefore, several studies have been performed to explore the diagnostic value of different imaging techniques, especially high-resolution ultrasound (US), for the early diagnosis and grading of CTS.
High-resolution US is a highly valuable diagnostic tool for CTS. US is increasingly being used to confirm the diagnosis of CTS through the measurement of quantitative parameters and to detect pathologies that can result in secondary CTS, especially in structures around the median nerve and carpal tunnel (e.g., anatomical variants or space-occupying lesions). This is achieved by direct assessment of the exact location of the nerve compression and examination of signs indirectly related to nerve alterations. 6 Applying color and power Doppler US is especially helpful in identifying vascular lesions, variant vascular anatomy, and tissue hyperemia. 7 In particular, color and power Doppler imaging can be used in routine US examination to detect intraneural vascularity, which indicates the presence of inflammatory changes within the nerve.8,9
Several new sonographic techniques, such as dynamic US and US elastography, have been developed in recent years and have the potential to differentiate CTS of different severities.10–12 However, the ultrasonic morphology of the carpal tunnel, including the anatomy of the median nerve, may vary according to ethnicity, sex, and age.13,14 Cut-off values specific to different ethnic groups would be of great benefit for practicing clinicians and radiologists. Therefore, this study was performed to investigate the value of US in assessing idiopathic CTS in the Vietnamese population, with correlations to clinical and electrophysiological findings.
Patients and methods
Patients and controls
This was a prospective cross-sectional study. The sample comprised 42 wrists of 25 patients with CTS (5 men, 20 women; mean age, 46.6 ± 10.5 years), among whom 17 patients had bilateral disease and 8 patients had unilateral disease. In addition, 38 wrists of 22 healthy volunteers (4 men, 18 women; mean age, 43.6 ± 9.7 years) were included as the control group. The inclusion criteria were a clinical diagnosis of CTS and subsequent confirmation by a nerve conduction study according to the American Academy of Neurology standards. 15 The exclusion criteria were conditions that increased the risk of secondary CTS, such as diabetes mellitus, gout, inflammatory arthropathy, previous distal radial fractures, acute trauma, neurological diseases, pregnancy, hypothyroidism, and hyperthyroidism; receipt of regular medical treatment (such as nonsteroidal anti-inflammatory drugs) or engagement in physical therapy within the previous month; and receipt of a steroid injection within the previous 3 months. Twelve wrists underwent subsequent surgical carpal tunnel release.
This study was approved by the ethics committee of the University of Medicine and Pharmacy, Hue University, Hue, Vietnam (Approval No. H2020/159; date of approval, 5 June 2020). All participants provided written informed consent for participation in the study and publication of their images. In error, we did not prospectively register this study; however, we have now registered it retrospectively at the Research Registry (https://www.researchregistry.com/, registration number 7261). The reporting of this study conforms to the STROBE guidelines. 16
Clinical and electrophysiological studies
The participants were evaluated using the Boston Carpal Tunnel Questionnaire (BCTQ), which includes both functional and symptom BCTQ scores. 17 The patients subsequently underwent a nerve conduction study. The diagnosis of CTS was made according to the American Association of Electrodiagnostic Medicine and the American Academy of Neurology. 18 CTS was classified as mild, moderate, or severe based on the electrophysiological study results. 19
Ultrasound technique and analysis
All US examinations were performed by two radiologists, one with 15 years of experience and the other with 5 years of experience, using a high-resolution linear-array 12.3-MHz transducer (Samsung HS70A; Samsung Healthcare, Seoul, Korea). The radiologists were blinded to the clinical and electrophysiological findings. The wrists were examined in the supine neutral position with the participant’s hand and wrist resting on a table and the fingers in a functional and relaxed position. US of the volar distal forearm, wrist, and carpal regions was performed mainly in the transverse and longitudinal planes. All US parameters were measured in each patient and control. The cross-sectional area (CSA) of the median nerve was measured at three levels: the distal radioulnar joint (DRUJ-CSA, approximately 2 cm above the distal wrist crease), the pisiform (p-CSA), and the hook of the hamate (h-CSA). The neural epineurium was not included in the measurement because of its obscured outer border. The ratio change in the median nerve CSA (R-CSA) was calculated as p-CSA divided by DRUJ-CSA (p-CSA/DRUJ-CSA) and the difference between p-CSA and DRUJ-CSA (ΔCSA). The flattening ratio of the median nerve was defined as the ratio of the major and minor axes of the median nerve at the level of the pisiform. The flexor retinaculum thickness at the level of the hook of the hamate was also measured. All parameters were measured by gray-scale US (Figure 1). Color and power Doppler US was used to observe pulse points in the median nerve to estimate the vascularity score (Klauser and Shio’s method). 20

Cross-sectional area of the median nerve at the (a) distal radioulnar joint (arrow), (b) pisiform (arrow), and (c) hook of the hamate (arrow). (d) The flattening ratio of the median nerve was calculated by measuring the major and minor axes of the nerve at the pisiform (arrow).
Statistical analysis
The statistical data analysis was performed using IBM SPSS Statistics for Windows, Version 20.0 (IBM Corp., Armonk, NY, USA). The mean age, body mass index, and different sonographic parameters along the carpal tunnel were calculated. A p-value of <0.05 was considered statistically significant. Quantitative values are expressed as mean ± standard deviation. The normality of quantitative data was evaluated using the Kolmogorov–Smirnov test. Spearman’s coefficient was used to examine the correlation of the data. A receiver operating characteristic curve was plotted to calculate the performance of sonographic criteria for the diagnosis of CTS.
Results
General features
There was no significant difference in age, sex, or body mass index between the patients with CTS and controls (Table 1). The participants’ main occupations were teacher, marine worker, worker, and homemaker.
Age, BMI, sex, electrophysiological findings, and BCTQ scores, and ultrasound parameters in the control and patient groups.
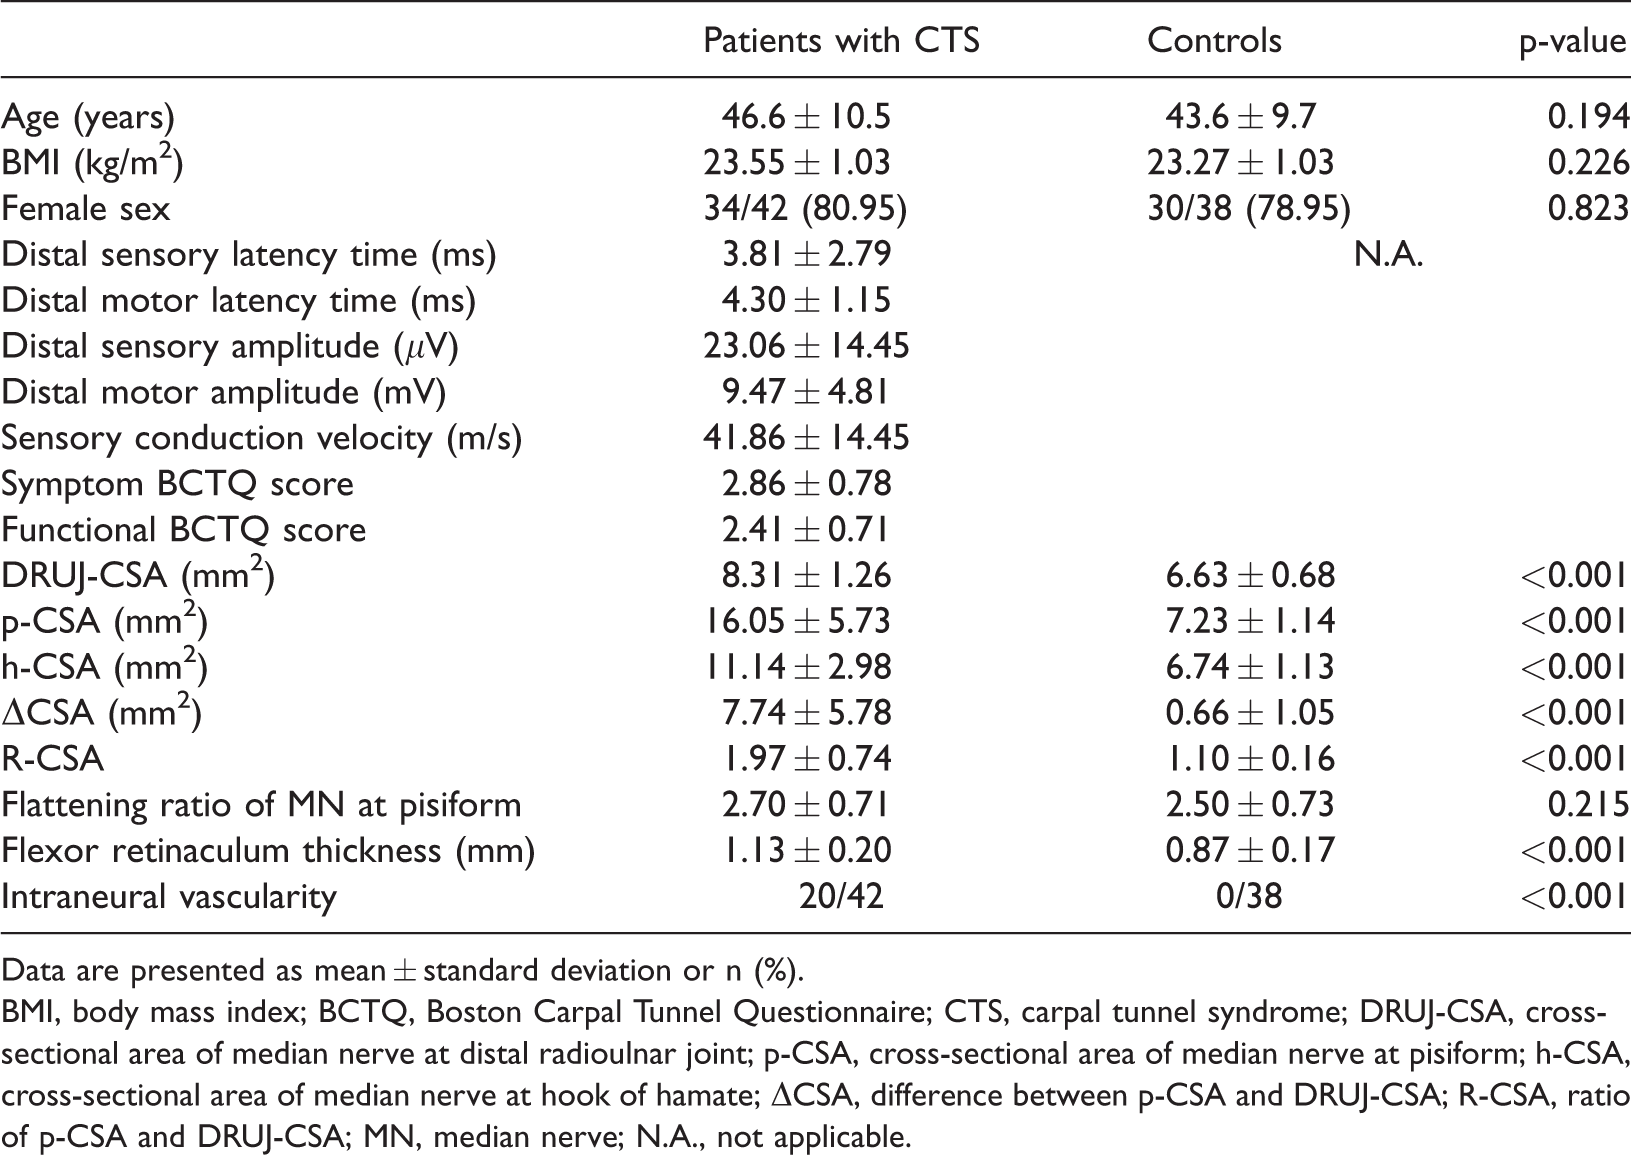
Data are presented as mean ± standard deviation or n (%).
BMI, body mass index; BCTQ, Boston Carpal Tunnel Questionnaire; CTS, carpal tunnel syndrome; DRUJ-CSA, cross-sectional area of median nerve at distal radioulnar joint; p-CSA, cross-sectional area of median nerve at pisiform; h-CSA, cross-sectional area of median nerve at hook of hamate; ΔCSA, difference between p-CSA and DRUJ-CSA; R-CSA, ratio of p-CSA and DRUJ-CSA; MN, median nerve; N.A., not applicable.
Clinical findings
For patients with CTS, the mean symptom BCTQ score was 2.86 ± 0.78 and the mean functional BCTQ score was 2.41 ± 0.71 (Table 1).
Only five wrists (11.9%) had thenar atrophy. None of the control participants showed thenar atrophy. Thenar atrophy had a specificity and positive predictive value of 100%.
Electrophysiological findings
In total, 35.7% of patients had severe CTS according to the electrophysiological classification. The mean values of the symptom and functional conduction parameters of the median nerve in the CTS group are listed in Table 1.
Both the symptom and functional BCTQ scores were significantly higher in the severe group than in the mild and moderate groups according to the electrophysiological staging (p < 0.005). There was a significant relationship between both the clinical and electrophysiological stages and US parameters such as the p-CSA, ΔCSA, R-CSA, and intraneural vascularity score (p < 0.05) (Table 3).
Sonographic findings
Median nerve CSA
The DRUJ-CSA, p-CSA, h-CSA, ΔCSA, and R-CSA were significantly higher in the patients than in the controls (p < 0.001 for all) (Table 1). Using the area under the curve (AUC), a p-CSA cut-off value of 9.5 mm2 provided a diagnostic sensitivity and specificity of 95.2% and 97.4%, respectively. A ΔCSA cut-off value of >2.5 mm2 provided a sensitivity and specificity of 88.1% and 97.4%, respectively. An R-CSA cut-off value of >1.29 provided a sensitivity and specificity of 88.1% and 92.1%, respectively (Table 2).
Cut-offs with sensitivity and specificity of ultrasound parameters in patients with CTS.

CTS, carpal tunnel syndrome; AUC, area under the curve; DRUJ-CSA, cross-sectional area of median nerve at distal radioulnar joint; p-CSA, cross-sectional area of median nerve at pisiform; h-CSA, cross-sectional area of median nerve at hook of hamate; ΔCSA, difference between p-CSA and DRUJ-CSA; R-CSA, ratio of p-CSA and DRUJ-CSA; MN, median nerve.
Relationships of ultrasound parameters with clinical stage and electrophysiological stage.
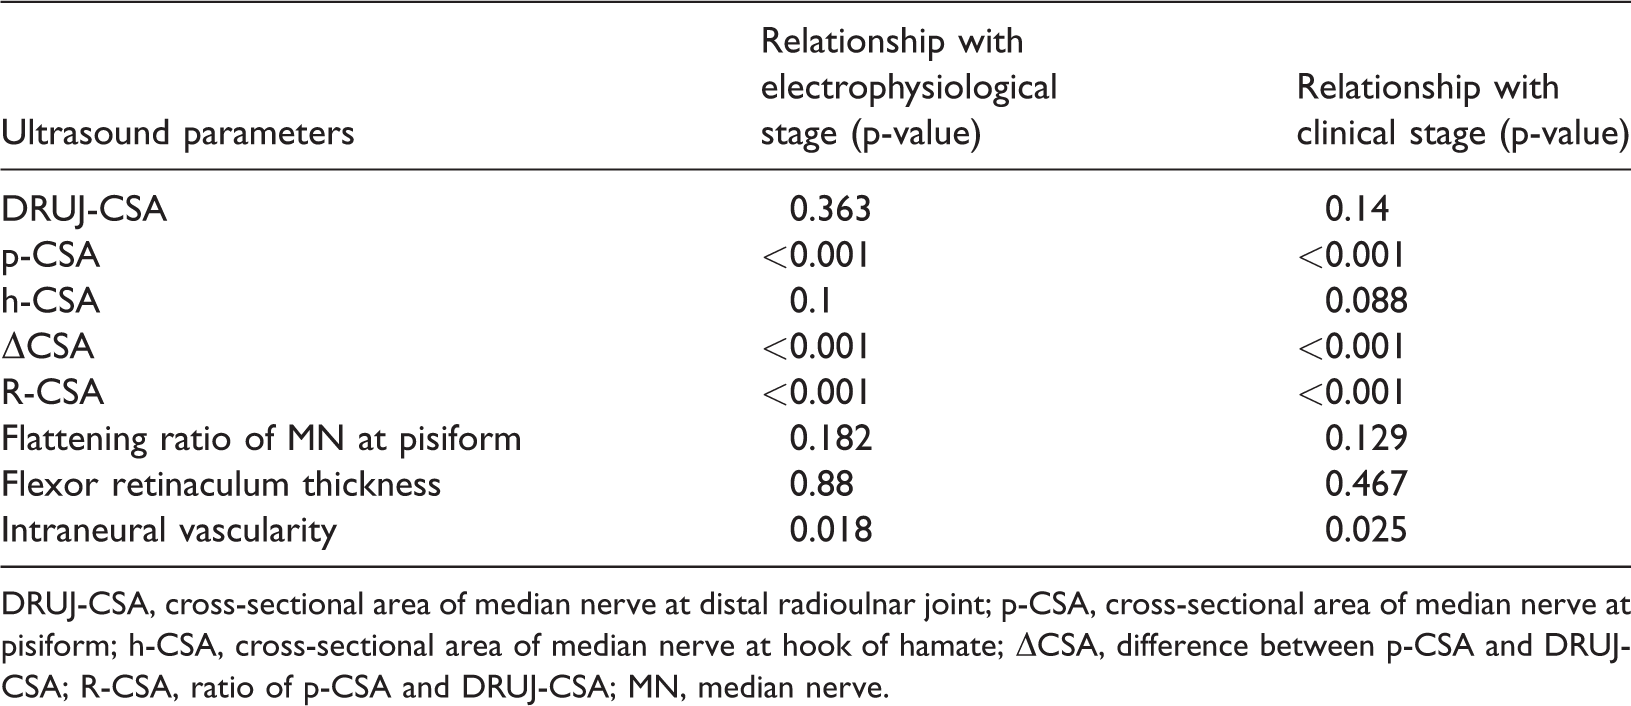
DRUJ-CSA, cross-sectional area of median nerve at distal radioulnar joint; p-CSA, cross-sectional area of median nerve at pisiform; h-CSA, cross-sectional area of median nerve at hook of hamate; ΔCSA, difference between p-CSA and DRUJ-CSA; R-CSA, ratio of p-CSA and DRUJ-CSA; MN, median nerve.
Significant differences in the median nerve CSA at the pisiform (Figure 2) were found among patients with mild, moderate, and severe CTS (p < 0.001) compared with the electrophysiological findings. Using a cut-off value of >15.5 mm2 for p-CSA and >5.5 mm2 for ΔCSA provided a diagnostic sensitivity of 100% and 100% and specificity of 95.4% and 86.2% for severe CTS, respectively.

(a) Axial and (b) sagittal planes through the median nerve at the wrist level on ultrasound (arrow).
Flattening ratio of the median nerve
No significant difference in the flattening ratio at the pisiform was found between the two groups (Table 1).
Flexor retinaculum thickness
The flexor retinaculum thickness was significantly greater in the patients than in the controls (p < 0.001) (Table 1).
Intraneural vascularity
Twenty (41.7%) of the 42 wrists with CTS had demonstrable intraneural vascularity (Figure 3) compared with none of the 38 control participants’ wrists (p < 0.001) (Table 1). The sensitivity and specificity of intraneural vascularity for diagnosing CTS were 47.6% and 100%, respectively (Table 2).

Axial ultrasound image of median nerve enlargement with intraneural vascularity by color and power Doppler in two patients with carpal tunnel syndrome (arrow).
Correlations of ultrasonic parameters with clinical scale and electrophysiological parameters
There was a high positive correlation of the p-CSA, ΔCSA, and R-CSA of the median nerve with both the symptom and functional BCTQ scores (0.6 < r < 0.8, p < 0.001). There was a weak correlation of the vascularity score of the median nerve with the symptom and functional BCTQ scores (Tables 3 and 4). In particular, there were strong positive correlations of both the p-CSA and ΔCSA and the symptom BCTQ score (r = 0.72, p < 0.001). There was a moderate negative correlation of the sensory conduction velocity parameter with the p-CSA, ΔCSA, and R-CSA electrophysiologically (r > 0.4, p < 0.01) (Table 4).
Correlations of ultrasound parameters with BCTQ scores and electrophysiological parameters.
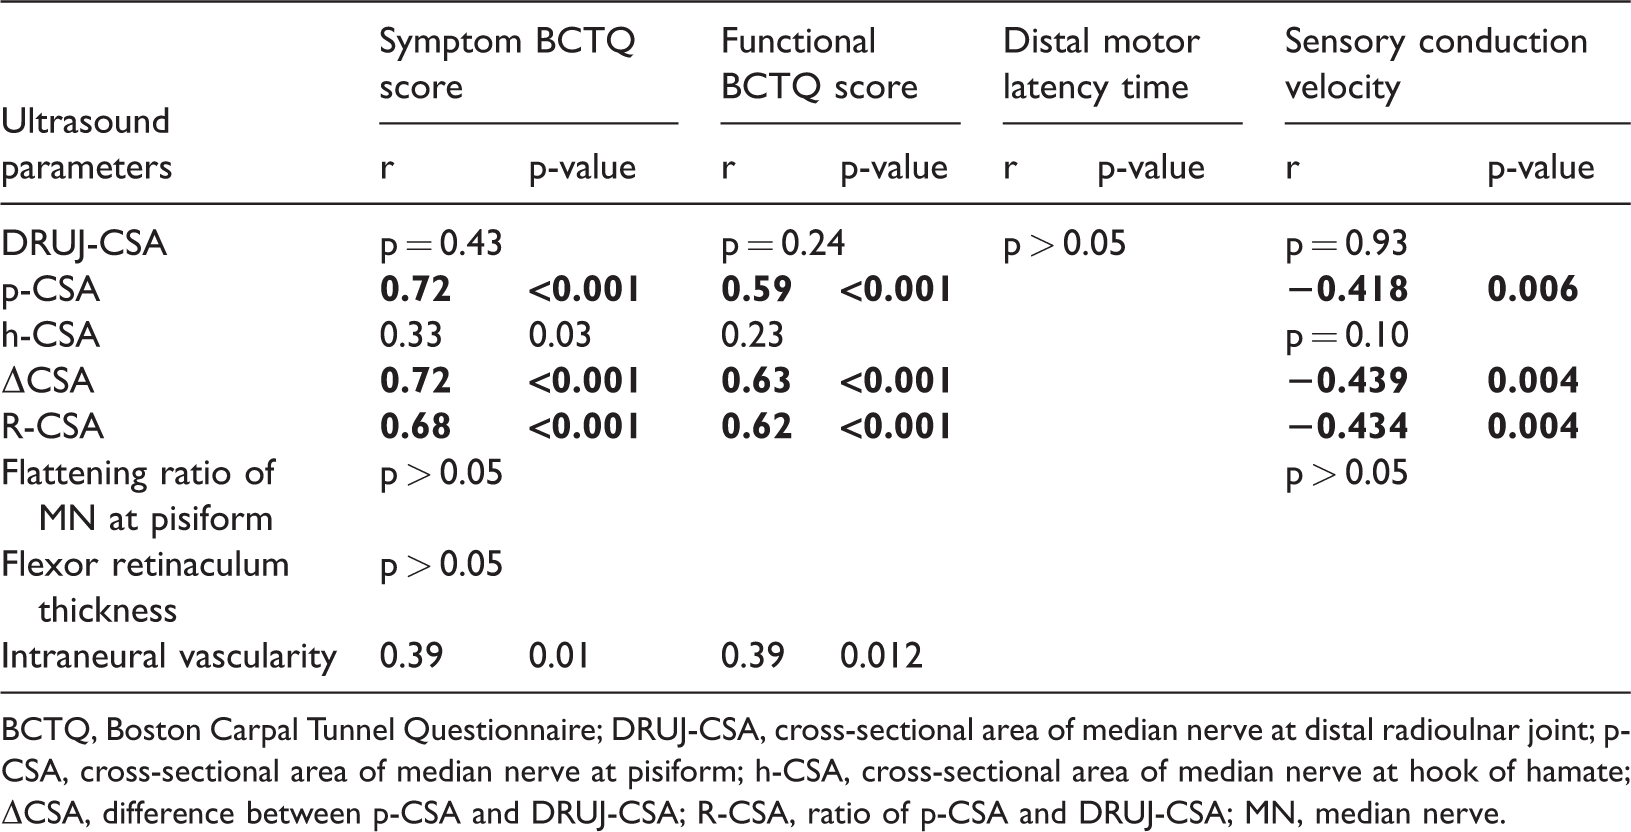
BCTQ, Boston Carpal Tunnel Questionnaire; DRUJ-CSA, cross-sectional area of median nerve at distal radioulnar joint; p-CSA, cross-sectional area of median nerve at pisiform; h-CSA, cross-sectional area of median nerve at hook of hamate; ΔCSA, difference between p-CSA and DRUJ-CSA; R-CSA, ratio of p-CSA and DRUJ-CSA; MN, median nerve.
Discussion
The diagnosis of CTS is often dependent upon the presence of typical clinical signs and symptoms and can be confirmed with a positive electrodiagnostic test in most cases. 21 Recent studies have proven that median nerve sonography is nearly as sensitive as the gold standard electrophysiological test for the diagnosis of CTS.22,23
In the current study, we found good correlations between CTS and quantitative US parameters (CSA of the median nerve at different levels, flattening ratio of the median nerve at the pisiform, and flexor retinaculum thickness at the hook of the hamate) in comparison with clinical and electrophysiological findings. This validates the utility of US in the diagnosis of CTS in the Vietnamese population.
This study also showed significant relationships of the BCTQ score and electrophysiological stage with US parameters, such as the p-CSA, R-CSA, ΔCSA, and intraneural vascularity score (p < 0.01). These findings are in accordance with studies by Baiee et al., 24 Chan et al., 25 Elnady et al., 26 and Mohamed et al. 27 However, there was no relationship with the h-CSA, DRUJ-CSA, flattening ratio of the median nerve at the pisiform, or flexor retinaculum thickness at the hook of the hamate, in contrast to the results reported by Sernik et al. 28 and El Miedany et al. 29 Furthermore, in our study, there was a significant positive correlation of the p-CSA, ΔCSA, and R-CSA of the median nerve with both the symptom and functional BCTQ scores and a moderately negative correlation with the sensory conduction velocity.
The reported cut-off values for the CSA of the median nerve at the pisiform on US widely vary from 9 to 14 mm2,22,30 which affects the sensitivity and specificity of this measurement for CTS. The AUC analysis showed that a p-CSA cut-off value of >15.5 mm2 had a sensitivity and specificity of 100% and 95.4%, respectively, for the prediction of severe CTS (Figure 4). The differences in the cut-off values were affected by not only the disease severity but also the nerve size related to height, sex, weight, age, and race of the individual as well as the imaging equipment and technique. Two useful parameters related to nerve enlargement were the ΔCSA and R-CSA of the median nerve at the level of the pisiform relative to the DRUJ. The cut-off values of the ΔCSA and R-CSA were 2.5 mm2 and 1.295, respectively. The threshold of the ΔCSA is equivalent to the results reported by Elnady et al. 26 The threshold of the R-CSA was lower than that reported by Billakota and Hobson-Webb 22 (wrist-to-forearm ratio of ≥1.4). These resulted in sensitivity values of 88.1% and 88.1% and specificity values of 97.4% and 92.1%, respectively.
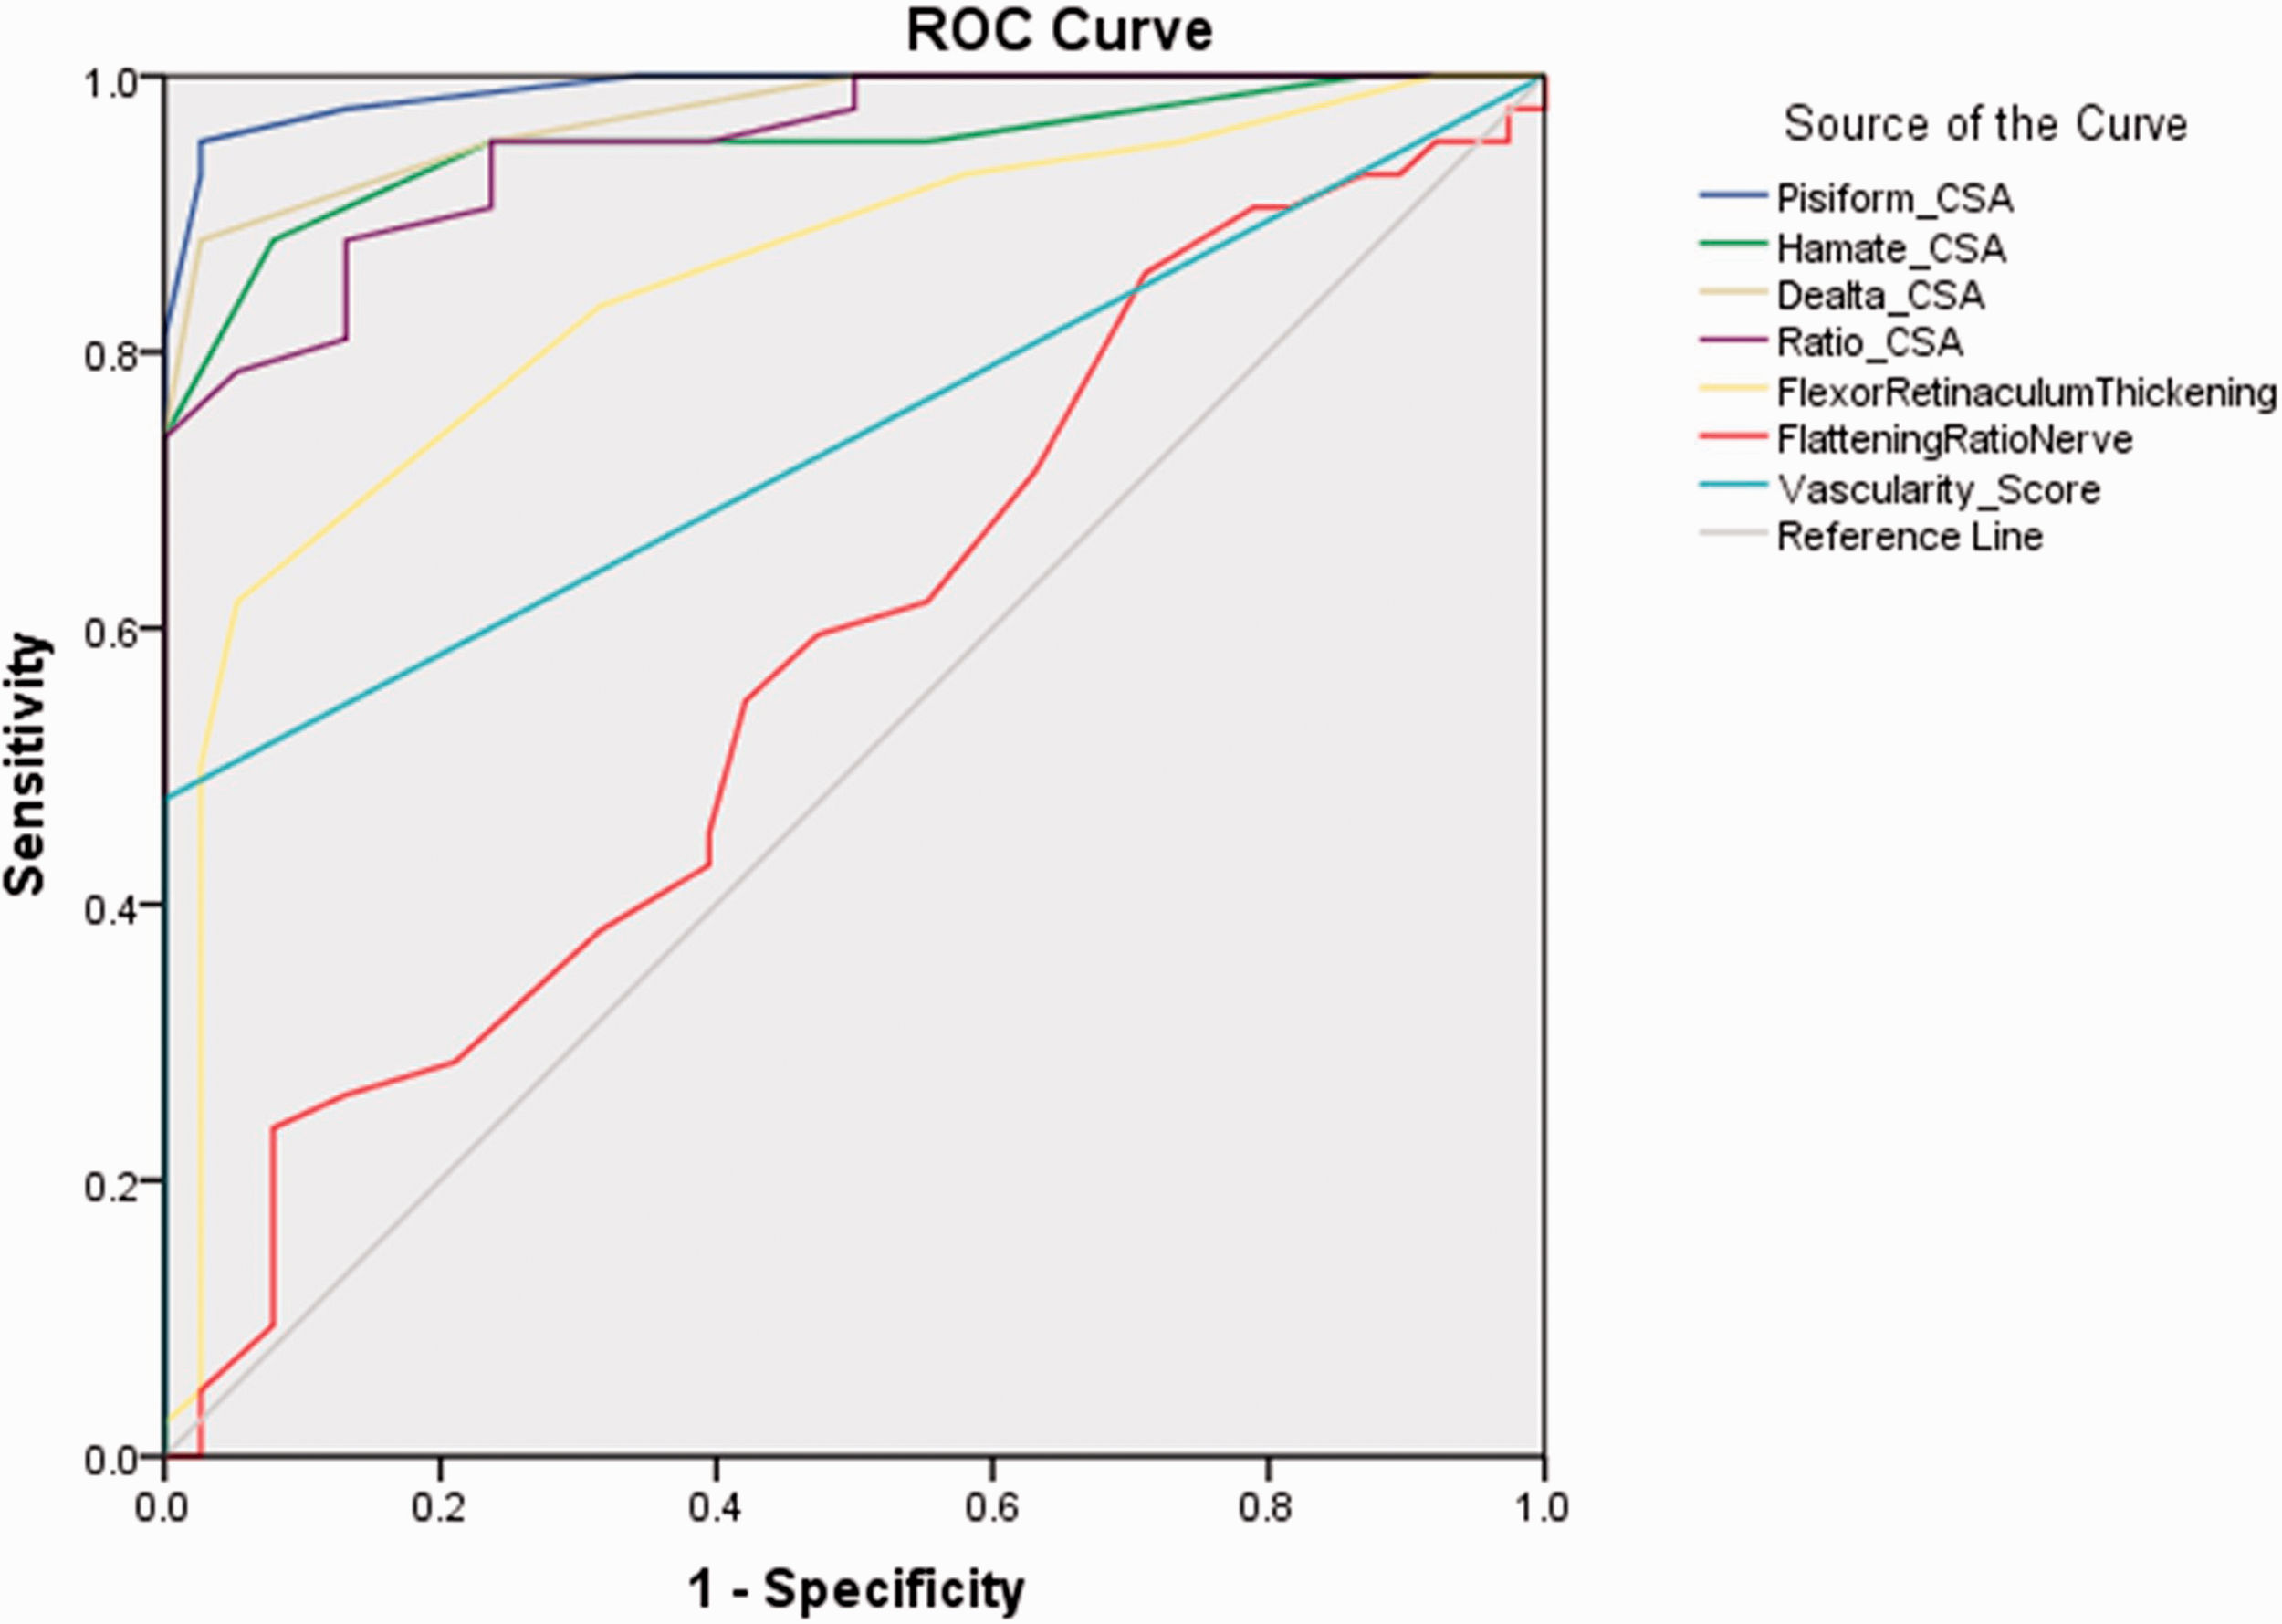
Receiver operating characteristic curves and areas under the curve of sonographic parameters
The flexor retinaculum thickness at the hook of the hamate was significantly different between the two groups, in agreement with the result reported by Bartolomé-Villar et al. 31 This was a highly specific parameter for diagnosing CTS, with a cut-off value of 1.05 providing an AUC of 0.85. This result is equivalent to that of a previous report. 30
In the current study, we used color and power Doppler sonography to quantitatively study the intraneural vascularization at the carpal tunnel. None of controls had a vascular signal in the median nerve. We found vessels in only 20 (47.6%) CTS-diagnosed wrists, which is a lower proportion than that found by Vanderschueren et al. 32 We also found a significant relationship between intraneural vascular flow in the median nerve and the severity of CTS based on the diagnostic electrophysiology findings and the BCTQ score. We therefore concluded that Doppler sonography may be a good diagnostic tool to detect CTS. However, further studies are needed to gain more insight into the diagnostic and prognostic value of the sonographically detected median intraneural vascular flow in patients with CTS.33,34
A limitation of this study is the relatively small number of patients. However, an obvious difference in the above-mentioned parameters was demonstrated between patients with CTS and controls. Another limitation is that only patients diagnosed by electrophysiological studies were included. Negative electrophysiological studies do not preclude the diagnosis of CTS because the cut-off values for abnormalities are variable. In addition, patients with a bifid median nerve were excluded from the study.
Conclusion
The most discriminatory parameters in the diagnosis of CTS are the CSA of the median nerve at the pisiform, ΔCSA, R-CSA of the median nerve at the pisiform and at the distal radioulnar joint, flexor retinaculum thickness, and intraneural vascularity score. We recommend using a median nerve CSA of ≥9.5 mm2 at the pisiform and a ΔCSA of ≥2.5 mm2 as the US diagnostic criteria for CTS and a median nerve CSA of >15.5 mm2 at the pisiform and a ΔCSA of ≥5.5 mm2 as the US markers of severe CTS in the Vietnamese population. Moreover, color and power Doppler US are promising tools for the future and may be helpful in detecting and diagnosing the severity of CTS.
Footnotes
Availability of data and material
The datasets used and analyzed during the current study are available upon reasonable request.
Authors’ contributions
(I) Conception and design: T Nguyen Thanh; (II) Administrative support: T Binh Le; (III) Provision of study materials or patients: T Binh Le, D Nguyen Duy, D Nguyen Thi Hieu; (IV) Collection data: Q Vo Nhu, T Nguyen Thanh; (V) Data analysis and interpretation: T Nguyen Thanh, Q Vo Nhu, NTN Le; (VI) Manuscript writing: All authors; (VII) Final approval of manuscript: All authors.
Declaration of conflicting interest
The authors declare that there is no conflict of interest.
Funding
The authors disclosed receipt of the following financial support for the research, authorship, and publication of this article: This work was supported by Hue University under the Core Research Program [Grant No. NCM.DHH.2020.09].