
Abstract
Objective
To investigate the mechanism through which tacrolimus, often used to treat refractory nephropathy, protects against puromycin-induced podocyte injury.
Methods
An in vitro model of puromycin-induced podocyte injury was established by dividing podocytes into three groups: controls, puromycin only (PAN group), and puromycin plus tacrolimus (FK506 group). Podocyte morphology, number, apoptosis rate and microtubule associated protein 1 light chain 3 alpha (LC3) expression were compared.
Results
Puromycin caused podocyte cell body shrinkage and loose intercellular connections, but podocyte morphology in the FK506 group was similar to controls. The apoptosis rate was lower in the FK506 group versus PAN group. The low level of LC3 mRNA observed in untreated podocytes was decreased by puromycin treatment; however, levels of LC3 mRNA were higher in the FK506 group versus PAN group. Although LC3-I and LC3-II protein levels were decreased by puromycin, levels in the FK506 group were higher than the PAN group. Fewer podocyte autophagosomes were observed in the control and FK506 groups versus the PAN group. Cytoplasmic LC3-related fluorescence intensity was stronger in control and FK506 podocytes versus the PAN group.
Conclusions
Tacrolimus inhibited puromycin-induced mouse podocyte damage by regulating LC3 expression and enhancing autophagy.
Introduction
First described in 1963, 1 autophagy, or ‘self-eating’, is an evolutionarily conserved process that controls protein and organelle degradation, and is essential for survival, development and homeostasis. 2 Autophagy is a double-edged sword, however, as inappropriate activation causes podocyte damage or even death.3–7 The key regulatory protein microtubule-associated proteins 1A/1B light chain 3A (LC3) initiates autophagosome biogenesis after interacting with other autophagic effectors and recruitment to the membrane. 8 LC3-I, the cytosolic form, is conjugated to phosphatidylethanolamine, and after modification to its membrane-bound form, LC3-II, it is recruited to the autophagosomal membrane. Biochemical analysis using a conditionally immortalised mouse podocyte clone revealed that LC3-I is processed to LC3-II during the differentiation of cells into mature podocytes, and LC3-II accumulates in the membrane-rich fraction of the cell lysate. Furthermore, LC3-II levels in differentiated mouse podocyte clones were higher after recovery from puromycin-induced damage, indicating that LC3-II-containing vesicles contribute to the physiological function of podocytes. 9 Therefore, the autophagy-related gene LC3 is thought to play an important role in autophagosome formation, by mediating the formation of phagocytic vesicles and localisation of autophagy proteins.
Tacrolimus is a calcineurin inhibitor with extensive immunosuppressive effects, high efficacy, and protective effects on the liver, and it has been shown to inhibit platelet aggregation, cause less hypertension and hyperlipidaemia than other calcineurin inhibitors, and reduce bone mineral density. 10 Therefore, tacrolimus, with its high level of effectiveness and low toxicity, is commonly used in the treatment of refractory nephropathy. Tacrolimus has been reported to directly act on glomerular podocytes to stabilise the expression and distribution of transient receptor potential canonical channel 6 (TRPC6). 11 Glomerular podocyte injury induced by puromycin aminonucleoside affects autophagy, which typically protects against the nephrotoxicity caused by puromycin; 12 and enhanced autophagy may prevent puromycin-induced renal damage.
In the present study, an in vitro model of puromycin-induced podocyte injury and tacrolimus intervention was constructed to analyse the impact of both drugs on autophagy, and on LC3 expression and localisation in mouse podocytes.
Materials and methods
Cells and experimental design
The murine podocyte cell line MPC5 (BeNa Culture Collection [BNCC]; Beijing, China) was cultured in Roswell Park Memorial Institute (RPMI) 1640 medium supplemented with 10% foetal bovine serum (Gibco, Thermo Fisher Scientific, Melbourne, Australia) at 33 °C in a 5% CO2 atmosphere. Cells were treated with 10 U/ml murine interferon (IFN)-γ (Sigma-Aldrich; St Louis, MA, USA) to stimulate proliferation, and when the patches of podocytes reached confluence, cells were detached using 0.05% trypsin-EDTA to generate single-cell suspensions. The podocytes were then seeded at a density of 60–70% into a 24 cm2 culture flasks coated with type I collagen and incubated at 37 °C in 5% CO2 in the absence of IFN-γ, with medium changes every 2 days, to allow cell differentiation.
An in vitro model of puromycin-induced podocyte injury was established by dividing podocytes (that had reached 60–70% confluence and then starved in RPMI 1640 for 12 h to synchronize growth) into three groups under the following culture conditions: RPMI 1640 culture medium only (control group, n = 5); RPMI 1640 containing 50 μg/ml puromycin only (PAN group, n = 5); and RPMI 1640 containing 50 μg/ml puromycin plus 5 μg/ml tacrolimus (FK506 group, n = 5). Cells were assessed at 8, 24 and 48 h. Puromycin and tacrolimus were purchased from Sigma-Aldrich.
Podocyte morphology
Podocyte morphology was observed at different time-points using inverted phase-contrast microscopy (Axio Vert 25 [Carl Zeiss, Oberkochen, Germany]; magnification, × 200). Morphological features were assessed, and the relative area of podocyte cell coverage per field of view was analysed using ImageJ software ( https://imagej.net/).
Flow cytometry-based apoptosis detection
Podocytes were washed twice with cold phosphate-buffered saline (PBS, pH 7.4), then detached using 0.05% trypsin-EDTA. Trypsinized cells were stained with fluorescein isothiocyanate (FITC)-labelled annexin V and propidium iodide (PI) using an Invitrogen™ FITC Annexin V/ Dead Cell Apoptosis Kit (Thermo Fisher Scientific; Waltham, MA, USA). In brief, the cell concentration was adjusted to approximately 1 × 10⁶ cells/ml in 1 × annexin-binding buffer (100 μl). FITC-labelled annexin V (5 μl) and PI (5 μl) working solution was added to each tube and the cells were then incubated at 20–25 °C for 15 min. After incubation, 1 × annexin-binding buffer (400 μl) was added, gently mixed, and the cells were kept on ice until analysis. The percentage of apoptotic cells (based on FITC fluorescence) was analysed by flow cytometry as soon as possible following sample preparation.
Quantitative polymerase chain reaction
Real-time quantitative polymerase chain reaction (qPCR) was performed to evaluate LC3 expression in terms of LC3 mRNA levels in the different experimental groups. In brief, total RNA was extracted from the podocytes using the RNAgents® Total RNA Isolation System (Promega; Madison, WI, USA) according to the manufacturer’s protocol, and quantified using a spectrophotometer. cDNA was then synthesised from total RNA by reverse transcription at 42 °C for 20 min and 95 °C for 5 min. Real-time PCR was performed using 2.0 µl of cDNA and Real-time PCR mix (Takara, Japan) in a 20 µl reaction volume that contained the following primer sets: LC3 forward primer (5′-
Western blot analysis
To analyse LC3 protein levels in each group, podocytes were harvested separately and RIPA cell lysis buffer was added for 20 min on ice. The cell lysate supernatants were collected after centrifugation at 12 000 × g at 4 °C, protein concentration was determined using a Thermo Scientific™ BCA protein assay kit (Thermo Fisher Scientific) and samples were diluted to equal concentrations. Protein samples (20 μg/lane) were separated by sodium dodecyl sulphate-polyacrylamide gel electrophoresis, transferred to polyvinylidene difluoride membranes, and blocked in tris-buffered saline (pH 7.4) with 0.05% TWEEN® 20 (TBST) and 5% skim milk for 1 h at room temperature. Subsequently, the membranes were incubated overnight at 4 °C with a monoclonal primary antibody: rabbit anti-mouse LC3-I (1: 500; Abcam, Shanghai, China), rabbit anti-mouse LC3-II (1: 500; Abcam), or rabbit anti-mouse β-actin (1: 500; Abcam). Membranes were then washed three times with TBST before incubating with horseradish peroxidase (HRP)-conjugated goat anti-rabbit secondary antibody (1: 2 000; Abclonal, Shanghai, China) at room temperature for 1 h. Membranes were again washed three times with TBST and developed with HRP substrate using an enhanced chemiluminescence detection kit (Solarbio, Beijing, China) according to the manufacturer’s instructions. Images were acquired by scanning the exposed films and relative protein levels (absorbance values normalised to β-actin internal loading controls) were calculated using ImageJ software.
Transmission electron microscopy
Podocytes from each group were collected and fixed in a 1% citric acid solution for 2 h at 35 °C. Subsequently, samples were dehydrated in alcohol and placed into 100% acetone, followed by standard resin embedding for transmission electron microscopy (TEM). Ultrathin sections (50 nm) were prepared and standard retrieval was performed. Tissue sections were then double-stained with uranyl acetate and lead citrate and the autophagosomes were observed under TEM (Libra 120 microscope, Carl Zeiss; magnification, × 25 000). Cells in each group at each time period were analysed by obtaining photomicrographs for each field of view and dividing the fields into four quadrants. Thirty cells per quadrant were randomly selected and autophagosomes were counted.
Immunofluorescence staining and confocal laser scanning microscopy
Podocytes were cultured on coverslips in 6-well plates under the three experimental conditions for 8, 24 or 48 h and then fixed with cold acetone for 10 min. Fixed cells were washed three times with PBS, blocked in 0.5% Triton X-100 with 5% bovine serum albumin at room temperature for 10 min, then incubated with antibody diluent (negative control) or a monoclonal rabbit anti-LC3 antibody (1: 500; Santa Cruz Biotechnology, Dallas, TX, USA) overnight at 4 °C. Podocytes were washed again three times with PBS, and incubated with a mouse anti-rabbit fluorophore-conjugated secondary antibody (1: 200; Santa Cruz Biotechnology) at room temperature for 2 h. Samples were then assessed using confocal laser scanning fluorescence microscopy (Carl Zeiss) to obtain images that were analysed for fluorescence intensity using ImageJ software.
Statistical analyses
Data are presented as mean ± SE for each assay. Differences were analysed using an unpaired Student’s t-test, and all analyses were performed with SPSS software, version 17.0 (SPSS Inc., Chicago, IL, USA). A P value < 0.05 was considered to be statistically significant.
Results
Tacrolimus suppressed puromycin-mediated disruption of podocyte morphology and number
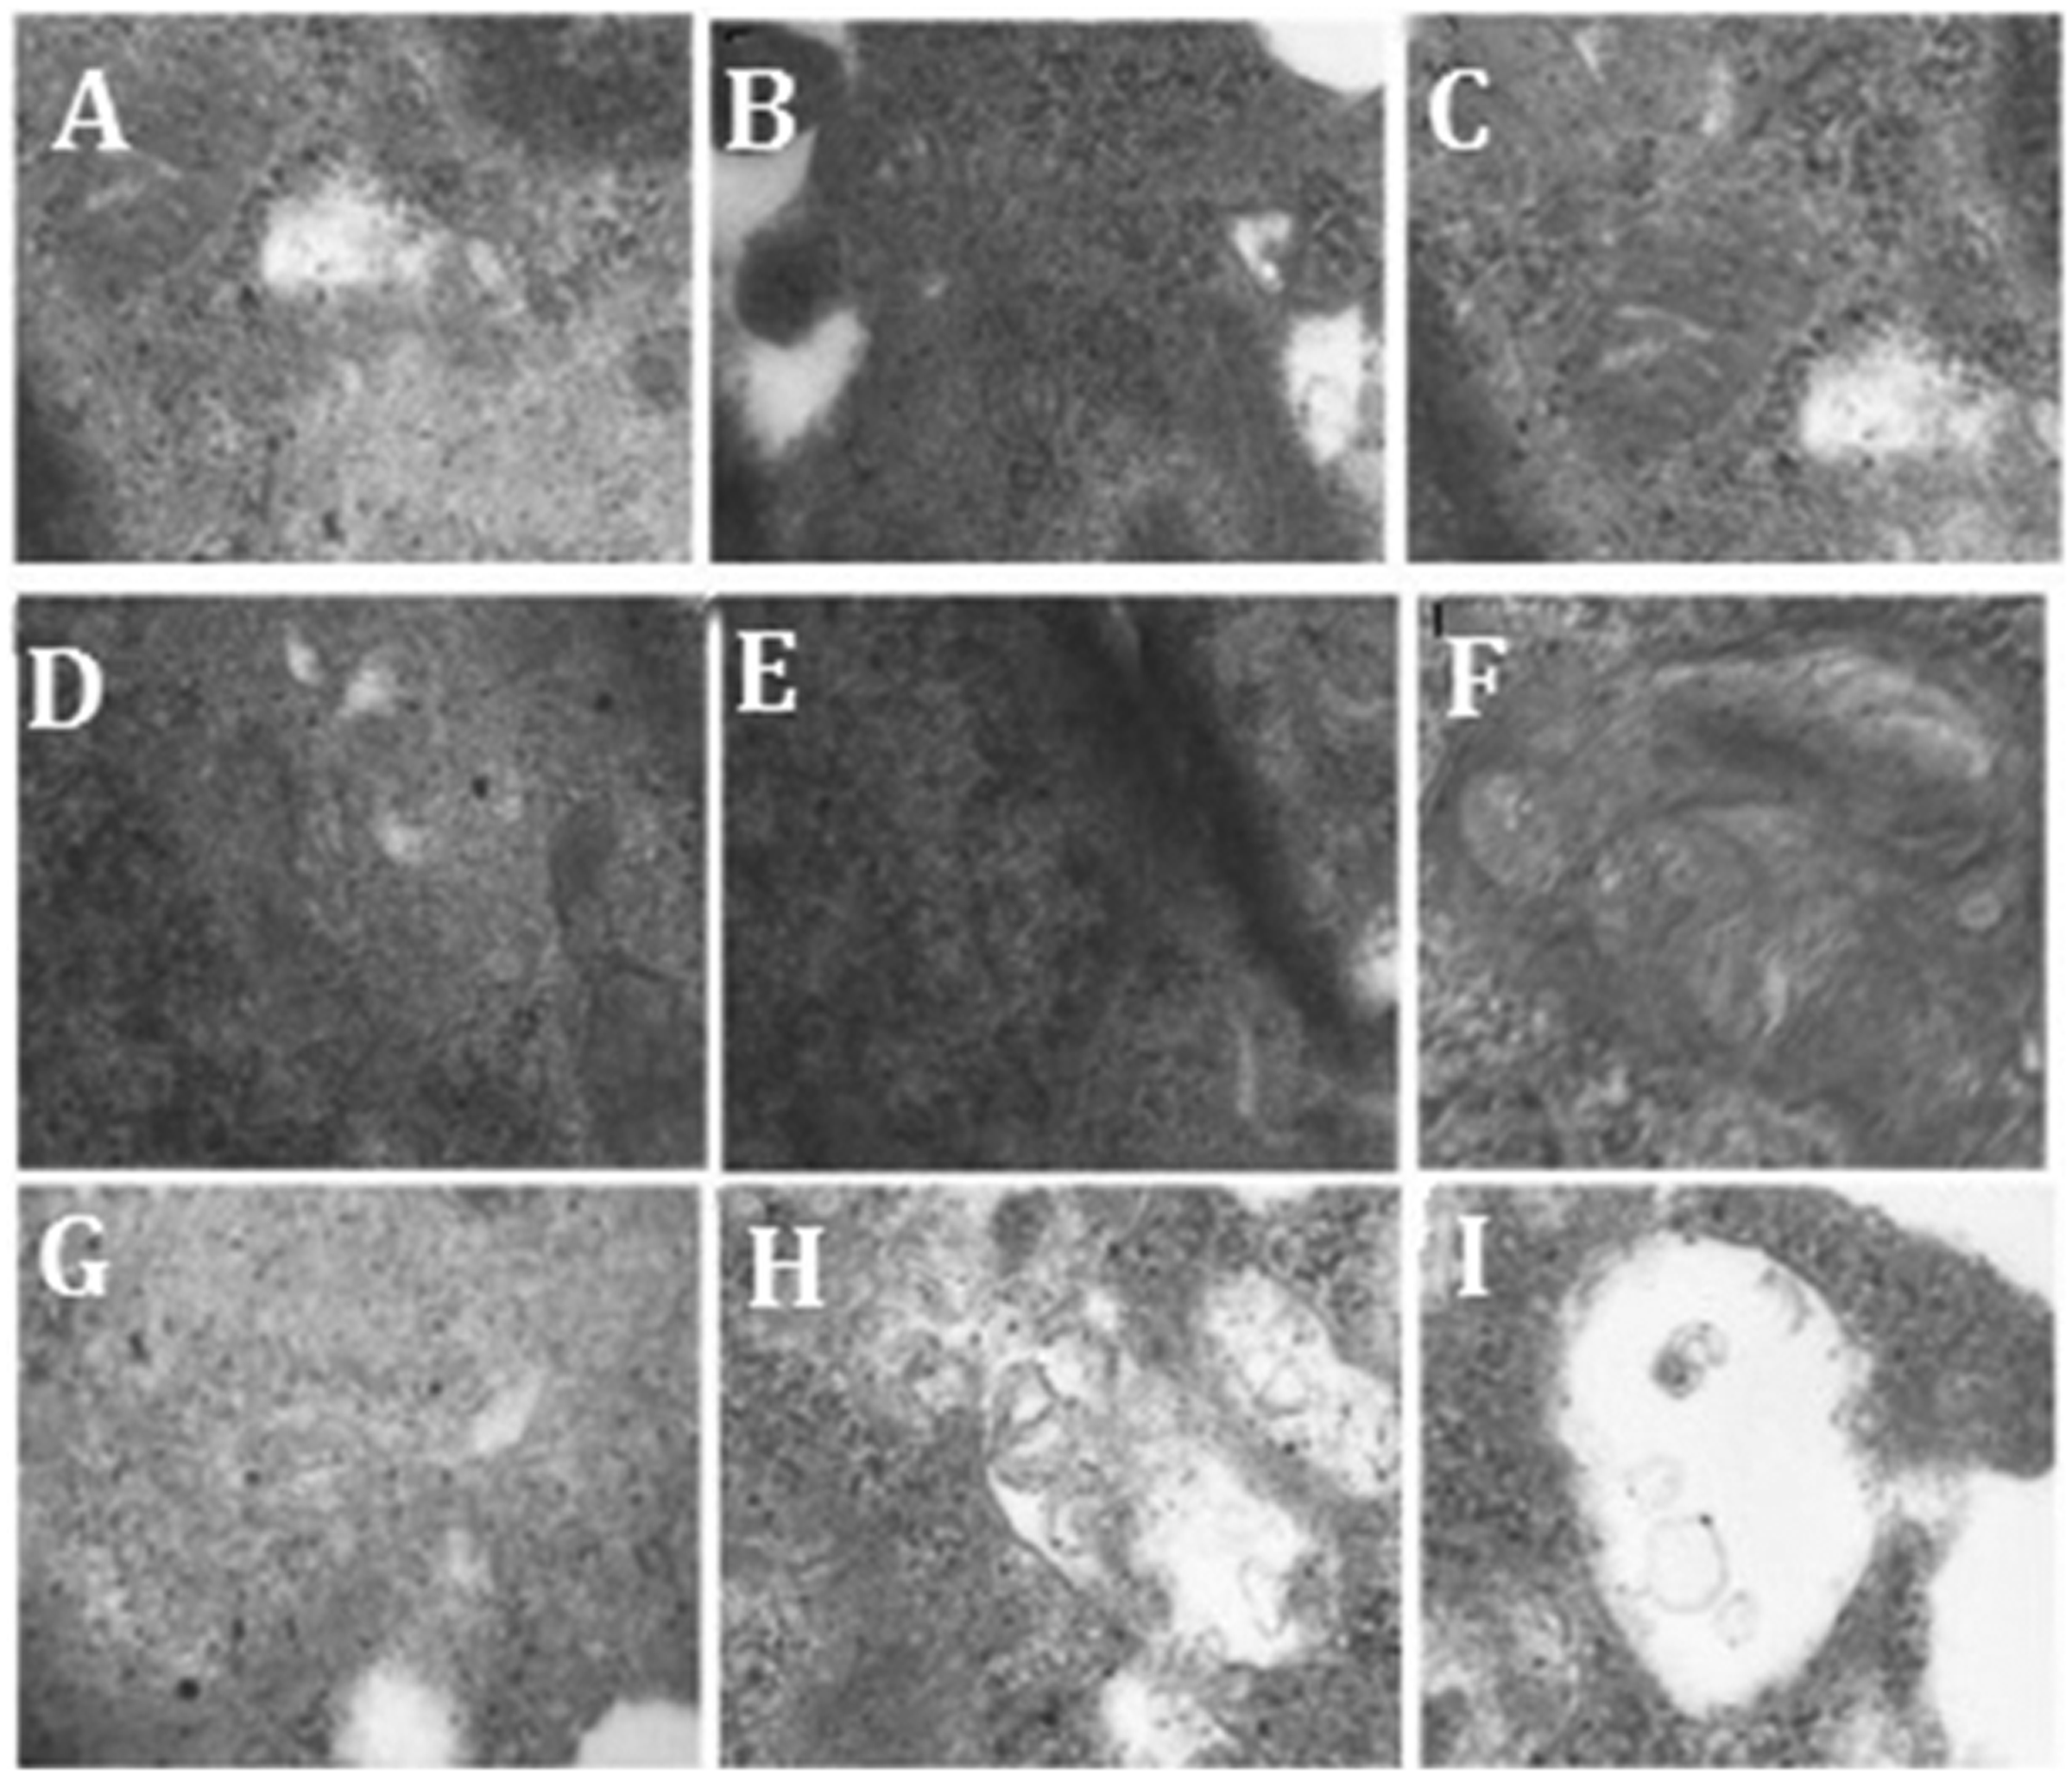
Podocyte morphology was observed by inverted microscopy and the relative area of podocyte cell coverage was calculated using Image J software. In the control group, podocytes were well differentiated, with clear and intact structure. The cells were stellate, with dendrite-like processes, and there were interconnections between adjacent cells (Figure 1A–C). In the PAN group, cell body shrinkage (P < 0.05 versus controls), foot process retraction and disappearance, and less tight intercellular connections were observed at 8 h. At 24 and 48 h, significant podocytosis (retraction and disappearance of foot processes, loose intercellular connections) could be observed, suggesting that podocyte injury was aggravated after PAN stimulation (Figure 1D–F). At 8 h, 24 h and 48 h after puromycin plus tacrolimus intervention (Figure 1G–I), podocyte morphology gradually became clear, intercellular connections appeared tighter compared with the PAN group, and cell bodies were significantly larger versus the PAN group (P < 0.05; Figure 1 and Table 1).
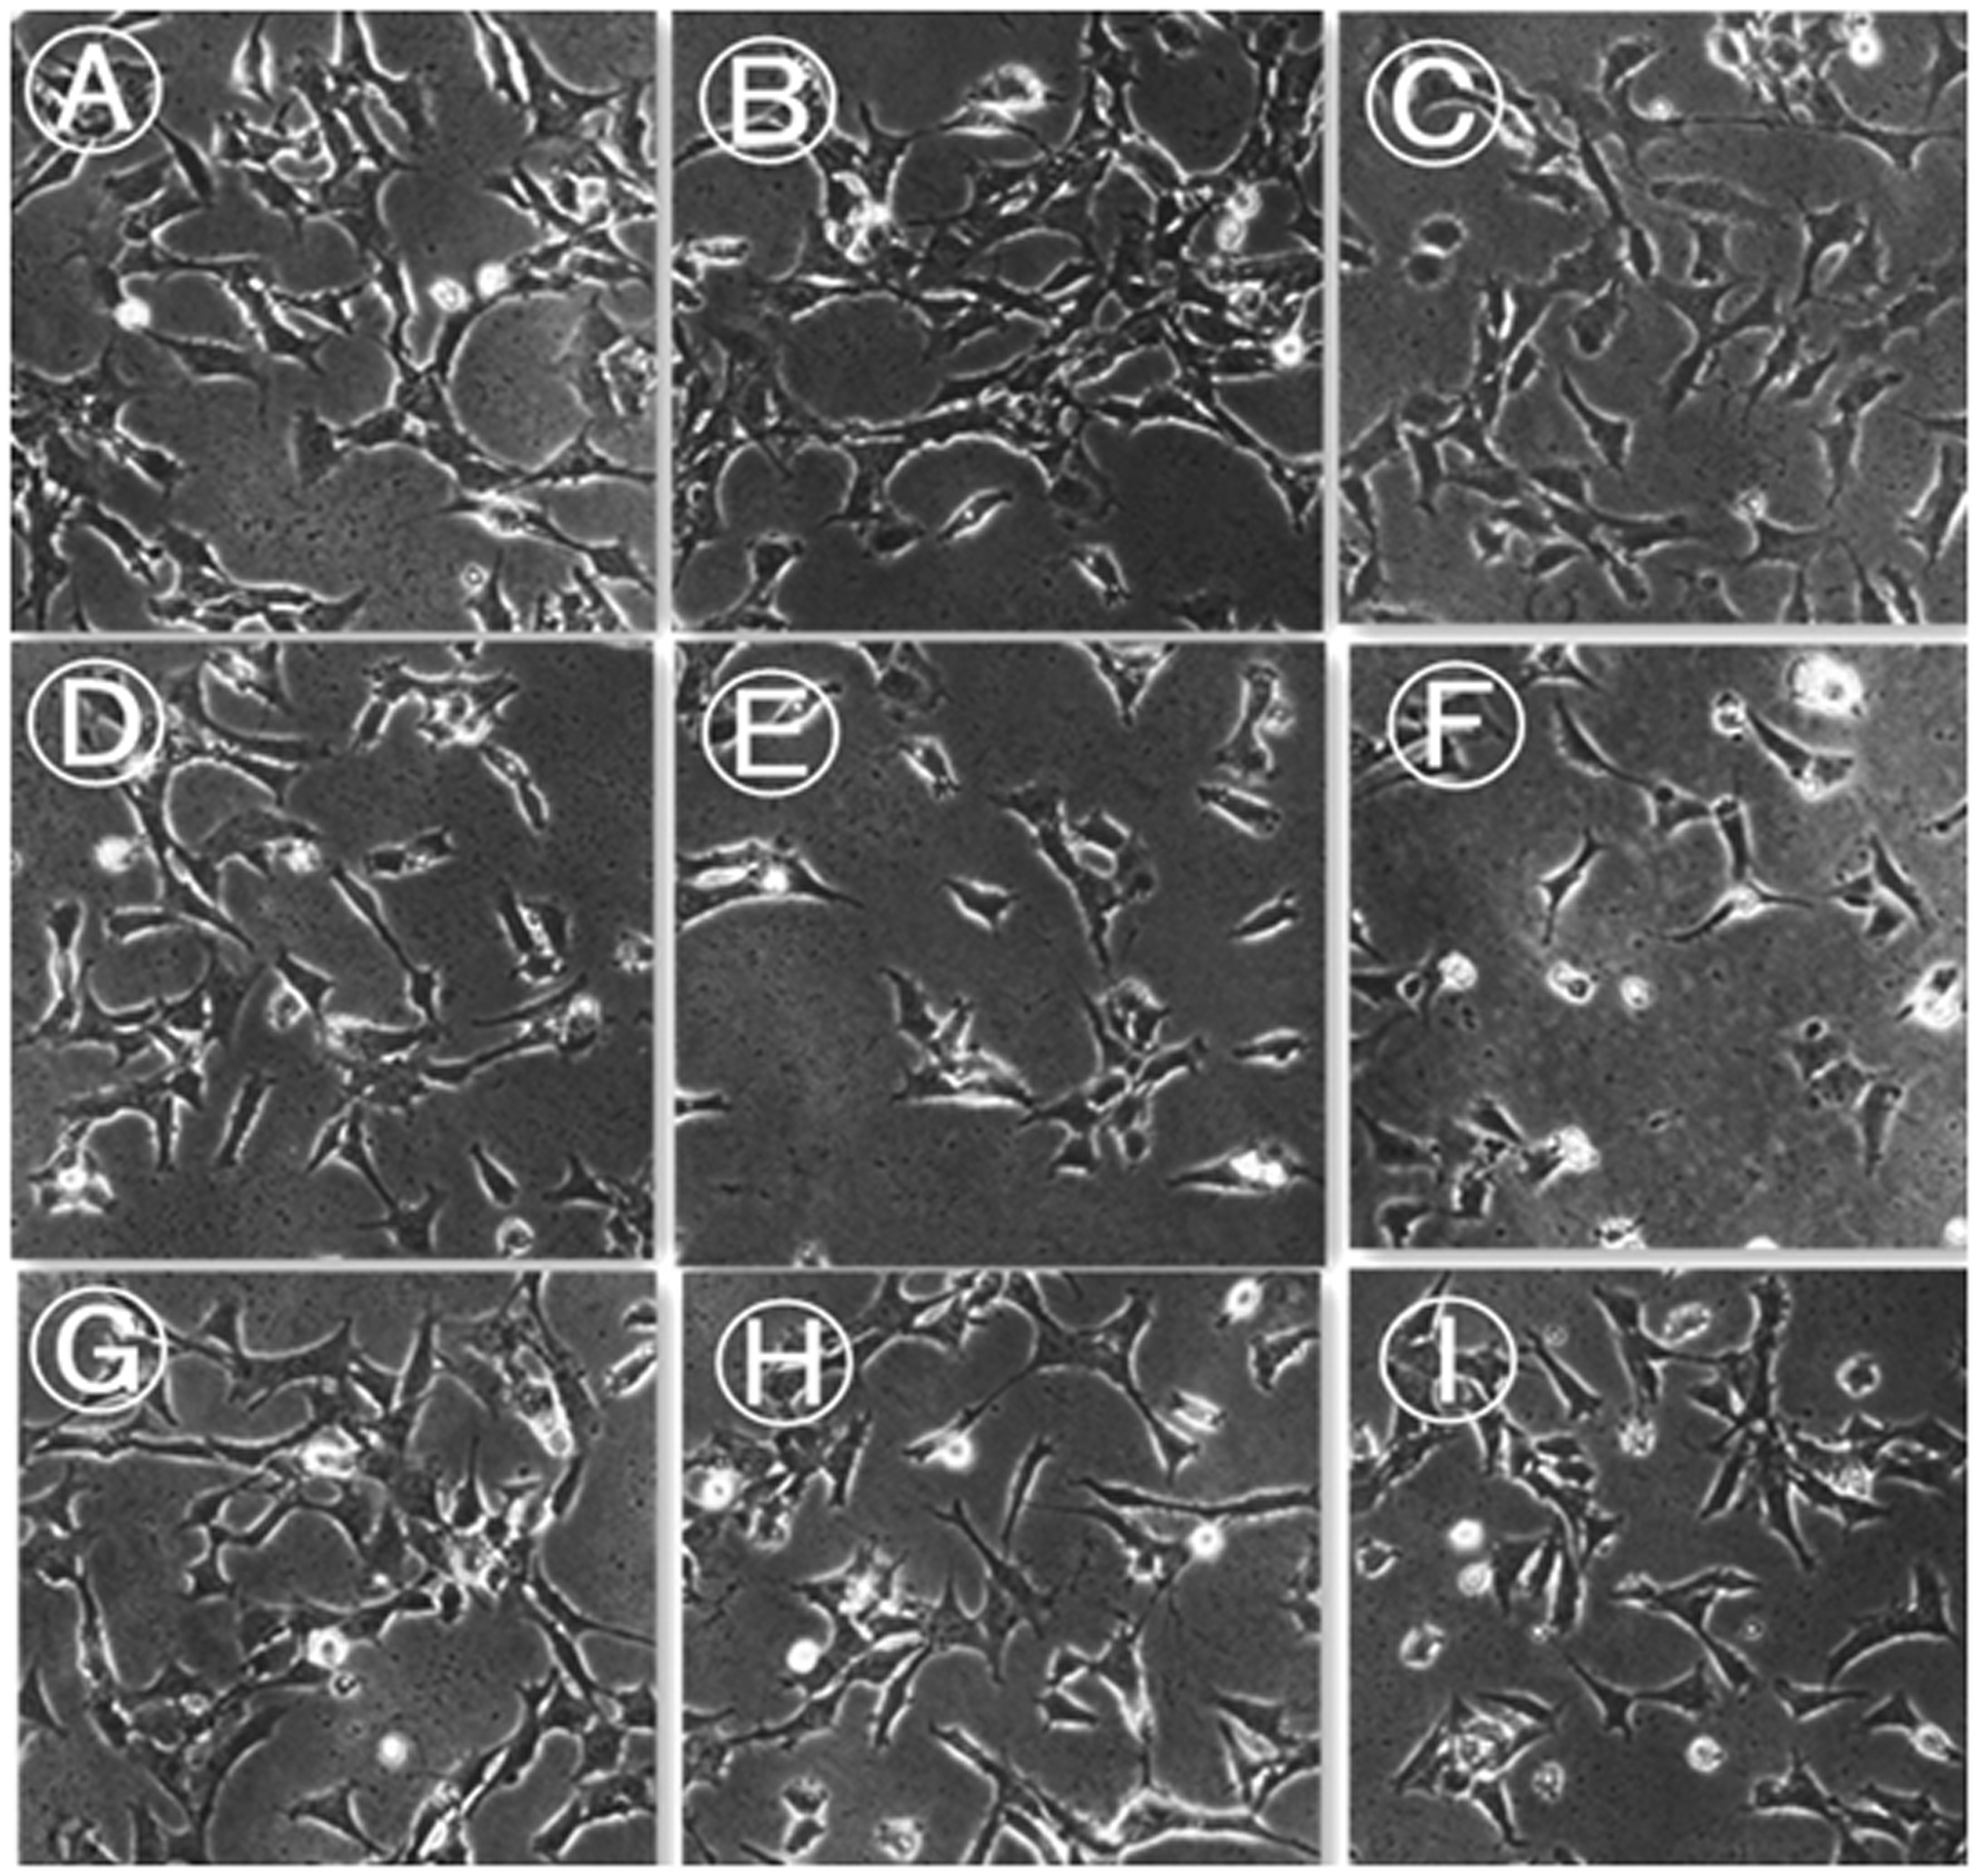
Representative images showing podocyte morphology in the control group (A–C); puromycin-treated group (D–F); and puromycin plus tacrolimus-treated group (G–I) analysed at 8 h (A, D, and G); 24 h (B, E, and H); and 48 h (C, F, and I) after treatment. Images obtained by inverted phase-contrast microscopy (original magnification, × 200).
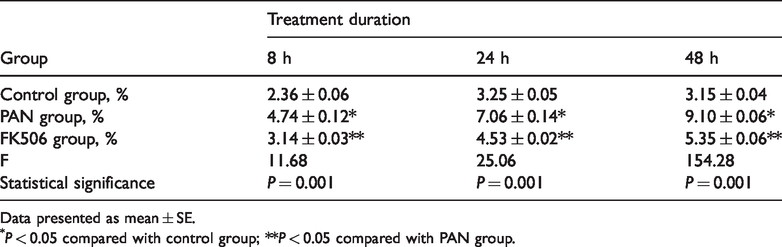
Relative podocyte area following treatment with puromycin alone (PAN group), or puromycin plus tacrolimus (FK506 group).

Data presented as mean ± SE.
P < 0.05 compared with control group; **P < 0.05 compared with puromycin-treated (PAN) group.
Tacrolimus inhibited the rate of puromycin-induced podocyte apoptosis
The percentage of apoptotic cells in each group was assessed using annexin V/PI double-staining and flow cytometry (Figure 2 and Table 2). The rate of apoptosis in the PAN group was higher than in the control group at 8, 24, and 48 h post-treatment (P < 0.05) and increased in a time-dependent manner. A significantly lower rate of apoptosis was observed in the FK506 group versus the PAN group at 8, 24, and 48 h post-treatment (P < 0.05; Figure 2 and Table 2).

Representative flow cytometry plots showing rates of apoptotic podocytes in the control, puromycin-treated and puromycin plus tacrolimus-treated groups. Q1, propidium iodide (PI)+ Annexin V– (mechanically damaged cells); Q2, PI+ Annexin V+ (late apoptotic or dead cells); Q3, PI– Annexin V– (live cells); and Q4: PI– Annexin V+ (early apoptotic cells). Control group (A–C); puromycin-treated group (D–F); and puromycin plus tacrolimus-treated group (G–I) analysed at 8 h (A, D, and G); 24 h (B, E, and H); and 48 h (C, F, and I) after treatment.
Percentage of apoptotic podocytes following treatment with puromycin alone (PAN group), or puromycin plus tacrolimus (FK506 group).
Data presented as mean ± SE.
P < 0.05 compared with control group; **P < 0.05 compared with PAN group.
Tacrolimus reversed puromycin-induced changes in podocyte levels of autophagy-related LC3 mRNA
The expression and localisation of LC3 are commonly used to monitor autophagy. Thus, podocyte autophagic activity was characterised in each group by analysing LC3 mRNA levels using qPCR. Low levels of LC3 mRNA were observed in control podocytes, and levels were significantly lower at 8, 24, and 48 h in the puromycin-treated group (P < 0.01; Figures 3 and 4, and Table 3), and levels of LC3 mRNA decreased in a time-dependent manner (P < 0.01). Significantly higher levels of LC3 mRNA were observed in the FK506 group versus the PAN group at 8, 24, and 48 h post-treatment (all P < 0.01; Figures 3 and 4, and Table 3).

Representative gel electrophoresis image showing polymerase chain reaction products following β-actin amplification. M, molecular ladder; lanes 1–3, control group; lanes 4–6, puromycin-treated group; lanes 7–9, puromycin plus tacrolimus-treated group.

Representative gel electrophoresis image showing polymerase chain reaction products following microtubule-associated proteins 1A/1B light chain 3A (LC3) amplification. M, molecular ladder; lanes 1–3, control group; lanes 4–6, puromycin-treated group; lanes 7–8, puromycin plus tacrolimus-treated group.
Relative levels of microtubule-associated proteins 1A/1B light chain 3A (LC3) mRNA in podocytes following treatment with puromycin alone (PAN group), or puromycin plus tacrolimus (FK506 group).

Data presented as mean ± SE.
P < 0.05 compared with control group; **P < 0.05 compared with PAN group.
Tacrolimus reversed puromycin-mediated inhibition of podocyte LC3-I and LC3-II levels
Levels of LC3-I and LC3-II protein in podocytes were analysed by Western blotting. Very low protein levels were observed in the control group, and levels were significantly lower in the puromycin-treated group at 8, 24, and 48 h post-treatment (P < 0.01; Figure 5 and Table 4). In contrast, the LC3-I and LC3-II protein levels were significantly higher in the FK506 group versus the PAN group (P < 0.01) at 8, 24, and 48 h post-treatment. Levels of LC3-I and LC3-II protein gradually rose over time (P < 0.01). Thus, puromycin decreased LC3 protein levels in podocytes, and tacrolimus increased LC3 protein levels (Figure 5 and Table 4).
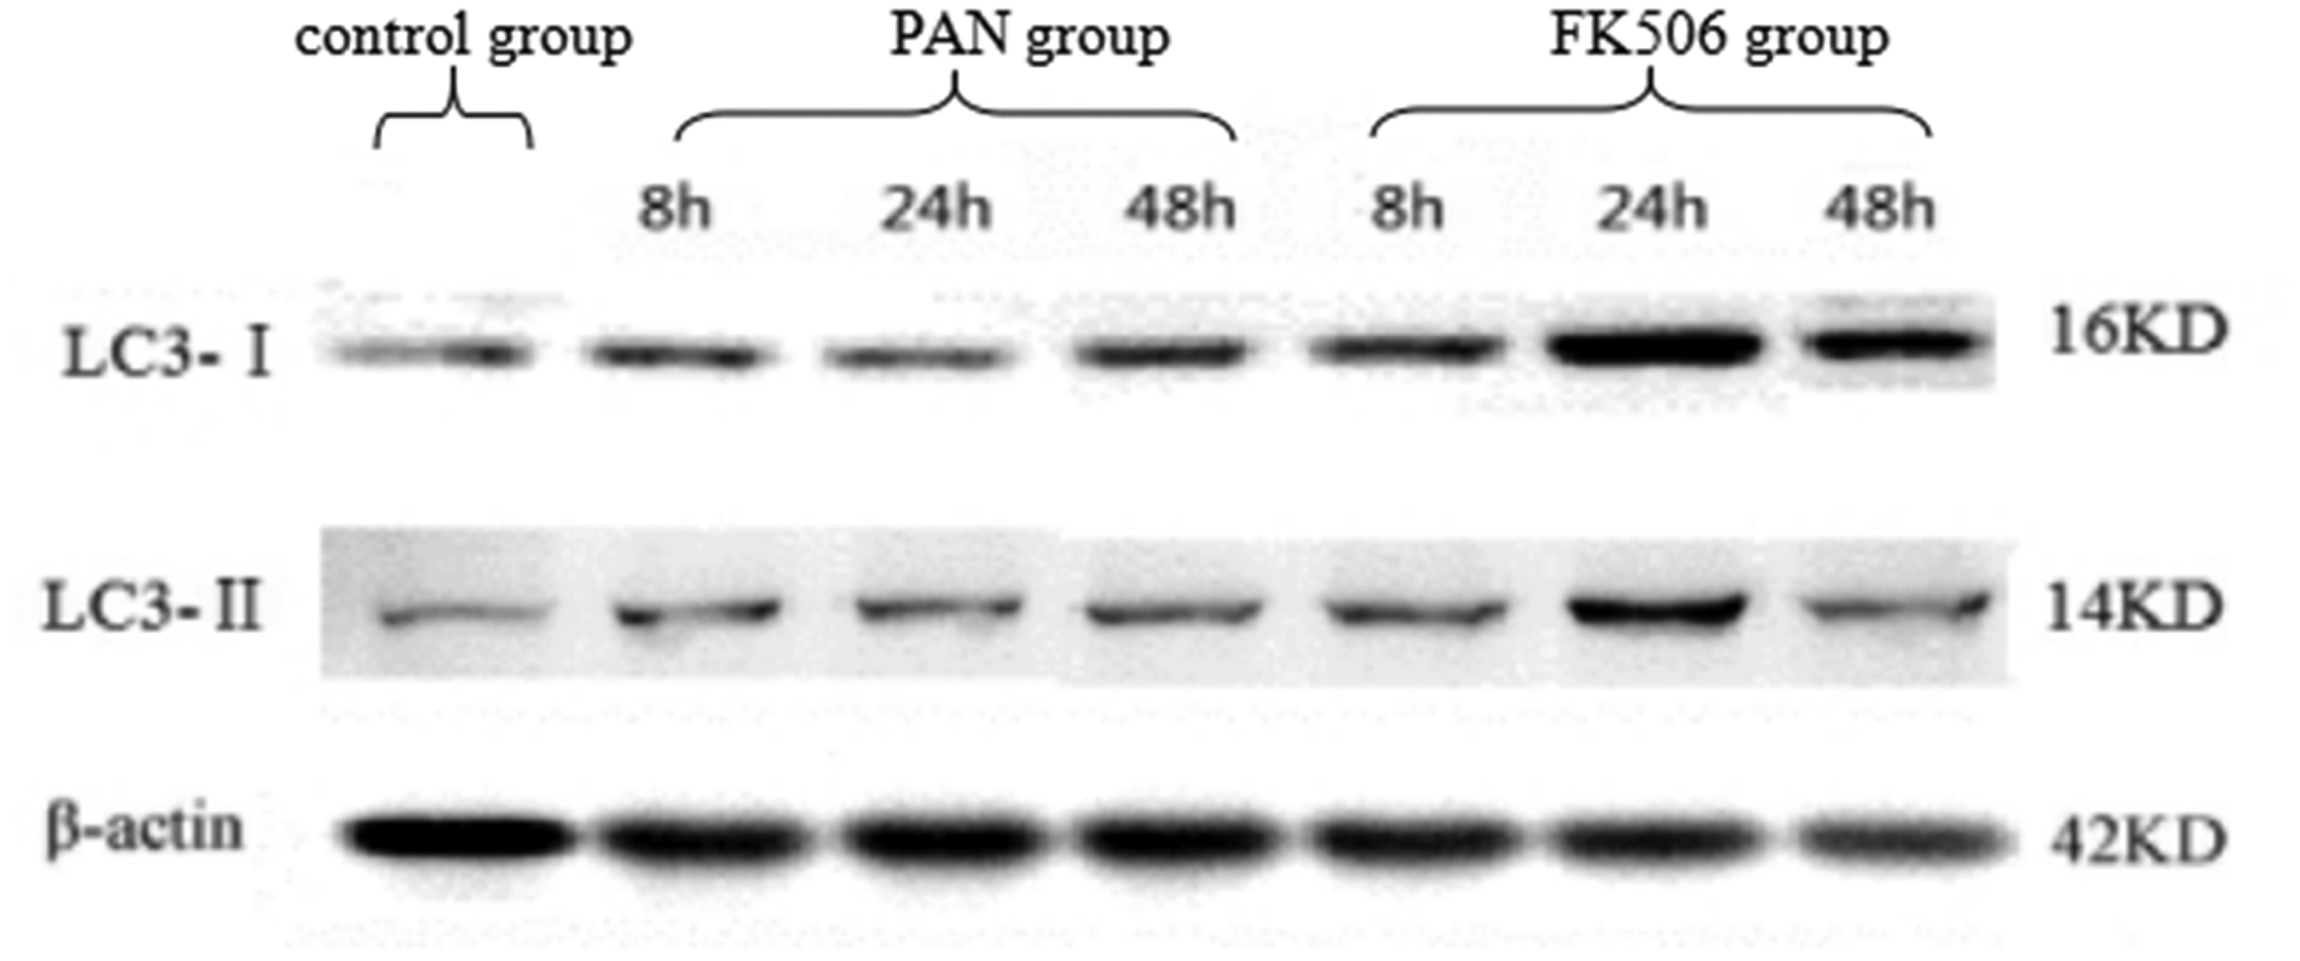
Representative Western blot panels showing levels of microtubule-associated proteins 1A/1B light chain 3A (LC3-I and LC3-II) proteins in podocytes at 8, 24 and 48 h following treatment with puromycin alone (PAN group), or puromycin plus tacrolimus (FK506 group).
Levels of microtubule-associated proteins 1A/1B light chain 3A (LC3) protein in podocytes following treatment with puromycin alone (PAN group), or puromycin plus tacrolimus (FK506 group).
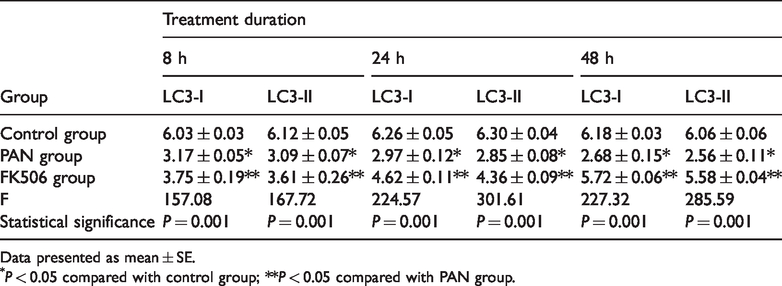
Data presented as mean ± SE.
P < 0.05 compared with control group; **P < 0.05 compared with PAN group.
Puromycin decreases autophagosome numbers, whereas tacrolimus increases autophagosome numbers
Autophagosomes were counted in mouse podocytes using transmission electron microscopy. The mean number of autophagosomes was lower in the PAN group than in the control group at 8, 24, and 48 h post-treatment (all P < 0.05), and the decrease was time-dependent (P < 0.05). The average number of autophagosomes in the FK506 group was greater than in the PAN group (P < 0.05) at 8, 24, and 48 h post-treatment, suggesting that tacrolimus inhibited puromycin-induced suppression of autophagosomes (Figure 6 and Table 5).
Representative transmission electron microscopy images showing the ultrastructure of autophagosomes in podocytes: Control group (A–C); puromycin-treated group (D–F); and puromycin plus tacrolimus-treated group (G–I) analysed at 8 h (A, D, and G); 24 h (B, E, and H); and 48 h (C, F, and I) after treatment. Original magnification, × 25 000.
Comparison of autophagosome numbers in podocytes following treatment with puromycin alone (PAN group), or puromycin plus tacrolimus (FK506 group).

Data presented as mean ± SE.
P < 0.05 compared with control group; **P < 0.05 compared with PAN group.
Laser confocal detection of changes in LC3 distribution
Podocytes that had been stained using anti-LC3 antibodies were analysed by confocal laser scanning microscopy. Compared with the control group, the PAN group had significantly lower LC3-related fluorescence intensity in the cytoplasm, and the fluorescence intensity decreased in a time-dependent manner between the three time-points. Compared with the PAN group, the FK506 group had significantly greater LC3-related fluorescence intensity in the cytoplasm (Figure 7).

Representative immunofluorescence staining showing changes in cytoplasmic levels and distribution of microtubule-associated proteins 1A/1B light chain 3A (LC3) in podocytes at 8, 24 and 48 h following treatment with puromycin alone (PAN group), or puromycin plus tacrolimus (FK506 group).
Discussion
Changes in LC3 expression and localisation can reliably reflect changes in autophagy. LC3 is a homologue of the yeast ubiquitin-like protein ATG8 (ATG8) gene in mammalian cells. 13 LC3-I is typically expressed in the cytoplasm until the induction of autophagy leads to its modification with phosphatidylethanolamine, forming LC3-II. LC3-II is maintained on the autophagosome membrane until it is degraded by autophagosome fusion with lysosomes. Autophagy is an essential catabolic process through which cells degrade their own components using the lysosomal machinery.
Autophagy is a new target for the diagnosis and treatment of renal diseases,14,15 based on its key roles in the damage and protection of glomerular podocytes. Previous research has indicated that pathological changes that occur in various renal diseases are characterised by the fusion of foot processes, and podocyte injury and shedding. Autophagy is closely related to podocyte damage and proteinuria. Thus, understanding autophagy will provide new insights into the pathogenesis of renal diseases and methods to prevent and treat proteinuria.16,17 Puromycin induces podocyte toxicity, and the puromycin-induced model of podocyte injury has been widely applied for most research in the field. 18 Puromycin has been revealed to induce podocyte injury via autophagy activation, 12 and these findings suggest that correcting autophagy is a promising potential treatment for kidney diseases. 19
Tacrolimus, a 23-membered macrolide lactone, is an immunosuppressive drug mainly used to prevent the risk of organ rejection after allogeneic organ transplant and to treat autoimmune diseases, such as refractory renal diseases.20,21 Tacrolimus inhibits TRPC6 expression and TRPC6/calcineurin/nuclear factor of activated T cells (NFAT) signalling in renal tissue, thereby minimising renal tissue damage and proteinuria. 22 Tacrolimus (FK506) has been shown to inhibit podocyte injury induced by angiotensin II and stabilise the expression of cytoskeletal proteins and nephrin. 23 Tacrolimus has also been suggested to inhibit puromycin-induced podocyte injury and stabilise the expression of podocin. 24 Furthermore, early autophagy activation has been shown to inhibit podocyte apoptosis induced by aldosterone. 25 Previous research by the present authors indicated that autophagy is a critical protective factor in puromycin-induced podocyte injury.26,27 Expression of the autophagy-related gene LC3, and the relative strength of autophagy signalling, were found to be important in the development of renal disease, leading to the conclusion that LC3 should be targeted in the treatment of renal diseases.
To date, there is little evidence for how puromycin and tacrolimus regulate the expression and distribution of autophagy-related proteins. The hypothesis that puromycin negatively regulates the expression of autophagy-related proteins, and tacrolimus stabilises their expression and distribution, thereby protecting podocytes from injury and inhibiting proteinuria, was tested in the present study. Puromycin treatment was found to alter the morphology of podocytes and increased their rate of apoptosis in a time-dependent manner. Consistent with previous reports, the present results indicate that puromycin induces murine podocyte injury, which may lead to the occurrence of proteinuria.24,28 The morphology of podocytes treated with puromycin combined with tacrolimus was close to normal, and the rate of apoptosis was lower than in cells treated with puromycin alone. These results suggest that tacrolimus inhibits puromycin-induced podocyte injury, helping to maintain the integrity of podocyte morphology, and thus, may attenuate proteinuria and protect kidney tissue. The mechanism through which tacrolimus inhibits puromycin-induced podocyte apoptosis remains to be investigated.
Autophagy is a conserved catabolic process that involves the degradation of proteins and organelles, and can regulate the fate of cells. 29 Autophagy activation, which occurs mainly under conditions such as nutrient deficiency or immune stress, is a conservative process that preserves intracellular components to maintain the cellular energy balance and protect cells from stress; thus, autophagy activation is closely related to cellular self-stabilisation and human disease. Autophagy as a volume-based degradation system, characterised by the inactivation of organelles, lipids, and proteins by the lysosomal pathway, was first proposed in 1963. 1 Autophagosome formation is relatively complex. Initially, a large number of free membranous structures, called pre-autophagosomal structures, appear in the cytoplasm. These gradually develop into a vacuole composed of two or more layers of membrane, which contains denatured and necrotic organelles and a large volume of cytoplasm; the so-called autophagosome. Autophagic vesicles play an important role in autophagy; monitoring the vesicles is essential for assessing the level of autophagic activity and understanding the autophagic process. Finally, the autophagic vesicle fuses with the lysosomal membrane and the autophagosome contents enter the lysosomal cavity, where they are hydrolysed by lysosomal enzymes into small molecules and eventually reused by cells. 1
Podocyte injury and loss leads to kidney diseases in humans, and is an important contributing factor to the development of glomerulosclerosis, while autophagy participates in the maintenance of podocyte integrity and stability and is closely linked to podocyte function. 30 Autophagy may be a protective mechanism against podocyte aging and glomerular injury. In recent years, autophagy has become a hot topic in glomerular disease research. The present authors previously found that puromycin inhibits Sertoli cell LC3 mRNA and protein expression in a time-dependent manner, thereby suppressing autophagic activity. 31 This finding indicated that puromycin inhibits both mRNA and protein levels of the autophagy-related protein LC3. In the present study, tacrolimus was shown to up-regulate and stabilise levels of LC3 mRNA and protein in podocytes treated with puromycin, and also to inhibit the reduction in autophagosomes observed in puromycin-treated podocytes, suggesting that tacrolimus may activate and sustain autophagy, resulting in less puromycin-related podocyte damage. Future in-depth studies of the mechanism utilised by tacrolimus to maintain normal LC3 expression and autophagic activity in podocytes will be useful for identifying a potential target for treating kidney diseases.
In summary, tacrolimus was observed to inhibit puromycin-mediated podocyte injury and death. The authors believe that LC3 and the autophagy signalling pathway play important roles in various kidney diseases, and that LC3 may be used as a potential target for the treatment of kidney diseases. The present study provides hypothetical explanations for the occurrence and development of some diseases and reveals a new area for investigation into the prevention and treatment of kidney disease.
Footnotes
Declaration of conflicting interest
The authors declare that there is no conflict of interest.
Funding
The study was supported by The Science Foundation of Guangzhou First People’s Hospital (Project Number: M2019020); National Natural Science Foundation of China (Project Number: 81273205, 81670652) and Guangdong Planned Project of Science and Technology (Project Number: 2016A020215010).