
Abstract
Objective
Hepatocellular carcinoma (HCC) is the most common primary malignant tumor of the liver. We aimed to summarize and analyze the atypical magnetic resonance imaging (MRI) features of HCC to improve its diagnostic accuracy.
Methods
We retrospectively analyzed MRI data for 66 patients with HCC with atypical MRI features confirmed by operation and pathology.
Results
Twelve patients had high signals and 18 patients had significant decreases in opposed phase signals in T1WI plain scans. Nine patients had high signals and six patients had large cystic lesions in apparent diffusion coefficient images. Dynamic enhancement showed progressive enhancement in 15 patients, ring enhancement in three, irregular patchy enhancement in three, ‘nodule-in-nodule’ enhancement in six, delayed central patchy enhancement in six, delayed central ‘star-like aristate scars’ (T2WI revealed high signal intensity) in 21, and poor blood supply in three patients.
Conclusions
MRI can make a clear diagnosis of typical HCC, and atypical cases can also be distinguished from other tumors or tumor-like lesions by MRI. The analysis of atypical signs may improve the diagnostic accuracy of MRI for HCC.
Keywords
Introduction
Imaging examinations play important roles in the screening, qualitative diagnosis, staging, treatment planning, and follow-up monitoring of patients with hepatocellular carcinoma (HCC). 1 Computed tomography (CT) and magnetic resonance imaging (MRI) are the first options for the qualitative clinical diagnosis of HCC, but MRI images are clearer and more accurate than CT. 2 However, the complexity of the occurrence of HCC and diversity of pathological types, as well as the overlap in signs with other liver diseases, mean that MRI findings are often complex and varied. 3
Typical HCC shows low signal intensity on T1WI, slightly high signal intensity on T2WI, significantly high signal intensity on diffusion-weighted imaging (DWI), low signal intensity on apparent diffusion coefficient (ADC), and an ADC value generally <1.0 × 10⁻³ mm2/s. 4 The blood supply by the hepatic arteries provides a pathological basis for the tumor’s classic obvious enhancement in the arterial phase. A decreased signal is obtained in the portal phase and a relatively low signal in delayed phase, and annular pseudoenvelope enhancement can be observed. 5 HCC may present with complex signals when accompanied by bleeding or calcification, central scars, or steatosis. 6 However, the atypical features of HCC images are generally associated with pathological type, level of differentiation, and tissue composition. 7
The American College of Radiology first released the Liver Imaging Report and Data System (LI-RADS) in 2011, and this was updated in 2018. 8 However, the diversity of pathological types and complexity of the progression of HCC mean that some overlapping and confusing signs still need to be explained. 9 We analyzed the features and MRI data for 66 patients diagnosed with atypical HCC to improve the diagnostic accuracy for atypical cases with the aims of improving the early diagnosis and treatment of HCC, improving the treatment effect and prognosis, and avoiding unnecessary surgery and over-treatment of benign lesions. For patients with other primary tumors, the identification of intrahepatic lesions as HCC or metastasis of the primary tumor is important to ensure appropriate treatment planning.
Materials and methods
Case selection and clinical data
MRI and clinical data for patients with surgically and pathologically confirmed HCC treated at Fujian Provincial Hospital from January 2013 to October 2018 were collected and analyzed retrospectively. The inclusion criteria were patients who completed all scan sequences with good respiratory coordination, clear images, and clear lesion display. The exclusion criteria were patients with contraindications, patients who did not receive enhanced scanning, or patients with obvious respiratory movement artifacts or unclear image display. This study was conducted in accordance with the Helsinki Declaration and approved by the Ethics Committee of Fujian Provincial Hospital. All subjects signed informed consent prior to the study.
MRI inspection method
MRI examinations were carried out using a Siemens Verio 3.0T (Siemens Healthcare, Erlangen, Germany) or Philips Achieve 1.5T MR tester (Philips Healthcare, Best, the Netherlands). The scan sequences and parameters were as follows: axial breath holding 2D Flash T1WI sequence, repetition time (TR) 210 ms, same phase echo time (TE) 2.3 ms, opposed phase TE 3.6 ms, field-of-view (FOV) 34 to 38 mm, matrix 256 × 179, number of excitations 1, layer thickness 5 mm, and interval 1 mm; fat inhibitory turbo spin echo (TSE) T2WI sequence, TR 2,000 ms, TE 78 ms, FOV 34 to 38 cm, matrix 256 × 179, number of excitations 1, layer thickness 5 mm, interval 1 mm, and echo chain length 9. The DWI sequence applied the respiratory navigation single excitation spin echo imaging sequence and fat suppression technique with the following parameters: FOV 38 cm, matrix 128 × 81, layer thickness 5 mm, interval 1 mm, TR 2,200 ms, and TE adjusted with the b value, b = 0, 800 and 1,200 s/mm2. Dynamic enhanced scanning adopted the 3D volume interpolation fast disturbing phase gradient echo T1WI sequence: TE 1.4 ms, TR 3.94 ms, FOV 36 cm, matrix 320 × 224, number of excitations 1, layer thickness 3 mm, and interval 0.6 mm. Magnevist solution (Magnevist, Bayer AG, Berlin, Germany) of 0.1 mmol/kg was routinely used as the contrast agent. Multiple fast scans were carried out at 15 s, 40 s, 5 minutes, or 10 minutes after injection.
Image analysis
MRI data for all patients were independently analyzed by two senior doctors specializing in abdominal diseases, and the pathological results were compared. The doctors reached agreement on all results.
Pathological examination
All patients underwent aspiration biopsy or excision and the pathological sections were examined by routine hematoxylin and eosin staining and immunohistochemical staining. A modified Lillie–Mayer hematoxylin stain and an eosin stain (aqueous solution) were used for hematoxylin and eosin staining. First, paraffin sections were dewaxed in xylene I and II. They were then rinsed with anhydrous ethanol, 95% ethanol, 80% ethanol, and tap water. The hematoxylin staining solution (modified Lillie–Mayer) was applied, and the sections were washed under tap water. After hematoxylin staining, l% hydrochloric acid ethanol solution was applied for several seconds for differentiation (preparation of 1% hydrochloric acid ethanol solution: 99 mL 75% ethanol plus 1 mL concentrated hydrochloric acid). Next, the water was rinsed back to blue. In some cases, lithium carbonate water solution was used for bluing, followed by a tap water wash. The eosin staining solution (aqueous solution) was then applied, and the sections were lightly washed, followed by color mixing in 95% ethanol I and II. Dehydration was then performed in anhydrous ethanol I and II, and clearing was performed in xylene I and II. Finally, the film was sealed with glue for microscopic examination.
An improved Gomori process (ammonia hydroxide process) was then used. A mesh fiber staining kit (Fuzhou Maixin Biotechnology Development Co., Ltd., Fuzhou, China) was used for the paraffin sections. The paraffin sections were dewaxed in water, rinsed, and placed in a wet box. A drop (100 µL) of oxidation solution (Reagent A) was then added to the section, which was incubated for 3 to 5 minutes and then rinsed in water for 1 minute. Next, a drop (100 L) of bleach solution (Reagent B) was added until the slices were colorless, and they were then rinsed under running water. A drop (100 L) of morticized solution (Reagent C) was then added, and the sections were incubated for 5 to 10 minutes. They were rinsed with running water and then distilled water one time each. After the ammonia–silver solution (Reagent D) and distilled water were evenly mixed in a 1:3 ratio, a drop (100 L) was added onto the section, which was incubated at 37°C for 2 to 3 hours. The section was then quickly washed with distilled water. One drop (100 L) of reducing solution (Reagent E) was added, and the section was incubated for 10 to 30 seconds until the tissues turned brown and black; it was then rinsed with water. Finally, hematoxylin restaining, dehydration, clearing, and neutral gum sealing were performed.
For immunohistochemical staining, the specimens were fixed with 10% neutral formalin, routinely dehydrated, embedded in paraffin, stained with hematoxylin and eosin, and examined under a light microscope. Immunohistochemical staining was performed by the EliVision method (Maixin Bio, Fuzhuo, China), and DAB color rendering was performed. The primary antibodies used were CK7 (Clone OV-TL 12/30), CK20 (Clone Ks20.8), CDX2 (Clone AMT28), WT1 (Clone WT49), P53 (Clone DO-7), ER (Clone SP1), PR (Clone SP2), and ARID1A (Clone HPA005456). The primary antibodies (incubation time, 60 minutes) and EliVision Plus kit were purchased from Maixin Bio. The staining procedure was carried out according to the reagent manufacturers’ instructions, and positive and negative controls were set for each experiment.
Results
Patients
Sixty-six patients were included in the study. All 66 had single lesions. The patient group comprised 45 men and 21 women, aged 22 to 64 years (median age 43.3 years). Alpha-fetoprotein (AFP) was positive in 9 patients and negative in 57 patients. Twelve patients had a history of hepatitis and liver cirrhosis and three had a history of other malignant tumors.
Main signs of atypical manifestations on MRI plain scan
Twelve patients (12/66) had high signal intensity on T1WI and nine were diagnosed with highly differentiated liver cancer after surgery (Figure 1a–c). Eighteen patients (18/66) had a reduced opposed phase signal, correlated with cell steatosis (Figure 2a–c). Six patients had an apparent high signal intensity (6/66) and six patients had obvious cystic degeneration (6/66) on T2WI. DWI revealed an equal or slightly high signal in nine patients (9/66). The corresponding ADC diagram revealed a higher signal, and the ADC value was <1.2 × 10⁻³ mm2/s. Most of the lesions were cysts (Figure 3). Two patients were diagnosed with bile cell carcinoma before surgery and poorly differentiated liver cancer was confirmed by pathology after surgery.

Highly differentiated primary hepatocellular carcinoma in left lateral liver lobe. (a) T1WI shows a high signal in the lesion. (b, c) Dynamic enhancement shows a poor blood supply to the lesion with a high signal in the delayed phase.
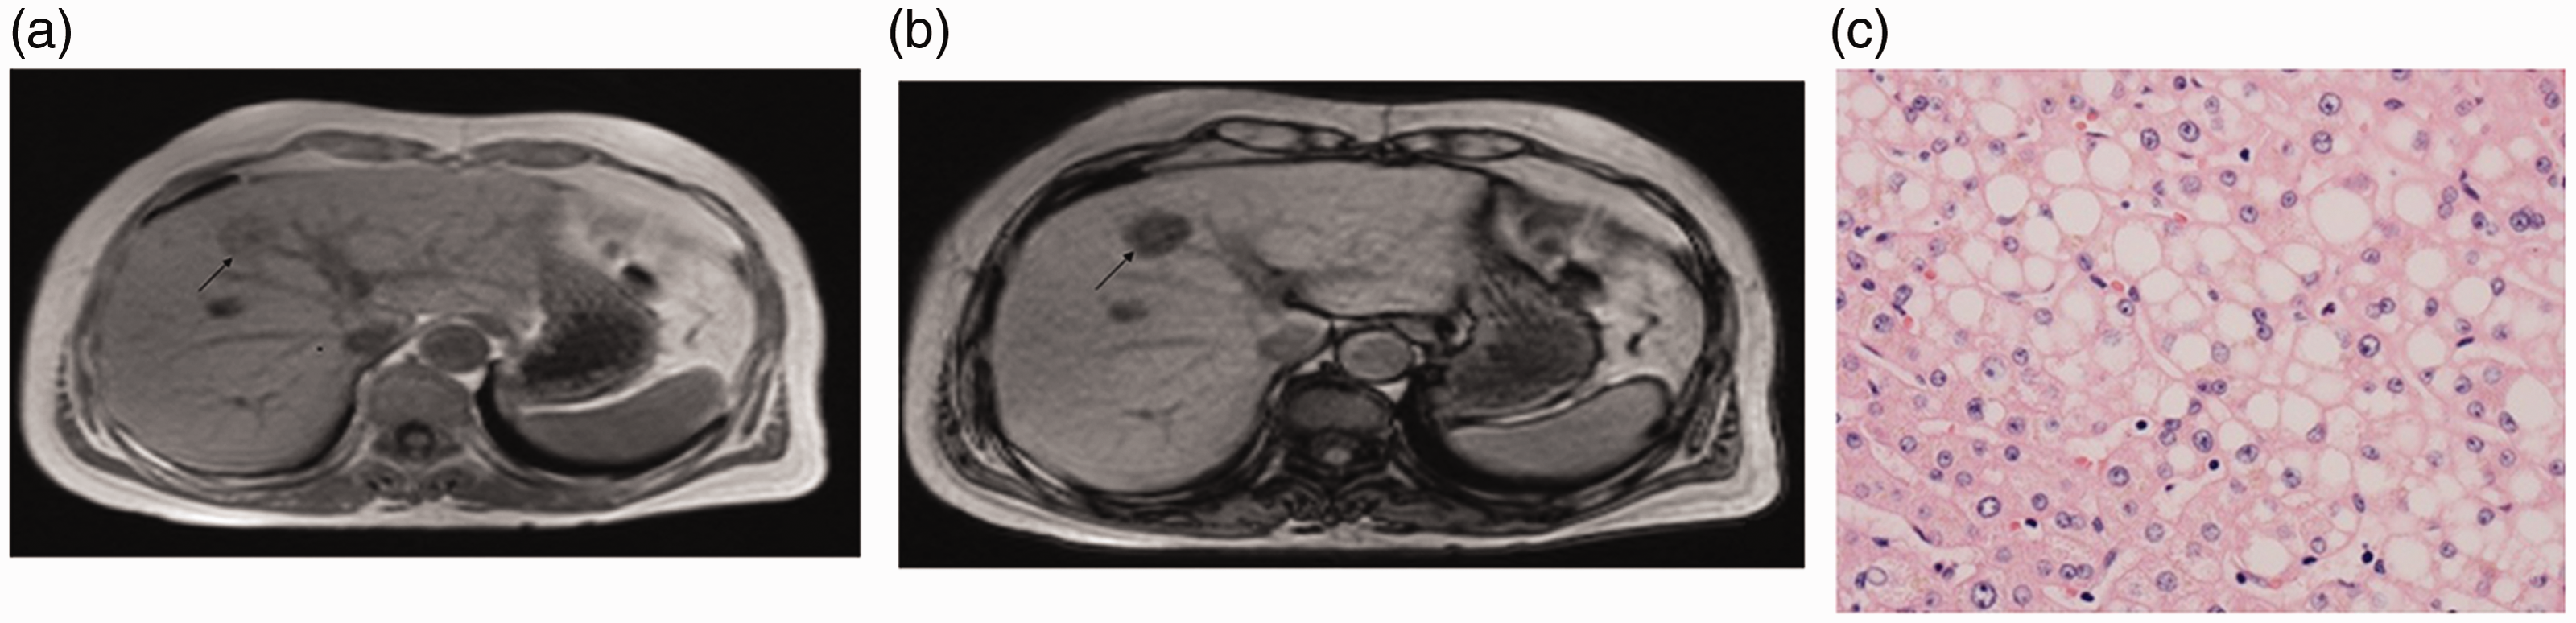
Magnetic resonance images (MRI) and tissue sections of a nodular primary hepatocellular carcinoma (clear cell subtype) in the left liver in a 63-year-old woman. (a) MRI image. (b) Opposed phase map showing significantly decreased signal. (c) Ballooning degeneration and hepatocyte steatosis (hematoxylin and eosin stain, ×400).

Magnetic resonance image of multiple nodular moderately and poorly differentiated primary hepatocellular carcinoma lesions invading the liver capsule in a 58-year-old man (gallbladder and middle liver). Most of the lesions developed cystic necrosis. Red arrow, cystic portion; green arrow, solid portion.
Main signs of dynamic enhancement
Dynamic enhancement showed progressive enhancement in 15 patients (15/66), ring enhancement in three (3/66), delayed central ‘star-like aristate scars’ (T2WI revealed high signal intensity) in 21 (21/66) (Figure 4a–c), irregular patchy enhancement in three (3/66) (Figure 5a), ‘nodule-in-nodule’ enhancement in six (6/66) (Figure 5b), delayed central patchy enhancement in six (6/66), and poor blood supply in three patients (3/66) (Figure 6a–6c).

Magnetic resonance images and tissue sections of hepatic nodular primary hepatocellular carcinoma in the left liver in a 73-year-old woman. (a) Central T2 high single ‘scars’. (b) High single enhancement in the delayed phase. (c) Secondary fibrosis based on central focal necrosis under a microscope (hematoxylin and eosin stain, ×200).

Magnetic resonance images of nodular moderately differentiated primary hepatocellular carcinoma (HCC) in the right liver in a 45-year-old woman, showing a partially clear cell HCC with hemorrhage and necrosis. The stroma of the tumor thrombus was rich in lymphocytes and plasma cell infiltration. (a) ‘Nodule-in-nodule’ enhancement (red arrows). (b) Central patchy high enhancement (red arrows).

Magnetic resonance images of isolated moderately differentiated primary hepatocellular carcinoma (sclerotic type) in the right liver in a 45-year-old woman. (a–c) Decreased focal enhancement in the delayed phase, but a range of progressive enhancement. Red circles indicate gradually increasing area of enhancement; arrows indicate decreased strength of enhancement.
Pathological results
Aspiration biopsy was carried out in nine patients and excision was performed in the remaining 57 patients. Twenty-one patients had hepatic nodular clear cell HCC, nine had nodular highly differentiated HCC, 24 had moderately differentiated HCC (three sclerotic type), and 12 had moderately and poorly differentiated HCC. Regarding the immunohistochemistry results, CD34 staining revealed vascularization and the biopsies were positive for AFP and glypican-3, and the bile capillaries were positive for CD10 and CEA. Reticular fiber staining confirmed that the liver plate comprised more than three layers.
Discussion
The MRI features of different types of HCC differ. 10 The present findings showed five main atypical MRI features of HCC. (1) Typical HCC presents with a lower or low signal on T1WI sequence. However, 12 patients in the current study presented with a high or higher signal and nine were diagnosed with highly differentiated liver cancer after surgery. The differentiation of highly differentiated HCC cells is similar to that of normal cells and the T1WI signals are therefore similar to those of normal liver parenchyma, showing an equal, slightly high, or high signal, similar to the changes in hyperplastic nodules in liver cirrhosis. (2) The opposed phase signal was significantly reduced in the current patients. Furthermore, 18 patients had steatosis. Steatosis is more common in clear cell HCC than in other pathologic types of HCC and is a more significant sign of HCC, especially compared with other types of lesions that are also prone to fatty degeneration. The same and opposite phase sequence values therefore cannot be ignored. (3) DWI revealed an equally and slightly high signal, and the corresponding ADC diagram revealed a higher or high signal. Nine patients in this group were classified as having highly differentiated liver cancer based on postoperative pathology. DWI reflects the degree of limited diffusion of water molecules, which has been used as an effective basis for the differential diagnosis of benign and malignant lesions. However, when the level of differentiation of liver cancer is high, DWI may not show typical high signal intensity, and may present with a slightly high or even equal signal. The corresponding T1WI signal was not significantly different from normal liver parenchyma, and it is necessary to consider other symptoms and signs. If it cannot be distinguished, a hepatocyte-specific contrast agent-enhanced scan or aspiration biopsy may be feasible. (4) Most lesions in the current study were cysts, including two patients diagnosed with bile cell carcinoma before surgery but who were pathologically confirmed to have poorly differentiated liver cancer after surgery. A lower degree of tumor differentiation is associated with greater malignancy and faster proliferation of tumor cells, increasing the likelihood of necrotic cystic changes, such as sarcomatoid liver cancer. These may also appear as more cystic necrotic regions, usually at the center of the lesion. (5) Varying dynamic enhancement scan methods. Twenty-one patients in this study had delayed central ‘star-like aristate scars’ (T2WI revealed high signal intensity). Three patients had a poor blood supply, 15 had progressive enhancement, three had ring enhancement, three had irregular patchy enhancement, six had ‘nodule-in-nodule’ enhancement, and six had delayed central patchy enhancement.
The MRI signs will depend on the blood supply pattern of the liver cancer foci, which may in turn depend on the degree of differentiation and tissue composition of the liver cancer. 11 This suggests that the type of liver cancer may be initially judged according to the blood supply mode in MRI images. For example, sclerotic liver cancer shows less marked but more widely distributed enhancement over time. The World Health Organization defines sclerosing liver cancer as characterized by significant tumor fibrosis. Many cases in this study showed ‘nodule-in-nodule’-like enhancement, which may be related to the pathological stage of the lesion. Notably, 21 patients presented with a ‘star-like aristate scar’ phenomenon in which the central scar was characterized by a high T2WI signal and a time-delayed enhancement. Delayed enhancement indicates fibrous connective tissue; however, the distribution of fibrous components varies among different types of HCC. It is therefore possible to infer the pathological type of HCC based on the location of the delayed enhancement components.
The above atypical signs may aid the qualitative diagnosis of HCC but are not absolute, and the corresponding signs also need to be differentiated. An equal and high signal on T1WI is suggested to indicate better differentiation of liver cancer, which could be identified by focal nodular hyperplasia. The ADC value and enhancement mode, combined with a history of hepatitis and AFP, are helpful for the differential diagnosis of hepatitis. Hepatic adenoma, vascular smooth muscle lipoma, and fatty metastasis 12 should be distinguished when the signal intensity is obviously decreased in the opposed phase. If most of the lesions become necrotic, it may be difficult to differentiate these from cholangiocarcinoma, in which case dilatation of the bile duct around the lesion and the degree of traction of the adjacent capsule should be observed, and the presence of a ‘target sign’ of enhancement in the DWI and arterial phase should be determined. ‘Nodule-in-nodule’ enhancement should be interpreted as an epithelioid angiomyolipoma, and the lack of blood supply or ring enhancement should be interpreted as isolated necrotic nodules and metastasis. 13 This was a retrospective study based on conventional MRI and was limited to the pathological group with possible overlapping signs. Additionally, specific examination sequence support for prediction of the texture type was lacking. These limitations are expected to be resolved in future research and application of new MRI sequences.
MRI allows the clear diagnosis of typical cases of HCC, and can also distinguish atypical cases from other tumors or tumor-like lesions. The analysis of atypical signs can improve diagnostic accuracy. However, the complexity and variability of pathological types are associated with increasing corresponding MRI signs, and atypical signs may thus still lead to confusion. The identification and differentiation of fine signs, diagnostic experience, and retrospective analyses of misdiagnosed cases will all help to improve our understanding of the role of MRI in the diagnosis of atypical HCC.