
Abstract
Objective
The ataxia telangiectasia mutated (ATM) gene contains a functional single nucleotide polymorphism (SNP) rs1801516 (G > A) that may be associated with cancer risk. This meta-analysis aimed to interrogate the relationship between rs1801516 and cancer occurrence and disease etiology.
Methods
We retrieved and identified the available case–control studies that met the inclusion criteria from the PubMed, Web of Science, and Embase databases. Odds ratio (OR) and 95% confidence intervals (CIs) were used to measure the association between rs1801516 and cancer risk. Additionally, we performed sensitivity, subgroup, and publication bias analyses.
Results
After inclusion criteria were met, the meta-analysis included 29 studies, with 9,453 cancer patients (cases) and 14,646 controls. No association was found between rs1801516 and cancer risk (pooled OR = 0.911; 95% CI, 0.740–1.123). Concordantly, no association was found between rs1801516 and cancer risk after subgroup analysis by source of controls, cancer type, or ethnicity, which confirmed the finding of the dominant model that this SNP is not involved in the occurrence of cancer.
Conclusions
Through this meta-analysis, we found no association between rs1801516 and cancer occurrence as a risk factor. These data provide useful information for future case–control studies on cancer etiology.
Introduction
Cancer occurrence is increasing because of an aging population, the prevalence of smoking, physical inactivity, and other lifestyle factors. 1 Cancer is a cellular abnormality initiated by uncontrolled growth caused by an accumulation of damage or mutations in the genetic material due to hereditary and environmental factors, which causes cells to evade the many signals that control cell growth and death. 2 Genetic factors have a greater effect on cancer initiation than do lifestyle or environmental factors. 3 Many candidate genes and variations have been identified that contribute to cancer susceptibility.
The ataxia telangiectasia mutated (ATM) gene is located on chromosome 11q22-23 with a full length of 150 kb. 4 It includes 66 exons that encode a 12-kb transcript. The encoded protein belongs to the phosphatidylinositol (PI)3/PI4-kinase family. As a Ser/Thr protein kinase, ATM is an important regulator of cell cycle checkpoint signaling and cellular responses to DNA damage, and it acts by phosphorylating downstream targets. 5 After being activated by DNA double-strand breaks, ATM is involved in recognizing broken or damaged DNA stands and in assisting DNA repair by recruiting enzymes to recover the damaged strands. 6 Three deleterious missense variants of the ATM gene are associated with an increased risk of cancer. 7 Furthermore, in a study of human gastric cancer, ATM mutation and loss of ATM protein were associated with large distal tumors of intestinal-type histology and the induction of characteristics of old age, 5 suggesting that ATM-mediated phosphorylation plays a role in the response to other types of genotoxic stress. 8 Missense variants in ATM are also associated with a predisposition to prostate cancer. 9 In addition, ATM has been demonstrated to sustain cancer stem cell survival by promoting autophagic flux, and ATM kinase activity is enhanced in HER2-dependent tumors. 10
Variations in the ATM gene can affect the normal function of the protein and increase cancer risk. The polymorphism rs1801516, also known as G5557A, involves the substitution of an asparagine for an aspartic acid at amino acid position 1853, which is located in ATM exon 39. 11 Presently, its exact effect is unclear. A genome-wide association study found that this missense mutation was associated with melanoma and that the A allele was protective. 12 Previous studies have found an association between this polymorphism and increased cancer risk;13,14 however, consensus on this association is yet to be reached, which may be due to several factors varying among studies, including cancer type, sample size, genetic background or race of participants, and potential confounding bias. 15
When there is considerable variation in the results of studies on topics that have been studied extensively, meta-analysis can be used to identify a common effect. 16 Such an analysis was conducted by Gao et al. (2010) 17 to assess whether the ATM rs1801516 polymorphism was associated with the risk of breast cancer. The analysis included 9 epidemiological studies with 4,191 cases and 3,780 controls. Kang et al. 18 analyzed the association between rs1801516 and papillary thyroid carcinoma risk in 2014. However, only two relevant studies were included in this meta-analysis. It is necessary to perform a meta-analysis of rs1801516 and its association with overall cancer risk because these two recent meta-analyses focused only on breast cancer and papillary thyroid carcinoma. Additional studies have reported the role of rs1801516 in other cancer types, including lung cancer, prostate cancer, and leukemia. Some newly published studies have reported an association between rs1801516 and cancer risk. Therefore, we performed a new meta-analysis of the ATM rs1801516 polymorphism and the risk of different cancer types that includes more recent research. Although meta-analysis can increase power in rare cancer association studies by gathering information across different cancers using multiple ethnic samples, different cancers still have different pathophysiologies and etiologies. We hypothesized that different types of cancers might increase the heterogeneity of the studies; we then performed a subgroup analysis of cancer types to investigate the source of heterogeneity. 19
Materials and Methods
Reporting for this meta-analysis followed the Preferred Reporting Items for Systematic Reviews and Meta-Analyses (PRISMA) guidelines. All data in this study were from published studies and did not involve patients directly. Therefore, ethics committee approval and informed consent were not required.
Identification of relevant studies
We performed a literature search of three online literature databases (PubMed, Web of Science, and Embase) to screen and identify available studies to be included in the meta-analysis. The keywords used were “ATM,” “ataxia-telangiectasia mutated,” “rs1801516,” and “cancer.” Other possible studies were screened from the reference lists of included studies and relevant reviews.
The inclusion criteria were as follows: (1) the studies were designed as case–control; (2) the cases in the identified studies were cancer patients; and (3) the studies reported the frequencies of ATM alleles and genotypes. When authors published multiple articles using the same or overlapping datasets, we selected the study with the larger sample for inclusion. Exclusion criteria included (1) letters, meta-analyses, reviews, or case reports or those with healthy controls; (2) studies without sufficient data; (3) duplicate studies with overlapping data. In the event that inclusion data, including allele frequency, genotype, or another sample characteristic, were not present in a report, we contacted the authors by email to obtain the relevant information.
Data analysis
Two investigators (Yueting Li and Pengxu Shi) independently extracted the data from each eligible publication, including the last name of the first author, the year of publication, the geographic region, the genotyping method, the sample size, and the genotyping results for both cases and controls. Data pertaining to patient ethnicity, control source, and cancer type were extracted with a view to determining the contributions of underlying characteristics to the study findings.
Statistical analysis
The Hardy–Weinberg equilibrium (HWE) of control genotypes was calculated using a χ2 test. The strength of the association of rs1801516 and cancer was evaluated using odds ratios (ORs) and 95% confidence intervals (CIs). To calculate the pooled estimates of the ORs and 95% CIs among the studies, a random effects model was used to resolve inter-study heterogeneity. 20 A random effects model evaluates the likely effect size across different cancers and takes heterogeneity across studies into account. It is different from a fixed effects model, which evaluates the most likely effect size from multiple studies by hypothesizing that they are sampled with the same cancer or from a single population, but the model can be biased by high heterogeneity across studies.
Three genetic models (allele, dominant, and recessive) were used to measure the overall pooled ORs. As described in the previous study, we compared OR1 (AA vs. aa), OR2 (Aa vs. aa), and OR3 (AA vs. Aa), where A is the risk allele. 16 We selected the most appropriate genetic model using a previous study.21,22
We evaluated the degree of inter-study heterogeneity using a Q statistic,23,24 where P > 0.05 was defined as an absence of heterogeneity. We performed subgroup analysis for ethnicity (e.g., Caucasian or Asian), source of controls (e.g., hospital- or population-based), and type of cancer (i.e., breast cancer, prostate cancer).
By means of sensitivity analysis, we evaluated whether a single study could influence the pooled effect size. Specifically, we omitted each study from the meta-analysis in turn and subsequently evaluated whether any significant alterations were made to the pooled effect size.
Publication bias was investigated by using funnel plots generated for each study, in which the standard error of log(OR) was plotted against the log(OR). Possible publication bias was determined when the plot was asymmetric, in which case an Egger test was used to determine degree of asymmetry, with P < 0.05 indicating publication bias. 25
All statistical calculations were performed using Stata version 10.0 (Stata Corp., College Station, TX, USA).
In silico analysis
To predict the potential association between rs1801516 and the expression of ATM, we conducted expression quantitative trait loci (eQTL) analysis using the GTEx portal website (http://www.gtexportal.org/home/).
Results
We searched online literature databases and identified relevant articles for inclusion. The literature screening flowchart is shown in Figure 1. According to the established inclusion criteria, 29 publications were ultimately screened and included in our meta-analysis.13,14,26–52 These 29 case–control studies collectively contained 9,453 patients with cancer (cases) and 14,646 unaffected participants (controls). Individuals with different ethnic backgrounds were included (e.g., Caucasian, Hispanic, African and Asian, which included Arab, East Asian, and Sinhalese). Table 1 summarizes the main characteristics of the included studies, and Table 2 summarizes the genotype and allele frequencies of rs1801516 SNP and HWE in controls. Of the 29 studies, four deviated significantly from HWE.13,42,46,47

Preferred Reporting Items for Systematic Reviews and Meta-Analyses (PRISMA) search flow diagram.
Baseline characteristics of qualified studies in this meta-analysis.

Distribution of genotype and allele frequencies of the ATM rs1801516 polymorphism.

ATM, ataxia telangiectasia mutated; PHWE, P-value of Hardy–Weinberg equilibrium test in the genotype distribution of controls.
Heterogeneity detection and pooled analysis
The association between the rs1801516 polymorphism and cancer risk was evaluated using pooled ORs (with 95% CIs) under the dominant, recessive, homozygous codominant, heterozygous codominant, and allele genetic models (Figure 2, Table 3). We selected the dominant model to perform the pooled analysis according to our model selection strategy.21,53 The pooled results of the dominant model indicated that there was no association between the rs1801516 polymorphism and cancer risk (OR, 0.911; 95% CI, 0.740–1.123). After removing the four studies that deviated significantly from HWE, there was no obvious change in the pooled result (OR, 0.914; 95% CI, 0.725–1.152). Subgroup analysis was then performed, which also failed to detect any association between rs1801516 and cancer risk in any ethnicity (Table 4). Moreover, no association was observed in the subgroup analysis between rs1801516 and cancer by source of controls (hospital-based and population-based). Additionally, we performed a subgroup analysis by type of cancer, again finding no association between rs1801516 and the occurrence of breast cancer, prostate cancer, rectal cancer, leukemia, bladder cancer, colorectal cancer, renal cancer, head and neck cancer, cervical cancer, melanoma, thyroid cancer, ovarian cancer, or lung cancer (Table 4).

Forest plot of the association between the rs1801516 polymorphism of the ATM gene and cancer in the dominant genetic model (GG + GA vs. AA). ATM, ataxia telangiectasia mutated; OR, odds ratio; CI, confidence interval.
Summarized ORs with 95% CIs for the association of ATM rs1801516 polymorphism with cancer.

ATM, ataxia telangiectasia mutated; n, number of studies; OR, odds ratio; CI, confidence interval; Pz, P-value for association test; Ph, P-value for heterogeneity test; Pe, P-value for publication bias test.
Stratified analysis of the association of ATM polymorphism rs1801516 with cancer under the dominant model.

ATM, ataxia telangiectasia mutated; n, number of studies; OR, odds ratio; CI, confidence interval; Pz, P-value for association test; Ph, P-value for heterogeneity test.
Sensitivity analysis
We next sought to determine the contribution of individual studies to the pooled results via sensitivity analysis. To do this, we removed each study from the analysis in turn and determined pooled ORs. We detected no significant changes between each of these analyses and the overall results of the meta-analysis, indicating that none of the included studies significantly altered the overall results. Therefore, our meta-analysis results are stable and reliable.
Publication bias
Publication bias was assessed by generating and analyzing a funnel plot (Figure 3); no significant effects of publication bias were detected by Egger’s test (Table 3).
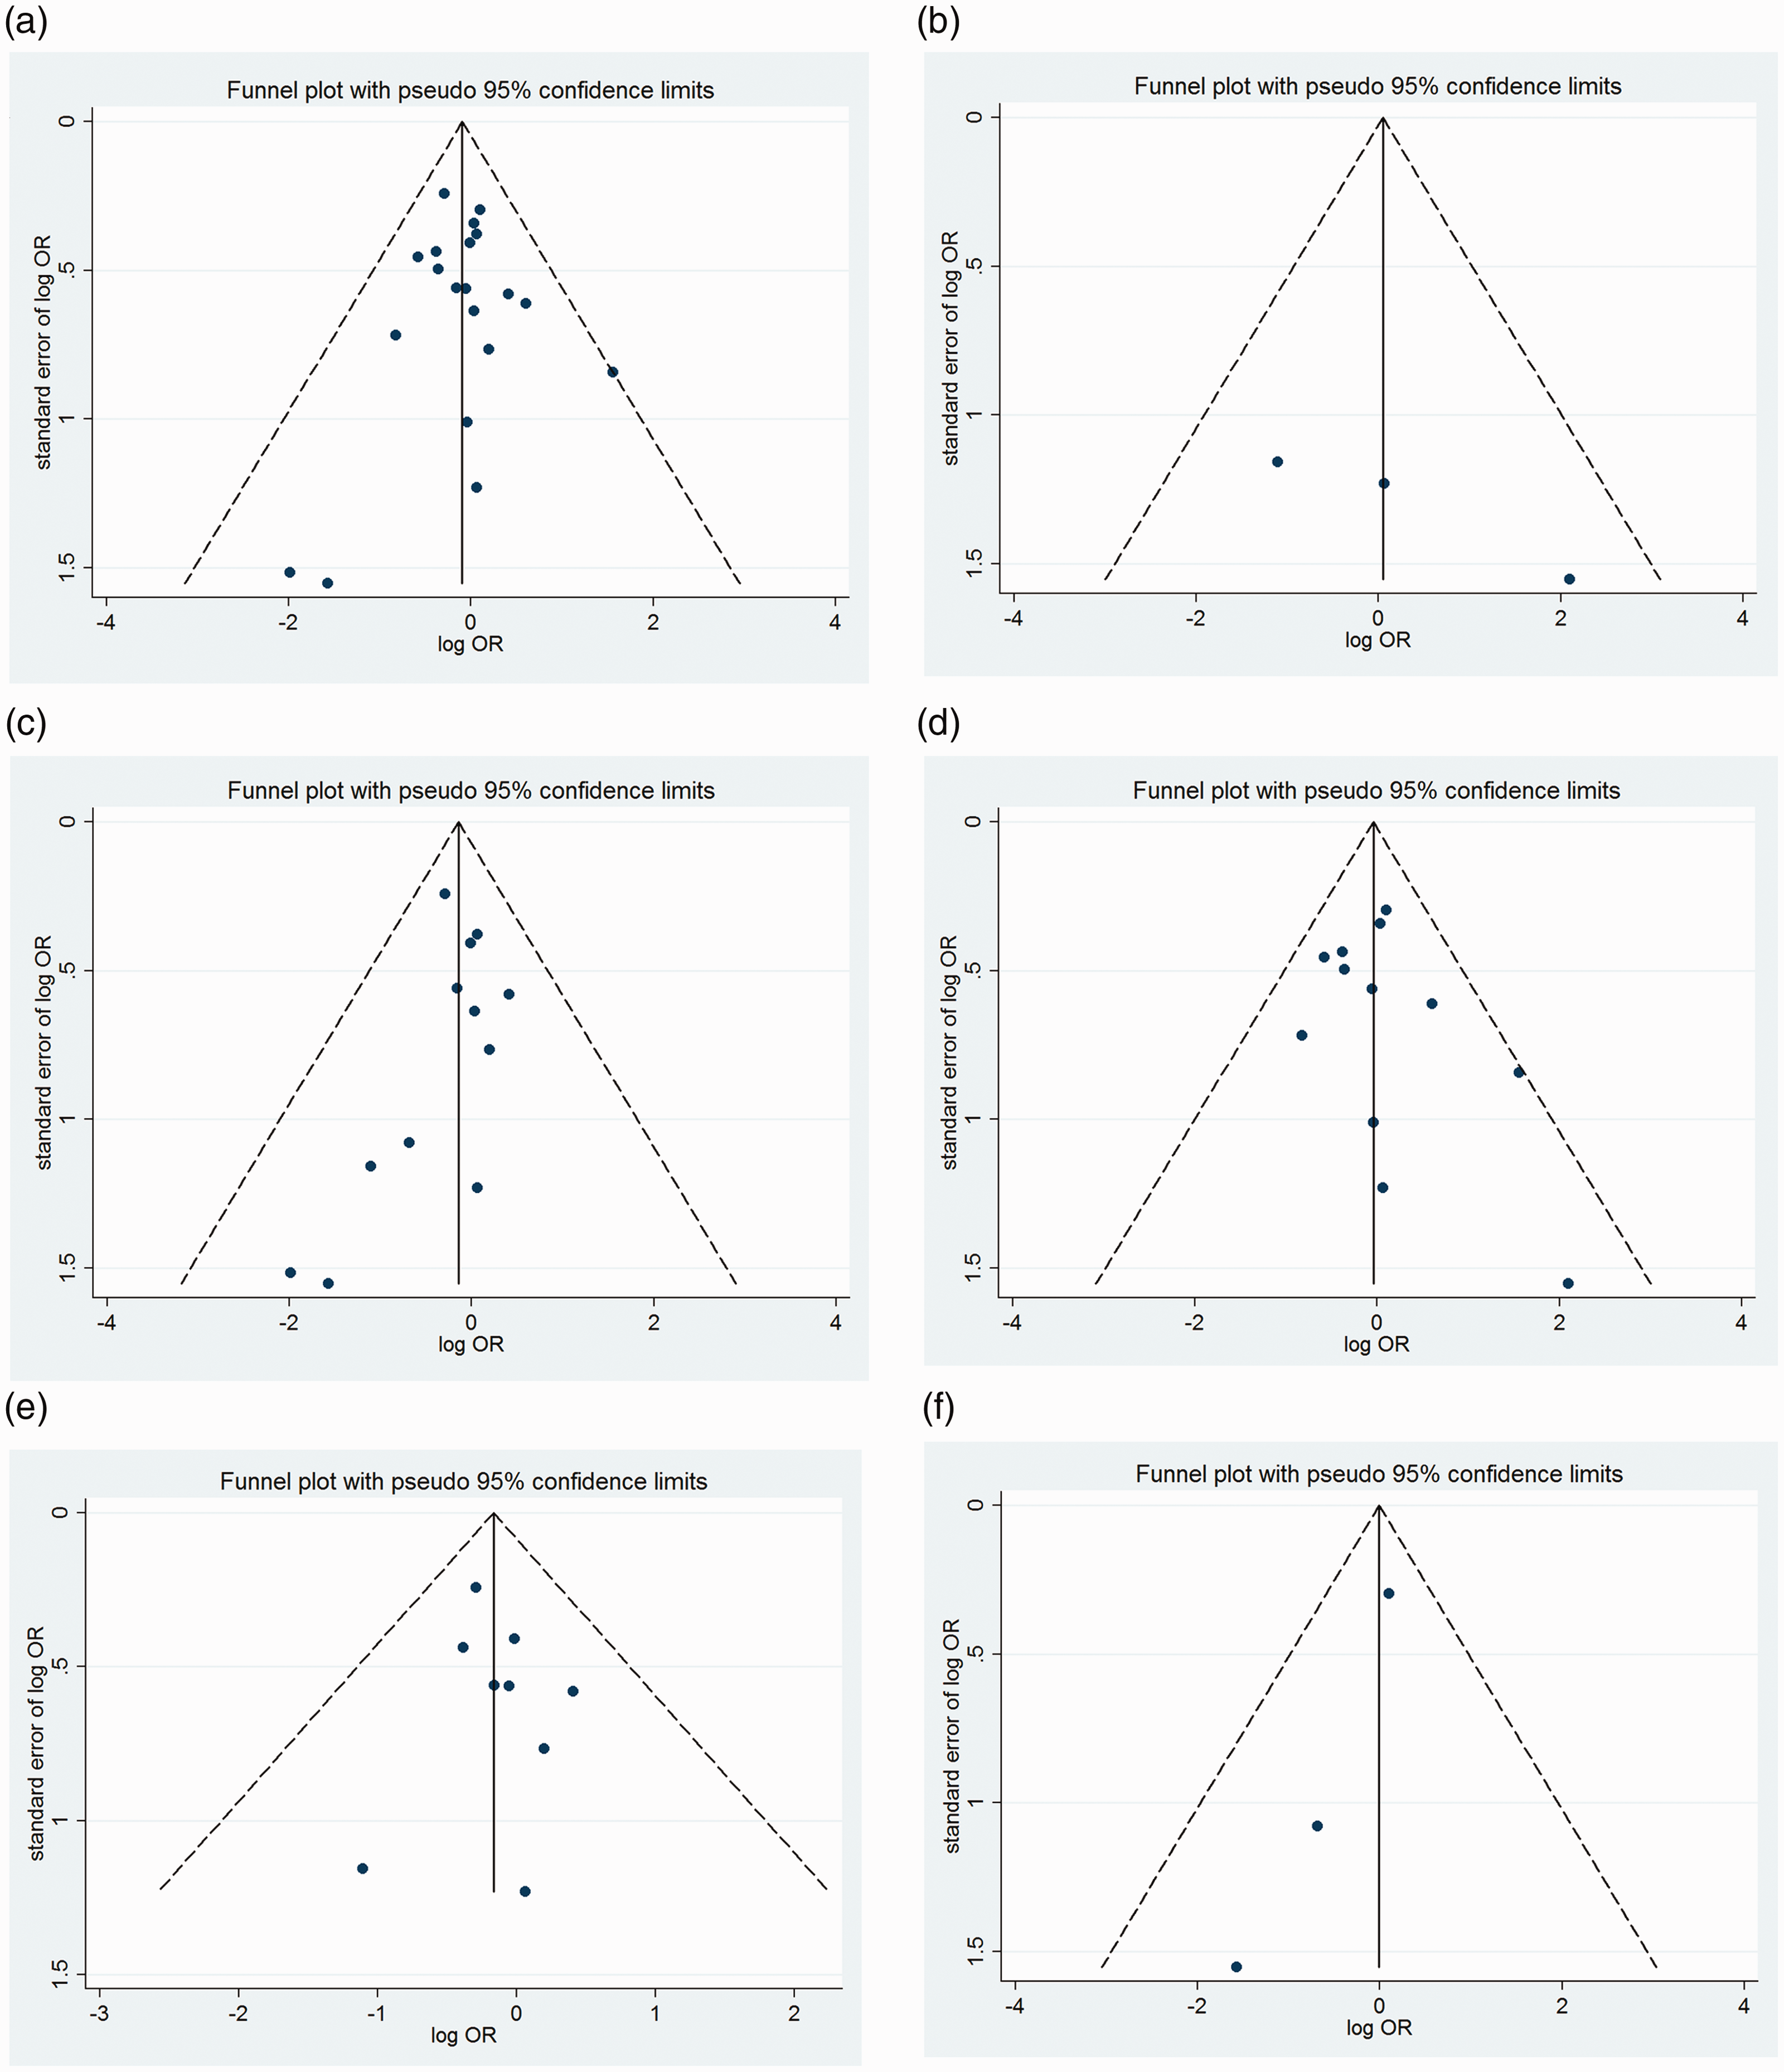
Funnel plot analysis depicting publication bias in the association between the rs1801516 polymorphism of the ATM gene and cancer in (a) Caucasian subgroup; (b) Asian subgroup; (c) population-based controls subgroup; (d) hospital-based controls subgroup; (e) breast cancer subgroup; and (f) thyroid cancer subgroup. ATM, ataxia telangiectasia mutated; OR, odds ratio.
In silico analysis
Using eQTL analysis, we found that, compared with the G allele, the A allele of the rs1801516 locus did not alter expression of ATM mRNA (Figure 4).

In silico analysis of ATM expression related to rs1801516 polymorphism. ATM, ataxia telangiectasia mutated. The box shows the average value and the line indicates the standard error.
Discussion
We explored the underlying relationship between the rs1801516 SNP of the ATM gene and the occurrence of cancer using a meta-analysis that included 29 case–control studies. The pooled results indicated that this polymorphism is not associated with cancer risk, and the subgroup analyses showed no associations between this SNP and cancer risk in any subgroup defined by ethnicity, source of controls, or cancer type.
Previously, a putative association between rs1801516 and the occurrence of cancer was analyzed in two meta-analyses.17,18 These studies found that this SNP in ATM was not a risk factor for breast cancer or papillary thyroid carcinoma, respectively. Compared with the previous meta-analysis on breast cancer susceptibility, three new studies were included in our meta-analysis. 17 Compared with the meta-analysis on thyroid cancer susceptibility, three new studies were included in our meta-analysis. 18 Generally, our results are consistent with those of the previous studies. Although our meta-analysis overlapped somewhat with prior analyses, there are some highlights compared with the previous studies. First, our analysis included new studies published after the previous meta-analyses were performed. Twenty-nine studies were included, which better represents the contribution of rs1801516 compared with the previous meta-analyses. Second, we performed subgroup analyses were by ethnicity, source of controls, and type of cancer to explore the potential origins of heterogeneity and to measure stability. Thus, our meta-analysis provided a more accurate and comprehensive analysis, leading to increased confidence in our finding that rs1801516 was not associated with the risk of breast cancer, prostate cancer, rectal cancer, colorectal cancer, leukemia, bladder cancer, renal cancer, head and neck cancer, cervical cancer, melanoma, thyroid cancer, ovarian cancer, or lung cancer.
Our ability to conclusively define stable effects by subgroup, however, was limited by the relatively small sample sizes included in the subgroup analysis. Only one study reported an association between rs1801516 and cancer risk in Arab, East Asian, and Sinhalese ethnicities. Moreover, except for breast and thyroid cancers, the association of any other cancer type was reported in only one study. Thus, because of the limited sample size, the results of the association between rs1801516 and cancer risk in these subgroups are not comprehensive.
A prior meta-analysis of individual patient data showed that ATM SNP rs1801516 was significantly associated with toxicity after radiotherapy in 5,456 patients with breast and prostate cancer. 54 The mutant allele increased the risk of radiation-induced normal tissue toxicity. Another meta-analysis of 2,000 patients from nine studies showed that the rs1801516 polymorphism significantly increased the risk of developing radiotherapy-induced late fibrosis. 55 Furthermore, a significant association was found between rs1801516 and papillary thyroid carcinoma after childhood exposure to ionizing radiation from the Chernobyl nuclear accident. 48 Thus, more research is needed to explore the role of rs1801516 in the occurrence of cancer and adverse effects in patients after treatment with radiation therapy.
There are some potential limitations to our current analysis. First, we did not analyze gene–gene interactions or epigenetics, which are factors that can influence cancer. Smoking, physical inactivity, and emotional state are also involved in the occurrence of cancer. Second, just one SNP in the ATM gene was analyzed, and information on this particular SNP was limited. Many polymorphic loci have been reported to be involved in the etiology of cancer.56–58 The occurrence of cancer is usually thought to involve multiple genes and their interactions. Third, there was clear heterogeneity in the recessive genetics model of the association between rs1801516 locus and the occurrence of cancer. The final pooled samples included Caucasian, Hispanic, African, Arabian, and Sri Lankan patients. The source of heterogeneity might be that the different ethnicities contained various genetic backgrounds. Finally, we did not register this study with the International Prospective Register of Systematic Reviews (PROSPERO) but we will do so in future studies.
Conclusion
In this study, we showed that there was no association between the rs1801516 SNP in the ATM gene and cancer risk. Additional studies on a wider array of ethnic populations are required to validate our subgroup analysis. Future studies should focus on environmental and epigenetic factors that contribute to the risk of cancer.
Footnotes
Authors’ contributions
Daqing Jiang conceived and designed the study. Yueting Li and Pengxu Shi were responsible for collecting the data, performing statistical analyses, and preparing the manuscript. All authors contributed to drafting the manuscript, and all read and approved the final version.
Declaration of conflicting interest
The authors declare that there is no conflict of interest.
Funding
This research received no specific grant from any funding agency in the public, commercial, or not-for-profit sectors.