
Abstract
Objective
Micro RNA (miR)-363 has many important biological functions in cancers, but its roles in esophageal squamous cell carcinoma (ESCC) remain unclear.
Methods
We used reverse transcription PCR to quantify the expression of miR-363 in 80 ESCC tissues and analyzed its relationship with clinicopathological factors and overall survival. The effects of miR-363 on cell proliferation, apoptosis, and invasion were detected using the MTT assay, flow cytometry, and Transwell invasion assays, respectively. Further, we investigated the post-transcriptional regulation of sperm-associated antigen 5 (SPAG5) expression by miR-363 using luciferase reporter assays. Finally, the effects of SPAG5 on miR-363 were studied by SPAG5 overexpression.
Results
miR-363 expression was decreased in both ESCC specimens and cell lines, compared with controls, and correlated with lymph node metastasis and tumor differentiation. Low miR-363 expression was identified as an independent prognostic factor for ESCC. miR-363 overexpression decreased ESCC cell proliferation and invasion and increased apoptosis, while the opposite was seen after miR-363 inhibition. Moreover, SPAG5 was identified as a direct target of miR-363, and the reintroduction of SPAG5 restored miR-363-induced effects.
Conclusions
miR-363 acts as a tumor suppressor by post-transcriptionally regulating SPAG5 expression, suggesting its potential as a diagnostic biomarker and therapeutic target for ESCC.
Keywords
Introduction
Esophageal squamous cell carcinoma (ESCC) accounts for about 90% of esophageal cancers each year. 1 Approximately one half of all ESCC cases worldwide occur in China, drawing increasing attention from Chinese clinicians and researchers. 2 Although advances in surgery, chemotherapy, radiotherapy, target therapy, and immunotherapy have been made in ESCC, prognosis remains poor. Consequently, more studies on the molecular mechanisms of ESCC carcinogenesis and pathogenesis are needed to identify occurrence or metastasis earlier to provide new treatment strategies.
Micro RNAs (miRNAs) are evolutionarily conserved noncoding RNAs, which post-transcriptionally regulate the expression of target genes by binding to their 3′ untranslated regions (UTRs). 3 miRNAs control many tumor aspects involved in the progression of carcinogenesis, such as cellular migration, proliferation, apoptosis, angiogenesis, and treatment response.4–8
miR-363 has many important biological functions in several types of cancer that are oncogenic or tumor suppressive.9–12 However, its role in ESCC remains unclear. In this study, we aimed to investigate the expression profile, biological functions, and corresponding molecular pathways of miR-363 in ESCC.
Material and methods
Patient samples and cell lines
Eighty ESCC samples and paired normal adjacent tissues (NAT) were obtained from The First Affiliated Hospital of Xi’an JiaoTong University between 2013 and 2015. None of the ESCC patients, who were diagnosed by pathology after surgery, had received neoadjuvant therapy or other traditional Chinese medicine treatments before recruitment. The Institutional Ethics Committee approved this project and written informed consent was obtained from all patients. Tissues were snap-frozen in liquid nitrogen and stored at –80°C until RNA extraction. ESCC cell lines (Eca109, Ec9706, TE-11, TE-10, and TE-1) and the esophageal normal epithelial cell line Het-1A were purchased from the Cell Bank of Type Culture Collection of Chinese Academy of Sciences (Shanghai, China). RPMI 1640 medium supplemented with 10% fetal bovine serum (FBS), 100 units/mL penicillin, and 100 g/mL streptomycin (all Gibco BRL, Life Technologies Inc., Gaithersburg, MD, USA)was used to culture cells at 37°C in a 5% CO2 incubator.
RNA extraction and quantitative reverse transcription PCR (qRT-PCR)
Total RNA from fresh tissues was isolated using TRIzol® reagent (Invitrogen Corp., Carlsbad, CA, USA) according to the manufacturer’s protocol. qRT-PCR was conducted using the PrimeScript® RT reagent kit (Perfect Real Time) and a BioRad iQ5 Real-Time PCR Detection System (Takara, Dalian, China). Reverse transcription was carried out in a 20-µL system with 1 µg total RNA. The expression levels relative to U6 were calculated using the formula 2−ΔΔCT.
Western blot analysis
For immunoblot analyses, 20 µg total protein was electrophoresed using 10% sodium dodecyl sulfate–polyacrylamide gel electrophoresis and transferred to a polyvinylidene fluoride membrane. This was then blocked with 5% skimmed milk and incubated with a primary antibody (dilution 1:2000; Abcam PLC, Cambridge, UK) for 12 hours at 4°C and the corresponding horseradish peroxidase-conjugated secondary antibody (dilution 1:400; Santa Cruz Biotechnology, Santa Cruz, CA, USA) at room temperature for 2 hours. Membranes were visualized using enhanced ECL detection reagents (Amersham, Little Chalfont, UK) according to the manufacturer’s instructions, followed by exposure to X-ray film in the dark. Densitometry analysis was performed using Scion Image software version 4.03 (Scion Corporation, Frederick, MD, USA).
Plasmid construction and cell transfection
miR-363 mimics (miR-363), negative control (miR-con), anti-miR-363 inhibitor (anti-miR-363), and anti-miR-inhibitors-negative control (anti-miR-con) were purchased from AngRang Inc. (Xi’an, China). Sperm-associated antigen 5 (SPAG5) cDNA containing the full coding sequence was cloned by PCR using primers 5′-GGAATTCATGTGGCGAGTGAAAAAACT-3′ and 5′-GCTCGAGGCTCAGAAA TTCCAGCAAT-3′. The cycling program was: 94°C for 5 minutes followed by 30 cycles of 94°C for 1 minute, 55°C for 1 minute, and 72°C for 2 minutes, then 72°C for 5 minutes. The PCR product was cloned into the pcDNA3 vector (pcDNA3-SPAG5; Invitrogen Corp.) as described previously. 13 Eca109 and Ec9706 cell transfection was performed using 100 nM Lipofectamine 2000 (Invitrogen Corp.) according to the manufacturer’s protocol. Briefly, 50 µL Opti-MEM was used to dilute 0.8 µg plasmid DNA, and separately 50 µL Opti-MEM was used to dilute 2.0 µL Lipofectamine 2000. The two mixtures were then combined and added to a 24-well plate (100 µL/well), cultured for about 6 hours, then replaced with RPMI 1640 medium containing 10% FBS for about 24 hours.
Dual luciferase reporter gene assay
Targetscan 3.0 (http://www.targetscan.org/) was used to predict miR-363 downstream target genes. The SPAG5 3′-UTR target site sequence and the miR-363 target site sequence containing a mutation of three bases were synthesized and cloned downstream of the luciferase gene in the pmirGLO luciferase vector (Promega, Madison, WI, USA). These vectors were named SPAG5-WT and SPAG5-MT, respectively. Eca109 and Ec9706 cells were co-transfected with SPAG5-WT or SPAG5-MT and miR-363 or miR-con. Luciferase activity was measured 24 hours after transfection using the Dual-Glo luciferase assay system (Promega). All experimental protocols were performed according to the manufacturer’s instructions. Normalized firefly luciferase activity (firefly luciferase activity/Renilla luciferase activity) for each construct was compared with that of the pmirGLO Vector no-insert control.
Cell viability assays
Cell viability was evaluated using the MTT assay (Sigma-Aldrich, St Louis, MO, USA) according to the manufacturer’s protocol. The absorbance of each well was measured using a multidetection microplate reader (BMG LABTECH, Durham, NC, USA) at a wavelength of 570 nm. All experiments were performed in quadruplicate.
Cell apoptosis assays
Cells were washed with phosphate-buffered saline (PBS) and resuspended in 500 µL binding buffer containing 2.5 µL annexin V-phycoerythrin and 5 µL 7-amino-actinomycin D to determine the phosphatidylserine exposure on the outer plasma membrane. After incubation, the samples were analyzed using flow cytometry (FACSCalibur; BD Biosciences, San Jose, CA, USA). All experiments were performed in triplicate.
Cell invasion assay
Cell invasion was measured using Matrigel-coated Transwell chambers (Millipore, Billerica, MA, USA). After transfection, harvested cells were suspended in serum-free RPMI 1640 medium and were added to the upper compartment of the chamber; conditioned RPMI 1640 medium with 20% (v/v) FBS was used as a chemoattractant and placed in the bottom compartment of the chamber. After incubation, the cells were removed from the upper surface of the filter with a cotton swab. The invaded cells were then fixed and stained using 0.1% crystal violet. Cells were quantified from five fields of view under a light microscope. The experiment was performed in triplicate.
Immunohistochemistry (IHC)
Formalin-fixed paraffin-embedded ESCC sections with a thickness of 4 µm were dewaxed in xylene and graded alcohols, hydrated, and washed in PBS. Slides were then incubated with an anti-SPAG5 antibody (dilution 1:500; Sigma-Aldrich) over night at 4°C. The streptavidin–peroxidase staining technique (Golden Bridge International, Beijing, China) was used with an irrelevant rabbit antiserum as a negative control. Sections were counterstained with Mayer’s hematoxylin. The presence of SPAG5 expression was detected by microscopic analysis as described before. 14
Statistical analysis
Fisher’s exact text was used to analyze the relationship between miR-363 and various clinicopathological characteristics. Progression-free survival (PFS) was defined as the time from the first day of treatment to the time of disease progression. Survival curves were built according to the Kaplan–Meier method, and the resulting curves were compared using the log-rank test. The joint effect of covariables was examined using the Cox proportional hazard regression model. Correlation analysis was compared using Spearman’s rank test. For other analyses, the data were expressed as the mean ± standard deviation. Differences between groups were assessed by a one-way analysis of variance followed by the Student–Newman–Keuls test using SPSS version 13.0 software (SPSS, Inc., Chicago, IL, USA). P < 0.05 was considered significant.
Results
Decreased expression of miR-363 in vitro and in vivo
We evaluated the expression of miR-363 in 80 paired ESCC and adjacent healthy tissues by qRT-PCR. Significantly lower miR-363 levels were seen in ESCC tissues compared with NAT (P<0.01, Figure 1a). To investigate the association of miR-363 expression with clinicopathological features and prognosis, patients were allocated into low and high expression groups based on median miR-363 expression with a cutoff of 3.8. A significant correlation was detected between miR-363 expression and the presence of lymph node metastasis (P < 0.001) and tumor differentiation (P = 0.021) (Table 1). Furthermore, the low expression of miR-363 (P = 0.001) and lymph node metastasis (P = 0.048) correlated significantly with a worse PFS (Table 2, Figure 1b and Figure 1c). These results indicated that reduced miR-363 expression serves as an independent prognostic factor for predicting PFS by multivariate Cox proportional hazards analysis (hazard ratio = 15.38, P = 0.027).

Low miR-363 expression correlates with ESCC progression. (a) Expression of miR-363 in 80 paired ESCC and normal adjacent tissues (NAT) as detected by RT-PCR. Values are expressed as the mean ± SD, *, P < 0.05 vs NAT (n=80). (b, c) Kaplan–Meier survival curve analysis demonstrating reduced progression-free survival in patients expressing low levels of miR-363 and lymph node metastasis. (d) RT-PCR analysis of miR-363 expression in ESCC cell lines (Eca109, Ec9706, TE-11, TE-10, and TE-1) and an esophageal normal cell line (Het-1A). Values are expressed as the mean ± SD, *, P < 0.05 vs Het-1A group (n=4). miR, micro RNA; ESCC, Esophageal squamous cell carcinoma; NAT, normal adjacent tissues.
Clinicopathologic variables and the expression status of miR-363.

miR, micro RNA; TNM, tumor-node-metastasis.
Univariate analysis for progression-free survival.
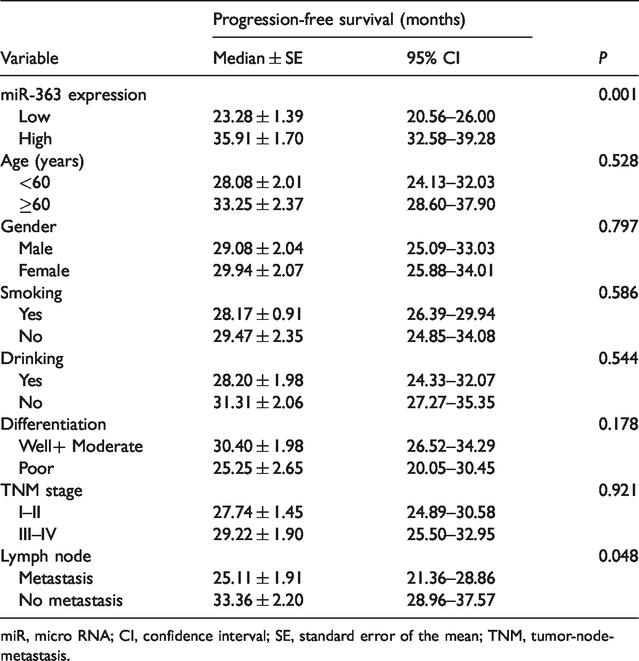
miR, micro RNA; CI, confidence interval; SE, standard error of the mean; TNM, tumor-node-metastasis.
miR-363 expression was also significantly lower in the five ESCC cell lines than in Het-1A cells (all P < 0.05; Figure 1d). Eca109 and Ec9706 cell lines showed lower miR-363 expression than the other ESCC cell lines, so we used them for the following experiments.
Effects of miR-363 on ESCC cells
To understand the biological functions of miR-363 in ESCC cells, miR-363 was overexpressed or inhibited in Eca109 and Ec9706 cells by transfection with miR-363 mimics (miR-363) or anti-miR-363 inhibitor (anti-miR-363), respectively. miR-363 expression was confirmed as being significantly higher or lower in transfected cells than control cells by qRT-PCR (P < 0.05; Figure 2a and Figure 2b, respectively). Next, cell proliferation was measured using MTT assays. As shown in Figure 2c, miR-363 inhibition led to a significant increase in cell viability (P < 0.05). In contrast, miR-363 overexpression significantly decreased the cell proliferation rate (P < 0.05). Similarly, the apoptosis rate detected by flow cytometry was significantly increased by the overexpression of miR-363, and significantly decreased by the down-regulation of miR-363 (P < 0.05; Figure 2d). Furthermore, the Transwell assay showed that miR-363 significantly inhibited cell invasion in both Eca109 and Ec9706 cells (P < 0.05; Figure 2e and Figure 2f).

The effects of miR-363 on ESCC cell proliferation, apoptosis, and invasion. Eca109 and Ec9706 cells were transfected with miR-363 mimics or anti-miR-363 inhibitor and a control for 48 hours. (a) The successful overexpression of miR-363 in ESCC cell lines by real-time PCR analysis. (b) The successful inhibition of miR-363 in ESCC cell lines by real-time PCR analysis. (c) MTT assay demonstrating cell proliferation at indicated time points. (d) Apoptosis as detected by flow cytometry. (e, f) The number of invading cells transfected with miR-363 mimics or anti-miR-363 inhibitor in vitro. Values are expressed as the mean ± SD, *, P < 0.05 vs miR-con group or anti-miR-con group respectively (n=4). miR, micro RNA; ESCC, Esophageal squamous cell carcinoma.
miR-363 directly inhibits SPAG5 gene expression by targeting its 3′-UTR
Through bioinformatics analysis (Targetscan), bases 38 to 44 of SPAG5 were identified as the potential target gene binding site (Figure 3a). Next, we tested the relationship between SPAG5 mRNA and miR-363 expression in ESCC cell lines (Eca109, Ec9706, TE-11, TE-10, and TE-1) and the esophageal normal cell line Het-1A, and observed a negative correlation (Figure 3b). The overexpression of miR-363 significantly decreased SPAG5 mRNA and protein expression (P < 0.05; Figure 3c and Figure 3d). Wild-type and mutant SPAG5 3′-UTR sequences containing the miR-363 binding site were then cloned using a luciferase reporter gene system to investigate whether miR-363 inhibits SPAG5 by binding to its 3′-UTR in ESCC (Figure 3a). miR-363 significantly suppressed luciferase activity of SPAG5 in the presence of the wild-type 3′-UTR vector, but not the mutant vector, in both Eca109 and Ec9706 cells (P < 0.05; Figure 3e and Figure 3f).

SPAG5 is a direct target of miR-363. (a) Predicted miR-363 target sequences in the 3′-UTR of SPAG5. (b) Real-time PCR showing an inverse relationship between the expression of miR-363 and SPAG5 mRNA in ESCC cells. Pearson r =–0.873, P < 0.05 (n=6). (c) RT-PCR demonstrating that miR-363 up-regulation in ESCC cells significantly inhibited the expression of SPAG5 mRNA.(d) Western blot demonstrating that miR-363 up-regulation in ESCC cells significantly inhibited the expression of SPAG5. (e, f) Dual luciferase reporter assay showing decreased luciferase activity in cells overexpressing miR-363 plus wild-type SPAG5-3′-UTR versus mutant SPAG5-3′-UTR. Values are expressed as the mean ± SD, *, P < 0.05 vs miR-con group (n=3). SPAG, sperm-associated antigen; miR, micro RNA; UTR, untranslated region; ESCC, Esophageal squamous cell carcinoma.
SPAG5 mediates the functional effects of miR-363 in ESCC cells
We reintroduced SPAG5 into ESCC cells overexpressing miR-363 to further clarify the mechanism of miR-363 tumor suppressor activity (Figure 4a). As expected, increased SPAG5 levels significantly restored the proliferation inhibited by miR-363 (P < 0.05; Figure 4b) and the apoptosis increase (P < 0.05; Figure 4c). Moreover, SPAG5 overexpression also significantly reversed the reduction in the number of invasive Eca109 and Ec9706 cells induced by miR-363 (P < 0.05; Figure 4d). These results demonstrate that miR-363 suppressed ESCC cell proliferation and metastasis by inhibiting SPAG5 expression.
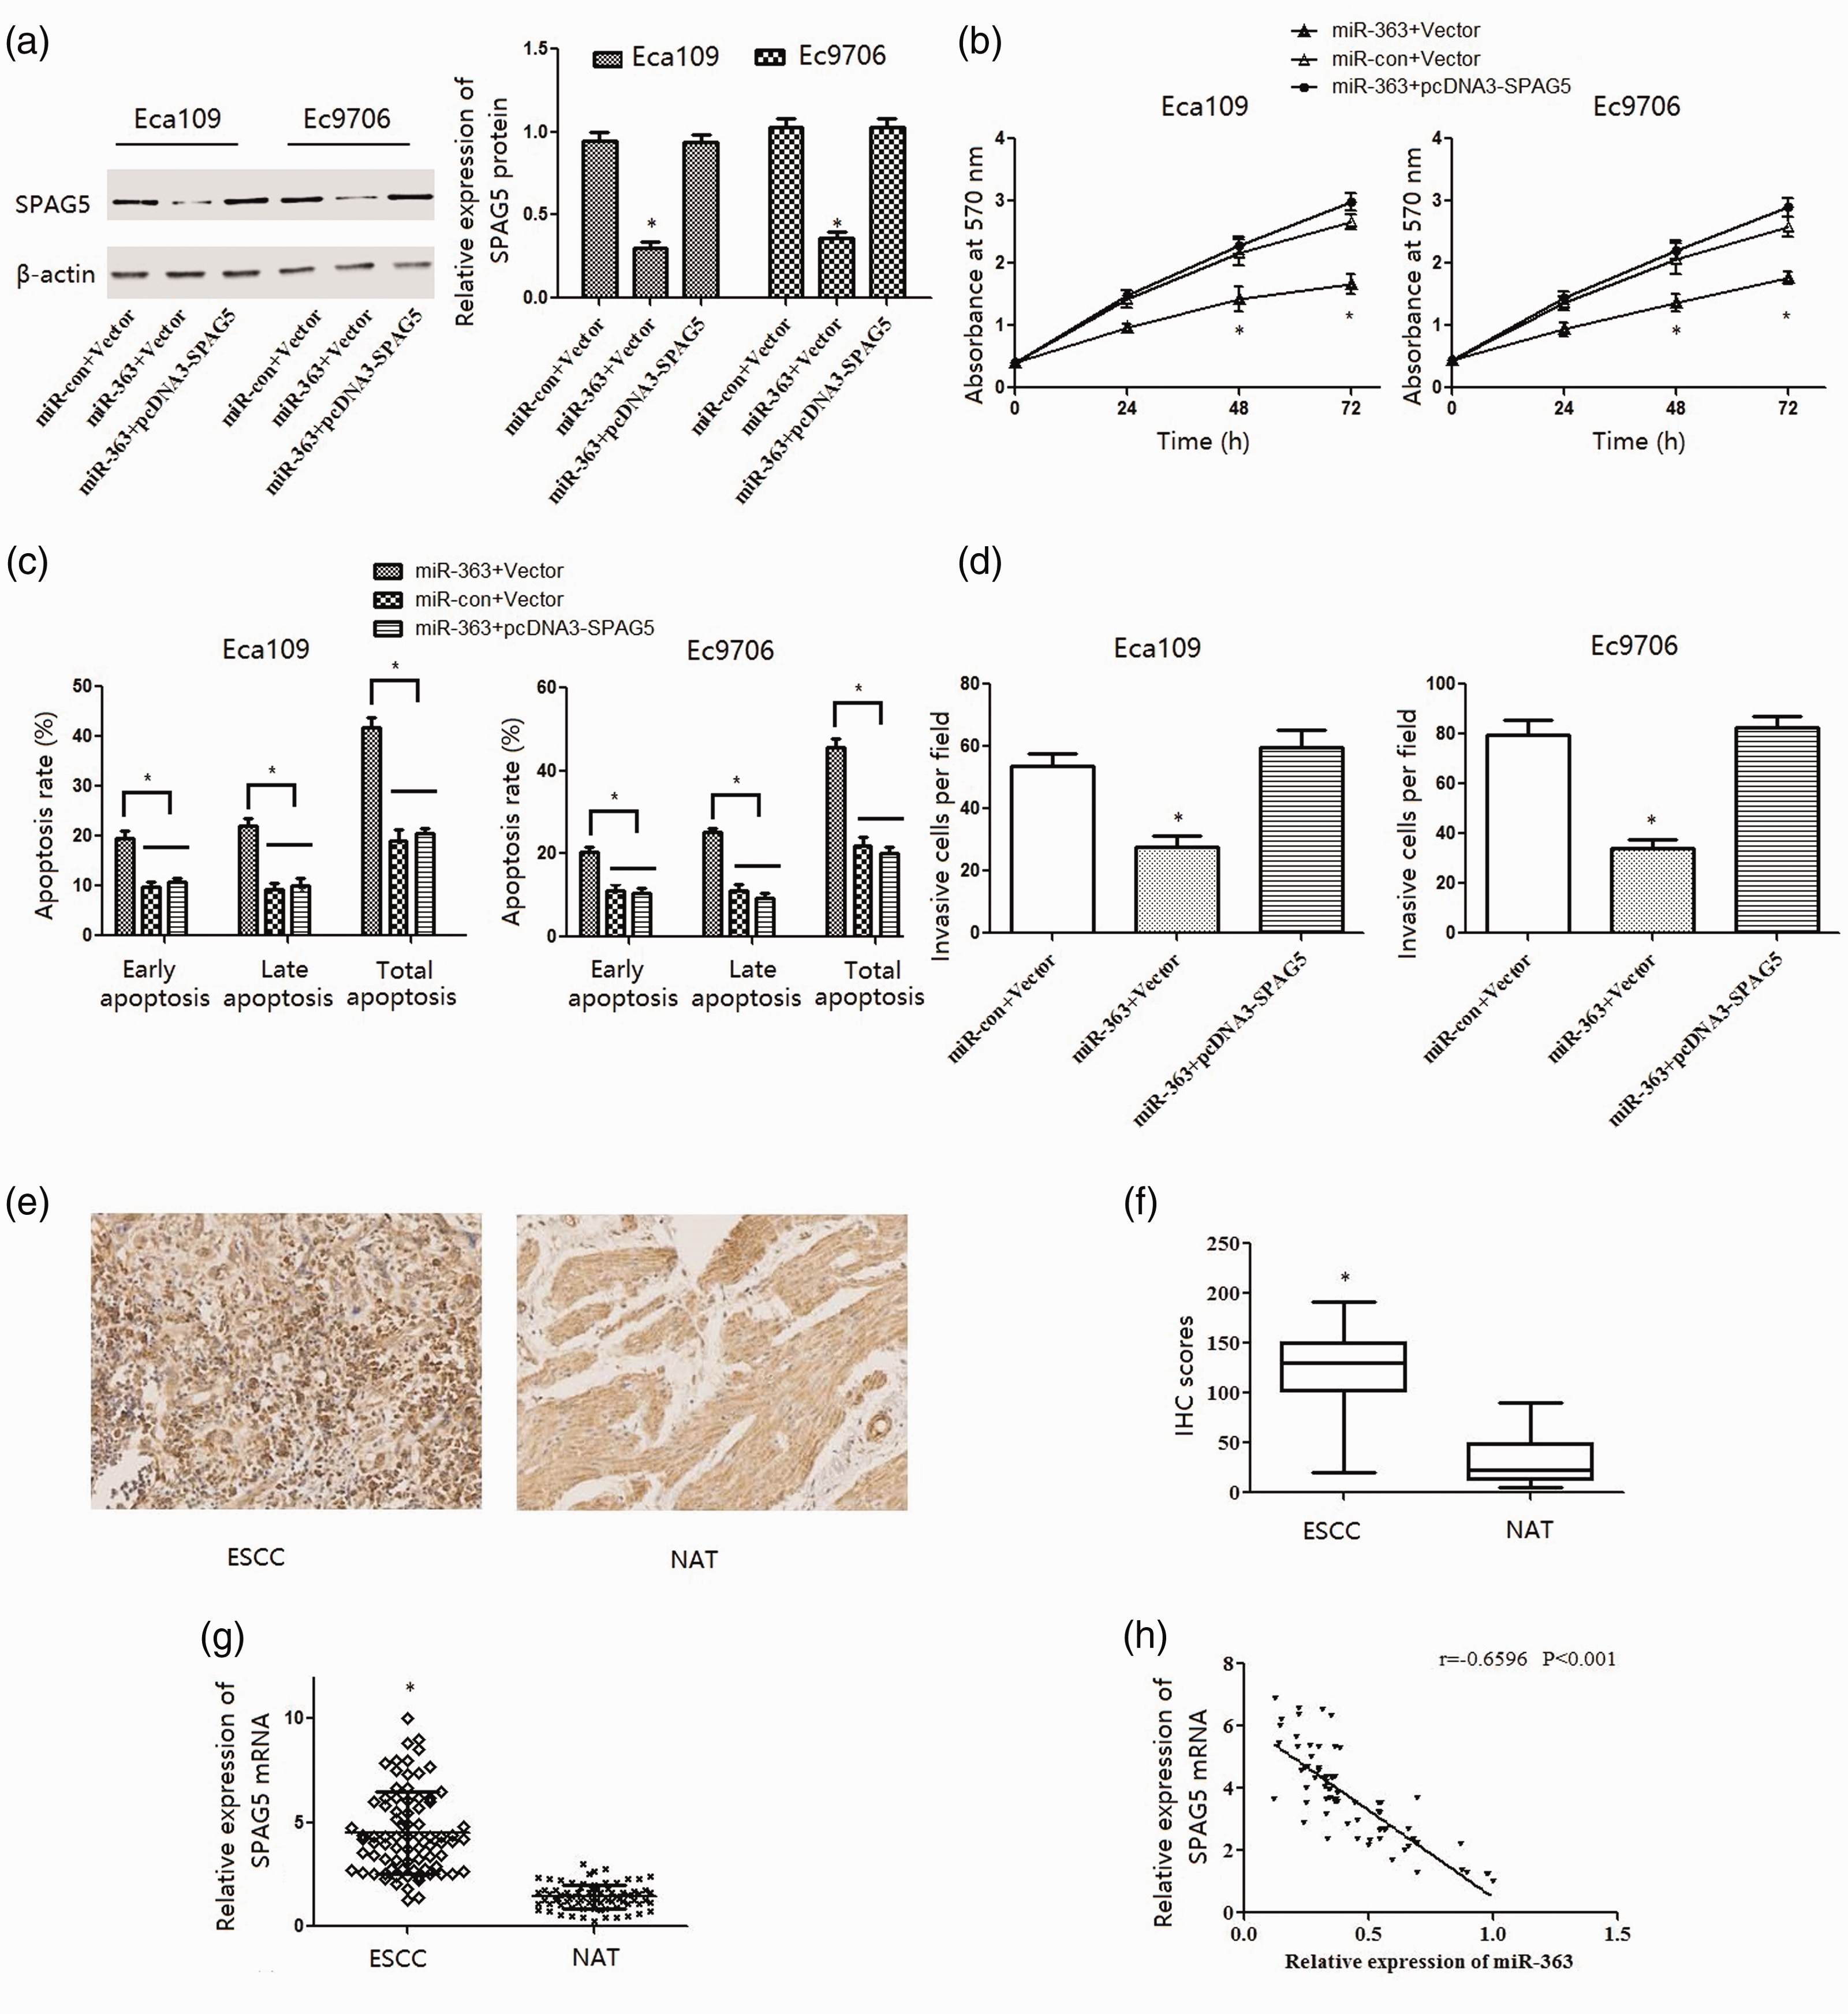
Overexpression of SPAG5 abrogated the effect of miR-363 in ESCC cells. Eca109 and Ec9706 cells were co-transfected with empty vector (Vector) or SPAG5 recombinant plasmid (pcDNA3-SPAG5) and control (miR-con) or miR-363 mimics (miR-363) for 48 hours. (a) Expression of SPAG5 protein was analyzed by western blotting. (b) Cell vitality was measured by the MTT assay. (c) Apoptosis of ESCC cells was detected by flow cytometry. (d) Cell invasion capability was evaluated using the Transwell assay. Values are expressed as the mean ± SD, *, P < 0.05 vs miR-363 +pcDNA-SPAG5 group, n=3. (e, f) Immunohistochemical analysis of SPAG5 protein expression in ESCC tissue samples. (g) RT-PCR analysis of SPAG5 mRNA expression in 80 paired ESCC and normal adjacent tissues (NAT). GAPDH was used as an internal control. Values are expressed as the mean ± SD, *, P < 0.05 vs NAT (n=80). (h) Real-time PCR showing an inverse relationship between the expression of miR-363 and SPAG5 mRNA in ESCC tissues. Pearson r =–0.6596, P < 0.05 (n=80).
We then evaluated the expression of SPAG5 protein and mRNA among 80 paired ESCC tissues by IHC and RT-PCR, respectively. IHC showed that SPAG5 expression was mainly in the cytoplasm (Figure 4e), and IHC score analysis confirmed significantly higher SPAG5 protein expression in ESCC than NAT (P < 0.05; Figure 4f). RT-PCR also demonstrated the significant overexpression of SPAG5 mRNA in ESCC compared with NAT tissues (P < 0.05; Figure 4g). Spearman’s rank test indicated that SPAG5 transcript expression inversely correlated with miR-363 in ESCC tissues (Figure 4h).
Discussion
The dysregulation of miRNAs contributes to the pathogenesis of all types of cancer, and increasing evidence suggests that they play important roles in ESCC progression.14,15 Recently, the function of miR-363 was examined in different cancer types with conflicting results. In gastric cancer, miR-363 promoted carcinogenesis by targeting MBP-1 and FBW7,11,12,16 and an oncogenic role for miR-363 was also found in gliomas and prostate cancer.17,18 However, in other tumors such as ovarian cancer, breast cancer, head and neck cancer, colorectal cancer, hepatocellular carcinoma, and lung cancer, miR-363 inhibited tumor growth by targeting different oncogenes.9,10,19–22 In the present study, we explored the expression, clinical significance, prognostic value, function, and molecular mechanism of miR-363 in ESCC, finding that it has potential to be used as a biomarker and novel therapeutic target for ESCC.
We found that miR-363 expression was down-regulated in ESCC both in vitro and in vivo, suggesting that this low expression is associated with ESCC carcinogenesis. Further, miR-363 expression correlated with lymph node metastasis and tumor differentiation, and low miR-363 expression was identified as an independent prognostic factor for ESCC. To further investigate the role of miR-363 in ESCC, we overexpressed and inhibited it in Eca109 and Ec9706 cells. We found that miR-363 inhibited cell proliferation, while miR-363 overexpression led to increased apoptosis and suppressed invasion. This indicated that miR-363 functions as a tumor suppressor gene by down-regulating cell growth and invasion and inducing apoptosis in ESCC cells.
To clarify the exact mechanisms of miR-363 in ESCC, we used bioinformatics analysis which identified SPAG5 as a potential target gene. We observed an inverse correlation between the expression of SPAG5 mRNA and miR-363 in ESCC cells, and showed that up-regulated miR-363 expression significantly decreased the expression of SPAG5 at both mRNA and protein levels. Further, a dual luciferase reporter gene assay showed that miR-363 negatively regulated SPAG5 expression by interacting with its 3′-UTR. The reintroduction of SPAG5 restored miR-363-induced effects on events such as cell proliferation, apoptosis, and invasion. Finally, ESCC tissue samples demonstrated an overexpression of SPAG5 and a negative correlation between miR-363 and SPAG5 expression. Taken together, these results demonstrate that miR-363 inhibits ESCC proliferation and invasion partly by targeting SPAG5.
Previous studies reported that SPAG5 overexpression predicted poor prognosis in lung cancer and breast cancer, and that SPAG5 up-regulation significantly altered the sensitivity to taxol treatment through activating the mammalian target of rapamycin (mTOR) in cervical cancer.23–25 More recently, SPAG5 was found to promote cell proliferation and suppress apoptosis in bladder urothelial carcinoma by inducing the expression of Wnt3 through activating the AKT/mTOR pathway. 26 In podocytes, SPAG5 down-regulation inhibited autophagy and aggravated apoptosis via the SPAG5/AKT/mTOR pathway, 27 while miR-539 and miR-367-3p inhibited the progression of different cancers by directly targeting SPAG5.13,28 While these results suggest that SPAG5 is an important oncogene, in line with our own findings, the precise role of SPAG5 in ESCC is unclear and requires further study.
In conclusion, our study found that miR-363 expression is notably downregulated in ESCC both in vitro and in vivo. Moreover, we show for the first time that miR-363 controls cell proliferation and invasion through negatively regulating SPAG5. Thus, miR-363 could be used as a novel biomarker in the diagnosis of ESCC and provide a novel therapeutic target for ESCC treatment.
Footnotes
Declaration of conflicting interest
The authors declare that there is no conflict of interest.
Funding
This work was supported by the Natural Science Basic Research Plan in Shaanxi Province, China (2018JM7090), the Medical Project of the Xi’an Science and Technology Bureau [2019114313YX001SF035(1)], and Scientific Research Plan Projects of the Shaanxi Education Department (19JK0765).