
Abstract
Objective
To identify biomarkers related to esophageal squamous cell carcinoma (ESCC) prognosis by analyzing genetic variations and the infiltration levels of tumor-infiltrating lymphocytes (TILs) in patients.
Methods
The clinical features of 61 patients with ESCC were collected. DNA panel sequencing was performed to screen differentially expressed genes (DEGs). Transcriptome sequencing was performed to identify gene expression profiles, and subsequent enrichment analysis of DEGs was conducted using Metascape.
Results
We identified 488 DEGs between patients with ESCC with distinct prognoses that were mainly enriched in the human immune response, fibrinogen complex, and protein activation cascade pathways. Among patients with ESCC treated with postoperative chemotherapy, those with a high infiltration level of myeloid-derived suppressor cells (MDSCs) had longer overall survival (OS), and OS was positively correlated with the infiltration level of T helper type 2 (Th2) cells among patients treated without chemotherapy after surgery. Additionally, in the case of MDSCs >0.7059 or Th2 cells <0.6290, patients receiving postoperative chemotherapy had a longer OS than those treated without chemotherapy following surgery.
Conclusion
The level of MDSCs or Th2 cells can be used as a biomarker for assessing the prognosis of patients with ESCC treated with or without postoperative chemotherapy, respectively.
Keywords
Introduction
Esophageal carcinoma is a common gastrointestinal cancer that ranks seventh in global malignancy mortality. 1 According to the pathologic type, esophageal carcinoma is mainly divided into esophageal squamous cell carcinoma (ESCC) and esophageal adenocarcinoma; ESCC accounts for more than 90% of esophageal carcinoma cases.2,3 During the early stage, patients with ESCC show no obvious symptoms, and as a result, approximately 80% of ESCC cases are diagnosed at an advanced stage. Notably, the prognosis varies greatly among patients at the same pathologic stage, especially in the intermediate stages, such as T3N0M0 (pT3N0M0). During the pT3N0M0 stage, patients either achieve long-term survival or die due to rapid relapse. 4 Surgery combined with postoperative adjuvant chemotherapy is a commonly used clinical treatment option, but the survival rate of patients with ESCC largely depends on early diagnosis. 5 Therefore, the identification of specific biomarkers associated with ESCC prognosis has clinical significance in improving the accuracy of prognosis assessment and therapeutic intervention.
Next-generation sequencing (NGS) has been widely used in medical fields and tumor research in recent years. NGS has the advantages of a significantly shortened sequencing cycle and reduced costs, enabling more in-depth and comprehensive research on diseases at various levels from the genome to transcriptome and proteome. Genome sequencing can identify various tumor-related genetic variations, such as single nucleotide variations (SNVs), small fragment insertions and deletions, and copy number variations (CNVs). SNVs are considered somatic mutations in malignant tumor cells. It has been shown that genetic polymorphisms determine the disease susceptibility of individuals, and somatic mutations directly lead to the development of diseases. 6 Several studies have conducted in-depth research on the etiology of ESCC at the genomic level and identified a number of genes related to ESCC. 7 Moreover, transcriptome sequencing contributes to the understanding of the differences in gene expression at the transcriptional level. Therefore, the rational use of NGS in analyzing a large amount of biological information may lead to the identification of key molecular markers related to ESCC prognosis, facilitating the early diagnosis and treatment of ESCC.
Tumor-infiltrating lymphocytes (TILs) are composed of different lymphocyte subtypes, such as helper T cells, cytotoxic lymphocytes, and natural killer cells, which leave the bloodstream and enter the tumor. The comprehensive effects of TILs on cancer progression are dependent on mutual regulation between the lymphocyte subtypes. 8 , 9 Moreover, the density, type, and proportion of TILs reflect the immune status of the local tumor microenvironment. It has been shown that TILs play an important role in tumor development and tumor responses to treatment. 10 To date, the correlation between TIL subtypes and ESCC prognosis has not yet been fully determined. Some studies have suggested that the high expression of CD3+ T cells in the epithelium of tumor tissues was significantly associated with improvements in the overall survival (OS), cancer-specific survival, and disease-free survival of patients with ESCC. 11 However, Chen et al. 12 showed no significant correlation between CD3+ cells and ESCC prognosis. Thus, the role of different TIL subtypes in ESCC prognosis remains to be further investigated.
Here, we aimed to identify prognosis-related biomarkers of pT3N0M0 ESCC through second-generation sequencing and screening of TIL subpopulations. This study may be beneficial to the improvement in ESCC prognosis and the optimization of the clinical management of ESCC.
Materials and methods
Patient data
Subjects with ESCC admitted to Sichuan Cancer Hospital from May 2010 to October 2017 were recruited. Included patients in this study met the following criteria: (1) age <70 years, (2) diagnosed as pT3N0M0 ESCC, and (3) undergoing right thoracic radical resection. The following patients were excluded: (1) those treated with chemotherapy or radiotherapy prior to surgery, (2) those with prior history of other malignant tumors, and (3) those treated without radical surgery for tumor removal. The present study was approved by the Ethics Committee of Sichuan Cancer Hospital (SCCHEC-02-2018-021), and all participants signed written informed consent forms.
DNA panel sequencing
Tumor tissues and adjacent non-tumor counterparts collected by endoscopy were fixed in formalin and embedded in paraffin. All tumor samples were subjected to pathological examination to determine the percentage of tumor content, which should be no less than 10%. The formalin-fixed and paraffin-embedded (FFPE) tissues were cut into 10-μm-thick sections and de-paraffinized with xylene, followed by genomic DNA extraction using the BLACK PREP FFPE DNA Kit (Analytik Jena AG, Jena, Germany, 845-BP-0020050) in accordance with the manufacturer’s protocol. The quantity and quality of the extracted DNA were determined using a Qubit 3.0 Fluorometer (Thermo Fisher Scientific, Waltham, MA, USA, Q33217) and Agilent 2100 Bioanalyzer (Agilent Technologies, Palo Alto, CA, USA, G2939A), respectively. The DNA was fragmented into 200-bp pieces using a Covaris M220 sonication system (Thermo Fisher Scientific) and purified with Agencourt AMPure XP beads (Beckman Coulter, Indianapolis, IN, USA, A63882). Library preparations of the fragmented DNAs were performed using the KAPA Hyper Prep Kit (KAPA Biosystems, Boston, MA, USA, KK8504) in accordance with the manufacturer’s protocol. Libraries with different indices were pooled using a Hypercap Target Enrichment Kit (Roche, Pleasanton, CA, USA, 8286345001), and a customized enrichment panel (Roche, 8247501001) covered the exonic regions of 387 genes and the introns of 14 fusion genes. The captured library was further amplified using Illumina p5 (5ʹ AAT GAT ACG GCG ACC ACC GA 3ʹ) and p7 (5ʹ CAA GCA GAA GAC GGC ATA CGA GAT 3ʹ) primers in the KAPA Hifi HotStart ReadyMix (KAPA Biosystems, KK2602) and purified with Agencourt AMPure XP beads. Sequencing libraries were quantified using an Agilent 2100 Bioanalyzer. The final libraries were sequenced on an Illumina Novaseq 6000 platform with a mean coverage depth of at least 250×.
Data analysis for DNA panel sequencing
All subsequent analyses were based on clean reads generated by removing connector sequences and low-quality sequences. Clean reads were aligned to the human reference genome (Hg19, NCBI Build 37.5) using the Burrows–Wheeler Aligner (version 0.7.17). Duplicate reads were marked by the Picard toolkit (version 2.1.0, Welcome Trust Sanger Institute, Welcome Trust Genome Campus, Cambridge, CB10 1SA, UK) and then realigned using the Genome Analysis ToolKit (version 3.7, Program in Medical and Population Genetics, Broad Institute of Harvard and MIT, Cambridge, MA, USA).
SNV calling was performed by VarDict (version 1.5.1, Oncology iMed, AstraZeneca, Waltham, MA, USA), and the variants were annotated using ANNOVAR (Center for Applied Genomics, Children’s Hospital of Philadelphia, Philadelphia, PA, USA). Somatic mutations were selected based on the following standards: (i) located in intergenic regions or intronic regions, (ii) synonymous SNVs, (iii) allele frequency ≥0.002 in the database Exome Aggregation Consortium (ExAC) and genomad, (iv) allele frequency <0.05 in the tumor sample, (v) strand bias mutations in the reads, (vi) support reads <5, and (vii) depth <30. Compound heterozygous mutations were merged with FreeBayes (version 1.2.0, Department of Biology, Boston College, Chestnut Hill, MA, USA). CNV was assessed using CNVkit (version 0.9.5). 13
Tumor mutational burden (TMB) analysis
Nonsynonymous mutations (SNV and indel) in the coding region for a given gene were selected for the assessment of tumor mutational burden (TMB) in ESCC. Driver gene mutations and hotspot mutations included in the ExAC/COSMIC database were filtered out. Mutation sites that met a certain sequencing depth and mutation frequency threshold were selected as TMB candidate sites, and TMB was calculated according to the following formula.
14

Mutant-allele tumor heterogeneity (MATH) analysis
SNV mutations were selected according to the following criteria: (1) frequency ≥5%, (2) depth ≥50×, (3) mutations within the exonic regions were preserved and synonymous mutations were filtered out, (4) mutations with frequencies of more than 10% in adjacent non-tumor counterparts were filtered out, and (5) for sites with a frequency lower than 10% in adjacent non-tumor counterparts, sites 10 times higher than the frequency of adjacent non-tumor counterparts were kept. The MATH values of the candidate sites selected above were calculated according to the reference method. With the variant allele frequencies (VAFs) calculated by the ratio of alternate allele observations to the read depth at each position, we modified the MATH score to include all somatic variants with VAFs from 0.02 to 1 according to the formula: 100×median absolute deviation/median of the VAF. 15
Copy number instability (CNI) analysis
After correcting the GC content and length of the target region using proprietary algorithms for each region, the read counts were transformed into log2 ratios and converted into a z-score (RZ) based on Gaussian transformations versus a normal control group (n=30). Then, the capture interval with an RZ value greater than the 95% quantile and 2× the SD sum of the control group was selected, and the sum of the RZ values of these intervals was calculated as the CNI score. 16
Transcriptome sequencing
Total RNA was extracted from tumor tissues and adjacent non-tumor samples using an AllPrep DNA/RNA Mini Kit (Qiagen, Hilden, Germany, 80204). To ensure the quality of samples for transcriptome sequencing, the purity and concentration of the extracted RNA were assessed using a Qubit 3.0 Fluorometer and Agilent 2100 Bioanalyzer, respectively. The cDNA library was constructed using the SMARTer Stranded Total RNA-Seq Kit v2 (Takara, Santa Clara County, CA, USA, 553073) based on the manufacturer’s instructions. After PCR enrichment and purification of adapter-ligated fragments, the library with adapters was analyzed with the Qubit 3.0 Fluorometer and assessed using the Agilent 2100 Bioanalyzer system assay. Then, RNA sequencing was performed using the Illumina HiSeq X Ten Sequencing System.
Preprocessing and mapping of sequenced data
To obtain high-quality sequences (clean reads), raw reads were preprocessed by removing connector sequences, low-quality sequences, de-junction contamination, and rRNAs. All subsequent analyses were performed on the clean reads. Reference genes and genome annotation files were available from the ENSEMBL website (http://www.ensembl.org/index.html), and clean data were aligned to the reference genome by HISAT2 (http://ccb.jhu.edu/software/hisat2/index.shtml). HTSeq (http://www.huber.embl.de/users/anders/HTSeq/doc/overview.html) was used to determine the expression level of each gene. The quantification of gene expression was performed based on fragments per kilobase of exon model per million mapped reads.
Identification and functional enrichment analysis of differentially expressed genes (DEGs)
Differential expression analysis of transcriptome sequencing data was performed using the DESeq2 package in R (www.r-project.org) . The DEGs were identified based on |log2 [Fold Change (FC)] | ≥1 and P values<0.01. Selected DEGs were compared with Gene ontology and Kyoto Encyclopedia of Genes and Genomes databases, and the enrichment analysis of DEGs was conducted using Metascape (http://metascape.org/).
Measurement of the infiltration levels of TILs
The ssGSEA method was used to calculate the levels of 28 immune cell subsets in each sample based on quantitative RNAseq data, and the corresponding gene sets of 28 immune cell subpopulations were included as described previously. 17 The optimal threshold of TILs was determined using x-tile 3.6.1 software (Yale University, New Haven, CT, USA).
Statistical analysis
The data were analyzed using R 3.5.1 and IBM SPSS Statistics for Windows, Version 22.0 (IBM Corp., Armonk, NY, USA). The Kaplan–Meier method and log-rank test were used for survival analysis and comparison, respectively. The differences in SNV, CNV, TMB, MATH, and CNI between the different patient groups were analyzed by the Wilcoxon rank-sum test or Fisher’s exact test. P<0.05 was considered statistically significant.
Results
Postoperative chemotherapy had no significant effect on the OS of patients with ESCC
Sixty-one tumor samples were collected and subjected to both DNA panel sequencing and RNA sequencing. Because 9 and 20 samples failed to pass the DNA and RNA quality control analysis, respectively, the data of 52 patients for DNA and 41 for RNA sequencing were included and analyzed in this study. All patients were divided into two groups based on the OS value: the long OS group (OS_L) with an OS time ≥33 months and the short OS group (OS_S) with an OS time ≤18 months. As summarized and analyzed in Table 1 and Table 2, no significant differences in sex, age, pathologic stage, G differentiation, or lesion sites were found between the two groups. Similarly, the statistical analysis did not reveal any significant differences in the OS between patients with (Che group) and without postoperative chemotherapy (NoChe group) both in DNA and RNA analyses (Figure 1a and 1b).
Clinical characteristics of patients enrolled for DNA analysis.
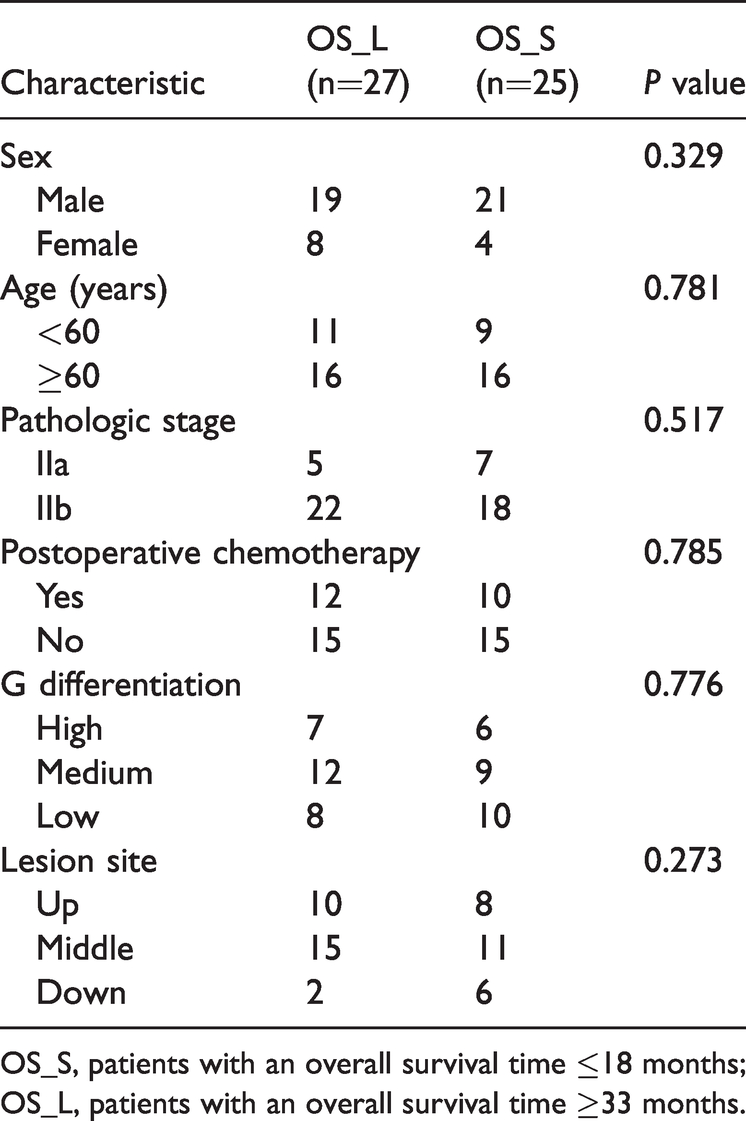
OS_S, patients with an overall survival time ≤18 months; OS_L, patients with an overall survival time ≥33 months.
Clinical characteristics of patients enrolled for RNA analysis.

OS_S, patients with an overall survival time ≤18 months; OS_L, patients with an overall survival time ≥33 months.

Postoperative chemotherapy had no significant effect on the overall survival of patients with ESCC. (a) Overall survival Kaplan–Meier curves of patients in the NoChe and Che groups enrolled for DNA analysis. (b) Overall survival Kaplan–Meier curves of patients in the NoChe and Che groups enrolled for RNA analysis.
There was no significant difference in the genetic variations among patients with ESCC with distinct prognoses
We next examined the frequencies of SNVs and CNVs in selected tumor genes of patients with ESCC to determine whether the genetic variations affect ESCC prognosis. As shown in Figure 2a and 2b, compared with the corresponding adjacent non-tumor tissues, the tumor tissues harbored higher rates of SNVs in TP53 (96%), FAT1 (23%), KMT2D (21%), and NOTCH1 (21%) and higher frequencies of CNVs in MYC (23%), CCND1 (23%), TP63 (15%) and FOXA1 (15%). Notably, no significant differences in the frequencies of SNVs and CNVs were identified between OS_S and OS_L groups. Moreover, we analyzed the TMB, MATH, and CNI values in the tumor DNA from patients with ESCC. Similar to the findings for SNVs and CNVs, the analysis did not reveal any significant differences in TMB, MATH, and CNI between OS_S and OS_L groups (Figures 2c–e).

No significant difference in the genetic variations among patients with ESCC and distinct prognoses. The distribution of the frequencies of (a) SNVs and (b) CNVs in the tumor genes between OS_L and OS_S groups. Each column and row in the figure represent individual patients and genes, respectively. The genes listed on the ordinate (right) were sorted based on the mutation frequency (left) from high (top) to low (bottom). The differences in (c) TMB, (d) MATH, and (e) CNI between OS_L and OS_S groups were statistically analyzed.
Identification and enrichment analysis of DEGs in patients with ESCC
We used the DESeq2 package in R to screen DEGs between the different patient groups based on the screening criteria |log2FC| ≥1 and P value<0.01. As depicted in Figure 3a and 3c, 488 and 375 DEGs were identified from the comparative analysis of OS_S vs OS_L groups and Che_OS_S vs Che_OS_L groups, respectively. These included 432 upregulated and 56 downregulated DEGs between OS_S vs OS_L groups and 161 upregulated and 214 downregulated DEGs between Che_OS_S and Che_OS_L groups. To characterize these DEGs, we next performed enrichment analysis using Metascape. As shown in Figure 3b and 3d, these DEGs were mainly enriched in the pathways of human immune response, fibrinogen complex, and protein activation cascade and the classical pathways of complement activation, formation of the cornified envelope, and other signaling pathways, respectively. Moreover, the comparative analysis identified 1101 DEGs between NoChe_OS_S vs NoChe_OS_L groups, which included 1036 upregulated and 65 downregulated genes. The enrichment analysis revealed that the 1101 DEGs were mainly enriched in signaling pathways, including those related to the detection of stimuli and fibrinogen complex (Figure 3e and 3f).
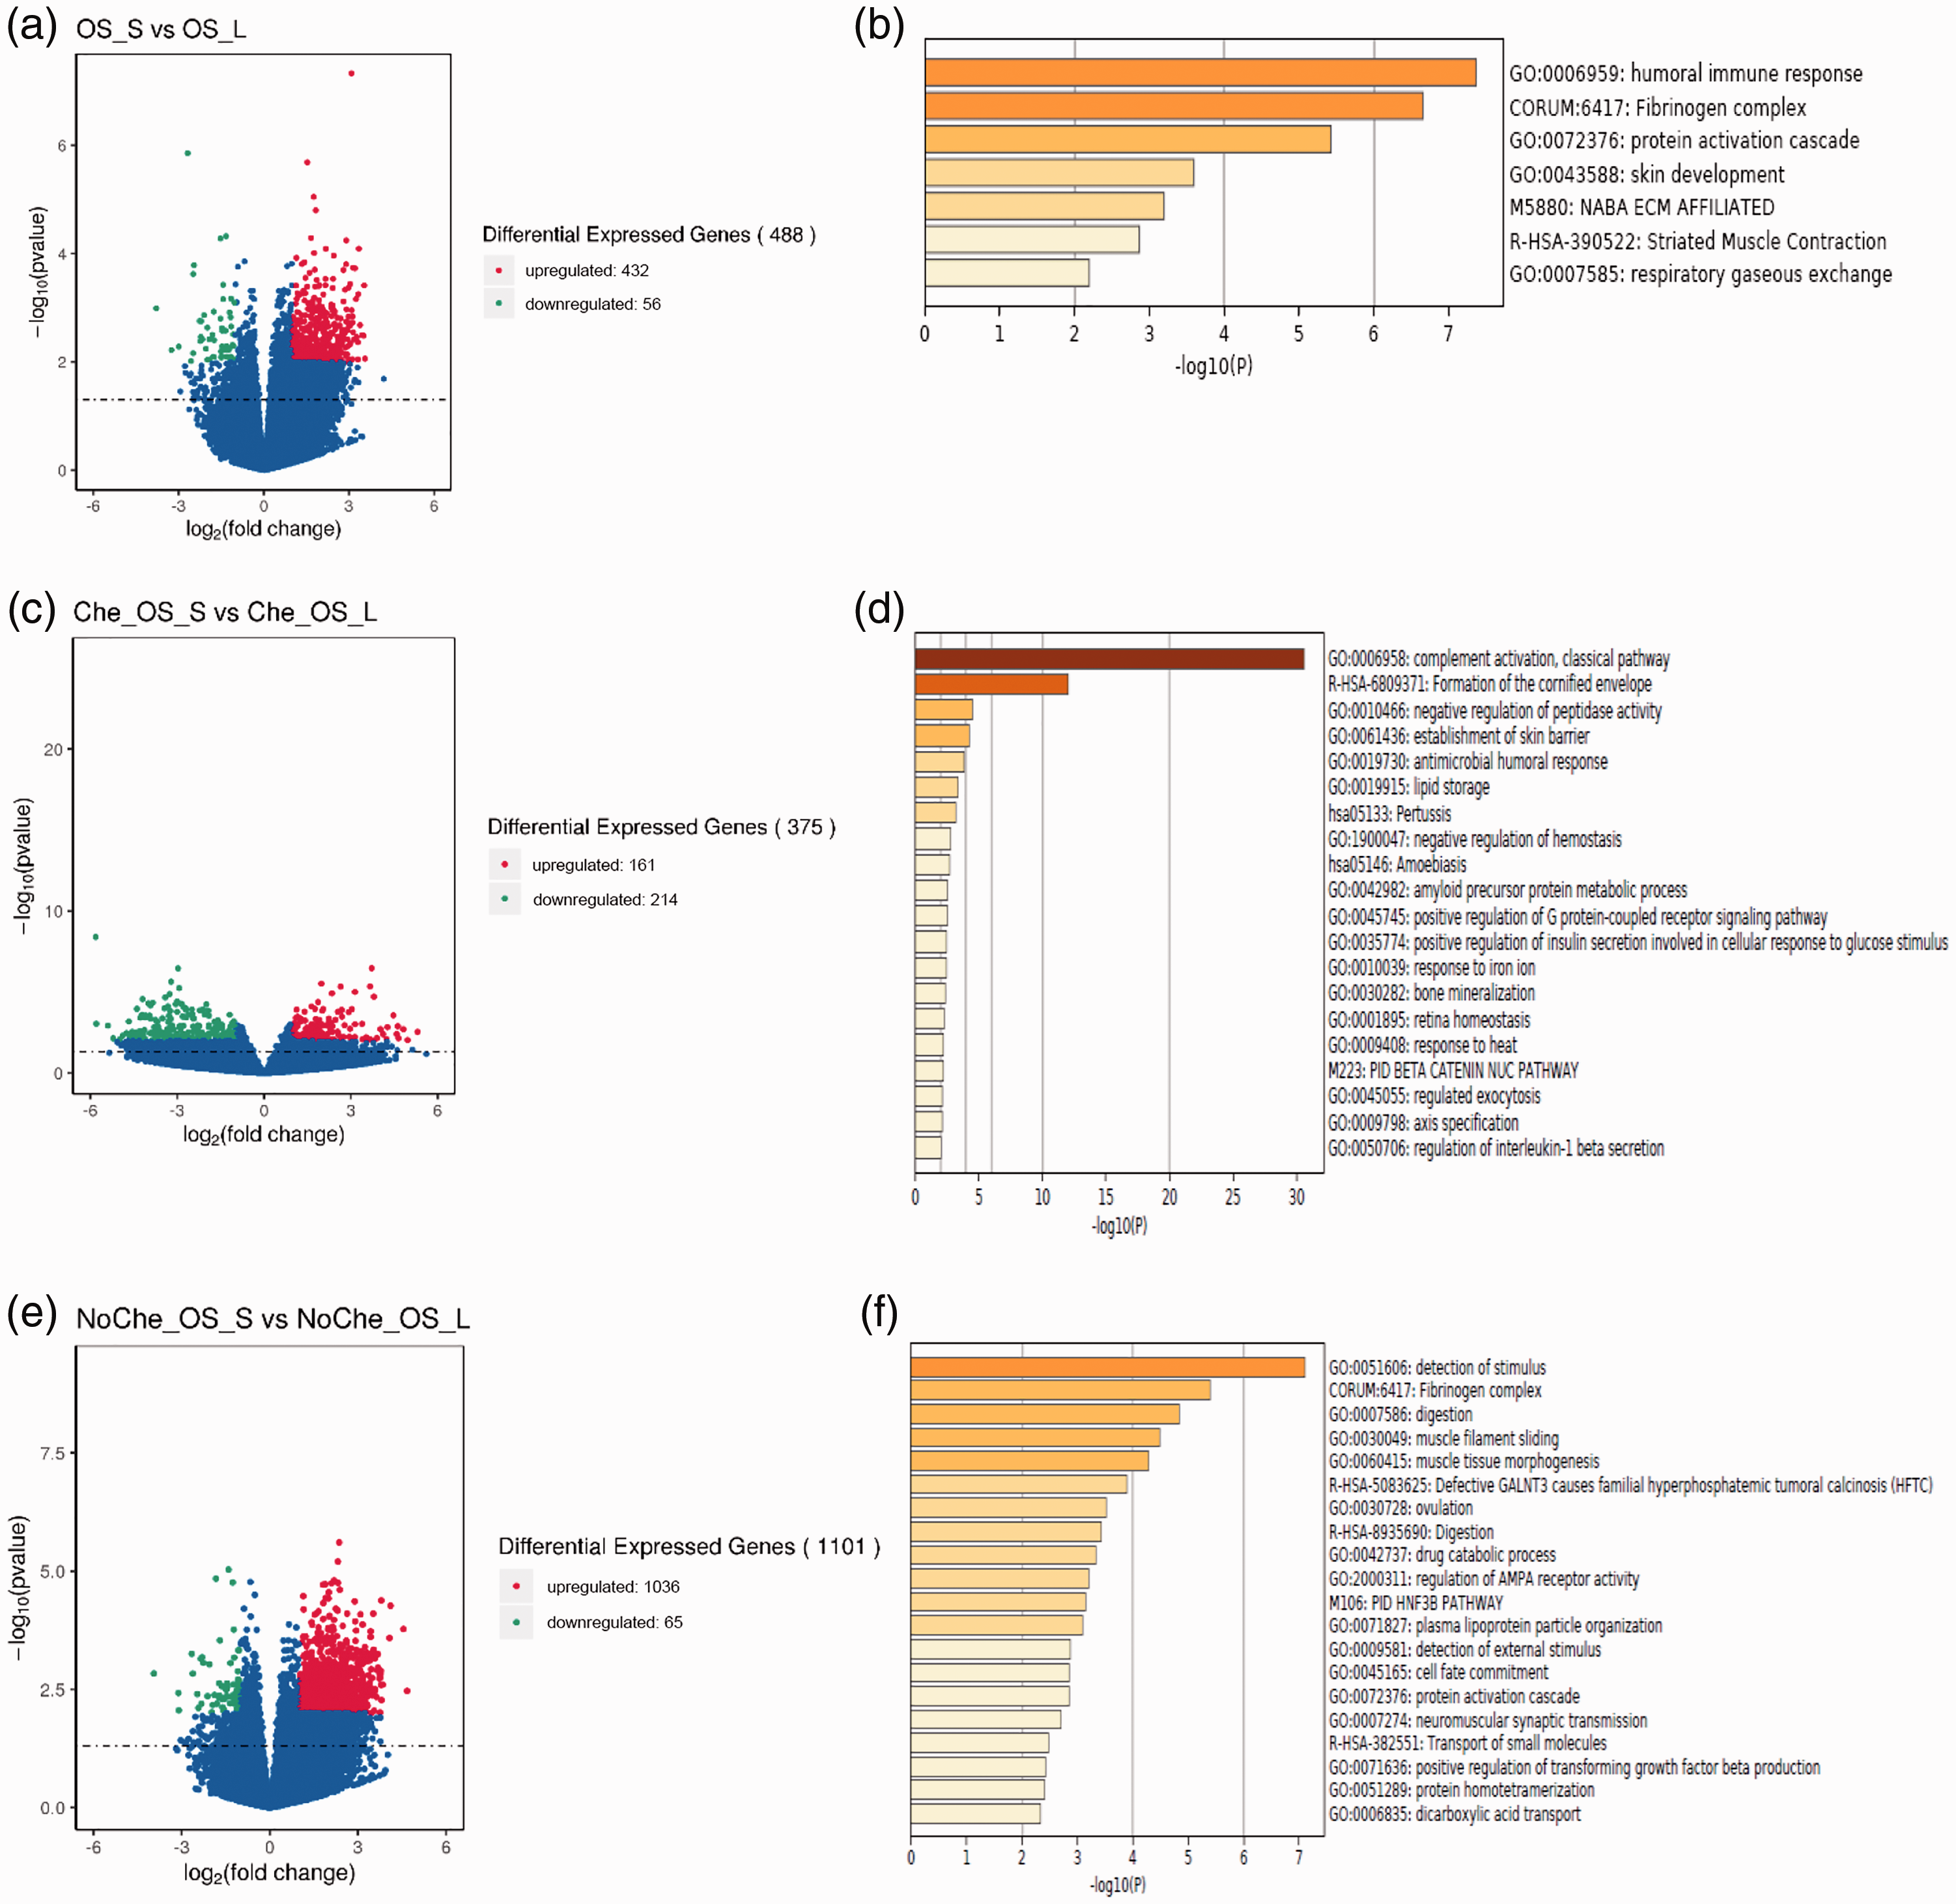
Identification and enrichment analysis of DEGs in patients with ESCC. (a) The volcano map of DEGs between OS_L and OS_S groups and (b) identified pathways from the enrichment analysis. (c) The volcano map of DEGs between Che_OS_L and Che_OS_S groups and (d) identified pathways from the enrichment analysis. (e) The volcano map of DEGs between NoChe_OS_L and NoChe_OS_S groups and (f) identified pathways from the enrichment analysis.
MDSC infiltration was correlated with the prognosis of patients with ESCC treated with chemotherapy after surgery
To investigate the possible effect of TILs on ESCC prognosis, we used the ssGSEA method and limma software to detect and analyze the levels of 28 immune cell subsets, respectively. As shown in Figure 4a, there was no significant difference in the levels of 28 immune cell subsets between OS_S and OS_L groups. Notably, further analysis revealed that the infiltration level of MDSCs in the Che_OS_L group was significantly higher than that in the Che_OS_S group (P<0.05) (Figure 4b–c). This observation prompted us to investigate the optimal threshold and perform survival analysis of patients with different MDSC levels using x-tile 3.6.1 software and the Kaplan–Meier method. Among all patients treated with chemotherapy after surgery, a significantly longer OS was found in patients with high infiltration levels of MDSCs compared with those with low levels of MDSCs [Hazard Ratio (HR)=0.152, P=0.037] (Figure 4d). In contrast, there was no significant correlation between the MDSC infiltration level and OS in patients treated without chemotherapy after surgery (HR=0.362, P = 0.086) (Figure 4e). We next analyzed the relationship between MDSC infiltration and the efficacy of chemotherapy. As indicated in Figure 4f, patients treated with postoperative chemotherapy displayed a longer OS than those treated without chemotherapy after surgery in the case of MDSCs>0.7059, but this result was not statistically significant. Similarly, no significant difference in the OS was present between patients with ESCC treated with and without chemotherapy after surgery in the case of MDSCs≤0.7059 (Figure 4g).
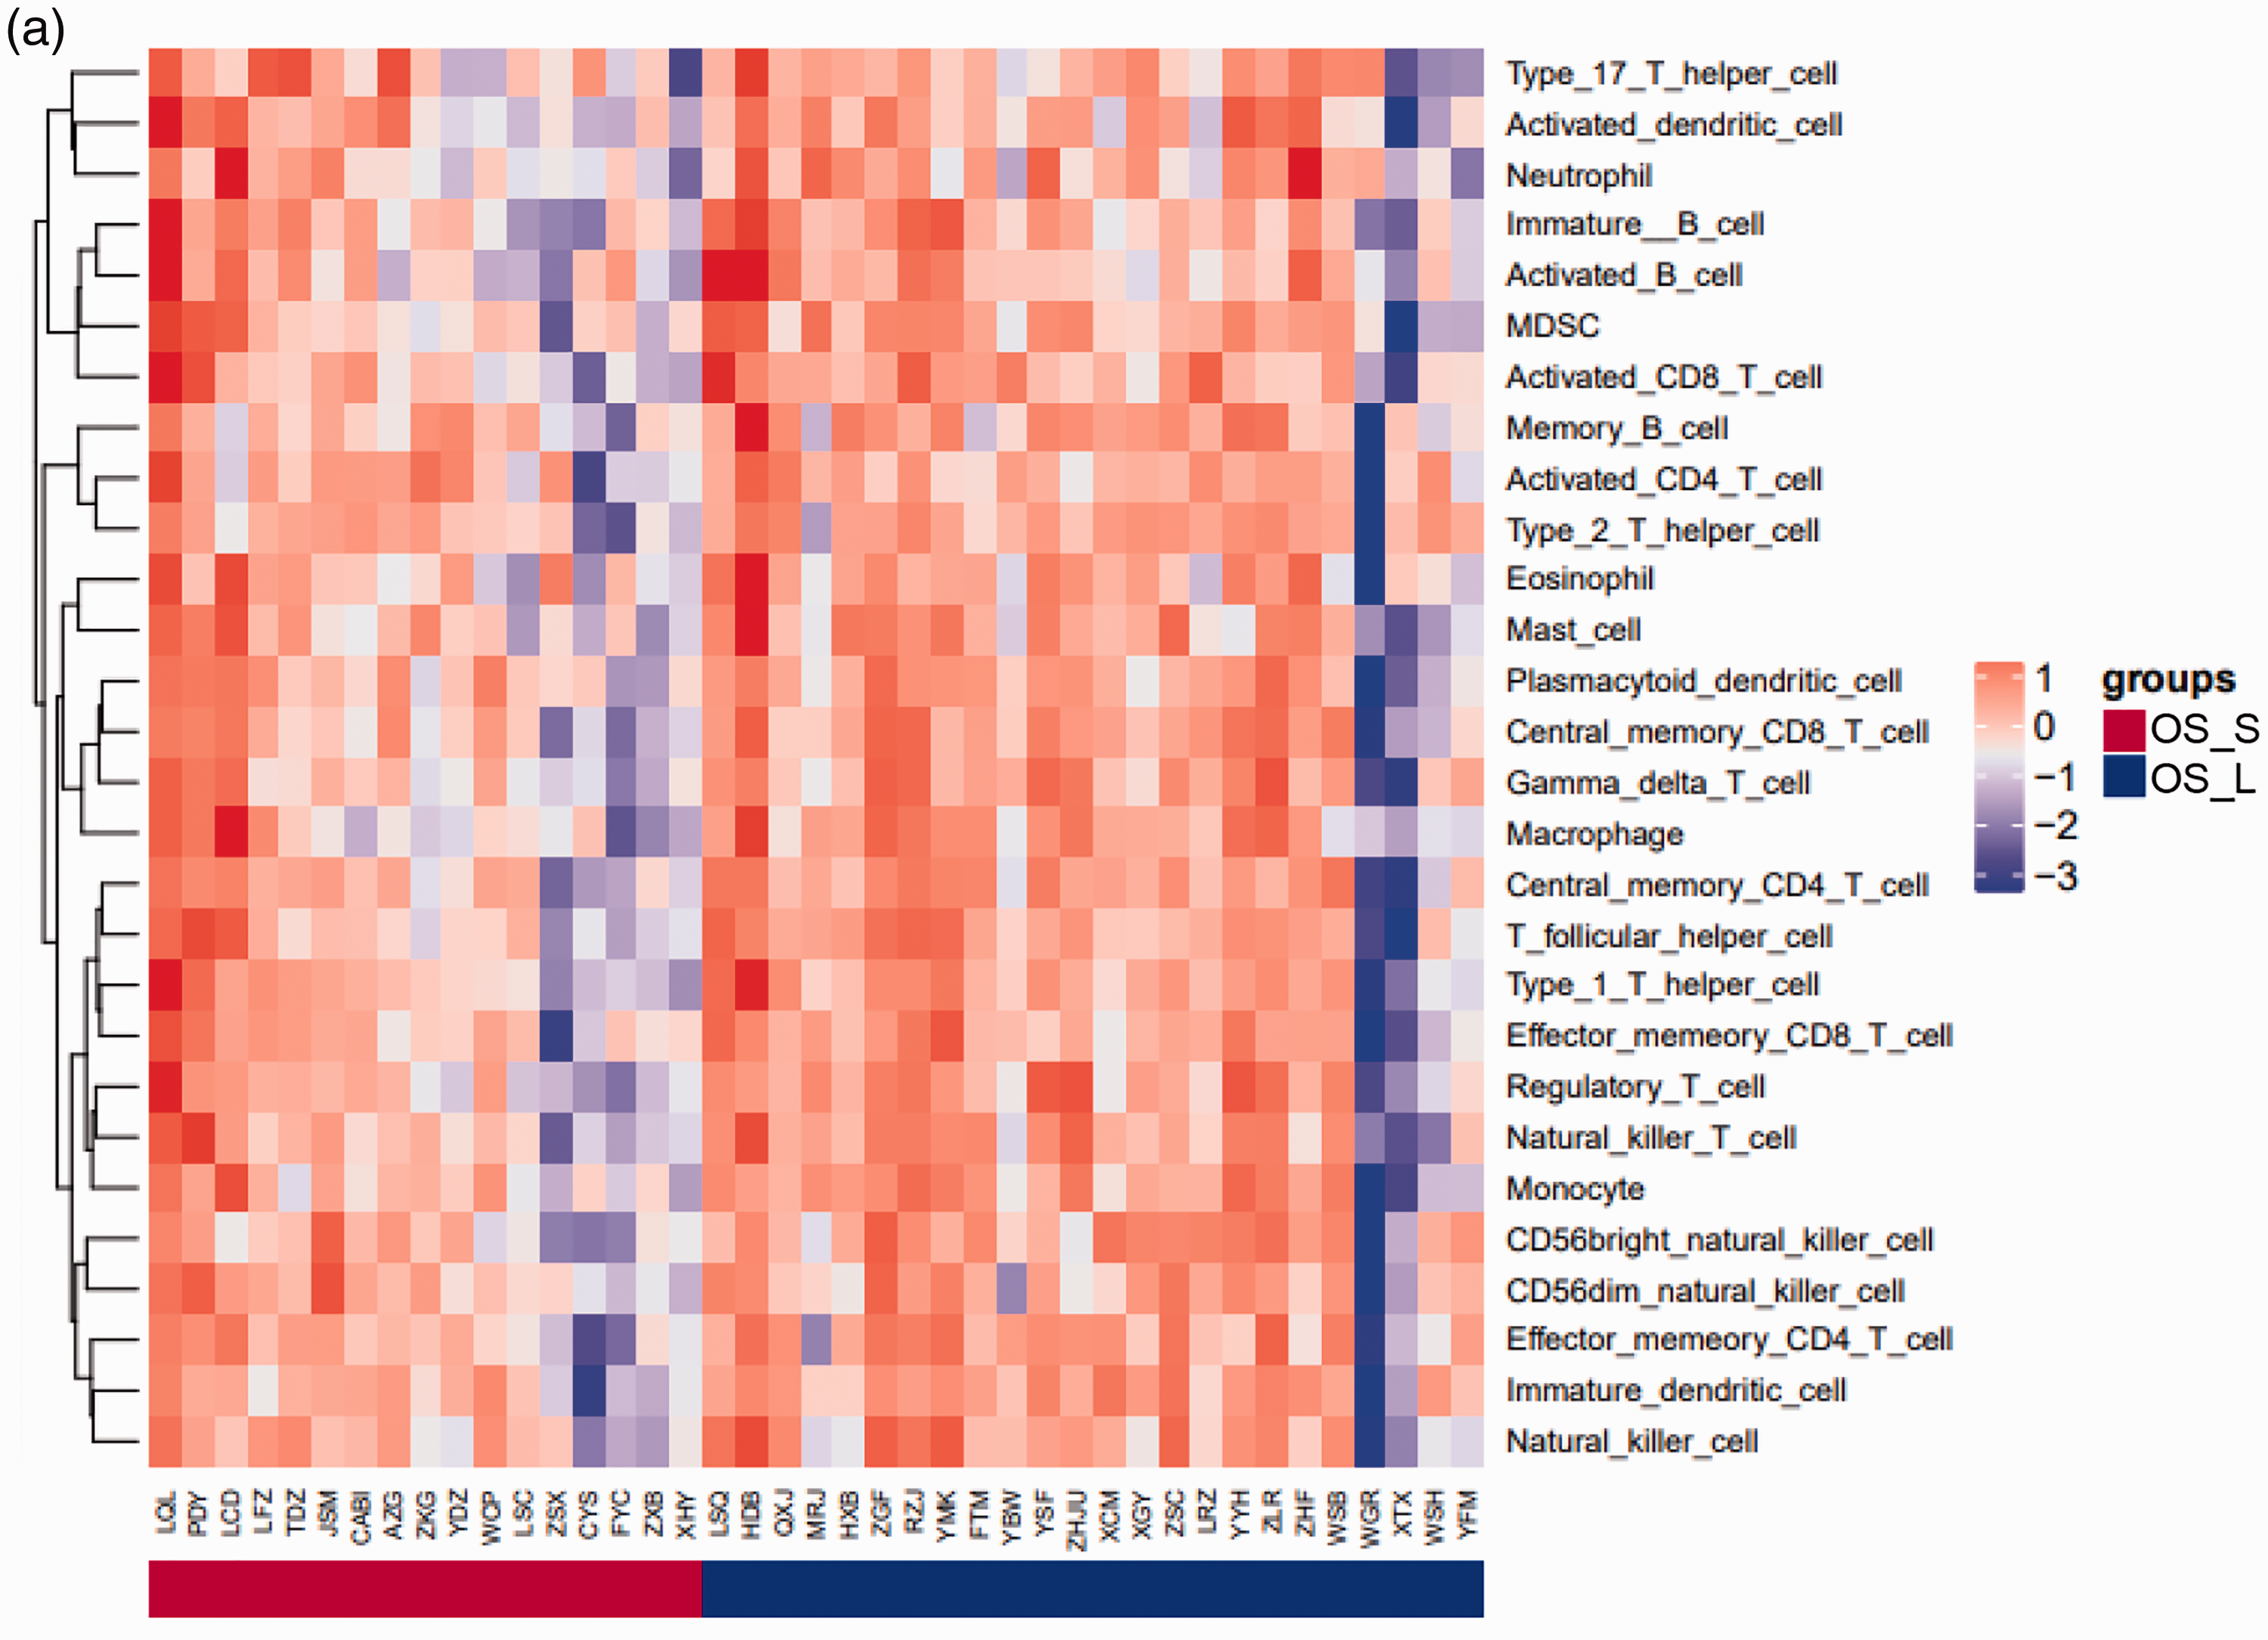
MDSC level was correlated with the prognosis of patients with ESCC treated with postoperative chemotherapy. (a) Comparison of the level of 28 immune cell subsets between OS_L and OS_S groups. (b) Comparison of the level of 28 immune cell subsets between Che_OS_L and Che_OS_S groups. (c) Statistical analysis of the infiltration levels of MDSCs between Che_OS_L and Che_OS_S groups. (d–e) Overall Kaplan–Meier survival curves of patients with ESCC and high or low levels of MDSCs in the (d) Che_MDSC group or (e) NoChe_MDSC group. (f–g) Overall Kaplan–Meier survival curves of patients with ESCC in NoChe and Che groups in the case of (f) MDSCs>0.7059 or (g) MDSCs≤0.7059.
Correlation between T helper type 2 (Th2) cell levels and the prognosis of patients with ESCC treated without chemotherapy after surgery
Correlation analysis revealed that the infiltration level of Th2 cells in the NoChe_OS_L group was significantly higher than that in the NoChe_OS_S group (P<0.05) (Figure 5a and 5b). Moreover, among patients with ESCC treated without chemotherapy after surgery, a significantly longer OS was found in patients with a high level of Th2 cells compared with those with a low level of Th2 cells (HR=0.104, P=0.003) (Figure 5d). In contrast, there was no significant association between the infiltration level of Th2 cells and the OS in patients with ESCC treated with chemotherapy after surgery (HR=0.495) (Figure 5c). We then investigated the association between the efficacy of chemotherapy and Th2 cells. As shown in Figure 5e and 5f, the OS in patients treated with postoperative chemotherapy was longer than that in patients treated without chemotherapy after surgery in the case of Th2 cells<0.6290. However, no significant difference in the OS was found between the above two patient groups in the case of Th2 cells≥0.6290 or Th2 cells<0.6290.
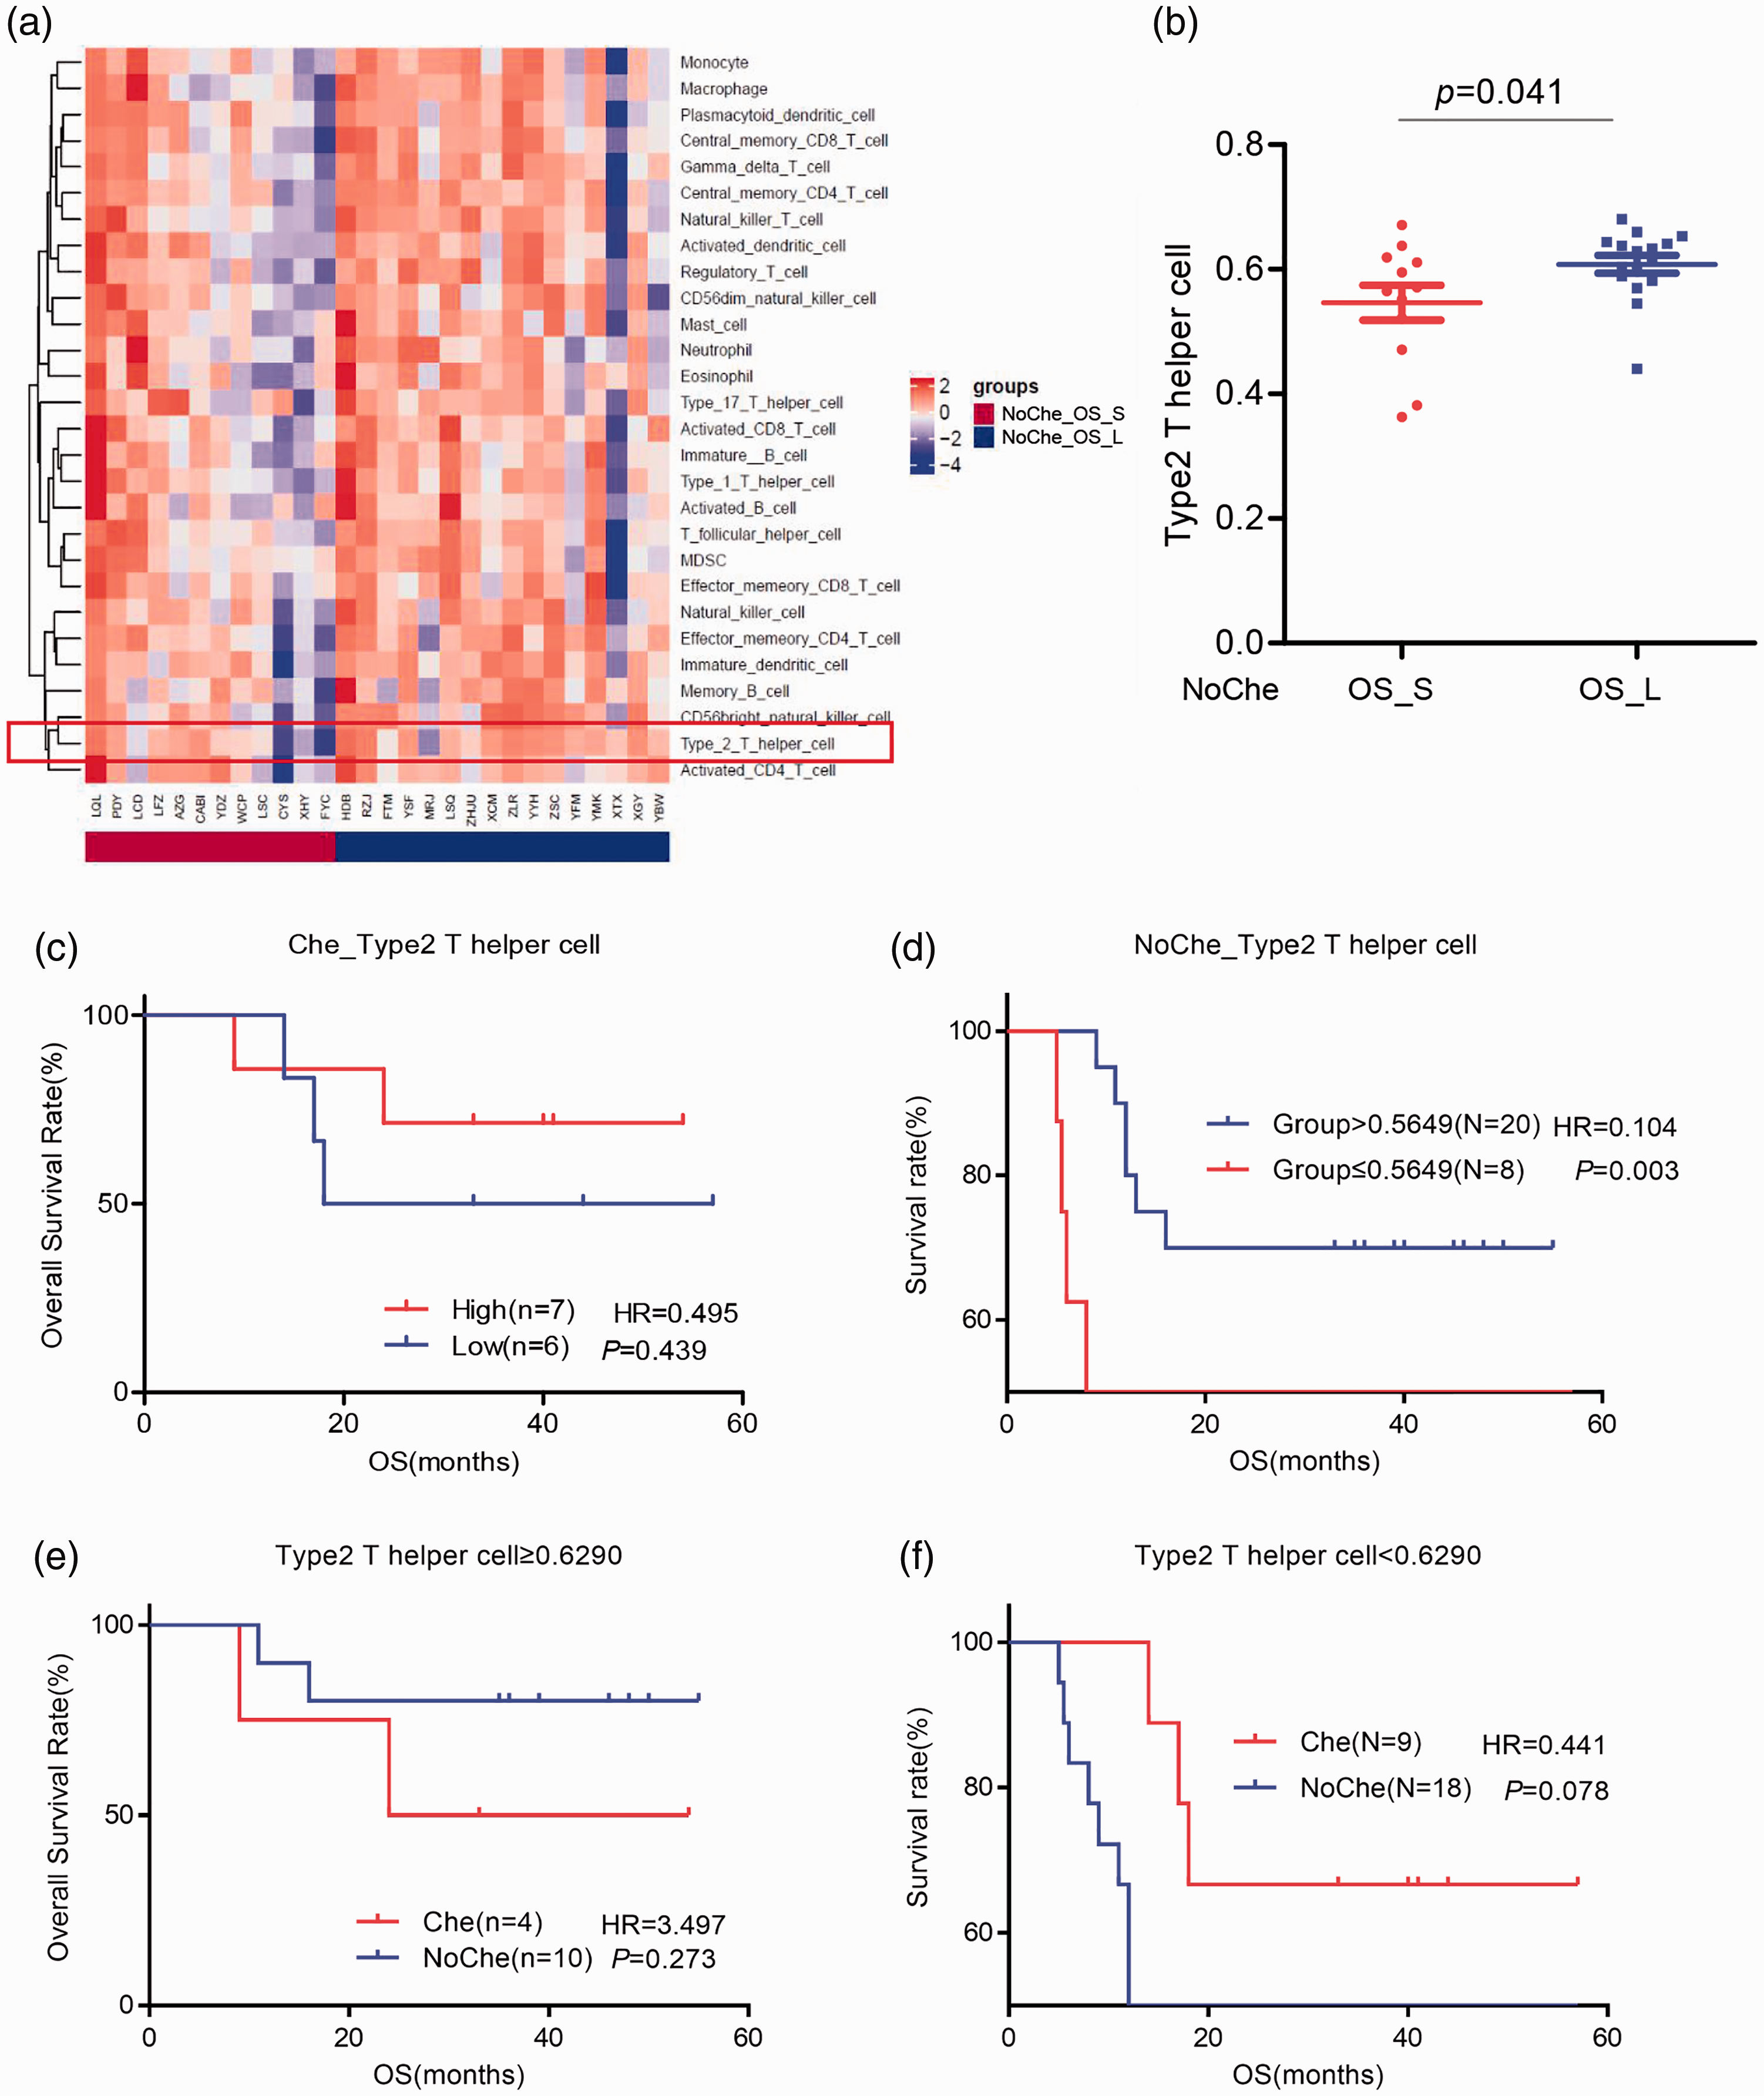
Correlation between the infiltration level of Th2 cells and the prognosis of patients with ESCC treated without chemotherapy after surgery. (a) Comparison of the levels of 28 immune cell subsets between NoChe_OS_L and NoChe_OS_S groups. (b) Statistical analysis of the infiltration level of Th2 cells between NoChe_OS_L and NoChe_OS_S groups. (c–d) Overall Kaplan–Meier survival curves of patients with ESCC and high or low levels of Th2 cells in (c) Che_Th2 cell group or (d) NoChe_Th2 cell group. (e–f) Overall Kaplan–Meier survival curves of patients with ESCC in NoChe and Che groups in the case of (e) Th2 cells≥0.6290 or (f) Th2 cells<0.6290.
Discussion
ESCC is a malignant tumor with high morbidity, recurrence, and mortality. Although the implementation of multidisciplinary comprehensive treatments has improved the survival of patients with ESCC in recent years, the high recurrence rate and distinct prognoses of patients at the same stage provide new challenges. 4 Recent research has identified H3 methylation and monocarboxylate transporter 1 and Jumonji-domain containing 3 expression as biomarkers for the poor prognosis of ESCC.18 –20 Additionally, patients with higher C-reactive protein levels and neutrophil-to-lymphocyte ratios have a better prognosis after chemotherapy. 21 In this study, the clinicopathological characteristics, including sex, age, pathologic stage, G differentiation, and lesion sites, were not significantly correlated with the prognosis of patients with ESCC. Moreover, we found that postoperative chemotherapy had no significant effect on the OS of these patients, consistent with previous clinical research. 22 Given that some studies suggested a role of postoperative chemotherapy in improving the prognosis of patients with ESCC, 23 whether postoperative chemotherapy affects ESCC prognosis remains to be determined. In this case, the identification of appropriate biomarkers for assessing the effect of postoperative chemotherapy on ESCC prognosis would greatly improve the efficiency of postoperative chemotherapy and the prognosis of patients with ESCC.
Here, we performed DNA panel sequencing to investigate the association between genetic variations and ESCC prognosis. The sequencing data showed that the ESCC tumor tissues harbored higher rates of SNVs TP53 (96%), FAT1 (23%), KMT2D (21%), and NOTCH1 (21%) and higher frequencies of CNVs in MYC (23%), CCND1 (23%), TP63 (15%), and FOXA1 (15%) compared with their corresponding adjacent non-tumor counterparts. Notably, no significant differences in the frequencies of SNV, CNV, MATH, TMB, or CNI in the above tumor-related genes were identified among patients with ESCC with distinct prognoses. Given that TP53 gene mutation and CCND1 gene amplification were found to be closely linked to a poor prognosis of ESCC,24 –26 whether these tumor-related genes affect ESCC prognosis needs to be further studied.
In the present study, transcriptome sequencing led to the identification of 488 DEGs among patients with ESCC with distinct prognoses, including 432 upregulated and 56 downregulated genes. Enrichment analysis revealed that these DEGs were mainly enriched in the pathways of human immune response, fibrinogen complex, and protein activation cascade. DEGs identified from the patients receiving postoperative chemotherapy with distinct prognoses were mainly enriched in the pathways of complement activation, formation of the cornified envelope, and other signaling pathways. ESCC prognosis-related DEGs from the patients treated without chemotherapy after surgery were mainly enriched in signaling pathways, including those associated with the detection of stimuli and fibrinogen complex. It remains to be determined how these DEGs and the related pathways are involved in ESCC prognosis.
With the development of immunotherapy, tumor microenvironments characterized by chronic inflammation, immunosuppression, and promotion of tumor blood vessel formation have attracted increasing attention in recent years. It has been reported that the infiltration of TILs plays an important role in the tumor microenvironment.27 –29 Although the infiltration levels of TILs were found to be associated with the prognosis of patients with tumors, 30 few studies have been focused on the effect of TILs on ESCC prognosis, and the relevant conclusions were somewhat controversial.31,32 In this study, we tested the levels of 28 immune cell subpopulations in tumor tissues of patients with ESCC and analyzed the predictive effect of these cells on ESCC. Among patients with distinct prognoses, no significant differences in the infiltration levels of the 28 immune cell subpopulations were detected. This observation prompted us to further analyze the levels of the immune cell subsets among patients with ESCC treated with postoperative chemotherapy to identify specific immune cell subpopulations associated with ESCC prognosis. The analysis revealed that patients with a high infiltration level of MDSCs had longer OS than those with a low level of MDSCs, implying that MDSCs act as an indicator for the prognosis of patients with ESCC treated with chemotherapy after surgery. Consistently, Nguyen et al. 33 showed that MDSC TIL levels were significantly correlated with improved OS and relapse-free survival. Similar findings were found in colorectal and stomach cancers.34,35 Additionally, we screened the levels of immune cell subsets among patients with ESCC treated without chemotherapy following surgery. In this case, patients with high infiltration levels of Th2 cells displayed a longer OS than those with low levels of Th2 cells, suggesting that the infiltration of Th2 cells may indicate the prognosis of patients with ESCC treated without chemotherapy after surgery. Notably, in the case of MDSCs>0.7059 or Th2 cells<0.6290, patients receiving postoperative chemotherapy had a longer OS than those treated without chemotherapy after surgery, but the difference in the OS was not significant. Thus, the exact role of MDSCs and Th2 cells in predicting the efficacy of postoperative chemotherapy in patients with ESCC remains to be clarified.
In conclusion, the levels of MDSCs or Th2 cells can be used as a biomarker for indicating the prognosis of patients with ESCC treated with or without chemotherapy after surgery, respectively. However, the role of MDSC and Th2 cell infiltration in identifying patients with ESCC who can benefit from postoperative chemotherapy remains to be addressed.
Footnotes
Declaration of conflicting interest
The authors declare that there is no conflict of interest.
Funding
The research was supported by the Sichuan Science and Technology Program (Grant number 2018JY0277 and 2019JDRC0076) and the Bethune Charitable Foundation (Grant number 320.320.2730.1876).
Author contributions
LP and WH wrote the first draft of the manuscript. LP, WH, FY, YS, XS, JZ, QL, QF, and WX analyzed and interpreted the data. YH contributed to the conception of the research. All authors critically revised the manuscript, agreed to be fully accountable for ensuring the integrity and accuracy of the work, and read and approved the final manuscript.