
Abstract
Objective
To describe interactions among cytokines and to identify subgroups of systemic lupus erythematosus (SLE) patients based on cytokine levels using principal component analysis and cluster analysis.
Methods
Levels of 12 cytokines were measured using sensitive multiplex bead assays and associations with SLE features including disease activity and renal involvement were assessed.
Results
In a group of 203 SLE patients, strong correlations were observed between interleukin (IL)6 and interferon (IFN)γ levels (r = 0.624), IL17 and IFNγ levels (r = 0.768), and macrophage inflammatory protein (MIP)1α and MIP1β levels (r = 0.675). Cluster analysis revealed two distinct patient groups characterized by high levels of IL8, MIP1α, and MIP1β (group 1) or of IL2, IL6, IL10, IL12, IFNγ, and tumor necrosis factor α (group 2). Active disease was more common in group 1 (49/88, 55.7%) than in group 2 (40/115, 34.8%). More patients in group 2 had renal involvement (42/115, 36.5%) than in group 1 (22/88, 25%).
Conclusions
Assessment of cytokine profiles can identify distinct SLE patient subgroups and aid in understanding clinical heterogeneity and immunological phenotypes.
Keywords
Introduction
Systemic lupus erythematosus (SLE) is a highly complex and heterogeneous autoimmune disease with broad clinical and immunological manifestations and variable responses to treatment. 1 Development of relevant biomarkers to understand disease heterogeneity and improve prognosis is an important unmet need in SLE.2,3 SLE severity can be objectively assessed using disease activity scoring systems. However, acute phase markers (e.g., erythrocyte sedimentation rate and C-reactive protein) and serum markers (e.g., anti-double stranded [ds]DNA antibodies [Abs], anti-C1q Abs, and complement C3 and C4) showed limited sensitivity and specificity for disease activity. 4 The absence of a gold standard for defining disease activity and the complex pathophysiology of SLE involving multiple organs contributes makes understanding the disease extremely challenging. 5 All SLE patients are suspected of having some renal involvement, but only ∼60% develop active lupus nephritis (LN). 6 For management of LN, American (American College of Rheumatology, ACR) 7 and European (European League Against Rheumatism and European Renal Association-European Dialysis and Transplant Association) guidelines are used. 8 Despite development of successful induction therapy, a considerable proportion of patients respond poorly, and currently used clinical biomarkers cannot adequately detect such patients. Invasive renal biopsies are the gold standard for diagnosis of LN. Therefore, more reliable and less invasive methods are required for diagnosis and treatment of patients with LN.
Cytokines play important and diverse roles in immune regulation and cellular differentiation, and can enhance or suppress the production of other cytokines. 9 Cytokine profiling techniques have made it possible to simultaneously evaluate levels of multiple cytokines and assess their associations with SLE disease activity. Levels of several cytokines were found to be related to the prognosis and severity of SLE.10–12 However, associations between cytokine profiles and SLE prognosis and severity are not fully understood. Measurement of serum cytokine levels could be of value for clinical assessment of disease activity or LN in SLE patients. Conflicting results regarding associations between serum cytokine levels and SLE disease were obtained in previous studies depending on the study design.13–15 Moreover, data were often obtained in isolation, making it difficult to understand the operation of cytokine networks in SLE. 16 Cytokines are unlikely to function purely in isolation from one another, and knowledge of the cytokine profiles associated with SLE disease activity or renal involvement are poorly understood12,17
The purpose of the study was to describe interactions among cytokines and to identify subgroups of SLE patients based on cytokine levels using principal component analysis (PCA) and cluster analysis.
Methods
Patients
SLE patients who met the ACR criteria for SLE18,19 were recruited from the Department of Rheumatology, Seoul St. Mary’s Hospital (Seoul, Korea) between January 2010 and May 2012. Patients were initially assessed at the baseline visit and then at 6- or 12-month follow-up visits. Peripheral blood was collected for routine autoAb tests (anti-DNA Ab, anti-C1q Ab, and complement C3/C4). SLE disease activity was measured using the Systemic Lupus Disease Activity Index 2000 (SLEDAI-2K) and active disease was defined as SLEDAI-2K > 4 20 at the baseline visit. Renal involvement was defined based on the urine protein: creatinine ratio, or 24-hour urine protein test result of 500 mg of protein/24 hours, or the presence of red blood cell casts. Presence of biopsy-confirmed renal involvement was also used as a clinical criterion in the presence of antinuclear Abs or anti-double stranded (ds) DNA Abs. 21 SLE patients received conventional treatment such as hydroxychloroquine, non-steroidal anti-inflammatory drugs, corticosteroids, and nonspecific immunosuppressants depending on their disease status. In addition, healthy subjects with no history of autoimmune disorders, major infections, or other inflammatory diseases were included as controls. The study was approved by the Institutional Review Board of The Catholic University of Korea (KC14RISI0295). All participants or their parents provided written informed consent.
Cytokine profile assays
Sera collected for autoAb tests were used for cytokine measurement. Most cytokines are stable for up to 2 years when stored at −80°C and multiple freeze-thaw cycles should be avoided. 22 Interleukin (IL)-13, IL-15, IL-17, and CXC motif ligand (CXCL)8 can degrade within 1 year of storage, whereas IL-2, IL-4, IL-12 and IL-18 are stable for up to 3 years. 22 Other cytokines, such as IL-1α, IL-1β, IL-5, IL-6, and IL-10 can degrade up to 50% within 2 to 3 years of storage. 23 In this study, no serum samples were duplicates and all samples were stored for less than 1 year at −80°C prior to analysis if not assayed within 1 month. The following panel of cytokines was selected: IL2, IL6, IL8 (CXCL8), IL10, IL12p40, IL17, IL18, interferon (IFN) γ, macrophage inflammatory protein (MIP)-1α, MIP1β, Regulated on Activation, Normal T Expressed and Secreted (RANTES), and tumor necrosis factor (TNF) α. Cytokine levels were measured using MILLIPLEX MAP Human Cytokine/Chemokine Panel kits (Millipore, Schwalbach am Taunus, Germany) and a Luminex 200 instrument (Luminex, Austin, TX, USA). Plates coated with specific capture Abs were incubated with serum samples, washed, and incubated with a cocktail of biotinylated Abs according to the manufacturer’s protocol. The cytokine concentration was determined using a standard curve. Data acquisition and analysis of serum cytokine levels was performed using xPONENT 3.1 software (Luminex). The Minimum Detectable Concentration (MinDC) was calculated using MILLIPLEX® Analyst 5.1 (Millipore). This value measures the true limit of detection for an assay by mathematically determining what the empirical MinDC would be if an infinite number of standard concentrations were run for the assay under the same conditions. The MinDC + two standard deviation values provided by the manufacturer were as follows: IL2, 0.46 pg/mL; IL6, 0.14 pg/mL; IL8, 0.52 pg/mL; IL10, 0.91 pg/mL; IL12, 3.24 pg/mL; IL17, 1.16 pg/mL; IL18, 0.68 pg/mL; MIP1α, 4.68 pg/mL; MIP1β, 0.84 pg/mL; RANTES, 2.56 pg/mL; IFNγ, 1.42 pg/mL; and TNFα, 5.75 pg/mL. Values lower than these were assigned values of 0.1 pg/mL.
Statistical analyses
Because serum cytokine levels were not normally distributed as shown by Kolmogorov–Smirnov and Shapiro–Wilk tests, continuous variables were summarized as medians with interquartile ranges or ranges and compared using the Mann–Whitney U test. To investigate which cytokines were associated with active disease and renal involvement, multivariate logistic regression analysis was performed. Non-significant predictors were removed using backward elimination (probability threshold for removal: 0.1). The diagnostic performance of cytokine levels for identifying patients with active SLE or LN was assessed using the area under the receiver operating characteristic (ROC) curve (AUC). To investigate cytokine networks, Spearman’s correlation was used to estimate the strength and direction of associations between two continuous variables. PCA was used to identify unique groups among 12 serum cytokines as well as conventional serologic markers (complement C3 and C4, anti-dsDNA Ab, and anti-C1q Ab) in SLE patients. Using the Kaiser criterion, two components were retained with Eigenvalues > 2. These two components described 51.7% of the variance in cytokine levels in the study cohort. Subsequently, cluster analysis of standardized cytokine levels was conducted. Associations between cytokine groups and disease activity or renal involvement were investigated. A two-tailed P value < 0.05 was considered statistically significant. All statistical analyses were performed using IBM SPSS Statistics for Windows version 24.0 (IBM Corp., Armonk, NY, USA).
Results
Patient characteristics
Among the 203 SLE patients and 40 healthy controls enrolled in the study, 184 (90.6%) and 35 (87.5%) were female, respectively. The median (interquartile range) ages of SLE patients and controls were 42 years (36–50 years) and 40 years (32–46 years), respectively. The baseline characteristics of patients, including clinical and immunological laboratory results, are summarized in Table 1. The median disease duration was 5.7 years (range: 1.8–16.1 years). Among SLE patients, 89 (43.8%) had active disease and 64 (31.5%) had renal involvement. Patients with active disease group were younger (35 years, range 26–48 years vs. 41 years, range 37–50 years; P = 0.046) and had a shorter duration of disease (3.2 years, range 1.1–8.7 years vs. 5.6 years, range 2.4–16.1 years; P = 0.039) compared with those with inactive disease. No patients with LN required renal replacement therapy.
Characteristics of 203 SLE patients.

Cytokine profiles and laboratory findings in patients with active and inactive SLE
Among the 12 cytokines and other laboratory parameters, serum levels of IL8, MIP1α, MIP1β, and anti-C1q were significantly higher in SLE patients with active disease compared with inactive disease (Figure 1 and Table 2). Multivariable logistic regression models were used to determine whether cytokine profiles could better identify patients with active disease than commonly used laboratory tests including serum complement, anti-dsDNA Abs, and anti-C1q Abs. In a backwards stepwise logistic regression model, only IL8 was retained with an odds ratio (OR) of 1.06 (95% confidence interval [CI], 1.05–1.07) (P = 0.037). In the ROC curve analysis for IL8, MIP1α, MIP1β, and anti-C1q Abs, only MIP1α showed significant diagnostic utility (AUC = 0.717; 95% CI, 0.634–0.801) for active SLE (Table 3). Addition of IL8 significantly increased the AUC to 0.803 (95% CI, 0.727–0.881; P = 0.009). Addition of IL8, MIP1β, and anti-C1q Abs increased the AUC to 0.976 (95% CI, 0.936–1; P = 0.002).
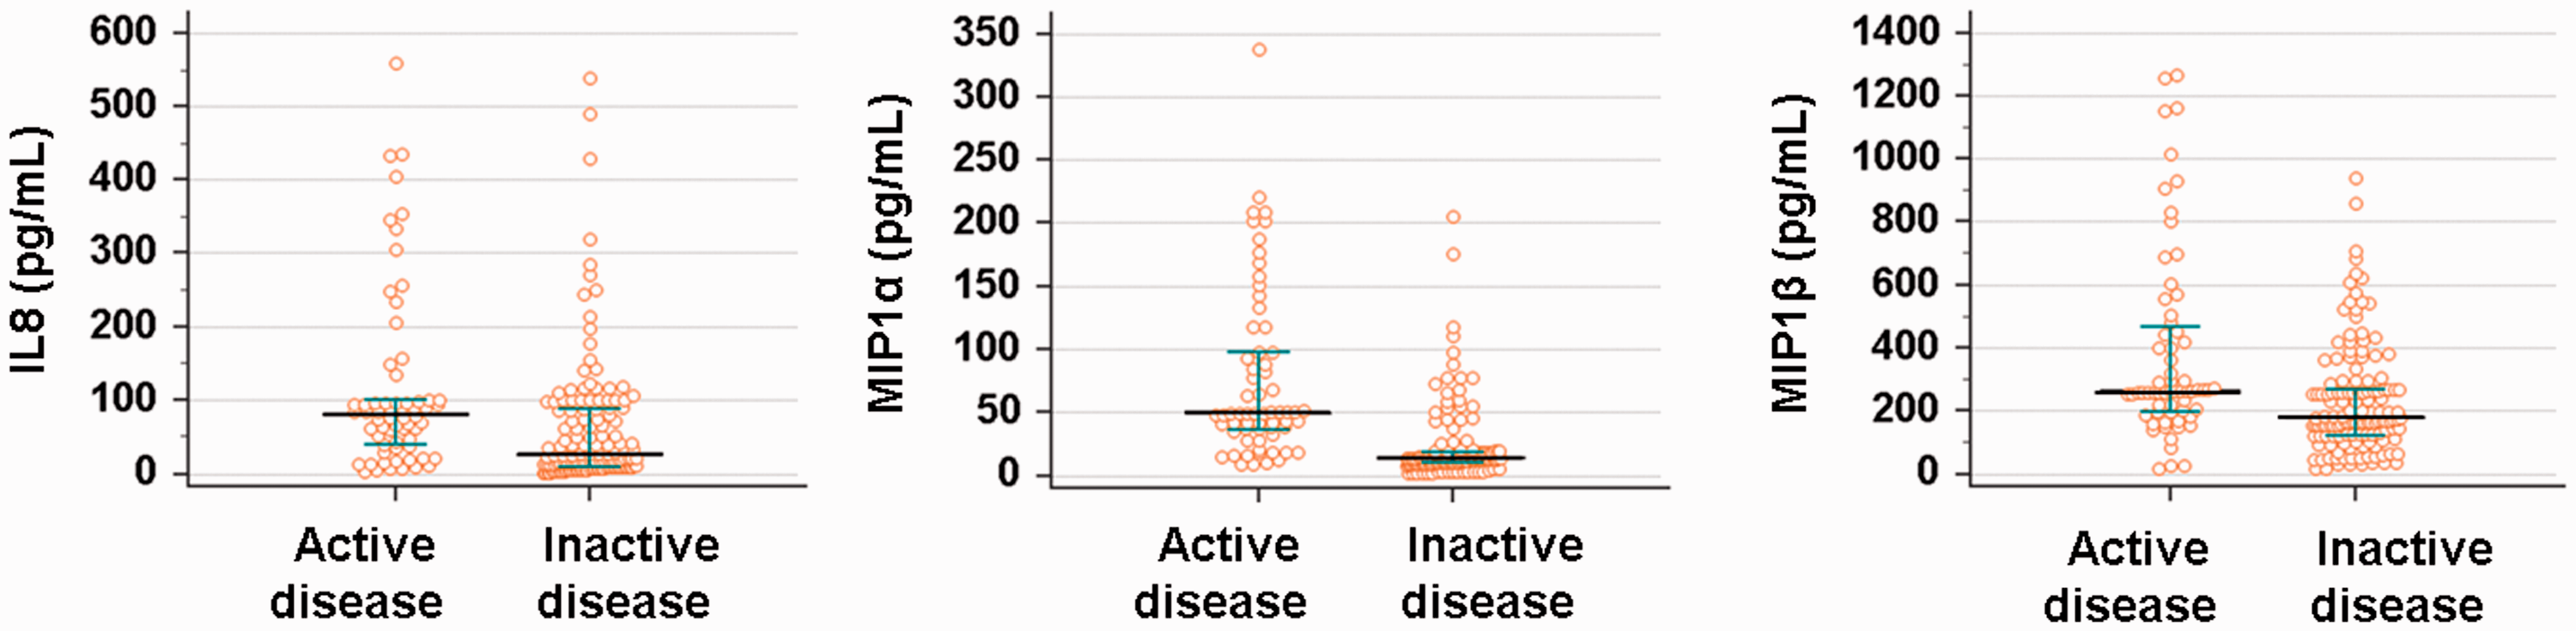
Serum cytokine whose levels differed significantly between SLE patients with active and inactive disease. Serum levels of IL8, MIP1α, and MIP1β were significantly higher in SLE patients with active disease. The bars show median values. P < 0.05 from Mann–Whitney U test
Comparisons of cytokine profiles and laboratory findings between active and inactive SLE patients.

*active SLE vs. inactive SLE.
†Median (range).
ROC curve analysis of IL8, MIP1α, MIP1β, and anti-C1q Abs for identification of patients with active SLE.

AUC, area under the curve; CI, confidence interval.
Cytokine profiles and laboratory findings in SLE patients with and without renal involvement
Levels of IL10, IL12, IL18, IFNγ, TNFα, and anti-C1q Abs were increased in SLE patients with renal involvement compared with those without renal involvement (Figure 2 and Table 4). Following backwards stepwise logistic regression modeling, IL18 (OR 1.04; 95% CI, 1.036–1.043), IFNγ (OR 1.02; 95% CI, 1.014–1.025), and anti-C1q Abs (OR 1.03; 95% CI, 0.993–1.069) were retained in SLE patients with renal involvement (P = 0.007, 0.037, and 0.003, respectively). In the ROC analysis for IL10, IL12, IL18, IFNγ, TNFα, and anti-C1q Abs, three cytokines including IL10 (AUC, 0.6; 95% CI, 0.521–0.678), IL18 (AUC, 0.637; 95% CI, 0.561–0.714), and TNFα (AUC, 0.644; 95% CI, 0.567–0.72) had AUC > 0.6. However, no parameter was able to identify SLE patients with renal involvement with AUC > 0.7 (Table 5).

Serum cytokines whose levels differed significantly between SLE patients with and without renal involvement. Serum levels of IL10, IL12, IL18, IFNγ, and TNFα were significantly higher in SLE patients with renal involvement. The bars show median values. P < 0.05 from Mann–Whitney U test
Comparisons of cytokine profiles and laboratory findings in SLE patients with and without renal involvement.
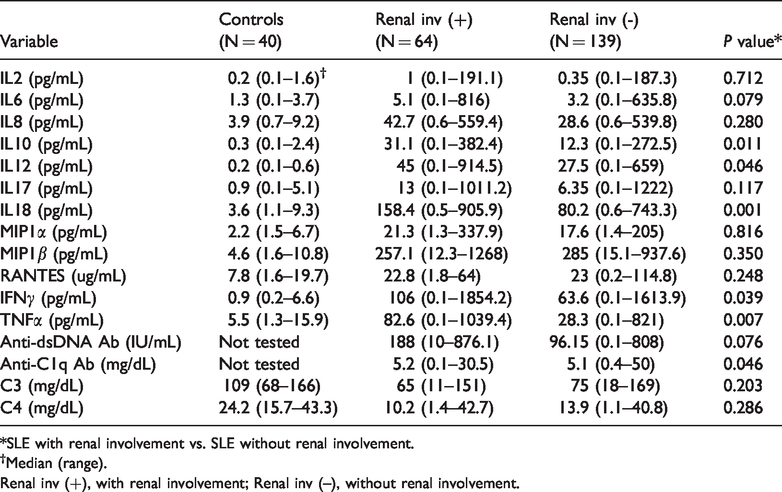
*SLE with renal involvement vs. SLE without renal involvement.
†Median (range).
Renal inv (+), with renal involvement; Renal inv (–), without renal involvement.
ROC curve analysis of IL10, IL12, IL18, IFNγ, TNFα, and anti-C1q Abs for identification of patients with active SLE disease.

AUC, area under the curve; 95% CI, 95% confidence interval.
Cluster analysis of cytokine profiles in SLE patients
Immune and inflammatory mediators, including cytokines and chemokines, may not necessarily function in isolation from one another. Therefore, cluster analysis of 12 cytokines was performed and cytokine groups that might permit identification of SLE patients with active disease or renal involvement in SLE patients were analyzed. Spearman correlation analyses demonstrated that levels of each cytokine were significantly correlated (P < 0.05) with those of at least one other cytokine. Strong correlations were observed between IL6 and IFNγ (r = 0.624), IL17 and IFNγ (r = 0.768), and MIP1α and MIP1β (r = 0.675). Only modest correlations were observed between other cytokines whose levels were increased in patients with active disease, indicating that active disease may be associated with more than one discrete cytokine pattern (Figure 3).

Spearman’s rank correlations between the levels of 12 cytokines. The cytokines associated with active disease (IL8, MIP1α, and MIP1β) are displayed in gold. Because the cytokines associated with renal involvement (IL10, IL12, IL18, IFNr, and TNFa) are displayed in violet. The lines represent correlations with P values < 0.05. The colors of the lines reflect the strength of the Spearman correlation (red, r = 0.6–0.79; green, r = 0.4–0.59).
Cluster analysis of standardized levels of the 12 cytokines was then performed to cluster patients into k = 2 groups. A scatterplot of two principal components is shown in Figure 4. Levels of IL8, MIP1α, and MIP1β were elevated in group 1 (fold change 1.9–3.4 compared with group 2). By contrast, levels of IL2, IL6, IL10, IL12, IFNγ, and TNFα were increased in group 2 (fold change 1.5–11.1 compared with group 1). More patients in group 1 (49/88, 55.7%) had active disease compared with group 2 (40/115, 34.8%; P = 0.027). The number of patients with renal involvement was significantly higher in group 2 (42/115, 36.5%) compared with group 1 (22/88, 25%; P = 0.031).

Component plot in rotated space showing the first two principal components (PC1 and PC2) and two main groups of cytokines. Group 1 consisted of IL8, MIP1α, and MIP1β. Group 2 consisted of IL2, IL6, IL10, IL12, IFNγ, and TNFα .
Discussion
The abnormal biological activity of several cytokines plays an important role in the pathophysiology of SLE and multiplex bead assays allow simultaneous tests of multiple cytokines.10–12 Biomarkers of SLE might include initial resident and inflammatory cell activation (cytokines), signals for homing to the kidney (chemokines),24,25 activation of inflammatory cell types (growth factors), and damage to resident cell types. 26 Variability in cytokine measurements could reflect heterogeneity in the stages of disease progression. In this study, levels of 12 cytokines were measured in 203 SLE patients. Associations between specific cytokines and cytokine profile and the presence of active disease or renal involvement were examined. Patients with active SLE had significantly increased levels of IL8, MIP1α, and MIP1β compared with patients with inactive SLE. Vila et al. reported that patients with discoid lupus had higher levels of MIP1α, and that increased MIP1β levels were correlated with higher Systemic Lupus International Collaborating Clinic Damage Index scores. However, the authors did not assess the relationships between MIP1α or MIP1β levels and disease activity. 27 IL8, a member of the CXC chemokine family, is an important chemotactic factor for recruitment of neutrophils to sites of infection and damage. 28 In the present study, increased serum IL8 level was an independent diagnostic marker of active SLE status. This result is consistent with a previous report showing that an increased concentration of IL8 in bronchoalveolar lavage fluid was a useful biomarker of active disease and pulmonary fibrosis in SLE patients. 29 However, IL8 level was also suggested as a biomarker for differentiation of disease status. Increased IL6 and IL8 levels, in addition to excretion of β2-microglobulin and Tamm–Horsfall glycoprotein in urine, were suggested to reflect renal inflammatory activity, lupus tubulointerstitial nephritis, and lupus glomerulonephritis. 30 In another study of neuropsychiatric lupus erythematous patients, cerebrospinal fluid levels of IL8 (P = 0.009), IL6 (P = 0.002), and IL17 (P = 0.034), were significantly higher compared with control patients. 31 Therefore, our results confirm the need for further investigations of the functional relevance of IL8 in SLE patients.
We also analyzed associations between cytokine levels and renal involvement in SLE patients. We found that increased serum IL18, IFNγ, and anti-C1q Ab levels were independent biomarkers of renal involvement. IL18 is a cytokine in the IL1 family. Dysregulation of the IL1 family plays a critical role in immune activation in SLE, 32 and monocytes, macrophages, and dendritic cells are the major sources of IL18. 33 Previous studies showed that IL18 levels were increased in the sera, kidneys, and keratinocytes of SLE patients,34–36 and increased serum IL18 and IFNγ levels correlated with disease activity and active renal disease.14,32,37–39 These findings indicated that activated and damaged glomerular cells, in association with infiltrating immune cells, produce inflammatory mediators, especially IL1-family of cytokines including IL18, which may play a pivotal role in extending renal injury. Our results confirmed previous reports that IL18 level can function as a biomarker of renal involvement in addition to traditional biomarkers such as anti-dsDNA Abs, C3, and anti-C1q Abs.12,34,39 Distinct patterns of organ involvement are associated with profiles of circulating IFNs. For example, high levels of IFNα are associated with active mucocutaneous inflammation and a more benign cardiovascular profile. Both high functional type I IFN activity and high IFNγ levels are characteristic of severe SLE with arthritis and renal involvement. 40
In the present study, levels of most of the cytokines measured correlated with those of at least one other cytokine. Cluster analysis of 12 cytokines identified two clusters that explained 51.7% of the variance in cytokine levels. Two distinct groups of patients were identified based on cluster analysis, characterized by high levels of IL8, MIP1α, and MIP1β (group 1) or of IL2, IL6, IL10, IL12, IFNγ, and TNFα (group 2). Because IL8 was an independent biomarker of active SLE, patients in group 1 were more likely to have active disease than patients in group 2 (P = 0.027). Therefore, the cytokines in group 1 may be used as novel biomarkers for active SLE, although further validation is needed. The number of patients with renal involvement was significantly greater in group 2 compared with group 1 (P = 0.03). In a previous study, Pacheco et al. 11 identified four groups among 67 SLE patients: neutral, chemokine, G-colony stimulating factor-dominant, and IFNα/pro-inflammatory. Recently, Reynold et al. 12 reported three distinct cytokine groups following measurement of 10 serum cytokines: patients with higher levels of IFNα and B lymphocyte stimulator (BLyS; group 1), those with increased CXCL10 and CXCL13 (group 2), and those with low levels of cytokines (group 3). Despite marked heterogeneity in the patient population and cytokines tested, two distinct cytokine clusters were identified in a relatively large number of SLE patients in the present study. Similarly, using composite criteria/indices, TNFα and plasma albumin both performed well as discriminators of patients with SLE and controls and as proxies for disease activity; in particular, renal disease activity was well reflected by TNFα levels. 41 High disease activity is associated with either simultaneous upregulation of IFNλ1 and IFNα or, independently, upregulation of CXCL10. Moreover, serum IFNλ1 levels correlate with levels of T-helper type 17 cytokines and identify a patient subgroup with more renal damage. 42
Although we identified important associations between cytokine levels and disease status in SLE patients, our study had several limitations. Selection bias was inherent to the cross-sectional retrospective study design, specific information regarding drug treatments and prognosis was lacking, and we studied a relatively small cohort recruited from a single center. In addition, cytokines were measured at either a single time point or at two time points, which may not adequately capture fluctuations over time. Moreover, there was no intervention, treatment, or exposure administered to participants in our study. The impact of different treatments could undermine the interpretation and external validity of our results as immunomodulation might influence cytokine production and other serum markers. Thus, the cytokine clusters identified here as diagnostic biomarkers of disease activity and renal involvement markers may be not be accurate for all patients. Despite the above limitations, we were able to determine levels of 12 cytokines using a multiplex assay, which had the major advantage of quantifying multiple cytokines simultaneously in a relatively large number of SLE patients. Finally, novel subsets of SLE patients were identified based on cluster analysis, indicating the need for further prospective studies with longer follow-up periods. Unexpectedly, traditional biomarkers such as C3, C4, and anti-dsDNA Abs were not included in any of the two cytokine clusters. Further studies are needed to determine how the levels of each cytokine and group of cytokines are involved in disease flare-ups and remission in SLE patients.
Conclusion
Assessment of cytokine profiles can identify distinct cytokine subgroups and aid in understanding the clinical heterogeneity and immunological phenotypes of SLE patients. However, several biases were present in our study including a lack of clinical information on pivotal aspects of disease status, unclear timing of blood draw, different treatments received, and variable disease duration. SLE patients with distinct cytokine profiles were identified with differing immunological and clinical manifestations that appeared stable over time. Further investigations of cytokine networks in ex vivo human SLE samples as well as in vivo in animal models will help uncover the roles of additional cytokines in SLE pathogenesis and potentially identify novel targets for therapy.