
Abstract
Objective
To guide clinical decision making, race-, age- and gender-specific reference ranges for lymphocytes and CD4+ T-cell subsets are required.
Methods
Single platform flow cytometry to determine reference intervals for lymphocyte subpopulations and CD4+ T-cell subsets in 196 healthy Han Chinese adults.
Results
The frequencies and absolute numbers of B cells were slightly lower in Han Chinese individuals of the Shanxi region than in individuals from Hong Kong, Germany and Singapore, while percentages and absolute numbers of NK cells were slightly higher compared with individuals from Hong Kong. CD4+/CD8+ T-cell ratios, CD4+ T cell percentages and Th2 cell counts were higher, while frequencies and numbers of CD8+ T cells, numbers of NK cells and percentages of Th1 cells were lower, in females compared with males. CD4+ T cell percentages, CD4+/CD8+ T-cell ratios, numbers of CD8+ T cells and Treg cells, and Th17/Treg cell ratios differed by age.
Conclusion
We established lymphocyte and CD4+ T-cell subset reference intervals for healthy Han Chinese adults of the Shanxi region. Ethnicity, gender and age affected lymphocyte subset composition.
Introduction
The innate and adaptive immune systems serve to protect the body from damage. 1 Peripheral blood lymphocytes play key roles in maintaining immune homeostasis, and contribute to adaptive immune responses through both humoral and cellular immunity. 2 CD4+ T cells are activated following stimulation, and can be subdivided into helper T cells (Th cells) including the effector Th1 and Th2 subpopulations, the more recently discovered Th17 cells, and regulatory T cells (Treg cells).1–3 Different effector and regulatory subsets carry out a variety of functions during immune responses, ranging from activation of cytotoxic T cells and B cells to induction of Treg cells; the latter play important roles in suppression of immune responses. 4 Activation or dysregulation of lymphocyte subsets can contribute to the onset or progression of diseases including leukemia, allergy, immunodeficiency syndromes and autoimmune diseases.5,6 Therefore, analysis of lymphocyte subpopulations can offer an effective means to understand disease pathogenesis and progression, to assess the immune status of patients, and to evaluate treatment outcomes.
Flow cytometry is typically used to analyze lymphocyte subsets in the laboratory. 7 However, to evaluate the immune status of patients, it is necessary to establish reference ranges in healthy individuals, carefully matched for gender, age, and ethnicity. 8 Several studies have been carried out to identify normal reference ranges for lymphocyte subsets in healthy Chinese adults.9–11 However, reference ranges for lymphocyte subsets and CD4+ T cell subsets in healthy Han Chinese individuals of the Shanxi region have not been reported previously. Thus, this study aimed to establish reference intervals for the absolute numbers and percentages of peripheral blood lymphocytes and CD4+ T cell subsets in healthy Han Chinese individuals of the Shanxi region, and to assess differences in these ranges associated with age, race and sex.
Methods
Study population
Healthy Han Chinese individuals who visited the Second Hospital of Shanxi Medical University for regular medical checkups were enrolled in the study. All individuals lived in the Shanxi area. Exclusion criteria included use of steroids or immunosuppressants and history of serious medical problems including infections (e.g., human immunodeficiency virus or hepatitis B virus) or chronic noninfectious conditions (e.g., autoimmune diseases, allergies, cancer, chronic renal disease and diabetes mellitus). To examine changes in cell subtypes associated with ages, individuals were divided into five age strata (20–30 years; 31–40 years; 41–50 years; 51–60 years and 61–70 years). We also compared levels of lymphocyte subpopulations and CD4+ T cell subsets between males and females. All participants provided written informed consent and the study protocol was approved by the ethics committee of the Second Hospital of Shanxi Medical University (2016KY007). After fasting for 10 to 12 hours, blood samples were collected from the antecubital vein into tubes containing ethylenediaminetetraacetic acid (EDTA) and heparin as anticoagulants.
Analysis of lymphocyte subsets
To determine percentages and numbers of T cells (CD3+CD19-), B cells (CD3-CD19+), CD4+ T cells (CD3+CD4+), CD8+ T cells (CD3+CD8+), and natural killer (NK) cells (CD3-CD16+CD56+), peripheral blood samples (2 mL) from each subject were collected. For immunofluorescence staining, 50 µL of each blood samples were placed in TruCount tubes A nd B. Then, 20 µL of CD3-fluorescein isothiocyanate (FITC)/CD8-phycoerythrin (PE)/CD45-peridinin-chlorophyll protein (PerCP)/CD4-allophycocyanin (APC) antibodies (clones SK7/SK1/2D1/SK3, respectively) were added to tube A and 20 µL of CD3-FITC/CD16 + 56-PE/CD45-PerCP/CD19-APC antibodies (clones SK7/B73.1 NCAM16.2/2D1/SJ25C1, respectively) were added to tube B. All antibodies were purchased from BD Biosciences (San Jose, CA, USA). After incubation at room temperature for 20 minutes in the dark, stained cells were washed with 1× FACS buffer and then incubated for 15 minutes in the dark. Data on 15,000 cells were acquired on a FACSCanto instrument (BD Bioscience) and analyzed using MultiSET software.
Analysis of CD4+T cell subsets
To analyze Th1, Th2, and Th17 cells, 80 µL of heparinized blood were stimulated with 10 µL of phorbol myristate acetate, 10 µL of ionomycin and 1 µL of GolgiStop. The cells were incubated for 5 hours at 37°C and then divided into Tube A and Tube B. Both tubes were stained with human anti-CD4-FITC (clone SK3) in the dark for 30 minutes at room temperature, then cells were fixed and permeabilized in the dark at 4°C for 30 minutes. Subsequently, cells in Tube A were stained with anti-IL-17-PE (clone SCPL1362) and anti-interferon (IFN)-γ-APC (clone 4S.B3), and those in Tube B were stained with human anti-IL-4-PE (clone MP4-25D2) in the dark at room temperature for 30 minutes. Cells were washed with phosphate-buffered saline and examined by four-color flow cytometry. To analyze Treg cells, 80 µL of anti-coagulated blood were stained with anti-CD4-FITC and anti-CD25-APC (clone 2A3) at room temperature in the dark for 30 minutes. Cells were fixed and permeabilized in the dark at 4°C for 30 minutes, then stained with human anti-FOXP3-PE (clone PCH101) in the dark at room temperature for 30 minutes. Cells were washed and examined by flow cytometry (FACSCalibur, BD Biosciences). Data were acquired on 10,000 cells, then gated and analyzed using Cell Quest software to determine the frequencies of CD4+ T cell subsets. Absolute numbers of CD4+ T cell subsets were calculated by multiplying the percentage of each subset by the absolute number of total CD4+ T cells. Cell types were defined as Th1 (CD4+IFN-γ+), Th2 (CD4+ IL-4+), Th17 (CD4+IL-17+), or Treg (CD4+CD25+FOXP3+).
Statistical analysis
All statistical analyses were performed using GraphPad Prism 7 (GraphPad Software Inc., La Jolla, CA, USA) and SPSS Statistics for Windows, version 22.0 (SPSS Inc., Chicago, IL, USA). Continuous variables were reported as the mean ±standard deviations (SD). The Kolmogorov–Smirnov test was used to assess normality. Reference limits were defined as the 95th percentile of observed data. Since the absolute numbers and percentage of CD4+ T cells were normally distributed, we used the Student’s t-test to assess differences between lymphocyte subsets in men and women. For non-normally distributed lymphocyte subsets, comparisons among different age groups were made using non-parametric tests. The Kruskal–Wallis H test was used to evaluate differences between age groups, Spearman’s rank correlation was used to evaluate relationships between age and cell subsets, and the Mann–Whitney U test was used to evaluate the influence of gender on cell subsets. All tests were two-sided, and values of P < 0.05 were considered statistically significant.
Results
A total of 196 healthy Han Chinese individuals (mean ± SD age: 43.22±13.46 years) were recruited in this study. Absolute numbers and percentages of lymphocyte subpopulations and CD4+ T cell subsets were reported as 95% confidence intervals, medians, mean ± SD (Table 1). A flow cytometry dot plot of peripheral lymphocytes and CD4+ T cell subsets from a representative healthy individual is shown in Figure 1.
Reference ranges for absolute counts and percentages of lymphocytes and CD4+ T cell subsets in healthy Han Chinese of the Shanxi district, China.

*95% confidence interval of the sample mean. ** 2.5–97.5th percentile of reference range.
Th cells: Helper T cells, NK cells: natural killer cells.
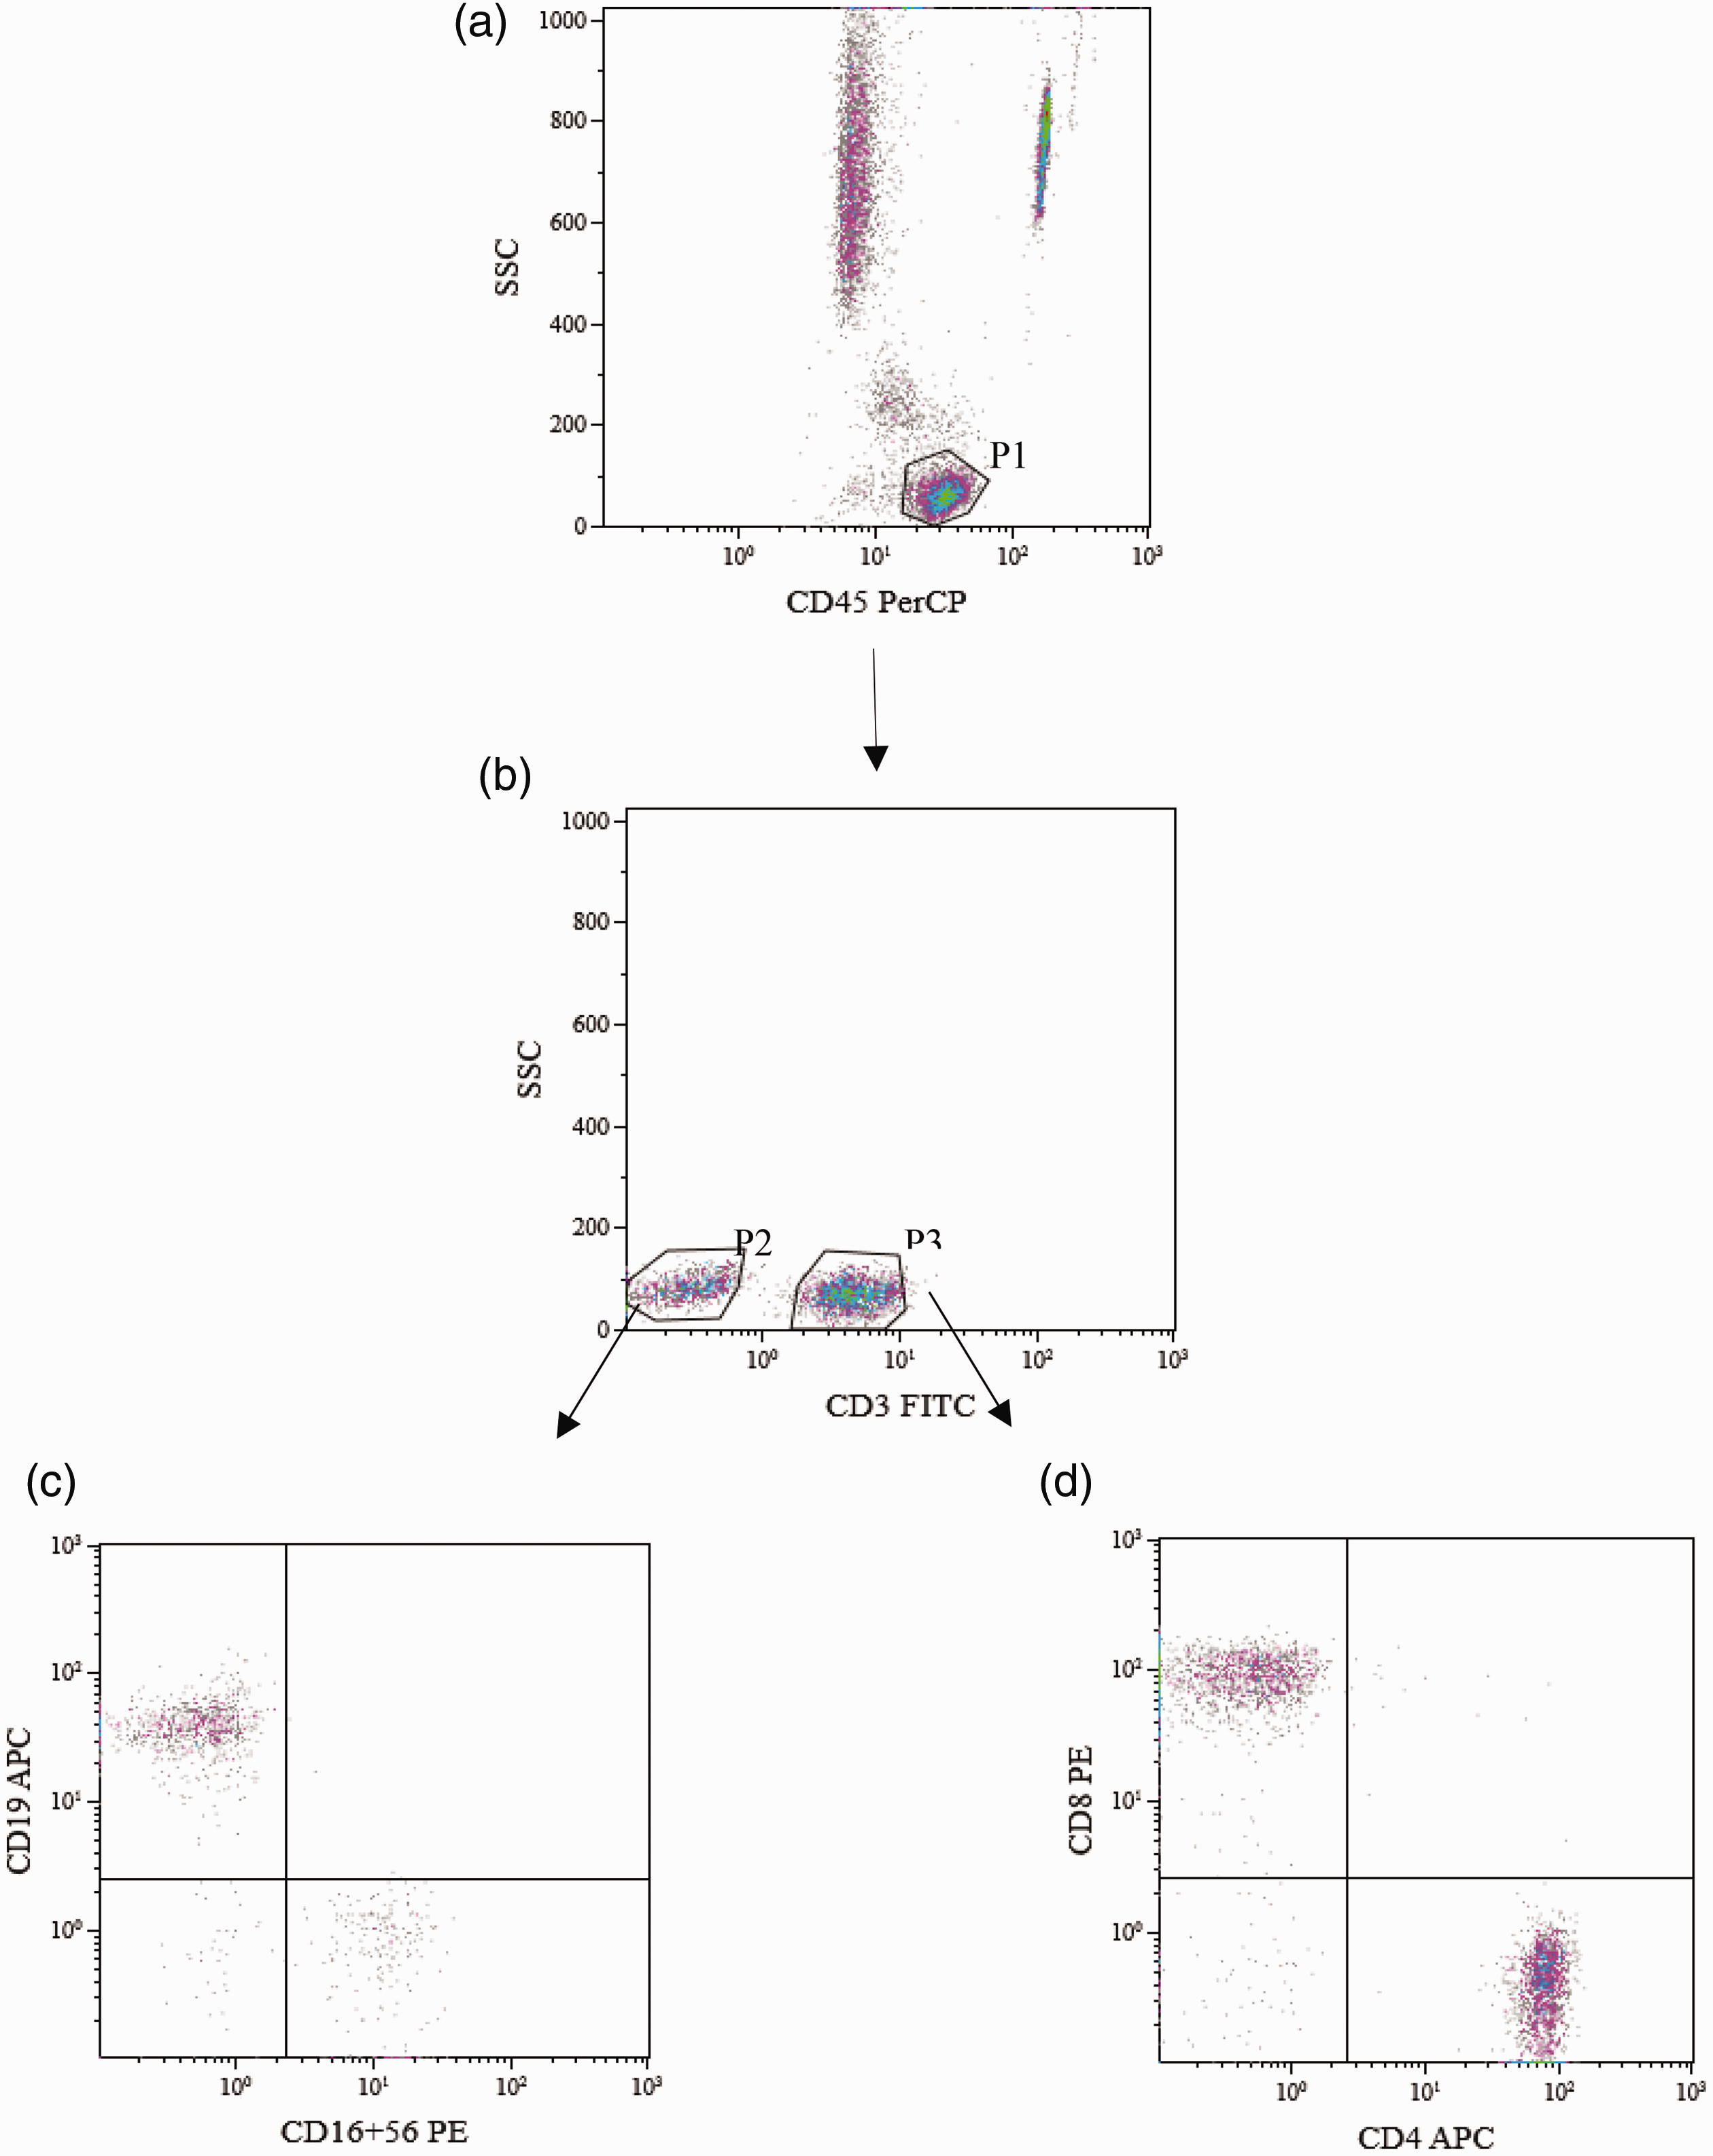
Analysis of peripheral lymphocytes and CD4+ T cell subsets by flow cytometry.

CD4+T cell subsets. Gating strategy for Th1, Th2, Th17 and Treg cells. (a):T cells (CD4+). (b): Th1 (CD4+IFN-γ+). (c): Th2 (CD4+IL-4+). (d): Th17 (CD4+IL-17+). (e): Treg (CD4+CD25+FOXP3+).
Gender-related differences in lymphocytes and CD4+ T cell subsets
To explore the influence of gender on cell subset frequency, data on the 77 males (mean ± SD age: 42.84 ± 12.94 years) and 119 females (mean ± SD age: 43.49±13.82 years) recruited in this study were compared (Table 2). Several parameters differed between men and women. Percentages of CD4+ T cells were higher in females than in males (P = 0.007), while percentages and absolute numbers of CD8+ T cells as well as absolute numbers of NK cells and T+B+NK cells were lower in females than in males (P = 0.01, P = 0.001, P = 0.001, and P = 0.005, respectively). Furthermore, CD4+/CD8+ T cell ratios were lower in men compared with women (P = 0.003). For other lymphocyte subsets, no statistically significant differences were observed between the two groups. Among CD4+ T cell subsets, the percentage of Th1 cells was higher in men than in women (P = 0.041), but numbers of Th2 cells were lower in men compared with women (P = 0.042). No other significant differences in CD4+ T cell subsets were associated with gender.
Reference ranges for absolute counts and percentages of lymphocytes and CD4+ T cell subsets in healthy Han Chinese men and women of the Shanxi district, China.
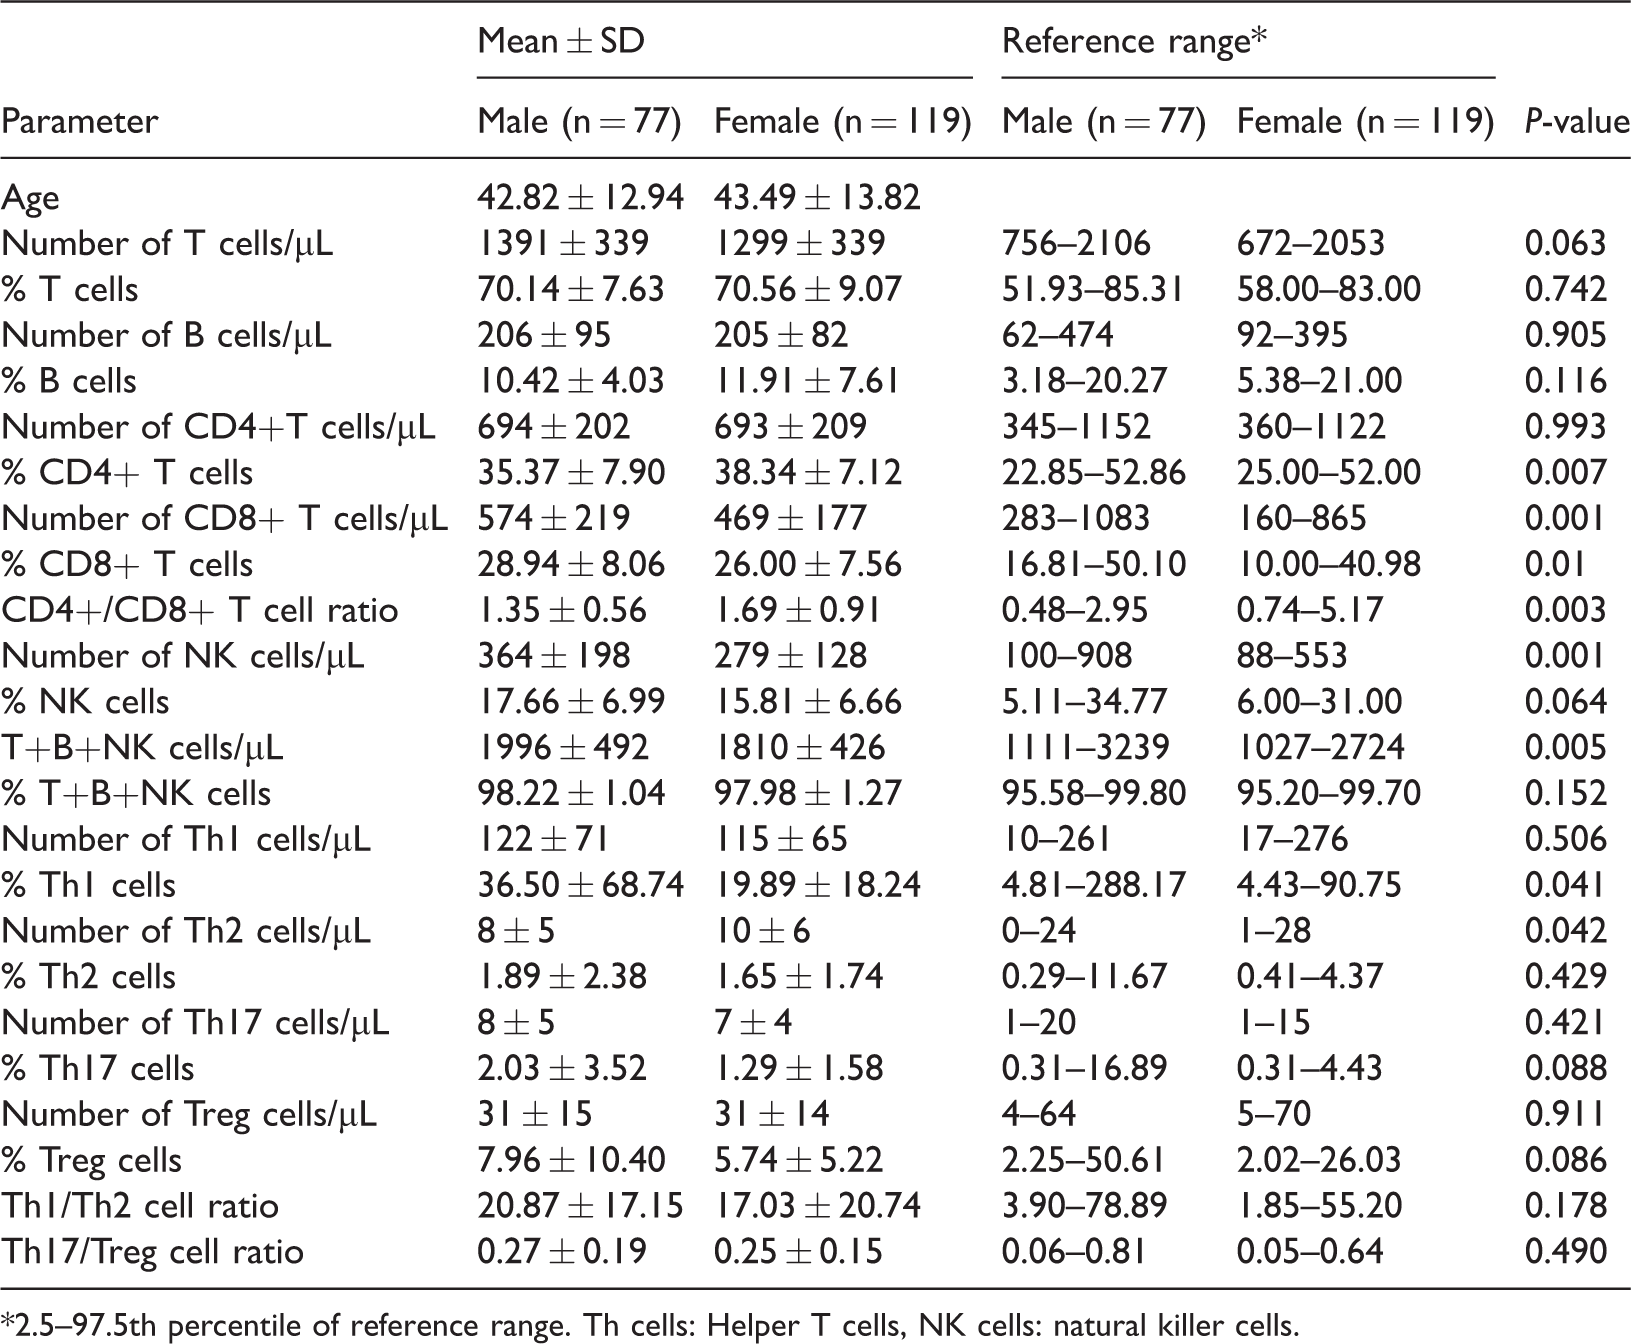
*2.5–97.5th percentile of reference range. Th cells: Helper T cells, NK cells: natural killer cells.
Age-related differences in lymphocytes and CD4+ T cell subsets
To identify age-related differences among cell subsets, we stratified participants into five age groups. Table 3 shows the percentages and absolute numbers of lymphocyte subpopulations for each age group. Significant differences in the percentages of CD4+ T cells, absolute numbers of CD8+ T cells and CD4+/CD8+ T cell ratios were observed among the groups (P < 0.01). We also identified significant differences in absolute numbers of Treg cells and Th17/Treg cell ratios (P < 0.05) between the different age groups.
Distribution of absolute counts and percentages of lymphocytes and CD4+ T cell subsets by age.

Th cells: Helper T cells, NK cells: natural killer cells.
To further assess relationships between age and lymphocyte subset composition, the data were analyzed using Spearman’s correlation coefficients. Frequencies of CD4+ T cells (r = 0.248, P < 0.001) and CD4+/CD8+ T cell ratios (r = 0.218, P = 0.002) were positively correlated with advancing age. By contrast, absolute numbers of T cells (r = −0.182, P = 0.011), CD8+ T cells (r = −0.211, P = 0.003) and T+B+NK cells (r = −0.178, P = 0.013) were negatively correlated with advancing age. Among CD4+ T cell subsets, numbers of Th1 cells (r = 0.147, P = 0.04) and Treg cells (r = 0.193, P = 0.007) were positively correlated with advancing age. Conversely, the proportion of Th2 cells declined with age (r = −0.172, P = 0.016). Consequently, Th1/Th2 cell ratios (r = 0.160, P = 0.025) increased with age, and the Th17/Treg cell ratio (r = −0.206, P = 0.004) decreased with age. No other statistically significant correlations were identified (see Appendix).
Race-related differences in lymphocytes and CD4+ T cell subsets
Because reference intervals for lymphocytes and CD4+ T cell subsets may differ by race, we compared lymphocyte and CD4+ T cell subset reference ranges in diverse racial groups (Table 49–13 and Table 5 14 ). Absolute numbers of CD4+ T cells in Han Chinese individuals of the Shanxi region were lower than those in individuals from Hong Kong, 9 Beijing, 10 Germany 12 and Singapore. 13 The CD4+/CD8+ ratios of Han Chinese individuals of the Shanxi region were similar to those reported in individuals from Beijing 10 and Chongqing 11 but differed from those determined in other districts or countries. The frequencies and absolute numbers of B cells were slightly lower in Han Chinese individuals of the Shanxi region than in individuals from Hong Kong, 9 Germany 12 and Singapore. 13 Compared with individuals in Italy, 14 higher percentages and absolute numbers of Treg cells and lower percentages and absolute numbers of Th17 cells were observed in Han Chinese individuals of the Shanxi region.

NK cells: natural killer cells.
Comparison of CD4+ T cell subset reference ranges in different ethnic groups.

Th cells: Helper T cells.
Discussion
Variation in environmental factors and genetic inheritance can have major effects on standard reference intervals and immunity. To accurately report laboratory test results,15–17 it is necessary to establish sex-, age- and race-specific reference intervals for healthy individuals living in a particular region. In this study, we determined reference ranges of peripheral blood lymphocyte subpopulations and CD4+ T cell subsets in healthy Han Chinese adults in Shanxi Province, North China.
A close connection between different races and lymphocyte subsets has been clearly established. Studies of European and Asian individuals9–13 showed that the frequencies and absolute numbers of T cells, B cells and NK cells differed in some aspects. Compared the data reported in Italy, 14 the percentages and absolute numbers of Treg cells were higher and those of Th17 cells were lower in Han Chinese individuals of the Shanxi region. These findings confirmed that lymphocyte subset composition was distinct across districts and countries. Generally speaking, lymphocyte subgroup reference ranges were distinct among different districts and races, even in different geographical regions of the same country. 18 Laboratory test results and immune status may be influenced by subclinical infections, stress, and nutritional status in specific populations. 19 This further reinforces the importance of establishing local reference ranges to assist clinicians in making meaningful decisions.
The influence of sex on lymphocyte subgroups and CD4+ T cell subpopulations was also analyzed in this study. The absolute number of NK cells was lower in females than in males, in agreement with previous reports.8,9 Compared with women, CD4+/CD8+ T cell ratios were lower in men, consistent with results reported in Korean, 8 Nigerian, 20 Ugandan, 21 and South Floridian populations. 16 Differences in the percentages of CD4+ T cells were unclear in previous studies. Some studies found no differences between the sexes,9,16 while others suggested that the percentage of CD4+ T cells was generally low in males,8,21 in agreement with our study. Our results suggested that the proportion of Th1 cells was significantly lower in woman than in men, but that the absolute number of Th2 cells was increased in women (Table 2). These results contrasted with those of a previous study, which showed no differences in Th cells associated with gender. 14 Different levels of sex hormones may underlie gender differences in lymphocyte subsets. For instance, levels of estrogen were higher in females and estrogen can block early T cell development in the thymus. 22
In this study, we identified relationships between lymphocyte subgroups and age. A positive correlation was identified between the proportion of CD4+T cells and advancing age, while the absolute numbers of T cells and CD8+ T cells were inversely correlated with advancing age. Consequently, CD4+/CD8+ T cell ratios increased with age, in agreement with studies conducted in Beijing and Germany.10,12 Among CD4+ T cells , the numbers of Th1 and Treg cells were increased with age, and as a consequence Th17/Treg cell ratios decreased with age. Significant differences in the numbers of Treg and in Th17/Treg ratios were observed between age groups. However, there were no significant differences observed in another study. 14 The effects of age on lymphocyte subsets and CD4+ T cell subsets are not completely understood. Decreases of T lymphocyte numbers, caused by thymic involution and potential changes in the activity of hematopoietic stem cells, were associated with aging.23,24 In addition, decreased function of the adaptive immune system was associated with aging, which may cause decreased CD8+ T cell numbers with advancing age. 25 Differences in lymphocyte composition among age groups suggested that it was necessary to establish age-specific reference intervals for lymphocytes and CD4+ T cell subsets to accurately interpret laboratory results.
Our study had several limitations. Changes in reference intervals might be due to technical or methodological reasons. For instance, single-platform and dual platform detection methods show different diagnostic parameters. The National Institutes of Health recommends using a single platform instead of the dual platform counting method to reduce differences between different laboratories and to produce more reliable data. 26
Conclusion
We used single-platform flow cytometry to establish reference ranges for lymphocytes and CD4+ T cell subsets among healthy Han Chinese individuals of the Shanxi region. We compared these ranges with the results of previous studies. Differences in the composition of lymphocyte and CD4+ T subpopulations were associated with age, sex and race. Therefore, to aid clinical decision-making, we must establish reference intervals specific to patient subgroups. The results of our study might help to understand illness- or treatment-related changes in lymphocyte populations in the context of transplantation, cancer, infection, autoimmunity and immunodeficiency.
Footnotes
Abbreviations
Th: T helper cells; Ts: suppressor T cells; Treg: regulatory T cells; NK cells: natural killer cells; SD: standard deviation; FITC: fluorescein isothiocyanate; PE: phycoerythrin; APC: allophycocyanin; PerCP: peridinin-chlorophyll protein; EDTA: ethylenediaminetetraacetic acid
Acknowledgements
The authors sincerely thank Chunxue Fan and Rui Fu for help with sample collection.
Declaration of conflicting interest
The authors declare that there is no conflict of interest.
Funding
This work was supported by the Preferential Financed Projects of Shanxi Provincial Human Resources and Social Security Department (2016-97); the Scientific Research Project of the Shanxi Health Planning Committee (201601042); the Scientific Research Foundation for Returned Overseas Scholars of Shanxi Province (2017-116); and the Key Research and Development Project (Guide) of Shanxi Province (201803D421067).