
Abstract
Objective
To identify genes associated with the clinicopathological features of colorectal cancer (CRC).
Methods
Gene expression profiles were downloaded and preprocessed by GEOquery and affy R packages, respectively. The limma package was applied to identify the differentially expressed genes (DEGs) in CRC. Gene Ontology and Kyoto Gene and Genome Encyclopedia (KEGG) pathway enrichment analyses for the DEGs were carried out using the clusterProfiler package. Protein–protein interaction (PPI) and weighted gene co-expression (WGC) networks were constructed using the STRING database and WGCNA package, respectively.
Results
A total of 523 DEGs (283 downregulated and 240 upregulated genes) in CRC tissues were identified. These DEGs were mainly enriched in 111 biological processes, 16 cellular components and 40 molecular functions, such as proteinaceous extracellular matrix, extracellular structure organization and chemokine-mediated signalling pathway. PPI and WGC networks showed that four upregulated genes (KIF2C, CDC45, CEP55 and DTL) were key genes. Subgroup analysis based on individual cancer stages and histological subtypes indicated that the expression of these key genes was upregulated in CRC stages I–IV, adenocarcinoma and mucinous adenocarcinoma.
Conclusions
The study provides new insights into understanding the pathogenesis of CRC. These identified genes may act as potential targets for CRC diagnosis and treatment.
Introduction
Colorectal cancer (CRC) is not only one of the most common malignancies, but also one of the leading causes of cancer-related death. 1 In recent decades, studies that have focused on the diagnosis, prognosis and treatment of CRC have made great progress, but the global burden of CRC is still increasing and more than two million new cases and one million deaths are expected by 2030. 2 Therefore, there is an urgent need to find effective ways to obtain new promising biomarkers and therapeutic targets for CRC.
With the emergence and wide application of microarray and RNA-sequencing technology, more and more gene expression data have been recently generated and deposited in publicly available databases such as Gene Expression Omnibus (GEO) and The Cancer Genome Atlas (TCGA). Reanalysis of these data will contribute to a better understanding of the mechanism of the occurrence and development of diseases; and should lead to the identification of new disease-related molecules. For example, a previous study found several hub genes and pathways related to anaplastic thyroid carcinoma by mining public databases, including the RACGAP1, FEN1, PRC1, TOP2A and TYMS genes, and the phagosome and NF-kappa B signalling pathway. 3 Another study demonstrated that the expression of BTG1 might act as a potential prognostic biomarker for diffuse large B-cell lymphoma via exploring gene expression profiles in the GEO database. 4 Crucial genes such as SLC22A10, CD5L and UROC1 were identified in the development of hepatocellular carcinoma (HCC), especially alcohol-related HCC based on the TCGA and GEO databases. 5
This current study identified the differentially expressed genes (DEGs) between CRC tissues and adjacent normal tissues via analysing microarray data in the GEO database. Integrated analysis of the DEGs based on bioinformatic methods was then undertaken, which aimed to identify the molecular mechanisms involved in CRC occurrence and development and to provide biomarker targets for future research.
Materials and methods
Microarray data
The gene expression profiles of 17 paired CRC and adjacent normal tissues (GSE110224) were obtained from the GEO database (https://www.ncbi.nlm.nih.gov/geo/) using the GEOquery package in R (www.r-project.org). All data were generated based on Affymetrix Human Genome U133 Plus 2.0 Array (GPL570). 6 Raw data were preprocessed by the affy R package with Robust Multichip Averaging (RMA) algorithm. The probeset IDs were converted into gene symbols using the annotation package hgu133plus2.db. If multiple probesets corresponded to the same gene, the mean value of those probesets expression was used.
Identification of the DEGs in CRC
The limma package of R (www.r-project.org) was used to identify the DEGs in CRC. 7 The t-test and Benjamini–Hochberg method were used to calculate the P-value and false discovery rate, respectively. The DEGs were defined according to an adjusted P-value (adj.P.Val) < 0.05 and |logFC| > 1.
GO and KEGG pathway enrichment analyses
To further evaluate the functions of the DEGs and understand the biological processes (BPs), cellular components (CCs), molecular functions (MFs) and pathways closely related to CRC, the clusterProfiler package in R (www.r-project.org) was used to identify and visualize gene ontology (GO) terms and Kyoto Gene and Genome Encyclopedia (KEGG) pathways enriched by the DEGs. 8 The adj.P.Val <0.05 was set as the significant enrichment.
Construction of biological networks of the DEGs
In order to identify key genes involved in CRC, the protein–protein interaction (PPI) and weighted gene co-expression (WGC) networks of the DEGs were constructed by STRING database (www.string-db.org) and weighted gene co-expression network analysis (WGCNA) R package, 9 respectively. The minimum required interaction score in the PPI network was set as 0.7. In the WGC network, the soft-threshold power and the minimum threshold of interaction weight were set as 12 and 0.6, respectively. Subsequently, biological networks were visualized using Cytoscape software (https://cytoscape.org/). In the WGC network, the modules associated with colorectal cancer were identified by the MCODE plugin. 10 The key nodes (proteins/genes) in each biological network were selected based on degree centrality. The nodes with degree >23 and >6 were defined as key nodes in the PPI network and WGC network, respectively. Key nodes that overlapped in the two networks were screened out as key genes using a Venn diagram.
Validation of the expression levels of key genes
To validate the expression levels of key genes, a gene expression profiling interactive analysis (GEPIA) tool (http://gepia.cancer-pku.cn/) was used to explore the related data in TCGA and Genotype-Tissue Expression databases, and to analyse the expression levels of key genes in CRC tissues compared with normal tissues. 11 Furthermore, the UALCAN tool (http://ualcan.path.uab.edu/) was used to assess the expression of key genes in CRC based on individual cancer stages and histological subtypes. 12 A P-value < 0.05 was considered as statistically significant.
Results
There were 523 DEGs in CRC tissues, including 240 upregulated and 283 downregulated genes (Figure 1). The MMP3, REG1A, FOXQ1, CXCL11 and MMP7 genes were the top five upregulated genes; and the GCG, CA4, AQP8, MS4A12 and CLCA4 genes were the top five downregulated genes (Table 1).

Volcano plots showing the upregulated and downregulated genes in colorectal cancer tissues. Blue dots represent significant mRNAs with an adjusted P-value < 0.05 and |logFC| > 1. Red dots represent nonsignificant genes. The colour version of this figure is available at: http://imr.sagepub.com.
The top five upregulated and downregulated genes in colorectal cancer tissues compared with adjacent normal tissues.

The GO analysis showed that these DEGs were significantly enriched in 111 BPs, 16 CCs and 40 MFs. The top five enriched CCs were proteinaceous extracellular matrix, extracellular matrix, microvillus membrane, apical part of the cell and endoplasmic reticulum lumen (Figure 2a). The top five enriched BPs were extracellular matrix organization, chemokine-mediated signalling pathway, positive regulation of response to external stimulus, extracellular structure organization and leukocyte chemotaxis (Figure 2b). The top five enriched MFs were cytokine activity, receptor ligand activity, CXCR chemokine receptor binding, chemokine activity and chemokine receptor binding (Figure 2c). Furthermore, KEGG pathway enrichment analysis indicated that these DEGs were mainly involved in cytokine–cytokine receptor interaction, interleukin (IL)-17 signalling pathway, bile secretion, nitrogen metabolism and chemokine signalling pathway (Figure 2d).
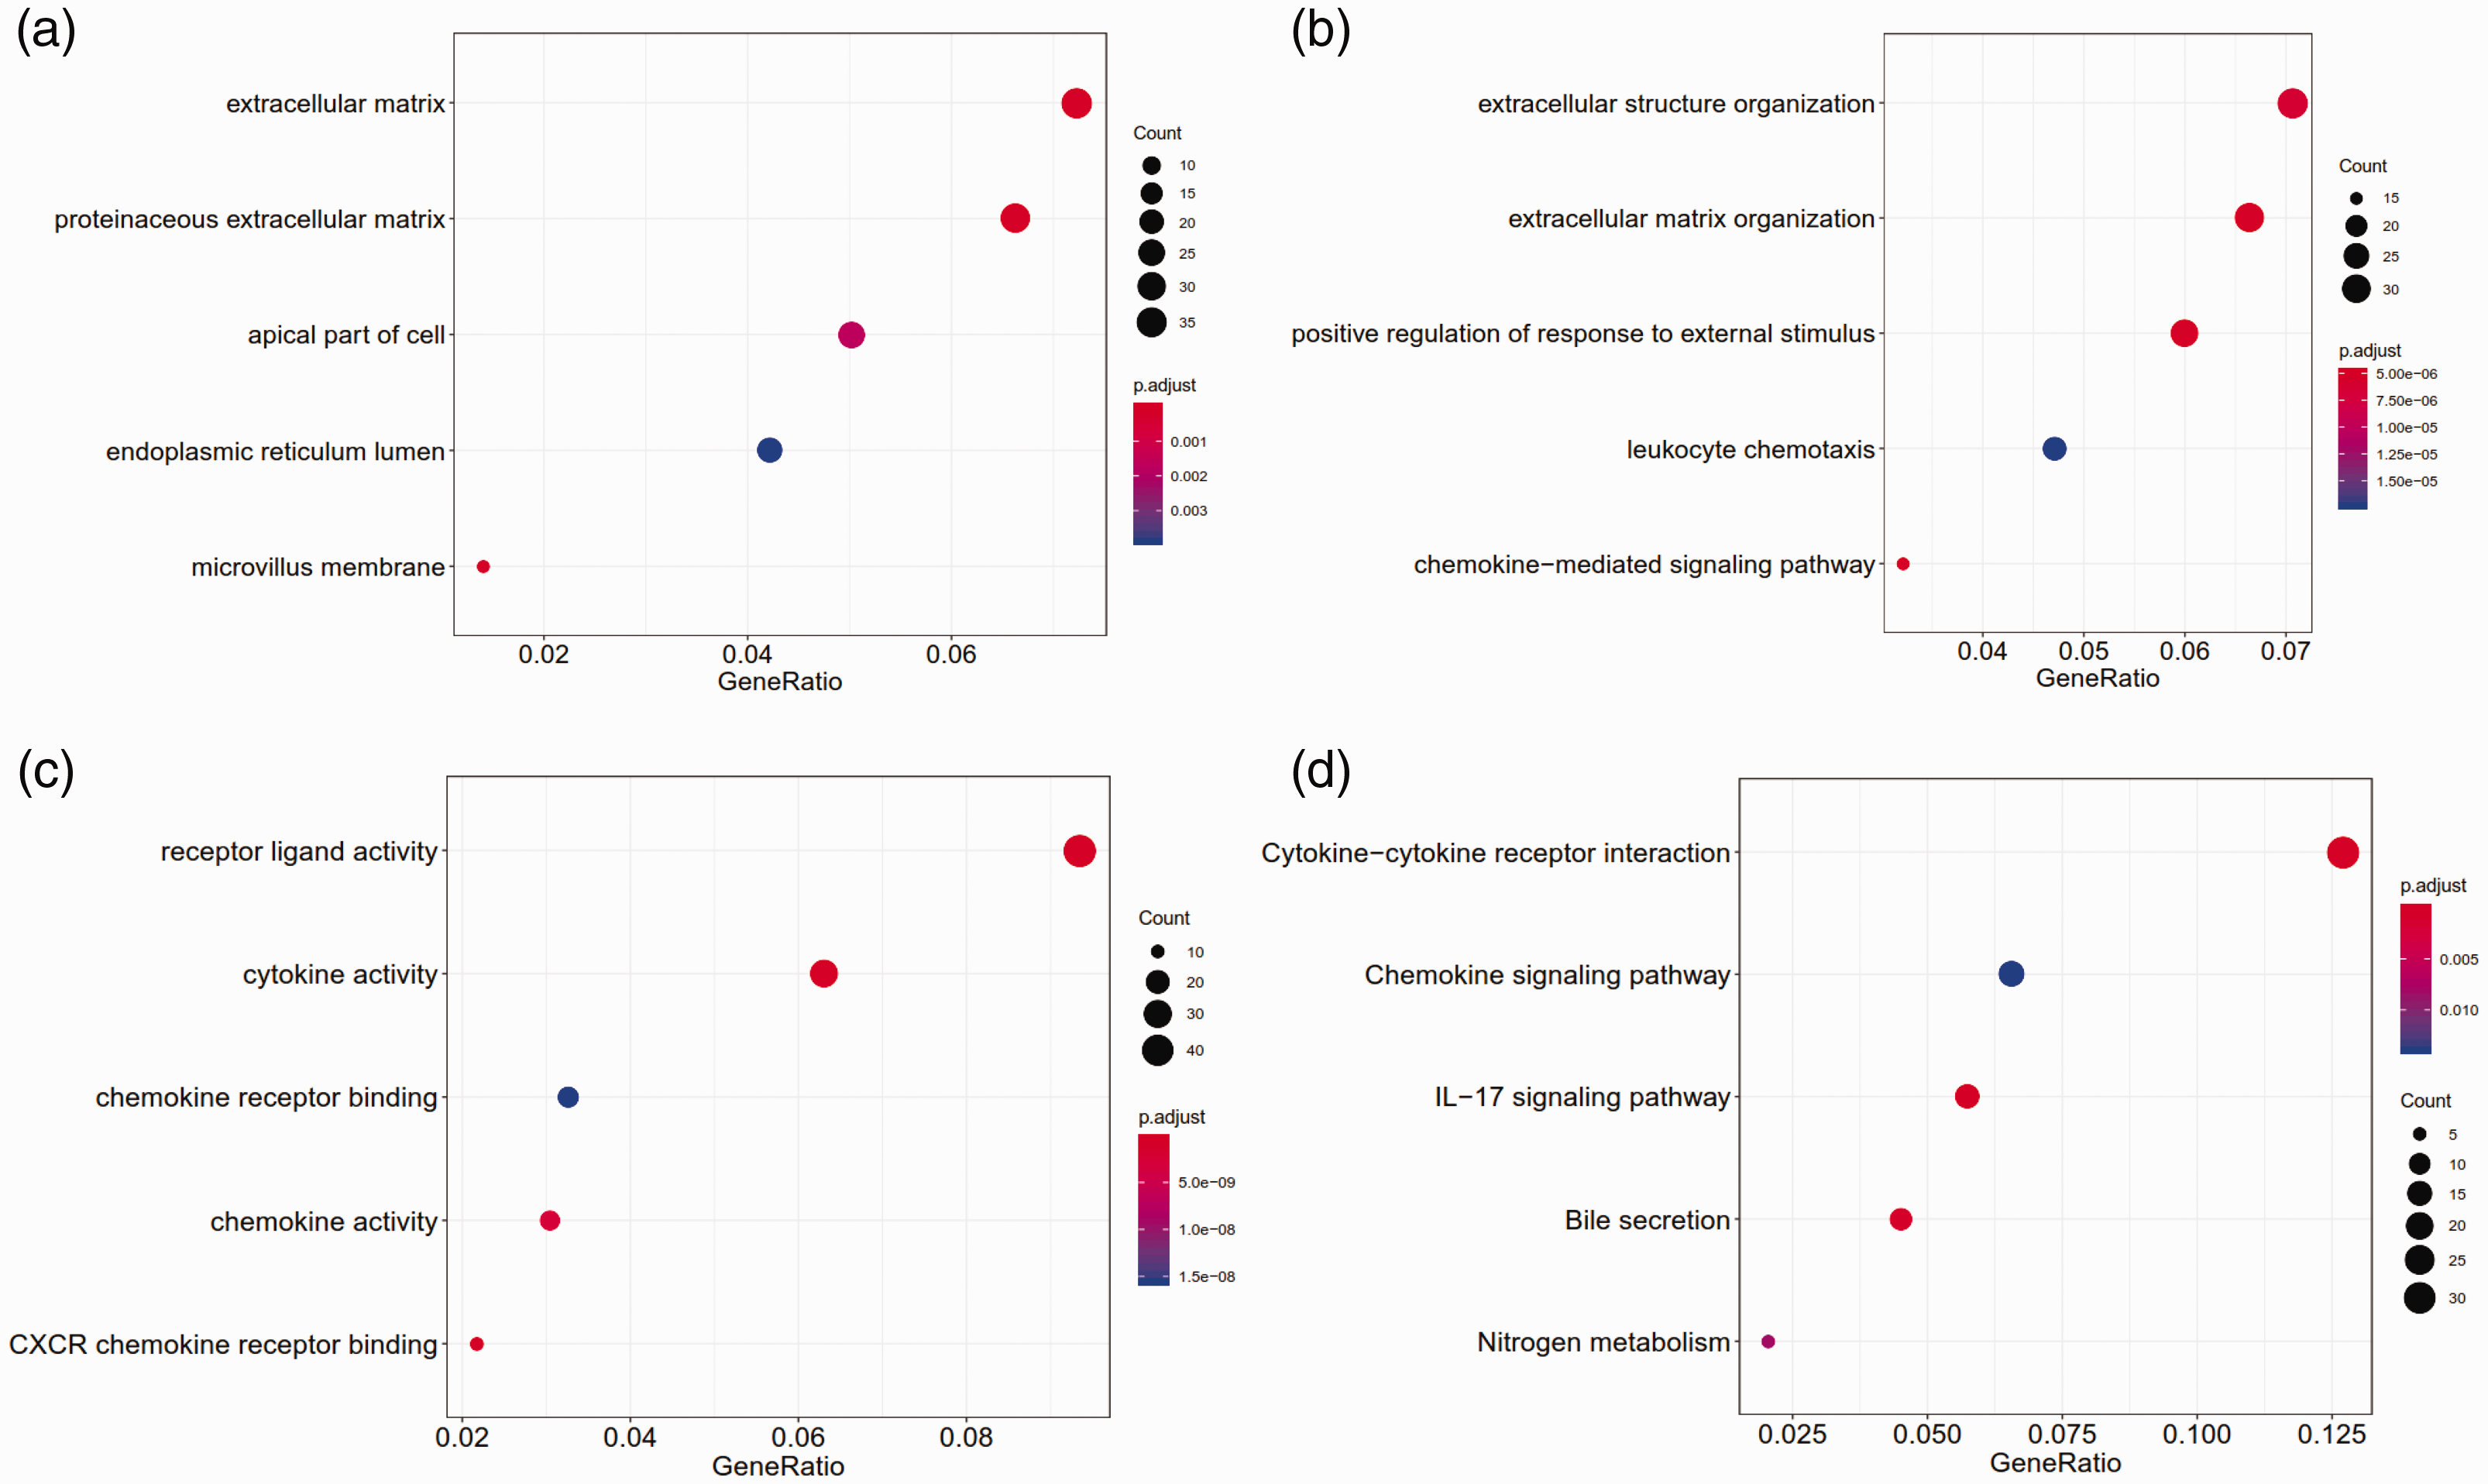
The top five gene ontology terms and Kyoto Gene and Genome Encyclopedia (KEGG) pathways enriched by the differentially expressed genes: (a) cellular components; (b) biological processes; (c) molecular functions; (d) KEGG pathways. IL-17, interleukin-17. The colour version of this figure is available at: http://imr.sagepub.com.
The WGC network showed 95 nodes and 161 edges (Figure 3a). Eight modules associated with colorectal cancer were identified in the WGC network (Table 2). SCN7A, C2orf40, KIF2C, MCM10, KIF18A, CDC45, UHRF1, MAMDC2, PLP1, CEP55, FHL1, NEGR1, CDCA5, DTL and C7 were hub genes in the WGC network. Meanwhile, a PPI network of the DEGs was also constructed based on the STRING database. As shown in Figure 3b, a total of 247 nodes and 898 edges were mapped in the PPI network. The hub genes selected from the PPI network included CXCL8, FPR2, CCNB1, KIF2C, TPX2, CXCL1, KIF20A, DLGAP5, NCAPG, RRM2, UBE2C, EXO1, CDC45, CXCL10, DTL, PF4, SST and CEP55. Subsequently, the Venn diagram showed that KIF2C, CDC45, CEP55 and DTL were the key genes that overlapped in the two networks (Figure 3c).

Biological networks and Venn diagram of the differentially expressed genes: (a) protein–protein interaction network; (b) the weighted gene co-expression network; (c) Venn diagram of key nodes that overlapped in two biological networks. The colour version of this figure is available at: http://imr.sagepub.com.
Identification of modules associated with colorectal cancer in the weighted gene co-expression network.

The GEPIA tool was applied to confirm the expression levels of key genes (KIF2C, CDC45, CEP55 and DTL) in CRC. The results showed that KIF2C, CDC45, CEP55 and DTL genes were significantly upregulated in CRC tissues compared with normal tissues, which was consistent with the microarray results (Figure 4). Further subgroup analysis based on individual cancer stages showed that the expression of these key genes was upregulated in CRC stages I–IV compared with normal tissues (Figure 5). Subgroup analysis based on histological subtypes indicated that the expression of these key genes was upregulated in adenocarcinoma and mucinous adenocarcinoma compared with normal tissues (Figure 6). Subgroup analysis based on sex showed that the expression of these key genes was upregulated in tumour tissues of male and female patients with CRC compared with normal tissues (Figure 7). Subgroup analysis based on age showed that the expression of the CDC45 and CEP55 genes was not significantly upregulated in tumour tissues of patients with rectum adenocarcinoma in the 21–40 years age group compared with normal tissues (Figure 8).
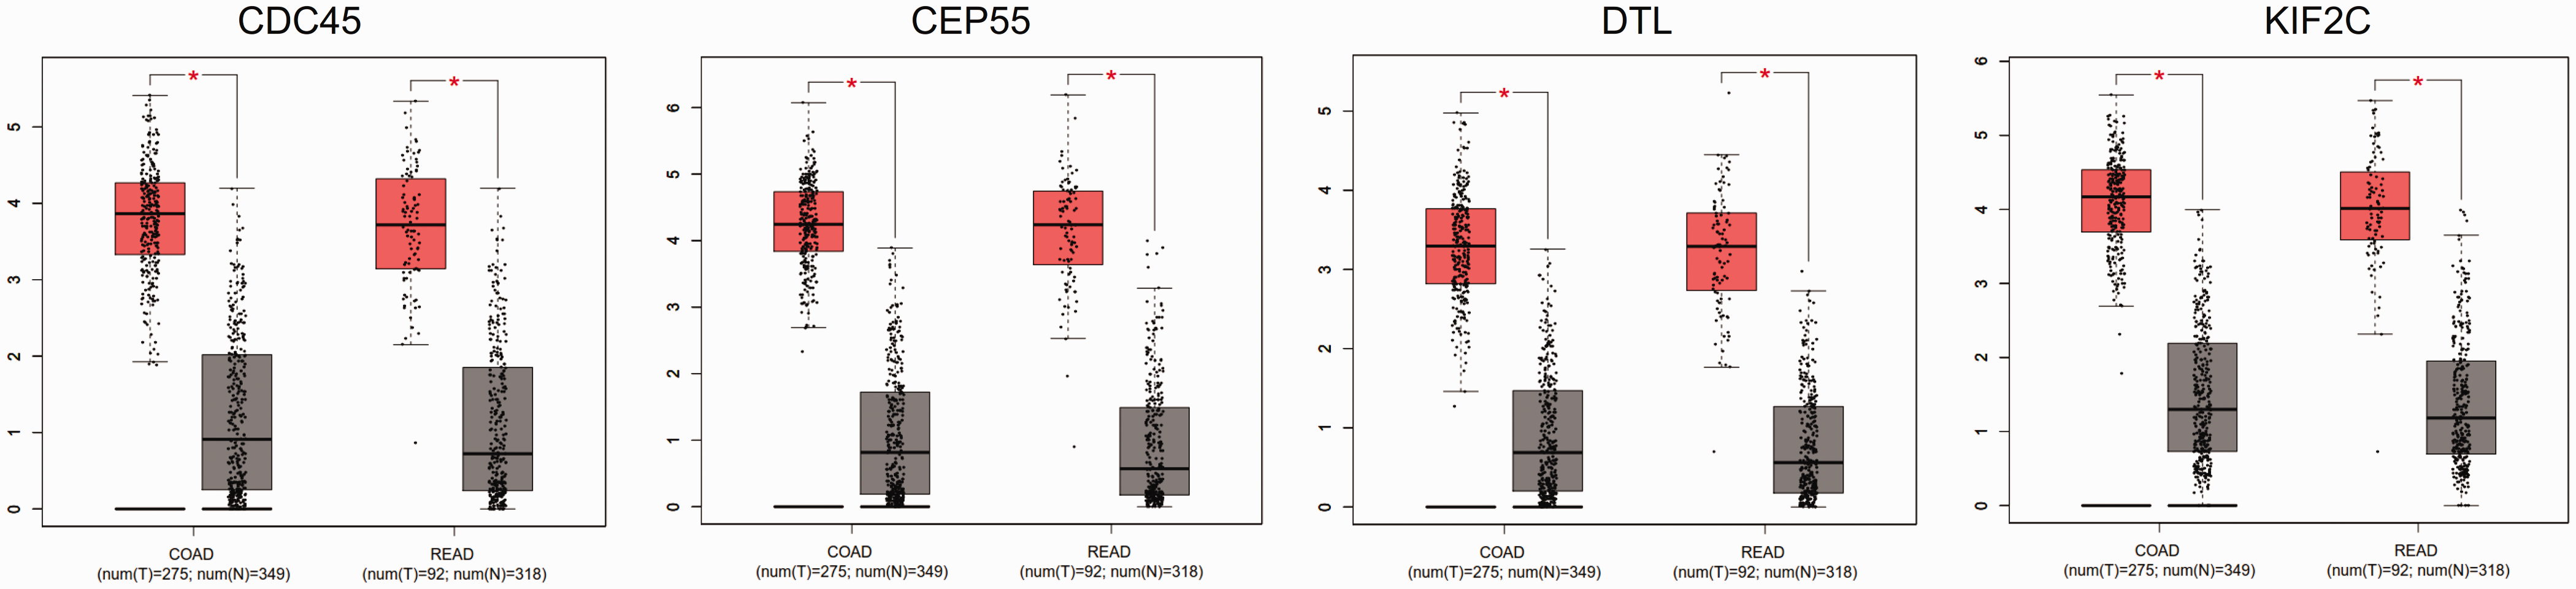
The expression of key genes in colorectal cancer and normal tissues. COAD, colon adenocarcinoma; READ, rectum adenocarcinoma. The pink and grey colours indicate tumour and normal tissues, respectively. *P < 0.01; t-test. The central black horizontal line is the median; the extremities of the box are the 25th and 75th percentiles; and the error bars represent the minimum and maximum outliers. The colour version of this figure is available at: http://imr.sagepub.com.

The expression of key genes in colorectal cancer based on individual cancer stages. COAD, colon adenocarcinoma; READ, rectum adenocarcinoma. *P < 0.01, **P < 0.001, ***P < 0.0001, ****P < 0.00001 compared with the normal tissue; t-test. The central black horizontal line is the median; the extremities of the box are the 25th and 75th percentiles; and the error bars represent the minimum and maximum outliers. The colour version of this figure is available at: http://imr.sagepub.com.
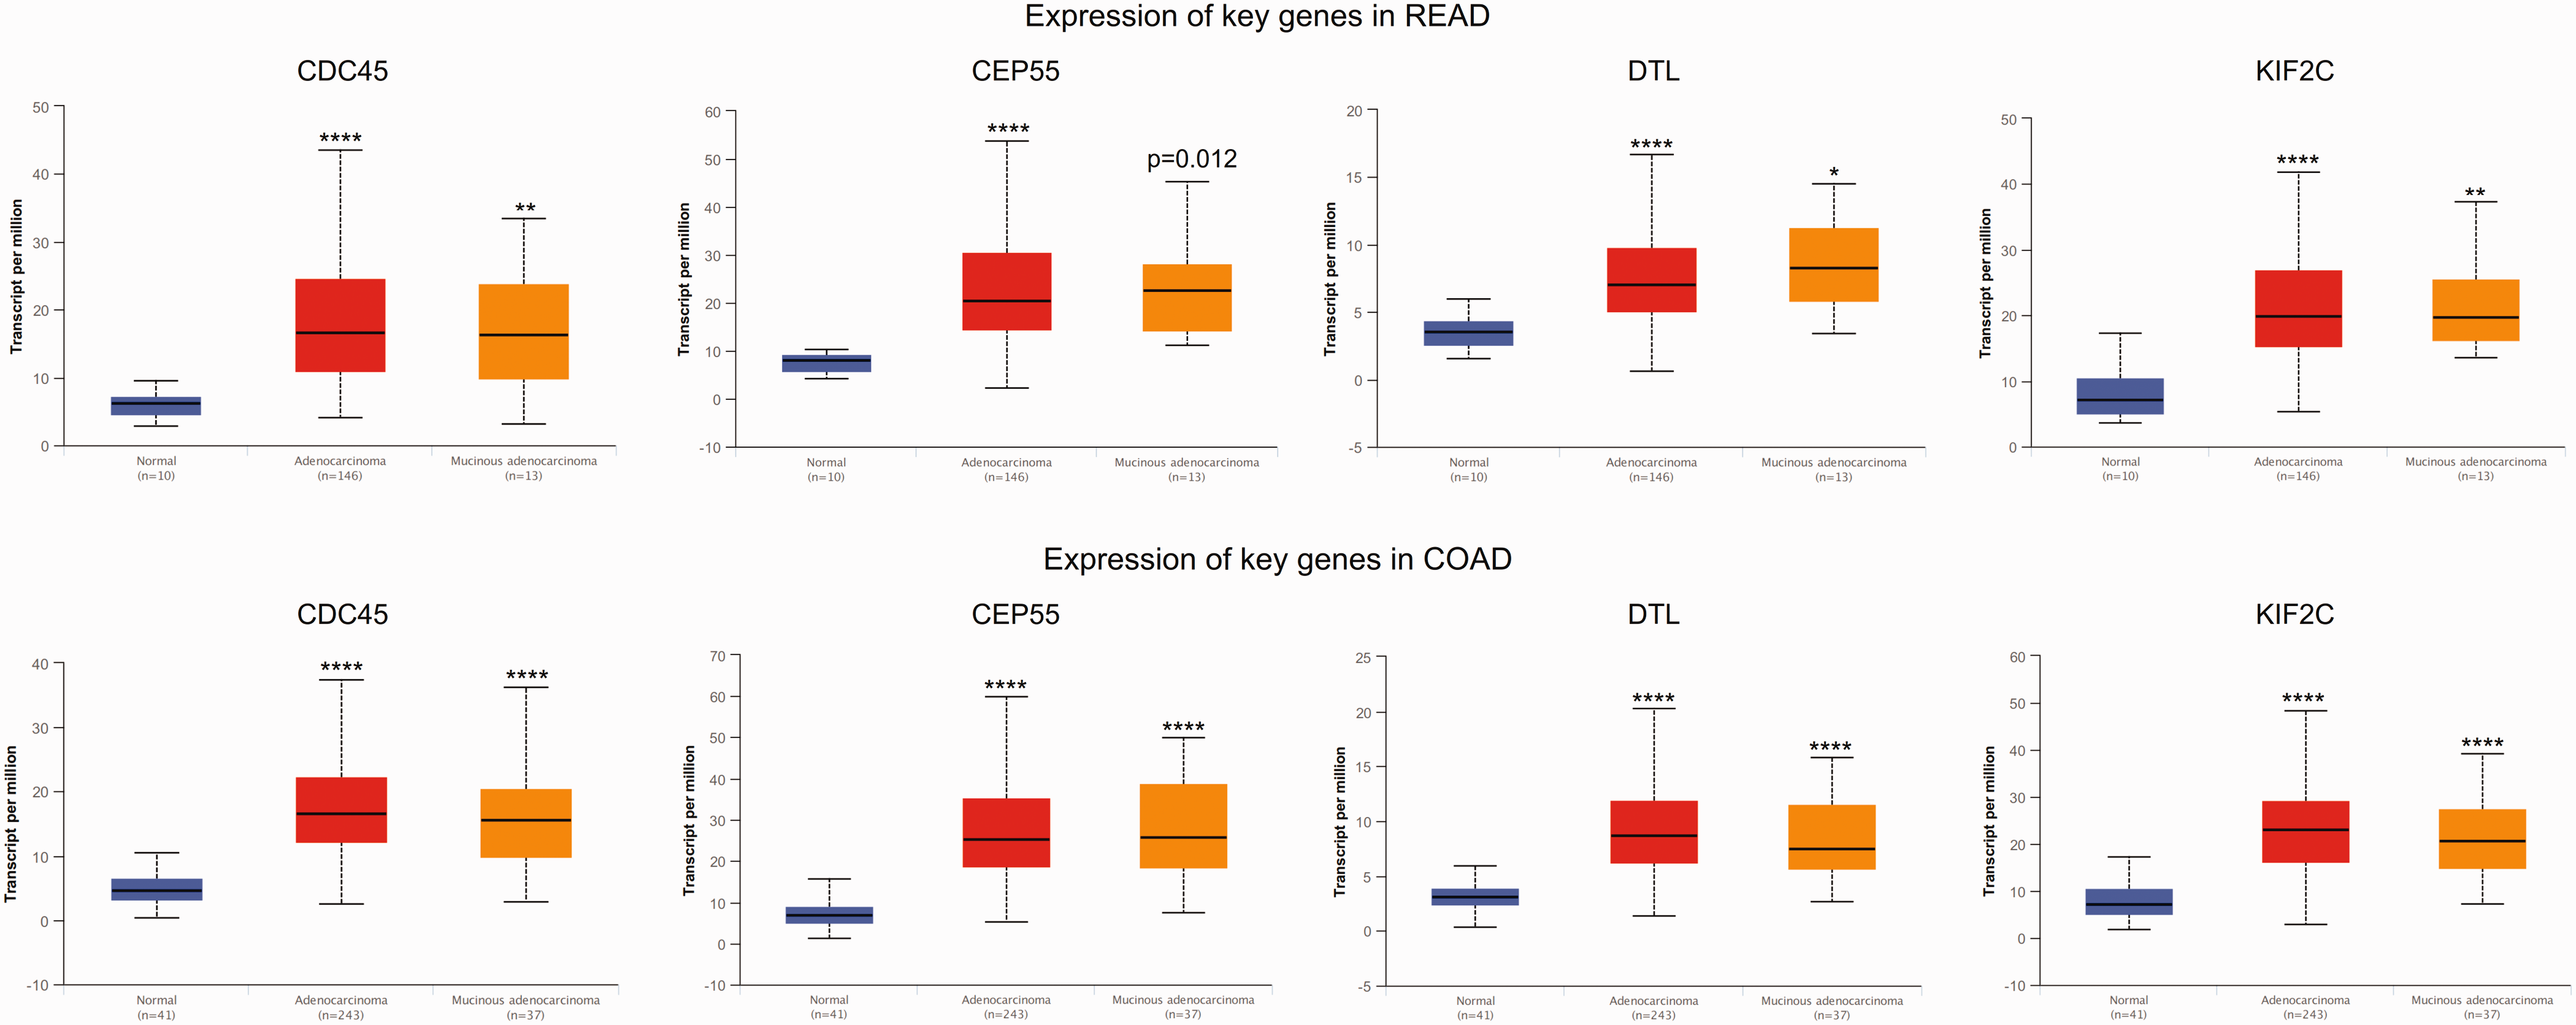
The expression of key genes in colorectal cancer based on histological subtypes. COAD, colon adenocarcinoma; READ, rectum adenocarcinoma. *P < 0.01, **P < 0.001, ***P < 0.0001, ****P < 0.00001 compared with the normal tissue; t-test. The central black horizontal line is the median; the extremities of the box are the 25th and 75th percentiles; and the error bars represent the minimum and maximum outliers. The colour version of this figure is available at: http://imr.sagepub.com.

The expression of key genes in colorectal cancer based on sex. COAD, colon adenocarcinoma; READ, rectum adenocarcinoma. *P < 0.01, **P < 0.001, ***P < 0.0001, ****P < 0.00001 compared with the normal tissue; t-test. The central black horizontal line is the median; the extremities of the box are the 25th and 75th percentiles; and the error bars represent the minimum and maximum outliers. The colour version of this figure is available at: http://imr.sagepub.com.

The expression of key genes in colorectal cancer based on age. COAD, colon adenocarcinoma; READ, rectum adenocarcinoma. *P < 0.01, **P < 0.001, ***P < 0.0001, ****P < 0.00001 compared with the normal tissue; t-test. The central black horizontal line is the median; the extremities of the box are the 25th and 75th percentiles; and the error bars represent the minimum and maximum outliers. The colour version of this figure is available at: http://imr.sagepub.com.
Discussion
The present study investigated the DEGs in CRC based on 17 paired CRC and adjacent normal tissues from the GSE110224 dataset and found 523 DEGs, including 240 upregulated and 283 downregulated genes in CRC. Enrichment analyses indicated that these DEGs were significantly enriched in 111 BPs, 16 CCs and 40 MFs, such as proteinaceous extracellular matrix, leukocyte chemotaxis, cytokine activity and the chemokine signalling and IL-17 signalling pathways. Biological networks of the DEGs showed that the KIF2C, CDC45, CEP55 and DTL genes were located in the hub of the PPI and WGC networks, suggesting that these nodes might play a crucial role in the occurrence and development of CRC.
The KIF2C gene is located on chromosome 1p34.1 and encodes a kinesin-like protein that serves as a microtubule-dependent molecular motor.13,14 The encoded protein depolymerizes microtubules at the plus end and promotes mitotic chromosome segregation.15,16 The expression levels of KIF2C was associated with progression and prognosis of cancer patients. For example, a study found that KIF2C overexpression was significantly related to poor prognosis of patients with HCC. 17 Another study demonstrated that the expression level of KIF2C in glioma samples was significantly higher than that in normal brain tissues. 18 In addition, KIF2C expression was related to histopathological grade of the glioma and could serve as a potential independent prognostic factor. 18 These current findings showed that KIF2C was significantly upregulated in CRC tissues, including cancer stages I–IV. The protein encoded by the CDC45 gene was identified based on its similarity with Saccharomyces cerevisiae Cdc45, which is an essential protein required for the initiation of DNA replication. 19 The CDC45 gene had been shown to promote papillary thyroid cancer (PTC) progression via regulating cell cycle. 20 The current results suggested that CDC45 expression was upregulated in CRC tissues, suggesting that this gene might act as a novel biomarker and therapeutic target for both PTC and CRC. 20 CEP55 is an important centrosomal protein involved in midbody formation during cytokinesis. 21 The knockdown of CEP55 markedly inhibited proliferation and induced apoptosis of lung cancer (LC) cells. 22 Furthermore, high expression of CEP55 was associated with advanced T and N staging of LC. 23 Another study found that CEP55 could enhance the proliferation and invasive ability of tumour cells via the AKT signalling pathway in osteosarcoma. 24 The knockdown of the CEP55 gene suppressed the proliferation of glioma cells, whereas CEP55 overexpression induced proliferation of the cells. 25 Furthermore, this current study demonstrated that CEP55 expression was higher in CRC tissues when compared with adjacent normal tissues. DTL is an oncogenic gene identified in amplified region (chromosome 1q32) of several cancers.26,27 DTL knockdown inhibited the biological behaviour of gastric cancer cells in a TP53 mutation-independent manner. 27 The overexpression of DTL significantly promoted lymphatic invasion, cancer depth and recurrence rate in gastric cancer. 27 Patients with DTL-overexpressing gastric cancer had a poorer survival than those with non-expressing cancers. 27 DTL expression was frequently upregulated in aggressive HCC and correlated positively with tumour grade and poor survival of patients. 28 A previous study demonstrated that targeting DTL induced cell cycle arrest and inhibited cell growth and colony formation through TPX2 suppression in HCC. 29 To the best of our knowledge, the role of DTL in CRC remains unknown. The current study showed that DTL expression was upregulated in CRC tissues, including adenocarcinoma and mucinous adenocarcinoma compared with normal tissues.
In conclusion, the present study identified a series of CRC-related genes and pathways using bioinformatics analysis. Among them, the expression of the KIF2C, CDC45, CEP55 and DTL genes was upregulated in CRC stages I–IV, adenocarcinoma and mucinous adenocarcinoma. These CRC-related genes might act as novel diagnostic biomarkers for CRC. However, more experimental studies are needed to explore the function of these genes in CRC.