
Abstract
Objective
This investigation was performed to calculate radiomorphometric indices in panoramic radiographs and identify possible relationships between these indices and sex, age, and body mass index of patients in Saudi and non-Saudi populations.
Methods
In total, 955 panoramic radiographs were reconstructed from cone-beam computed tomography volumes of 133 male and 167 female patients (age range, 20–75 years; mean age ±standard deviation, 50.8 ± 8.9 years). Three panoramic indicators were calculated for Saudi and non-Saudi participants according to sex and age: the mental index (MI), panoramic mandibular index (PMI), and antegonial index (AGI).
Results
The MI and AGI were significantly different between the two sexes, and the MI was significantly different between the Saudi and non-Saudi participants. Patients aged 20 to 40 years showed a significantly larger MI, PMI, and AGI than patients aged 40 to 60 years and patients aged >60 years.
Conclusion
The findings of the present study revealed that the MI, PMI, and AGI were significantly different between the two sexes, among various age groups, and between Saudi and non-Saudi participants.
Keywords
Introduction
Osteoporosis is a prominent condition among the most pervasive conditions that debilitate bones and is thus a noteworthy public health issue. Osteoporosis is characterized by fragile, weak bones that are prone to fracture. Unfortunately, it is a silent disease and is often diagnosed only when a minor fall causes wrist or hip fracture. 1 After menopause, women tend to gradually lose bone mineral density (BMD) with a consequent increased fracture risk. 2
The absence of dental caries or periodontal disease is uncommon after the age of 40 years, and dentists tend to take panoramic radiographs for patients of this age. Panoramic radiographs play a vital role in the diagnosis of osteoporosis, especially among postmenopausal women. 3 Dual-energy X-ray absorptiometry is regarded as the gold standard radiographic technique with which to diagnose osteoporosis because it is highly reliable and accurate. However, it is not practical to screen all women above 40 years of age for osteoporosis. In contrast to panoramic radiography, dual-energy X-ray absorptiometry is not available for every patient, is associated with higher exposure to radiation, and costs more. 4
Previous investigations have established a strong association between panoramic indices and osteoporosis and have pointed out the importance of tracing panoramic radiographs as a routine dental practice. 4 Some researchers5–7 have considered panoramic radiography a reliable tool for osteoporosis screening. However, other researchers have recommended that panoramic radiographs should not be used to assess osteoporosis.8,9 This controversy in the literature makes further research necessary to reach undisputed conclusions regarding the role of panoramic radiography in osteoporosis assessment.
Previous researchers have also studied the significance of analyzing panoramic indices and BMD values to identify osteoporosis.3,10–12 Assessment of the cortical bone width and porosity on panoramic radiographs has been suggested for evaluation of osteoporosis. 10 Parameters such as sex and age were also suggested as determinants of individual bone quality. Lower values of panoramic indices have been demonstrated among women after 40 years of age.10,11 Age has also been shown to be related to bone quality among men. 3 However, the literature does not include studies on the role of the body mass index (BMI) as a determinant of bone quality when panoramic radiography is used to evaluate osteoporosis among different sexes and age groups. Furthermore, no studies in this regard have been conducted among the Saudi population. Therefore, we designed a study to cast more light on this issue and to attempt to resolve the controversy regarding the rule of panoramic radiography in osteoporosis assessment.
The present study was performed to evaluate radiomorphometric indices in panoramic radiographs and identify possible correlations between these indices and patients’ sex, age, and BMI in Saudi and non-Saudi populations. The null hypothesis was that radiomorphometric indices in panoramic radiographs are not different between Saudi and non-Saudi populations and have no correlations with sex, age, or BMI.
Materials and methods
Ethical approval for the present study was obtained by the Bioethical Committee, Jouf University, KSA. Each participant was provided with an explanation of the study, and written informed consent was obtained from all participants before inclusion in this study.
Saudi and non-Saudi men and women who attended the dental clinics at the College of Dentistry, Jouf University, KSA and were indicated for cone-beam computed tomography (CBCT) were randomly selected. The study was conducted from January 2018 to January 2019.
The inclusion criteria for this study were the presence of teeth in the area of measurement, the absence of disease or local pathology that might affect the CBCT results in the areas of interest (e.g., a dental abscess, bone cyst, periodontal disease, malignancy, chemotherapy, or radiotherapy), no history of mandibular fracture, no history of orthodontic therapy or orthognathic surgery, and no impacted teeth, remaining roots, or irregular bone morphology at the measured sites. Any participant who did not meet the above-mentioned criteria was not included in this study.
All participants’ medical and dental histories were assessed. Age, sex, nationality, weight, and height were documented for all participants. CBCT examinations were then performed for each participant using a Scanora 3D machine (Soredex, Tuusula, Finland) at 6 mA and 89 kVp. The scans were evaluated using specialized computer software (NewTom 3G: NNT, QR SRL; Scanora 3D: OnDemand®, Cypermed Inc., Irvine, CA, USA). For standardization, only high-quality panoramic images were obtained directly from the Scanora 3D: OnDemand® because it is among the options available. Three radiomorphometric indices (mental index [MI], panoramic mandibular index [PMI], and antegonial index [AGI]) were then measured bilaterally on all panoramic radiographic images with the aid of the software tools of the accompanying software program. The measurements were performed by two qualified and experienced radiologists as explained below.
For measurement of the MI, a line was plotted parallel to the lower mandibular border and another line was plotted parallel to the superior border of the mental foramen; the lower mandibular cortical bone width was then measured at that level (width A in Figure 1). The PMI was calculated as the ratio of the inferior mandibular cortex width to the distance between the inferior border of the mandible to the inferior border of the mental foremen (i.e., PMI = B/C in Figure 1). For measurement of the AGI, a line was drawn parallel to the ascending mandibular ramus (best fit), and another line was drawn parallel to the mandible corpus. At the point of a bisecting third line, the cortical width was measured (width D in Figure 1). The accuracy of this technique was confirmed previously. 13
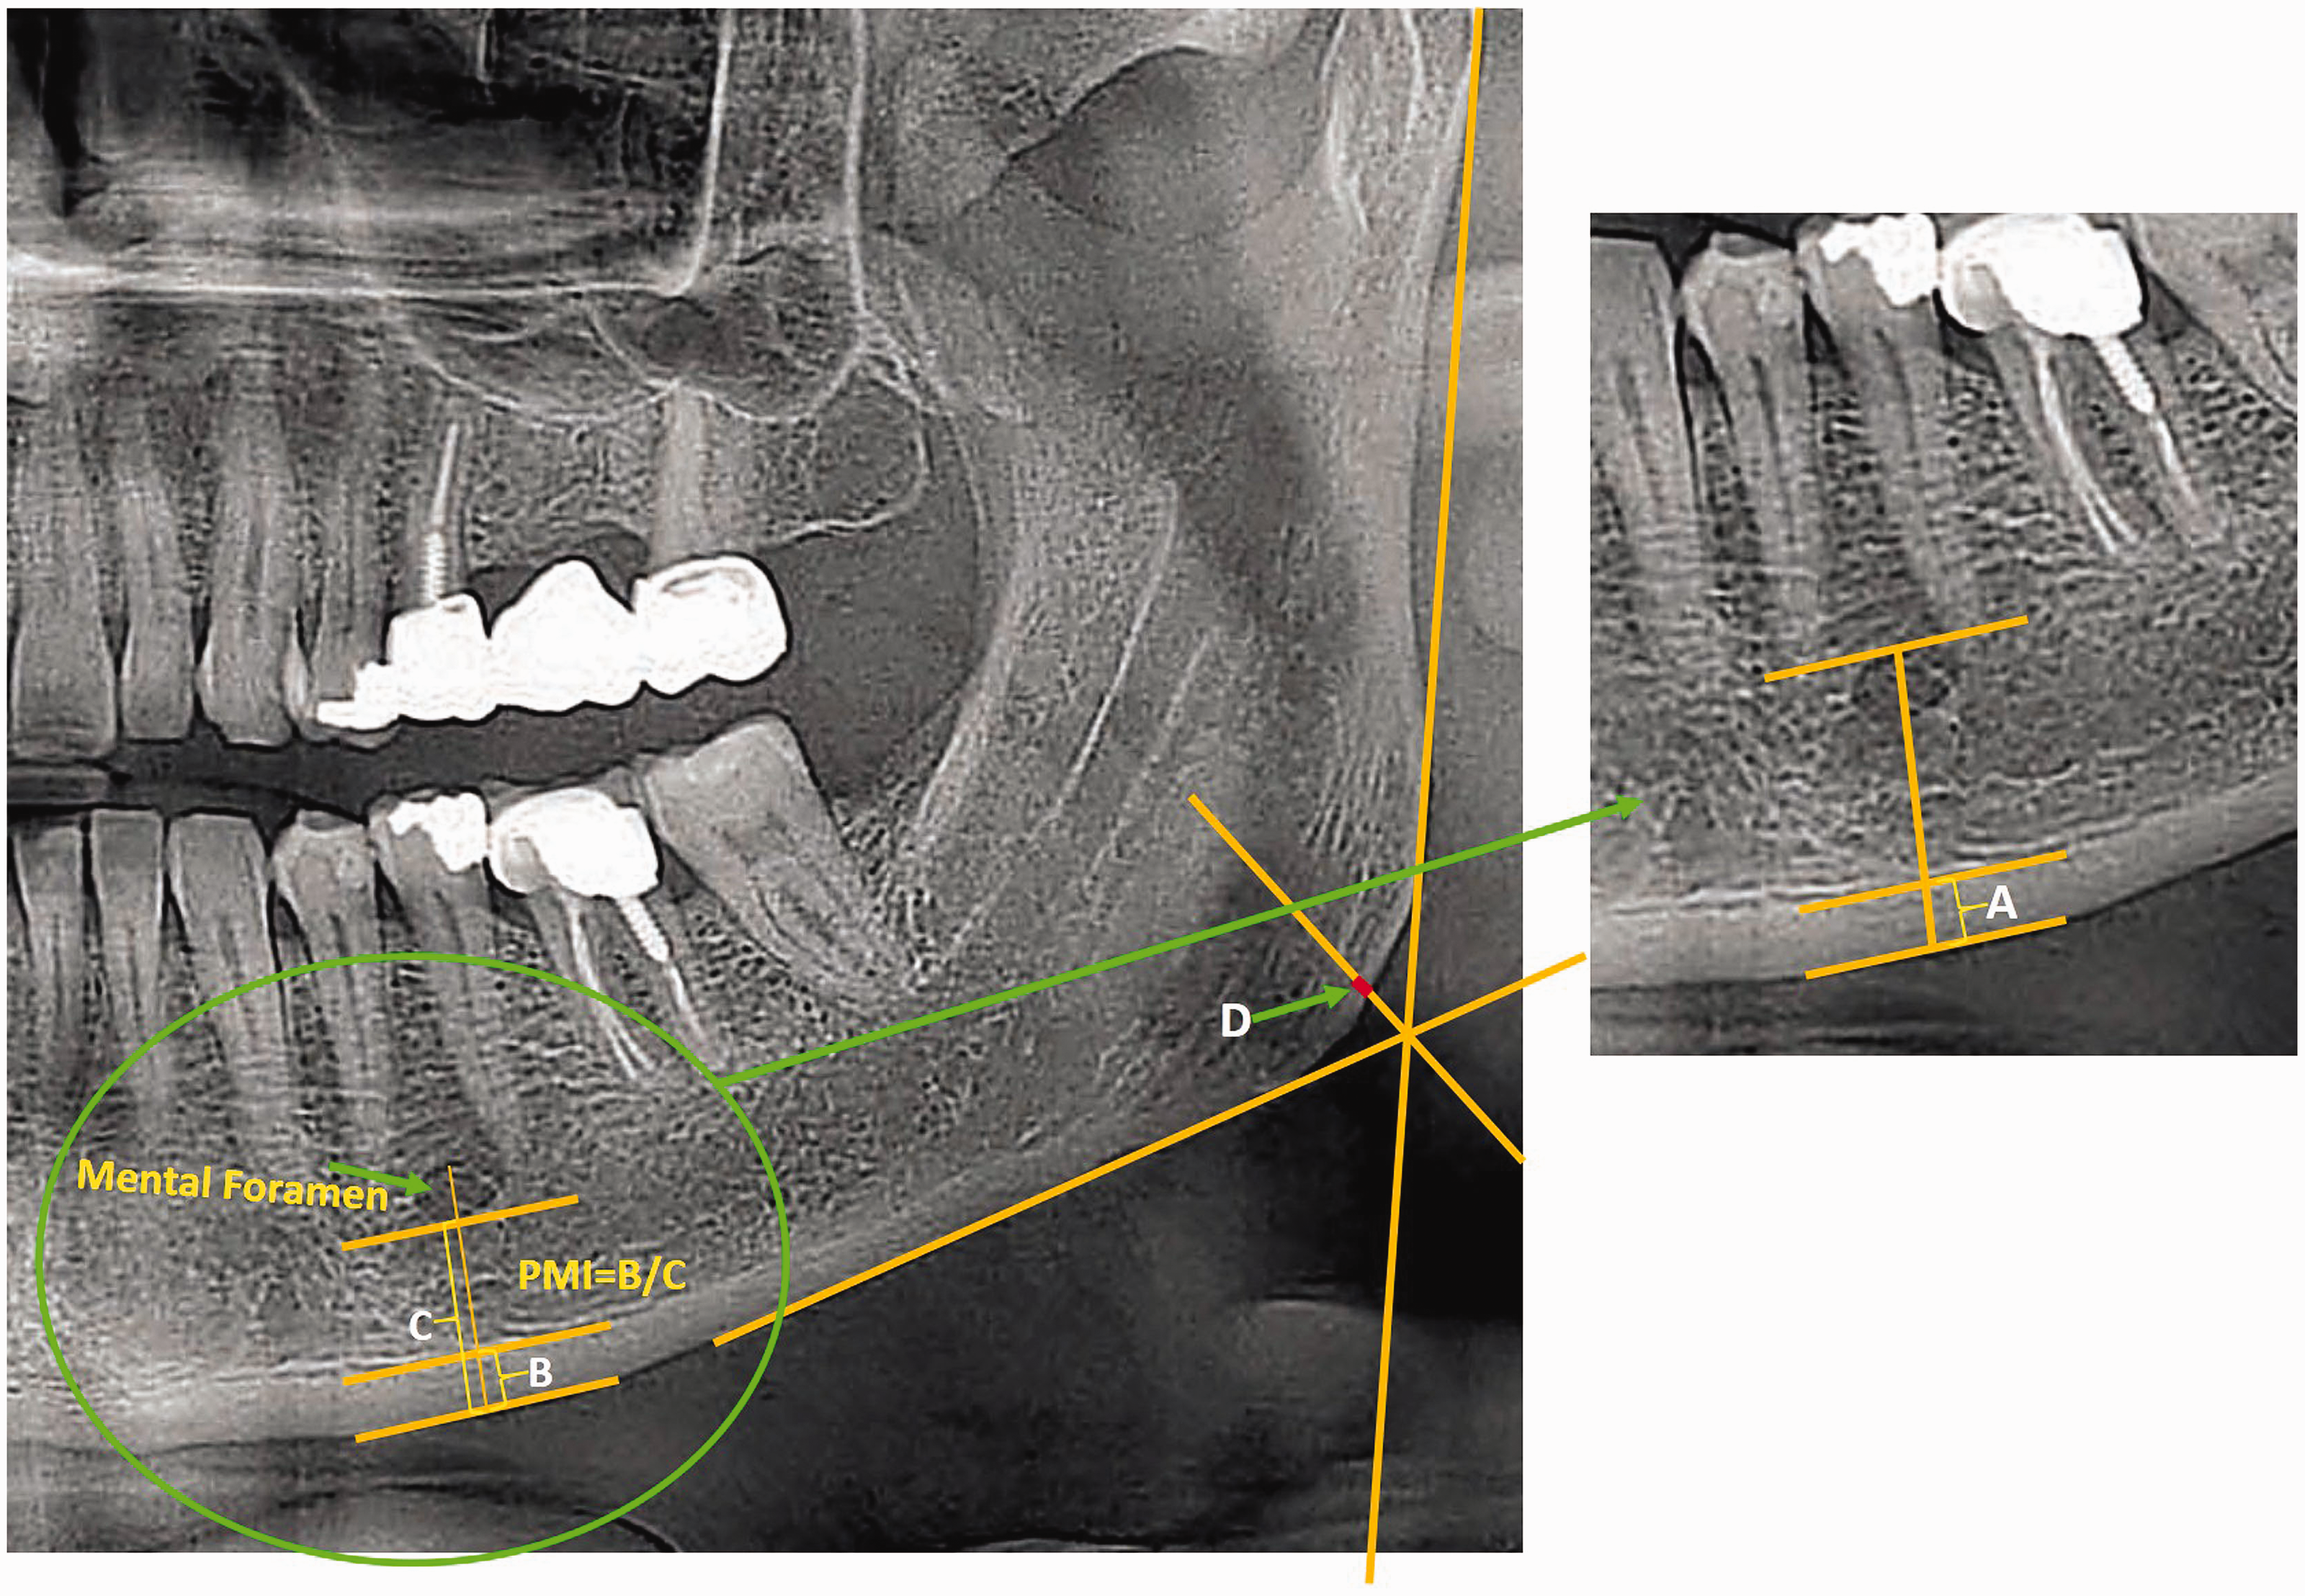
Measurement of MI on an orthopantomogram (width A). Measurement of PMI on an orthopantomogram (PMI = B/C). Measurement of AGI on an orthopantomogram (width D). MI, mental index; PMI, panoramic mandibular index; AGI, antegonial index.
Method error
The radiographic measurements were performed by one of the authors (M.S.). Method errors were examined by calculating the coefficient of reliability and using the equations established by Dahlberg 14 and Houston. 15 Error of 0.15% to 0.25% and a coefficient of reliability of 85% indicated acceptable agreement. After 10 days, all values on 10 radiographs were measured by the same examiner (M.S.) and by another expert radiologist (S.P.) to evaluate inter-examiner and intra-examiner reliability using kappa statistics. The mean kappa values for inter-examiner and intra-examiner reliability were 0.83 ± 0.05 and 0.86 ± 0.04, respectively, indicating high reliability.
Statistical analysis
Statistical analysis of the data was performed using SPSS Statistics version 19.0 (IBM Corp., Armonk, NY, USA). Descriptive statistics and frequencies of the PMI, MI, and AGI among different groups were identified. Comparisons between groups were carried out using the t-test to identify differences in the PMI, MI, and AGI among different groups based on sex and age. Comparisons between groups were also carried out using analysis of variance to assess differences in the PMI, MI, and AGI among groups based on age and weight. Further comparisons among different age and weight groups were conducted using the post hoc Bonferroni test. Statistical significance was identified at α = 0.05.
Results
Three hundred individuals (133 men and 167 women) who attended the dental clinics (College of Dentistry, Jouf University, KSA) and were indicated for CBCT were randomly selected. The participants’ age ranged from 18 to 75 years (mean age ±standard deviation, 50.8 ± 8.9 years). The mean PMI, MI, and AGI were compared between men and women (Table 1). The MI and AGI were significantly different between the two sexes; specifically, the MI and AGI were higher in men than in women (P < 0.001). The PMI was not significantly different between men and women.
Sex-related disparities in PMI, MI, and AGI.

PMI, panoramic mandibular index; MI, mental index; AGI, antegonial index; SD, standard deviation; SE, standard error; CI, confidence interval. P < 0.05 was considered statistically significant (independent t test).
The mean PMI, MI, and AGI were compared between Saudi and non-Saudi participants (Table 2). The PMI was higher in Saudi than in non-Saudi participants; however, the difference was not statistically significant. The MI was significantly higher in non-Saudi than Saudi participants (P < 0.001). The AGI was also higher in non-Saudi than Saudi participants, but the difference was not statistically significant.
Disparities in PMI, MI, and AGI between Saudi and non-Saudi participants.
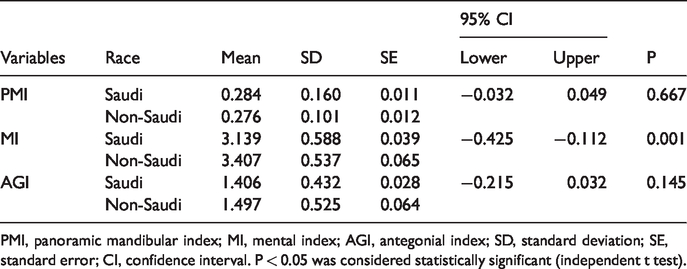
PMI, panoramic mandibular index; MI, mental index; AGI, antegonial index; SD, standard deviation; SE, standard error; CI, confidence interval. P < 0.05 was considered statistically significant (independent t test).
Table 3 shows multiple comparisons of the PMI, MI, and AGI among different age groups. Participants aged 20 to 40 years had a significantly higher PMI, MI, and AGI than participants aged 41 to 60 years (P = 0.010, P < 0.001, and P < 0.001, respectively) and participants aged >60 years (P = 0.016, P < 0.001, and P < 0.001, respectively). Additionally, participants aged 41 to 60 years had a significantly higher MI than participants aged >60 years (P < 0.001). However, the PMI and AGI were not significantly different between participants aged 41 to 60 years and participants aged >60 years.
Age-related disparities in PMI, MI, and AGI (descriptive and multiple comparison).
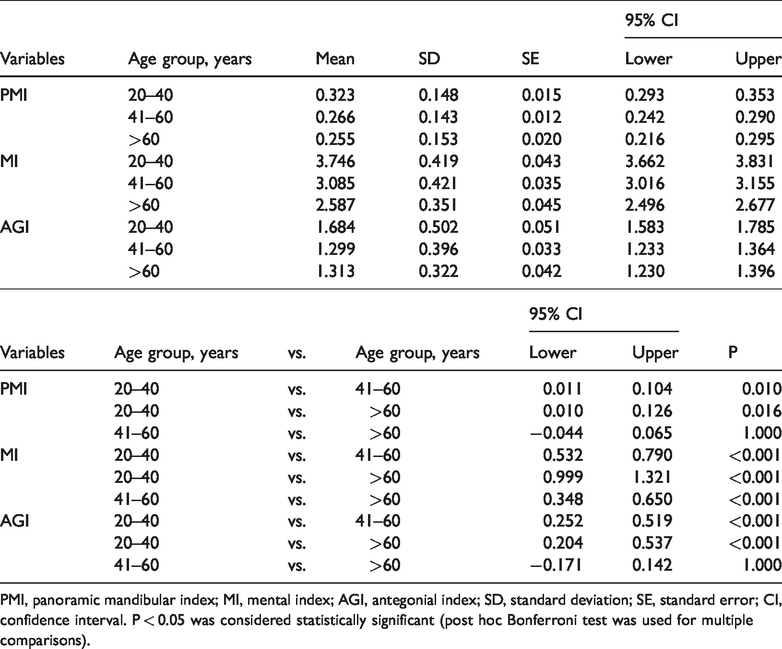
PMI, panoramic mandibular index; MI, mental index; AGI, antegonial index; SD, standard deviation; SE, standard error; CI, confidence interval. P < 0.05 was considered statistically significant (post hoc Bonferroni test was used for multiple comparisons).
Multiple comparisons of the PMI, MI, and AGI among different weight groups showed no significant differences in the PMI, MI, or AGI among participants with different BMIs (i.e., underweight [<18.5 kg/m2], average weight [18.5–24.9 kg/m2], and overweight [25.0–29.9 kg/m2] groups) (Table 4). Nevertheless, the PMI, MI, and AGI were relatively higher among participants in the underweight group than in the average weight and overweight groups.
BMI-related disparities in PMI, MI, and AGI (descriptive and multiple comparison).
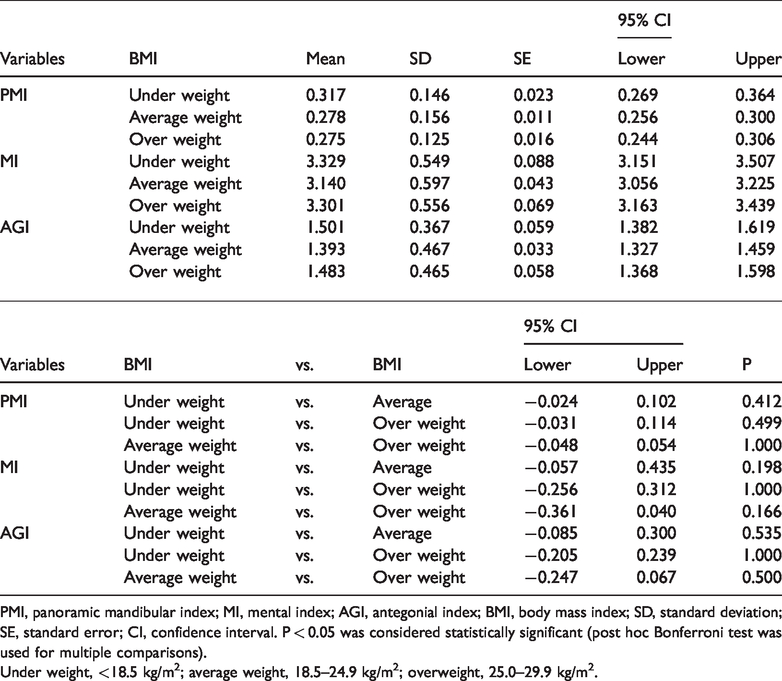
PMI, panoramic mandibular index; MI, mental index; AGI, antegonial index; BMI, body mass index; SD, standard deviation; SE, standard error; CI, confidence interval. P < 0.05 was considered statistically significant (post hoc Bonferroni test was used for multiple comparisons).
Under weight, <18.5 kg/m2; average weight, 18.5–24.9 kg/m2; overweight, 25.0–29.9 kg/m2.
Discussion
This investigation demonstrated that radiomorphometric indices on panoramic radiographs (PMI, MI, and AGI) were correlated with sex, age, and BMI and were different between Saudi and non-Saudi participants. Consequently, the null hypothesis was rejected.
Although various mandibular cortical indices have been used to assess the mandibular bone mass of the mandible and to predict bone resorption on panoramic radiographs for detection of osteopenia, the MI is considered the most effective index in this regard. 16 Previous studies have shown a correlation between the MI and BMD.1,6,11,17 This is in agreement with the findings of the current study; i.e., the MI showed a strong relationship with sex and age.
This study also showed that the MI was higher in younger age groups. This is consistent with the findings of previous studies that showed lower MI values in older age groups.12,16,17
Moreover, men had a higher MI than women. This is in agreement with the findings of previous studies that investigated the variations in the mandibular cortical thickness of men.12,17–19 Men were found to have a thicker mandibular cortex 19 and greater mandibular cortical width than women. 17 Additionally, the MI was found to be higher among men than women of similar age. 20
However, the PMI decreased as age increased in the present study. This is consistent with the findings of previous studies showing a reduction in the PMI with increased age. 21 However, the findings of the present study demonstrated that the PMI was not significantly different between men and women. This is in contrast to previous literature that reported greater bone resorption and a thinner mandibular cortex in women than men.16,20,21
One advantage of the PMI over the MI is that it accounts for the variations in magnification among different panoramic machines. Therefore, in contrast to other linear indices, the PMI allows direct comparison of absolute figures obtained by certain studies with those published in the literature. 22 Some previous studies have suggested that the PMI may be used as an index of bone mineral changes and can be a valuable screening tool to detect osteoporosis.23,24 However, other researchers have argued that the PMI has no specific advantage over the MI as a tool for evaluation of mandibular BMD.1,11,21
The findings of the present investigation indicated that the AGI was higher among men and among participants aged 20 to 40 years. This coincides with the results of previous literature. 17 Some researchers have indicated that a decrease in the cortical thickness in the gonial region among aged women might be an indicator of osteoporosis.19,25 Furthermore, the AGI has been suggested as a potential indicator of skeletal osteopenia. 22 In contrast, some researchers have concluded that the AGI has poor reliability and cannot be used to identify undetected low skeletal BMD or osteoporosis among postmenopausal women. 24
This study is the first to explore radiomorphometric mandibular indices among the Saudi population and compare Saudi with non-Saudi participants. Earlier studies involving different races demonstrated that resorption of the mandibular cortical thickness was higher in white than black individuals. 21 Additionally, the PMI was found to decline with increasing age, among white individuals, and among women. 1
In comparison with previous studies, this investigation involved comprehensive three-dimensional morphometric analysis of three panoramic indices (MI, PMI, and AGI) between Saudi and non-Saudi populations as well as among various age groups, both sexes, and several BMIs. Most previous studies either did not study all three indices together or did not comprehensively study these indices among participants from various age groups, both sexes, and several BMIs. In addition, no previous studies have compared Saudi and non-Saudi participants in this regard.
Further studies are recommended to compare the MI, PMI, and AGI among different populations as well as among participants with different medical conditions.
Conclusion
The MI, PMI, and AGI were different between Saudi and non-Saudi participants as well as among various age groups and different sexes. The null hypothesis is rejected.