
Abstract
Objective
This study aimed to evaluate the relationship between elevated serum amylase levels and the prognosis of paraquat poisoning.
Methods
Patients were categorized into the elevated and non-elevated serum amylase groups according to serum amylase levels. Demographics, mortality, risk factors of elevated serum amylase levels, and injury to the pancreas were analyzed.
Results
A total of 457 patients were enrolled in this study and the overall mortality rate was 51.9%. Patients in the elevated group had worse indices than those in the non-elevated group. Kaplan–Meier survival analysis showed that the mortality rate in the elevated group was significantly higher than that in the non-elevated group (hazard ratio: 10.65, 95% confidence interval [CI]: 7.55–15.02). Multivariate Cox proportional hazards analysis showed that elevated serum amylase levels were related to mortality (hazard ratio: 2.066, 95% CI: 1.239–3.444). The receiver operating characteristic curve showed that the area under the curve was 0.724 (95% CI: 0.666–0.783) for serum amylase levels with 70.4% sensitivity and 74.0% specificity.
Conclusion
Elevated serum amylase levels are observed in PQ poisoning. This elevation might be one of the most accurate early prognostic factors for predicting severity and mortality.
Introduction
While paraquat (PQ) poisoning is primarily associated with lung toxicity due to the pulmonary polyamine uptake system,1,2 a range of extra-pulmonary effects have been reported. Among these, nephrotoxicity, and hepatotoxicity are presumed as the main clinical manifestations of PQ poisoning.3–6 However, effects of PQ poisoning on the gastrointestinal tract, pancreas, heart, and central nervous system are among the more unusual complications, and these organs’ clinical and prognostic implications are not well described. 7 There are three degrees to describe the severity of PQ poisoning, and patients with moderate-severe and acute fulminant PQ poisoning often die within a few days to a few weeks because of multiple organ failure or pulmonary fibrosis. 8
Many different parameters have been studied to predict the outcome of PQ poisoning, including the leucocyte count, the volume ratio of ground-glass opacity in early lung computed tomography, the maximum serum creatinine value and growth rate, the Sequential Organ Failure Assessment score, and arterial lactate levels.9–14 Hyperamylasemia has been reported in severe PQ poisoning 15 after Soontornniyomkij et al. 16 first found injury to the pancreas in autopsy cases of PQ-poisoned patients in 1992. Recently, hyperamylasemia was described in a few studies,17–20 but it has not been recognized as a factor of prognosis of PQ poisoning. Gil et al. 18 specifically focused on the relationship between serum amylase levels and the prognosis of PQ poisoning. However, there are little clinical data of this relationship in China. A previous study in our hospital 21 showed that the incidence of pancreatic injury in patients with PQ poisoning was nearly 35.9%. Li et al. 19 reported that the incidence of PQ poisoning was 29.4%, and they used the level of hyperamylasemia as the index of pancreatic injury. Therefore, hyperamylasemia is a relatively common finding in patients with PQ poisoning, but clinical signs of pancreatic injury are rare and only a few cases of PQ-induced pancreatic injury have been reported. 19 The clinical and prognostic significance of PQ-associated hyperamylasemia with or without pancreatic injury is not well known.
Therefore, this retrospective study aimed to identify the incidence, clinical characteristics, and prognostic factors of hyperamylasemia in a population of patients with PQ poisoning.
Materials and methods
Selection of patients
Patients who were admitted to the Emergency Department from December 2013 to December 2018 were enrolled. The diagnosis of PQ poisoning was based on clinical characteristics, laboratory examinations, and serum and/or urine PQ concentrations. Blood and urine samples were collected on patients’ arrival at the hospital for detection of poisoning using by high-performance liquid chromatography-mass spectrometry. 22 The blood cell count, biochemical parameters, such as liver and kidney function, electrolytes, amylase levels, and arterial blood gases were also measured daily in the first week after admission. All of these blood samples were examined in our laboratory department by an automatic biochemical analyzer (Hitachi 7180, Hitachi, Tokyo, Japan) and arterial blood gas analyzer (ABL700; Denmark). Demographic variables, including age, sex, the quantity of PQ ingested, time to admission, time to hemoperfusion (HP), time to gastric lavage, and regular medication, were recorded. Patients were included if they were older than 14 years, presented within 24 hours, had urine PQ concentrations >5 µg/mL, and had no chronic diseases of the heart, liver, kidney, or lung, or cancer and diabetes mellitus. Patients were excluded if they were dead on arrival, exposed by dermal or intravascular injection, did not have detectable PQ levels in the urine, or withdrew from treatments.
Treatment protocols
We used our previous treatment protocols for the patients, which have been proven to be effective. 23 Briefly, all patients received gastric lavage and activated charcoal to prevent PQ absorption, and two 2.5-hour courses of activated charcoal HP to accelerate excretion. After HP, they received high-dose methylprednisolone pulse therapy via intravenous injections of methylprednisolone 15 mg/kg in 100 mL 0.9% sodium chloride injection for 3 days. This dose was reduced by 50% for 2 days, and then reduced by a further 50% for another 2 days, and discontinued on the 8th day. This therapy was provided in combination with cyclosporine A 5 mg/kg in 250 mL 5% dextrose. Cyclosporine A was initially provided by intravenous infusion for 8 hours, and a maintenance dose of 7.5 mg/kg in 250 mL 5% dextrose for 28 hours (total time of 36 hours) was provided to prevent pulmonary fibrosis. Repeated methylprednisolone and cyclosporine A pulse therapy was administered if the partial pressure of O2 (PaO2) was <60 mmHg in room air. Furthermore, antioxidant therapies were also provided, such as reduced glutathione, vitamin C, and supportive treatments.
Definitions
The patients were divided into two groups according to serum amylase levels, with the elevated serum amylase group (>250 U/L) and the non-elevated group (<250 U/L). Acute renal failure was diagnosed if the serum creatinine levels was >133 µmol/L and hepatitis was diagnosed when the serum alanine aminotransferase (ALT) level was >80 U/L (normal value <40 U/L). Jaundice was diagnosed if the total bilirubin level was >34.2 µmol/L. If arterial blood gas analysis at room temperature showed a PaO2 <70 mmHg in room air, hypoxemia was considered. 24
Ethical statement
This study was approved by the Medical Ethics Committee of the 5th Medical Center of Chinese PLA General Hospital. The methods were carried out in accordance with the approved guidelines. All patients or patients’ parents/legal guardians provided informed consent on their initial admission.
Statistical analysis
Data are shown as mean ± standard deviation (or median if continuous variables showed a skewed distribution) for continuous variables and number (percentage) for categorical variables. All data were routinely tested for normality of distribution and equality of standard deviations before analysis by the Mann–Whitney U test. Comparisons between patients were made with the Student’s t test for continuous variables and the chi-square test or Fisher’s exact test for categorical variables. To assess the relationship between elevated serum amylase levels and mortality, Kaplan–Meier curves were compared by the log-rank test. A multivariate Cox proportional hazards regression model was applied to determine the significance of basal variables for predicting risk factors of elevated serum amylase levels, death from PQ poisoning, and death in the elevated group. The hazard ratios (HRs) for mortality and 95% confidence intervals (CIs) were calculated. The receiver operating characteristic (ROC) curve was performed to determine the predictive powers of plasma PQ concentrations, the white blood cell (WBC) count, creatinine, serum amylase, peak serum amylase, base excess (BE), and ALT. A probability value of p < 0.05 was considered to indicate statistical significance. All statistical analyses were performed using IBM SPSS Statistics version 20 (IBM Corp., Armonk, NY, USA).
Results
Baseline characteristics
With regard to baseline characteristics, 622 patients with PQ poisoning were admitted to our hospital. A total of 457 patients were included and 165 patients were excluded according to the inclusion criteria and exclusion criteria. The overall mortality rate was 51.9% (237/457), and the mortality rate in men (212, 46.4%) was slightly lower than that in women (245, 53.6%). The overall mean age was 29.3 ± 14.8 years, and male patients were younger than female patients (28.6 ± 17.6 vs. 30.0 ± 11.8 years, p = 0.313). The mean time to admission was 6.3 ± 4.3 hours and the median estimated ingested amount of PQ was 50 mL (interquartile range: 20–80 mL). Forty (8.8%) patients had HP performed before admittance to the center. The median plasma PQ concentration was 0.8 µg/mL (interquartile range: 0.2–2.7 µg/mL) and that of urine was 36.6 µg/mL (interquartile range: 6.3–166.7 µg/mL) in the remaining 417 patients.
Of the 457 patients, 134 (29.3%) developed elevated serum amylase levels (>250 U/L). Additionally, 72 patients had a mild elevation in amylase levels (serum amylase levels increased to greater than three times the upper limit of normal, < 750 U/L), while 62 patients had a greater elevation (>750 U/L), and the maximum serum amylase level was 3382 U/L. The mean time to hyperamylasemia was 2.10 ± 0.88 days after admission and patients who died were more likely to develop hyperamylasemia within 4 days after admission (Figure 1). No patients suffered from abdominal pain with a normal abdominal computed tomography examination. Patients were classified as the elevated serum amylase group and non-elevated serum amylase group according to their serum amylase level. Demographics and laboratory findings between the two groups are shown in Table 1. There were no significant differences in age, sex, time to admission, time to HP, time to gastric lavage, and alcohol consumption between the two groups. However, the elevated serum amylase group had higher initial laboratory findings, serum and urine PQ concentrations, and oral amount of PQ than the non-elevated serum amylase group in univariate analysis (all p < 0.05). The daily change in serum amylase levels is shown in Figure 2. Patients who died had higher serum amylase levels than those who survived, especially on the second, third, and fourth days (all p < 0.01). This finding suggested that as elevated serum amylase levels increased, the outcome of PQ poisoning became worse. Patients with the highest serum amylase levels died within 3 days after poisoning (Figure 3). Furthermore, patients in the elevated serum amylase level group had a significantly higher incidence of acute toxic hepatitis (odds ratio [OR] 7.3, 95% CI 4.7–11.5, p < 0.001), acute renal failure (OR 4.9, 95% CI 3.0–8.0; p < 0.001), and acute respiratory failure (OR 6.0, 95% CI 3.8–9.4, p < 0.001) than those in the non-elevated serum amylase group (Table 2).

Daily kinetic change in new hyperamylasemia cases in patients who died and those who survived.
Baseline demographics of patients with paraquat poisoning in the elevated and non-elevated serum amylase groups.

Note: §interquartile range.
#Of 418 patients with detection of plasma paraquat concentrations, 39 did not have this detection because of hemoperfusion at another hospital. In these patients, there were 299 in the non-elevated serum amylase group and 119 in the elevated serum amylase group.
†Of 281 patients who had urine paraquat concentrations detected, 205 were in the non-elevated serum amylase group and 76 were in the elevated serum amylase group.
‡Of 357 patients with HP data, 246 were in the non-elevated serum amylase group and 111 were in the serum amylase elevated group.
¶Of 434 patients with gastric lavage data, 308 were in the non-elevated serum amylase group and 126 were in the elevated serum amylase group.
PQ: paraquat; CON.: concentration; HP: hemoperfusion; WBC: white blood cell; ALT: alanine aminotransferase; TBiL: total bilirubin; Cre: creatinine; S-Amy: serum amylase; PaO2; partial pressure of oxygen; PaCO2; partial pressure of carbon dioxide; BE: base excess; HCO3−: bicarbonate.

Daily kinetic change in serum amylase levels in patients who died and those who survived according to outcome. The mean serum amylase level represents serum amylase levels on each day during hospitalization. The bars represent 95% confidence intervals. ***p < 0.001; **p < 0.01.

Maximum serum amylase values for patients who survived (survival group), those who died within 3 days, and those who died after 3 days. The boxplot shows the median (square), quartiles (box), and 5th and 95th centiles. Nonsurvival group 1: died after 3 days since poisoning. Nonsurvival group 2: died within 3 days since poisoning.
Clinical and biochemical data of patients with paraquat poisoning in the elevated and non-elevated serum amylase groups during hospitalization.

Kaplan–Meier survival analysis
Kaplan–Meier survival analysis showed that patients in the elevated serum amylase group had a significantly higher mortality rate (91.8%, 123/134) compared with those in the non-elevated serum amylase group (35.6%, 115/323; HR 10.65, 95% CI 7.55–15.02; log-rank test, p < 0.001; Figure 4).
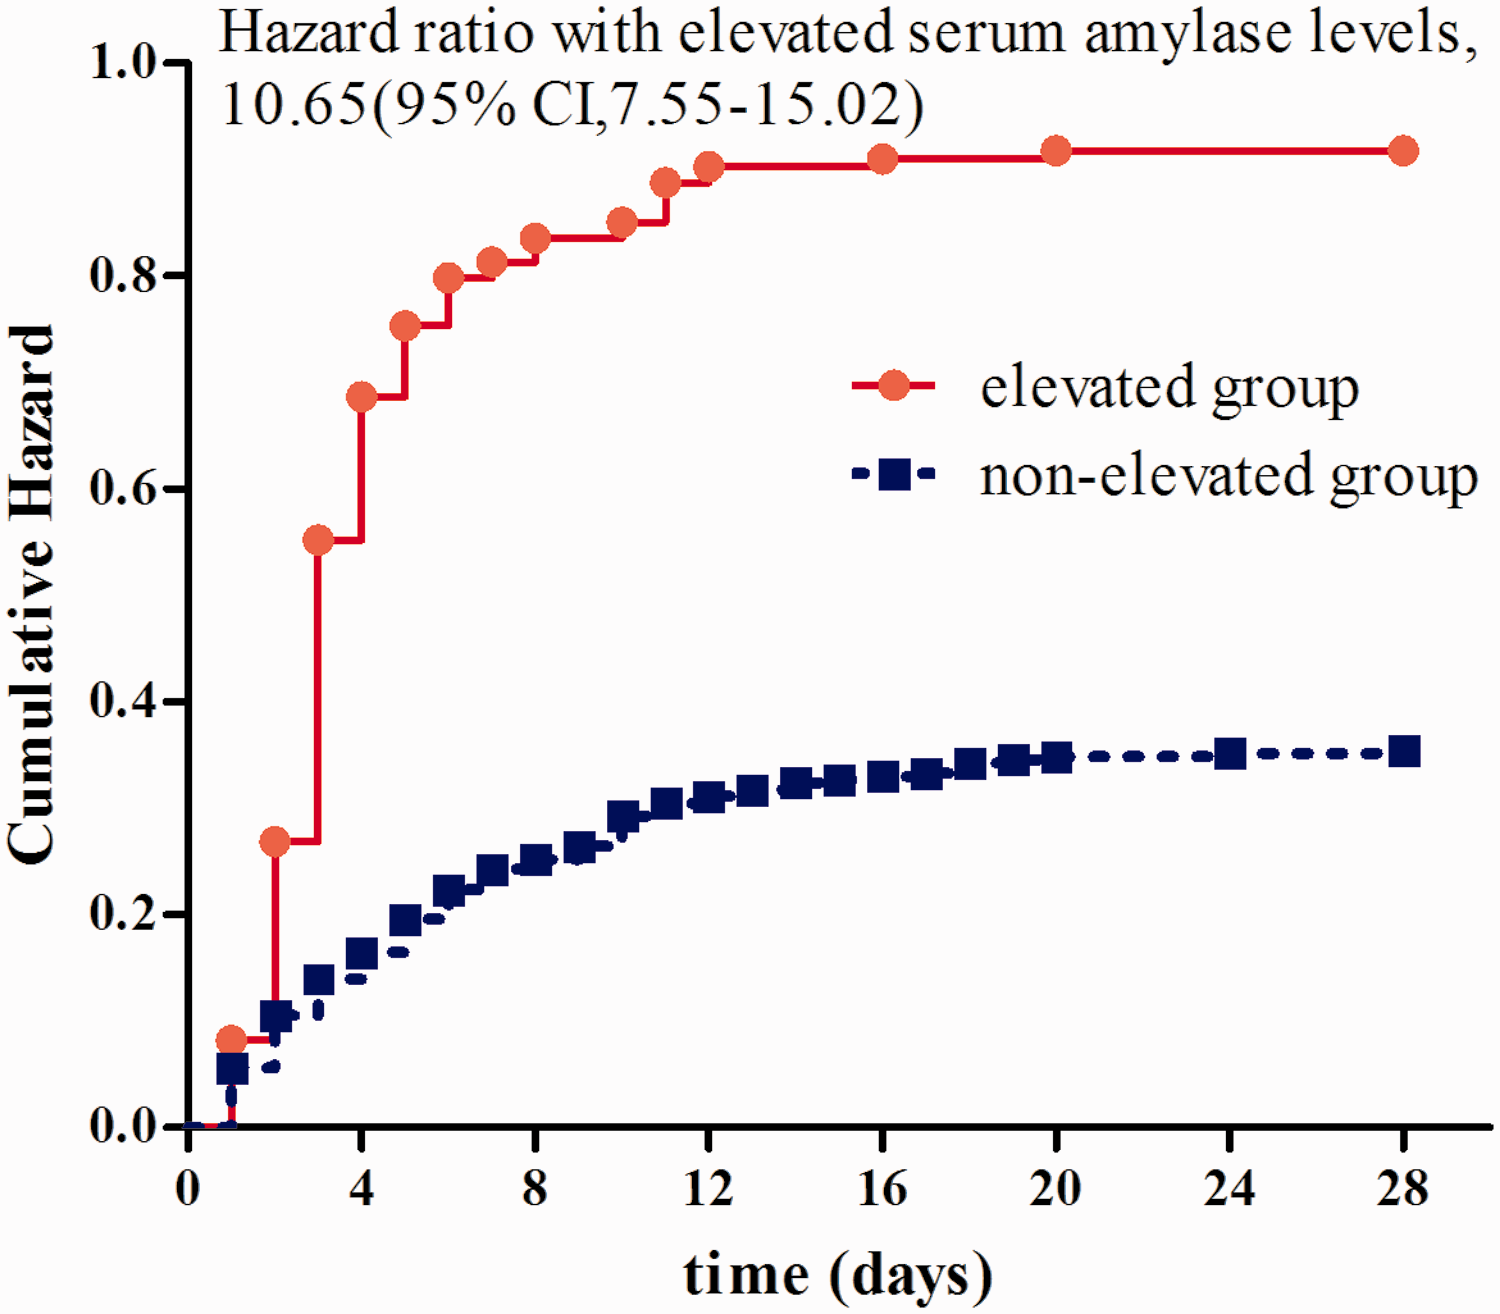
Kaplan–Meier survival analysis of the two groups of paraquat-poisoned patients. Log-rank chi square=181.7, p<0.0001. CI: confidence interval.
Multivariate Cox proportional hazards analysis
Multivariate Cox proportional hazards analysis was carried out on the initial values, including sex, age, oral amount of PQ, time to admission, plasma PQ concentrations, urine PQ concentrations, time to HP, time to gastric lavage, and the initial WBC count, ALT level, total bilirubin level, creatinine level, PO2, PCO2, BE, and HCO3−. Plasma PQ concentrations (HR 1.108, 95% CI 1.022–1.202, p = 0.013) were correlated with an increased HR for elevated serum amylase levels (Table 3). Similarly, the initial WBC count (HR 1.042, 95% CI 1.001–1.085, p = 0.045) was associated with an increased HR for elevated serum amylase levels. The initial BE (HR 0.666, 95% CI 0.479–0.925, p = 0.015) was associated with a decreased HR for elevated serum amylase levels. Elevated serum amylase levels, as well as age, oral amount of PQ, initial WBC count, and initial BE were significantly related to the HR for all-cause mortality in multivariate Cox hazard regression (all p < 05, Table 4). Table 5 shows multivariate Cox hazard regression of the risk factors for mortality in the group with elevated serum amylase levels. Elevated serum amylase levels, age, oral amount of PQ, and initial BE were significantly associated with a higher risk of death (all p < 0.05).
Multivariate Cox hazard regression for elevated serum amylase levels in relation to baseline variables.
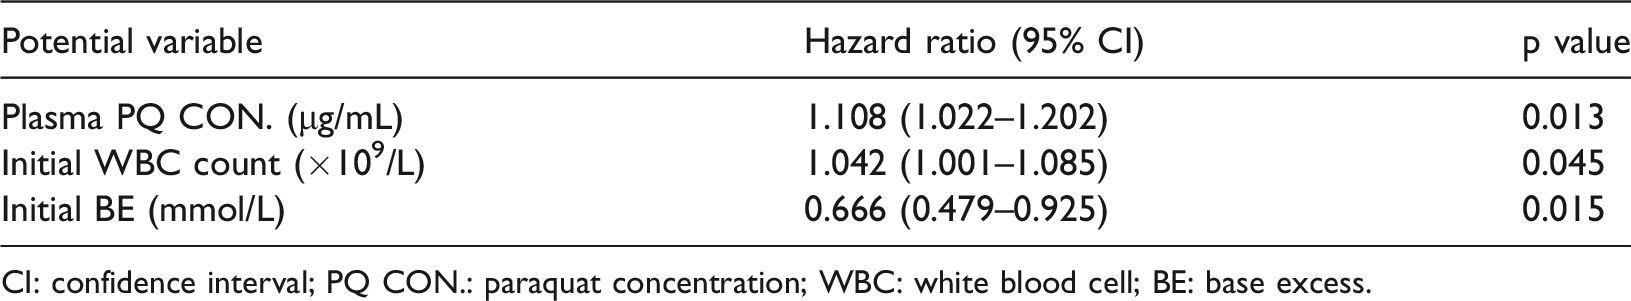
CI: confidence interval; PQ CON.: paraquat concentration; WBC: white blood cell; BE: base excess.
Multivariate Cox hazard regression for all-cause mortality in relation to baseline variables.

CI: confidence interval; WBC: white blood cell; BE: base excess.
Multivariate Cox hazard regression for mortality in the group with elevated serum amylase levels, in relation to baseline variables.

CI: confidence interval; BE: base excess.
ROC curve analysis
ROC curves of plasma PQ levels, WBC count, creatinine levels, serum amylase levels, peak serum amylase levels, ALT levels, and BE were calculated. The area under the ROC curve for serum amylase levels was 0.724 (95% CI 0.666–0.783), with 70.4% sensitivity and 74.0% specificity. The area under the ROC curve for peak serum amylase levels was 0.982 (95% CI 0.964–1.000), which showed better discriminatory potential than plasma PQ concentrations (AUC = 0.787; 95% CI 0.737–0.836) (Figure 5, Table 6).
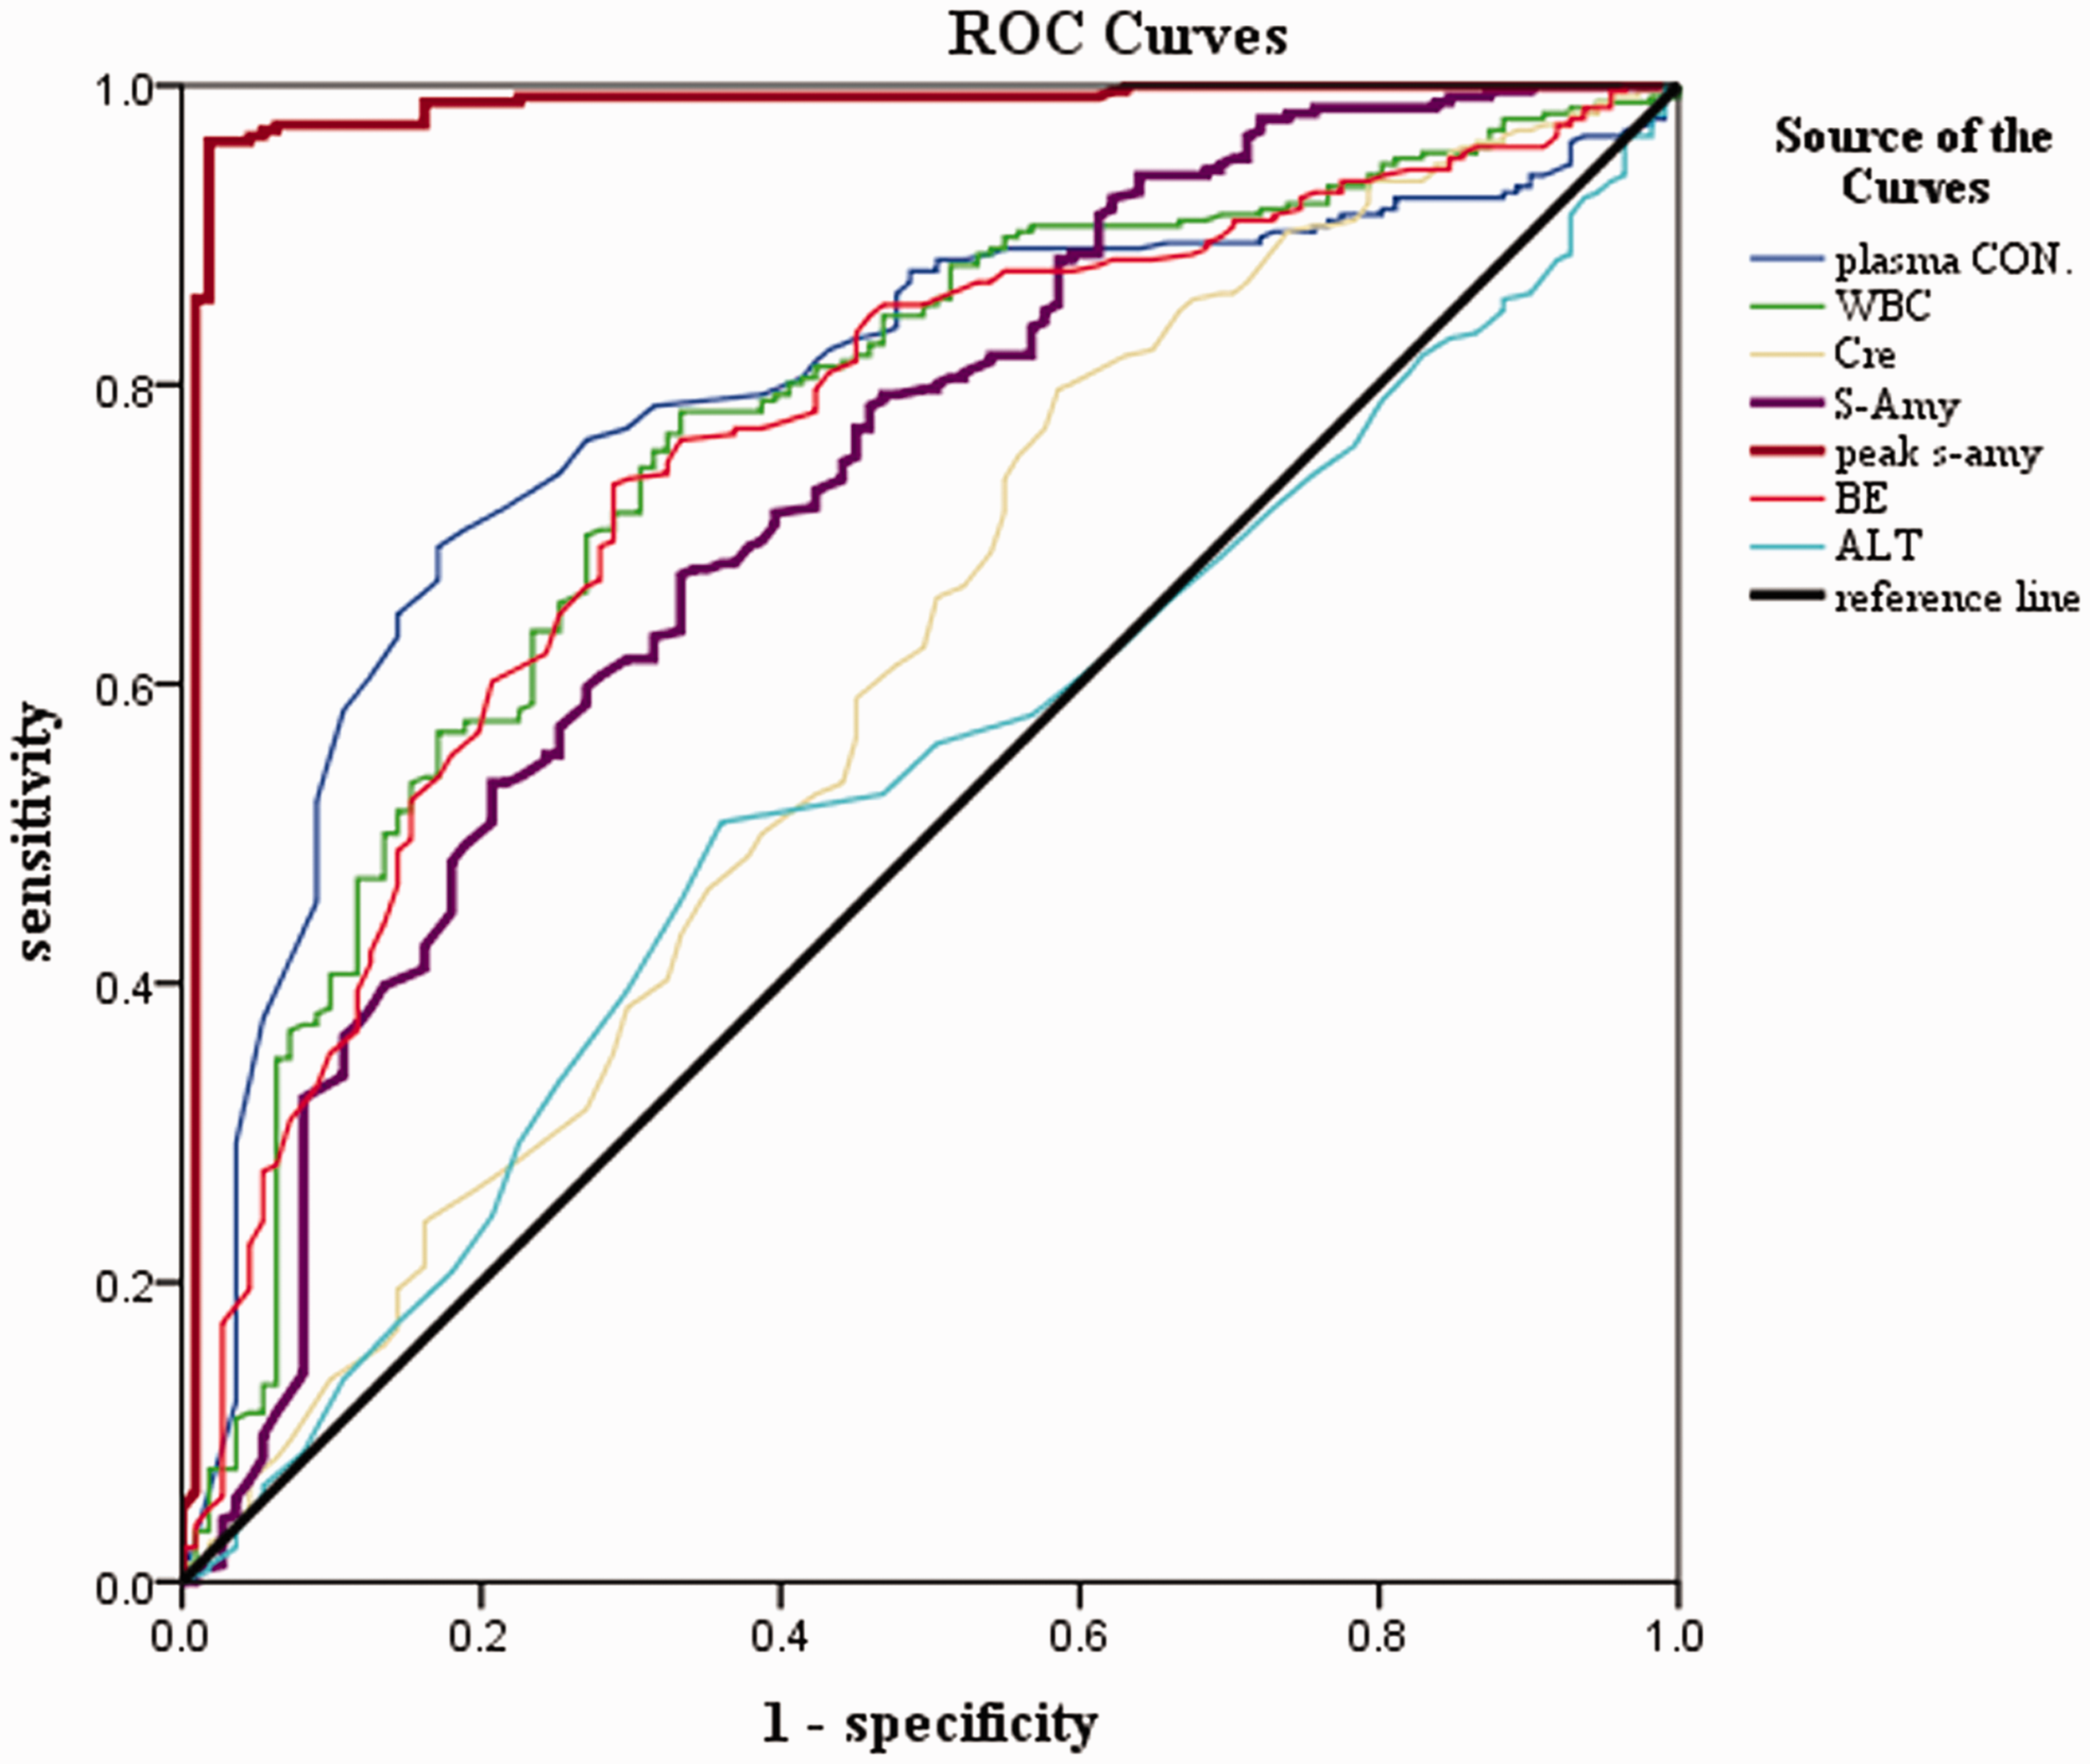
Receiver operating characteristic curves of plasma paraquat CON, WBC count, Cre, S-Amy, peak s-amy, BE, and ALT. CON: concentration; WBC: white blood cell; Cre: creatinine; S-Amy: serum amylase; peak s-amy: peak serum amylase; BE: base excess; ALT: alanine aminotransferase; ROC: receiver operating characteristic.
Comparison of the AUC for plasma paraquat CON., WBC, Cre, S-Amy, peak s-amy, BE, and ALT.
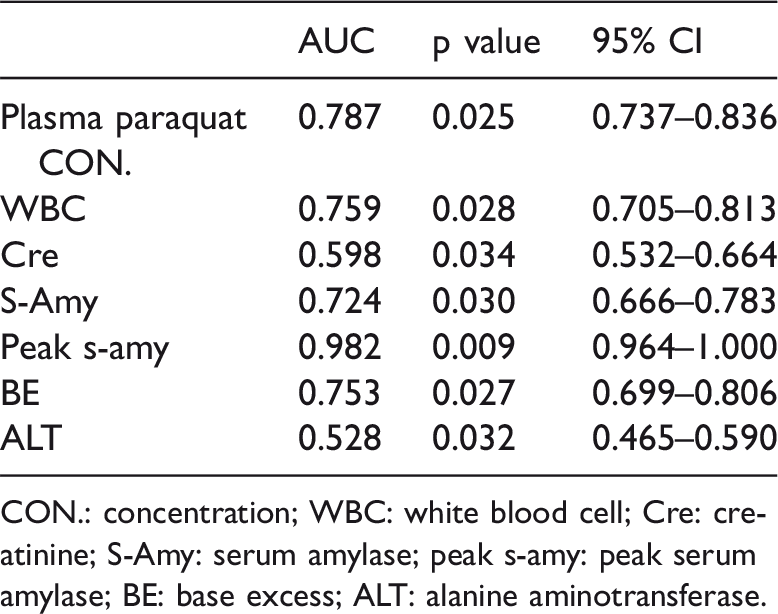
CON.: concentration; WBC: white blood cell; Cre: creatinine; S-Amy: serum amylase; peak s-amy: peak serum amylase; BE: base excess; ALT: alanine aminotransferase.
Discussion
PQ poisoning is still a major public health problem in many developing countries, including China, and there are no optimal early prognostic indicators for evaluating outcomes of patients with PQ poisoning. Generally, plasma and urea PQ concentrations, and the amount of oral poisoning are the most remarkable prognostic indices. 25 However, plasma and urea PQ concentrations change at different time intervals after ingestion, and any uncertainty on ingestion time can result in uncertainty of survival estimates. 13 Only a few hospitals are capable of detecting plasma and urea PQ concentrations. Recently, several studies have reported the relationship between elevated serum amylase levels and the outcome of PQ poisoning. Li et al. 19 reported regression analysis of elevated serum amylase levels for predicting the prognosis, and they showed that leukocytes, amylase levels, the neutrophil percentage, and partial pressure of CO2 were risk factors for death. Lee et al. 26 also found that the initial amylase level was a risk factor for survival. Therefore, elevated serum amylase levels or hyperamylasemia associated with a poor prognosis may be a new biomarker for predicting the outcome of PQ poisoning. Our results are consistent with Lee et al.’s study. 26 We also found that hyperamylasemia was strongly associated with the severity of hepatotoxicity and nephrotoxicity induced by PQ, which are consistent with Liu et al.’s study. 20 Using univariate analysis, we found that there was much higher hazard risk of nephrotoxicity, hepatotoxicity, and lung toxicity in the elevated serum amylase group than in the non-elevated serum amylase group. Therefore, pancreatic enzyme elevation might more easily occur if there is renal injury because of insufficient renal excretion of pancreatic enzymes. In a previous study, 7 in patients with PQ poisoning who died or did not die, the survival period was an important predictive index of severity. Lee et al. and Yang et al.27,28 also found that the nonsurvival group of patients with PQ poisoning had significantly higher serum amylase levels than those in the survival group. Gil et al. 18 studied 34 patients with PQ poisoning and focused on pancreatic enzymes. This previous study showed that the time that serum amylase levels reached the highest was the seventh day since poisoning. However, in our study, serum amylase levels peaked on the third day, and in most patients, serum amylase levels reached a peak within 1 or 2 days. In the current study, one quarter of patients died within 3 days after poisoning. Among these patients, some could not take another test for detection of amylase because of ethical reasons.
The incidence of elevated serum amylase levels induced by PQ poisoning ranges from 20.6% to 58.5%.18,19,21 In our study, we mainly focused on epidemiology, risk factors, and prognosis of abnormal pancreatic enzyme levels in patients with PQ poisoning. We found that there was hyperamylasemia in 29.3% of patients, and the severity of the intoxication was associated with elevated serum amylase levels. However, although the incidence of hyperamylasemia is not high in patients with mild PQ poisoning, it can be gradually increased with aggravation of this condition. Up to 58.5% patients have hyperamylasemia after severe poisoning due to renal injury, resulting in insufficient renal excretion of pancreatic enzymes.
The mechanism by which PQ leads to hyperamylasemia remains unclear. Direct damage by PQ and oxidative stress may be the most important poisoning mechanism. El-Hussuna et al. 29 described that the etiologies of elevated serum amylase levels were alcohol abuse and gallstones. However, acidosis, especially lactic acidosis, hypoxemia, shock, carbon monoxide poisoning, trauma, surgery or vascular disturbance, pancreatic duct obstruction,30–35 and some drugs also induce increased serum amylase levels. 36 Many organs secrete amylase, including the pancreas, salivary glands, intestine, and other tissues. In vivo, the pancreas secretes P-type amylase, and extra-pancreatic organs secrete S-type amylase. 37 The P/S ratio can be used to differentiate pancreatic injury. One study showed that more than half of the patients with hyperamylasemia had a salivary-type isoamylase. 32 Another study showed that the P/S ratio was high in those who had a disorder related to the pancreas, low in patients with extra-pancreatic disorders, and normal in patients with renal failure. 35 Hyperamylasemia is also associated with burns. Ryan et al. 38 found that pancreatitis is a frequent complication after large burn injuries, especially in the presence of inhalation injury. PQ is mildly corrosive, and almost all patients with PQ poisoning have corrosive esophageal injuries. 39 In another study, almost half of the patients with PQ poisoning had a peripheral burning sensation. 40 Vomiting is one of the earliest and most common signs in patients with PQ poisoning, 8 and is a common source of salivary amylase production. Corrosive esophageal injuries may also stimulate salivary gland secretion, which leads to elevated serum amylase levels. Additionally, patients with elevated serum amylase levels have higher WBC values and a lower BE, which appear to reflect a severe inflammatory response and oxidative stress. Therefore, PQ-induced elevated serum amylase levels may also via this mechanism as oxidative stress is the main mechanism of the elevated serum amylase induced by PQ poisoning. 41
There are some limitations in our study. First, this was a retrospective study. However, we collected almost 500 cases of acute PQ poisoning for 5 years which is a high number, especially for PQ poisoning. The second limitation is that we did not measure isoamylase levels. Additionally, we did not perform imageology and ultrasonics of the upper abdomen in patients with elevated serum amylase levels. We also did not clarify the association between hyperamylasemia and pancreatitis because pf the lack of isoamylase analysis.
In conclusion, elevated serum amylase levels are observed in PQ poisoning. In combination with other prediction methods, elevated serum amylase levels might be one of the most accurate prognostic factors for predicting severity and mortality of PQ poisoning. However, elevated serum amylase levels do not appear to be secondary to pancreatitis, and this issue requires further investigation.
Footnotes
Acknowledgements
The authors wish to thank Prof. Rigao Ding for assistance in manuscript review and suggestions.
Declaration of conflicting interest
The authors declare that there is no conflict of interest.
Funding
This research received no specific grant from any funding agency in the public, commercial, or not-for-profit sectors.