
Abstract
Objective
Low urine pH (LUP) is not only affected by environmental factors, but is also a feature of metabolic syndrome (MS), which is characterized by insulin resistance, abdominal obesity, dyslipidaemia and hypertension. However, it is unclear which factors contribute most to urine acidity. This study investigated factors influencing LUP and the link between LUP and metabolic traits in South Korea.
Methods
Participants were middle-aged subjects (age, 52.2 ± 8.9 years; average body mass index, 24.6 ± 3.2 kg/m2), of whom 4,626 had urine pH of 5.0 and were assigned to the LUP group and 4,185 had urine pH > 5.0 and were assigned to the control group. The association between LUP and various phenotypes, including environmental and metabolic traits, was analysed.
Results
LUP was significantly associated with MS diagnostic components and with environmental exposures such as smoking, alcohol intake and low-fibre diet. Multivariate analysis showed that the waist-to-hip ratio was the best predictor for LUP compared with other MS components (OR: 2.439).
Conclusions
LUP is an indicator of MS and is mainly related to the MS diagnostic criterion of abdominal obesity, even after adjusting for environmental influences on urine acidity.
Introduction
Urine, a net result of nephron function, contains various information about physiological and pathophysiological processes. 1 Urine measures based on dipstick tests such as protein, blood cells, ketone and glucose are broadly used in medical practice to diagnose not only urinary tract disease and kidney function but also metabolic diseases such as diabetes. 2 Of urine parameters, urine pH influences the solubility of crystals commonly found in nephrolithiasis. Low urine pH (LUP) contributes to precipitation of uric acid in the urine and is also linked with metabolic syndrome (MS), which is characterized by disorders such as obesity, insulin resistance, dyslipidaemia, hypertension and/or type 2 diabetes mellitus.3–5 Therefore, LUP may be a feature of MS owing to its association with various MS diagnostic components. 6 For example, clinical studies have shown that LUP is independently associated with systolic and diastolic blood pressure (SBP and DBP), triglycerides (TG), fasting plasma glucose levels (GLU0) and high-density lipoprotein (HDL) cholesterol, demonstrating that urine pH decreases as the number of metabolic abnormalities increases. 7 In a Korea National Health and Nutrition Examination Survey,8,9 subjects with high urine acidity were more likely to have MS disorders such as dyslipidaemia or hyperglycaemia. However, it is unclear which MS diagnostic components are associated with LUP.
In addition to these metabolic traits, environmental factors such as consumption of acid-based foods affect urine pH, and lower fruit and vegetable intake and high meat consumption are significantly associated with LUP. 10 Thus, metabolic traits or increased acid intake may contribute to but cannot entirely account for LUP. Therefore, we aimed to not only distinguish which environmental factors play important roles in influencing LUP, but also investigate the link between LUP and metabolic traits. It was hoped to determine the association between LUP and MS diagnostic components after adjusting for related environmental factors.
Methods
Study subjects
Subjects were drawn from the Korean Genome and Epidemiology Study (KoGES) project conducted by the Korean Association REsource consortium (KARE). KoGES is a large cohort study involving subjects aged 40 to 69 years from urban Ansan and rural Anseong in the Republic of Korea.11,12 KoGES was initially designed to investigate chronic diseases such as obesity, diabetes, hypertension and MS, as Korea is one of the world’s most rapidly aging countries and the Korean diet has quickly become more Western. We analysed data from individuals with available urine pH reports. The KARE data set consists of epidemiological/clinical phenotypes, including MS diagnostic criteria. Detailed information about the study protocol has been described previously. 13 This research project was approved by the institutional review board of Kosin University (IRB No. KUGH 2018-09-031-002). All participants had provided informed consent for the baseline data and biospecimens, and had undergone an interview and physical examination.
Study variables
General information on age; sex; residential area (Anseong or Ansan); past disease history such as diabetes, hypertension and dyslipidaemia; medication history and lifestyle history (including smoking and alcohol intake) was used for analysis. Between-group analysis was conducted on the following MS diagnostic factors: body mass index, waist-to-hip circumference ratio, SBP and DBP, GLU0, HDL-cholesterol and TG. Body fat percentage and waist-to-hip ratio were calculated using a body composition analyser (Inbody 3.0, Biospace, Seoul, Republic of Korea). Other blood tests were also conducted: 75 g oral glucose tolerance test (OGTT), haemoglobin A1c (HbA1c), total cholesterol, liver function, renal function, high-sensitivity C-reactive protein and renin.
Dietary information was also obtained using the validated and reproducible Food-Frequency Questionnaire, which measures the average consumption frequency and serving size for 103 food items. 14 Nutrient intake per day, such as energy-source nutrients, vitamins and minerals, was calculated and compared between groups. 15
Statistical analyses
Statistical analyses were performed using R (version 3.4.1), a free package from the R Foundation for Statistical Computing (www.r-project.org). Demographic and clinical characteristics of subjects are reported as mean ± standard deviation for continuous variables, and as frequencies and percentages for categorical variables. Independent sample t-test or chi-squared test was used for between-group analysis of continuous or categorical variables, respectively. Pearson correlation analysis was used to examine associations between nutrient intake components. Stepwise regression analysis in a multivariate logistic regression model was used to investigate independent predictors of LUP.
Results
Between-group comparison of demographic and clinical characteristics
Data were analysed from 8,811 individuals (mean age, 52.2 ± 8.9 years; mean body mass index, 24.6 ± 3.2 kg/m2). The pH distribution of urine test results of the KARE subjects after 8 hours of fasting was as follows: pH 5.0 (N = 4,626), pH 5.5 (N = 1,114), pH 6.0 (N = 1,047), pH 6.5 (N = 851), pH 7.0 (N = 511), pH 7.5 (N = 489), pH 8.0 (N = 67) and pH 8.5 (N = 6). Therefore, 4,626 subjects with urine pH of 5.0 were assigned to the LUP group, and the other 4,185 subjects with urine pH > 5.0 were assigned to the control group, according to previous definitions of LUP.7,9
Table 1 summarizes the demographic profiles, comorbidity, medication and lifestyle history for the LUP and control groups. The number of men was significantly higher in the LUP group (P = 1.40 × 10⁻⁵) and there were no between-group differences in the various diseases, including kidney disease, gout and urinary tract infections, which can affect urine pH. The KARE data show a wide range of medication use (data not shown); the only between-group difference for medication use was for hypertension medication (P = 6.84 × 10⁻³), which can be attributed to the low rate of hypertension in the LUP group. The between-group comparison in smoking and alcohol consumption history showed that LUP was significantly associated with current smoking (P = 3.23 × 10⁻¹⁰), smoking pack-years (P = 1.04 × 10⁻⁹), current drinking (P = 7.08 × 10⁻¹⁰) and alcohol intake (P = 0.0110) (Table 1).
Demographic characteristics, clinical features, and tobacco and alcohol consumption according to urine pH.
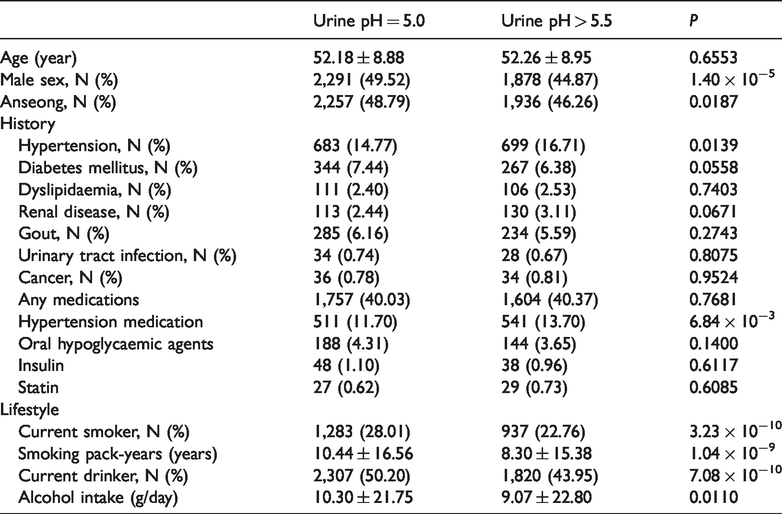
Table 2 compares the anthropometric measurements between groups. There was a significant difference in waist circumference compared with hip circumference, resulting in a much bigger waist-to-hip ratio (related to abdominal obesity) in the LUP group (P = 5.92 × 10⁻⁸). Body mass index was also significantly higher in the LUP group (P = 9.87 × 10⁻⁸). The observed abdominal obesity difference was confirmed by measurements using a body composition analyser, although the body fat composition did not differ between groups, indicating that LUP represents abdominal obesity rather than obesity. Both SBP (P = 2.83 × 10⁻⁵) and DBP (P = 4.27 × 10⁻³) were significantly lower in the LUP group even after adjusting for hypertension medication. A subgroup analysis of subjects taking hypertension medication (N = 1,052) showed that both SBP (130.45 ± 18.05 mmHg) and DBP (81.39 ± 11.71 mmHg) in the LUP group were significantly lower compared with SBP (136.0 ± 19.13 mmHg) and DBP (83.47 ± 11.0 mmHg) in the control group (P = 5.47 × 10⁻⁶ and P = 3.07 × 10⁻³, respectively).
Anthropometric measurements according to urine pH.

BMI: body mass index; DBP: diastolic blood pressure, SBP: systolic blood pressure.
Between-group comparison of biochemistry tests
Table 3 summarizes the biochemistry results between groups. The results indicated that LUP is a metabolic syndrome trait. Of the OGTT results, GLU0 showed the largest significant between-group difference (P = 2.15 × 10⁻¹²), with higher HbA1c in the LUP group (P = 2.86 × 10⁻¹⁰). The homeostasis model assessment of insulin resistance (HOMA-IR = glucose × insulin/405) was significantly greater in the LUP group (1.73 ± 1.19) than in the control group (1.60 ± 1.36, P = 6.39 × 10⁻⁶). Of the lipid profiles, higher TG (P = 9.34 × 10⁻⁷) and lower HDL (P = 1.36 × 10⁻⁷) were observed in the LUP group. The renin parameter, which is related to hypertension, was significantly greater in the LUP group (P = 3.46 × 10⁻⁹). The LUP group showed poorer liver function (alanine aminotransferase (P = 5.69 × 10⁻⁷), aspartate aminotransferase (P = 4.16 × 10⁻⁴) and gamma-glutamyl transpeptidase (P = 8.24 × 10⁻¹⁰)) and higher blood urea nitrogen (P = 2.01 × 10⁻¹⁹), although this was within the normal range.
Biochemistry results according to urine pH.
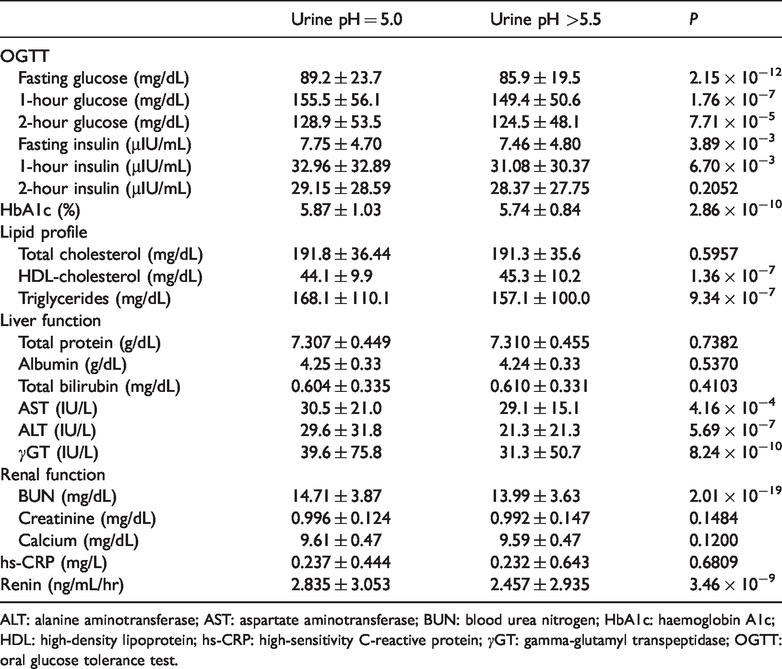
ALT: alanine aminotransferase; AST: aspartate aminotransferase; BUN: blood urea nitrogen; HbA1c: haemoglobin A1c; HDL: high-density lipoprotein; hs-CRP: high-sensitivity C-reactive protein; γGT: gamma-glutamyl transpeptidase; OGTT: oral glucose tolerance test.
Between-group comparison of dietary nutrient intake
There were no significant between-group differences in energy-source nutrients such as carbohydrates, lipids, protein and minerals, except potassium (P = 7.62 × 10⁻⁴) (Table 4). However, vitamin intake was significantly lower in the LUP group: vitamin C (P = 4.68 × 10⁻⁵), folate (P = 3.10 × 10⁻³), carotene (P = 7.68 × 10⁻³) and vitamin E (P = 6.21 × 10⁻³). Daily nutrient intake, including potassium, correlated strongly with fibre intake (correlation coefficients ≥0.78, P < 0.001, Supplemental Figure 1). Overall, the LUP group tended to have a less fibre-rich diet than the control group (P = 1.63 × 10⁻³).
Mean daily intakes of energy and nutrients (estimated from the Food-Frequency Questionnaire) according to urine pH.
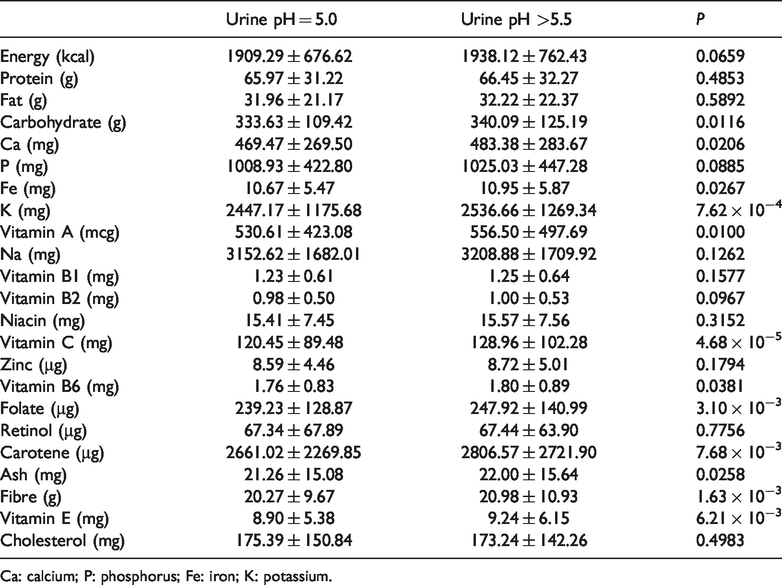
Ca: calcium; P: phosphorus; Fe: iron; K: potassium.
Multivariate analysis
Table 5 shows the results of the multivariate regression analysis for the associations between urine pH and the other variables. Female subjects were more likely to be in the LUP group (OR = 1.330, P = 1.79 × 10⁻⁵). Lifestyle was also significantly related to LUP: smoking (OR = 1.244, P = 4.12 × 10⁻⁴), current drinking (OR = 1.186, P = 2.08 × 10⁻⁵) and fibre-rich diet (OR = 0.993, P = 1.00 × 10⁻³). Even after adjusting for these environmental factors, most of the MS diagnostic components showed a significant association with LUP, which can be interpreted as an unhealthy metabolic feature. Waist-to-hip ratio had the greatest influence on LUP (OR = 2.439, P = 0.0192) compared with the other MS diagnostic components such as body mass index, blood glucose, insulin and lipid parameters. SBP was strongly associated with LUP (OR = 0.992, P = 5.40 × 10⁻⁹).
Multivariate logistic regression results for urine pH.

ALT: alanine aminotransferase; BMI: body mass index; HbA1c: haemoglobin A1c; HDL: high-density lipoprotein; γGT: gamma-glutamyl transpeptidase; TG: triglycerides.
Discussion
According to the Korean Society of Obesity MS criteria, 16 the prevalence of MS in the study cohort was about 32.7%, which increased with age as follows: 23.6% of men and 22.6% of women in their 40s, 30.3% and 45.5% in their 50s, and 26.8% and 58.8% in their 60s, respectively. Follow-up analysis of subjects who had not been diagnosed with MS also showed that the incidence density of MS was high: 53/1,000 person-years in men and 52/1,000 person-years in women during the mean follow-up period of 6.01 years. 17 Therefore, this sample of cohort subjects with high MS prevalence was appropriate for our purpose in investigating which factors significantly affect LUP in terms of MS.
The present analysis showed that LUP was associated with most of the MS diagnostic criteria, such as abdominal obesity, elevated fasting glucose and low HDL-cholesterol, which suggests that LUP could be used as an unhealthy metabolic trait indicator. Of these components, abdominal obesity, represented by waist-to-hip ratio, was the most important predictor of LUP, even after adjusting for other covariates such as sex and lifestyle factors. However, elevated SBP and DBP were negatively associated with LUP, which supports previous findings that raised blood pressure, in contrast with other MS components, is not significantly associated with LUP.8,9 The subgroup analysis of subjects taking hypertension medication showed that both SBP and DBP were significantly lower in the LUP group than in the group. Therefore, the results suggest that LUP can differentiate between the blood pressure component and other diagnostic components of the MS pathophysiological mechanism.
The association between LUP and metabolic traits such as obesity and TG was previously reported to be dependent on sex (i.e. this association was observed only in men). 18 In contrast, the present findings indicate that the adjusted OR was significantly larger in women, though LUP in men was more prevalent. Therefore, caution is needed in assuming a sex-dependent association between LUP and obesity or TG. Regarding living habits, we found that LUP reflected poor lifestyle patterns such as low dietary fibre intake, alcohol intake and smoking habits. The effects of smoking and alcohol on LUP (ORs of 1.244 and 1.186, respectively) were larger than those of MS diagnostic components, except for abdominal obesity, which demonstrated that environmental exposure is important in determining urine pH.
The present study had several limitations. This cross-sectional study did not permit us to assume a causal relationship between LUP and the various factors. However, the study used large-scale cohort data generated from over 8,000 subjects, in whom MS was prevalent. In addition, LUP cases and controls were well balanced. Second, fasting single-spot urine samples were used to determine urine pH, instead of urine collected over 24 hours. However, a previous study using a large cohort showed that fasting urine pH was correlated with 24-h urine pH. 19 Third, our study population was restricted to Korean subjects, so it may be challenging to generalize these findings to Western countries, especially considering ethnic and dietary differences in MS.
In conclusion, this study indicated that LUP is an unhealthy metabolic feature that is not only associated with MS components (e.g. abdominal obesity, hyperglycaemia and dyslipidaemia), but also represents poor lifestyle (e.g. smoking, drinking and fibre-poor diet). Within the complex pathophysiological mechanisms of MS, LUP is mainly associated with abdominal obesity.
Supplemental Material
IMR898615 Supplemental Figure - Supplemental material for Association of low urine pH as a metabolic feature with abdominal obesity
Supplemental material, IMR898615 Supplemental Figure for Association of low urine pH as a metabolic feature with abdominal obesity by Juyoung Lee, Hee Kyung Chang and Sanghun Lee in Journal of International Medical Research
Footnotes
References
Supplementary Material
Please find the following supplemental material available below.
For Open Access articles published under a Creative Commons License, all supplemental material carries the same license as the article it is associated with.
For non-Open Access articles published, all supplemental material carries a non-exclusive license, and permission requests for re-use of supplemental material or any part of supplemental material shall be sent directly to the copyright owner as specified in the copyright notice associated with the article.