
Abstract
Objective
Vitamin D (VD) deficiency increases susceptibility to tuberculosis and is an important immunomodulator. Dendritic cells (DCs) are important antigen-presenting cells that play a critical role during tuberculosis infection, and Mycobacterium tuberculosis modulates DC responses. The underlying mechanism is poorly understood. Our aim was to study changes in DC surface markers in VD deficient mice administered Bacillus Calmette-Guérin (BCG).
Methods
We divided C57BL/6 mice into a normal group and a VD deficient group. Two groups of mouse bone marrow-derived cells were isolated and cultured with granulocyte-macrophage colony-stimulating factor (20 ng/mL) and interleukin-4 (10 ng/mL) for 6 days. On day 7, BCG (0, 1 or 2 mg/mL) was administered to both groups for 24 hours. Non-adherent cells were harvested to assess DC phenotypic changes induced by different concentrations of BCG.
Results
Expression levels of CD80, MHC-I, MHC-II and CD86 on the surfaces of DCs from VD deficient mice were lower than those in DCs from normal mice. By contrast, the expression level of CD11c on DCs was higher in VD deficient mice than in normal mice. Changes in all factors were concentration-dependent.
Conclusions
These findings indicate that BCG reduced DC surface marker expression to modulate immune responses during M. tuberculosis infection.
Keywords
Introduction
Tuberculosis (TB) is a major health problem worldwide. At present, prevention of Mycobacterium tuberculosis infection depends on extensive vaccination with Bacillus Calmette-Guérin (BCG) in children. 1 Studies have reported that vitamin D (VD) deficiency is closely associated with tuberculosis.2,3 As the body's VD level rises, the tuberculosis infection rate decreases, and the risk of M. tuberculosis infection progressing to TB is also reduced. As early as the 1980s, Rook et al. 4 demonstrated that VD can enhance the bactericidal activity of macrophages in vivo to combat the resistance of M. tuberculosis. VD serves an important role in anti-tuberculosis immunity. 5 Associations between VD levels and TB outcome have been described but a causal relationship could not be demonstrated. Moreover, clinical trials using VD as adjuvant therapy showed conflicting results.6,7
Immune cells produce 1,25(OH)2D3, and macrophages and other immune cells express 1-alpha hydroxylase which converts 25(OH)D, the main circulating form of VD in the blood, to 1,25(OH)2D3. 8 M. tuberculosis infection activates Toll-like receptors (TLR1/2) which regulate the activation of various cells of the immune system and the expression of cytokines and antimicrobial peptides.3,9 VD receptor is expressed by T lymphocytes, B lymphocytes, and monocyte-derived dendritic cells (DCs). 10 DCs are the only antigen-presenting cells that can activate natural T cells and effectively initiate T cell recall responses, which are crucial for the initiation of immune responses. 11 Jiao et al. 12 confirmed that DCs are host cells of M. tuberculosis, regulate the acquired immune response against TB and play a crucial role in tuberculosis infection. Following M. tuberculosis infection, DCs initiate an adaptive immune response.12,13 Rajashree et al. 14 found that the expression of antigen presentation molecules such as CD1a, MHC-II, CD80 and CD83 by the DCs of TB patients was significantly down-regulated. After phagocytosis of TB antigens, the biological functions of DCs changed as shown by altered cell surface expression of co-stimulatory molecules, and these cells gradually moved to the lymph nodes. This process represents the normal maturation process of DCs.
VD is an essential nutrient for the human body. VD is mainly obtained in two ways: food intake and skin synthesis. The most important members of the VD family are VD2 and VD3. The human body digests and absorbs VD from food through the intestinal system. VD2, VD3, and 7-dehydrocholesterol are absorbed in the skin. VD3 is produced by ultraviolet radiation entering the human blood circulation, and the resulting VD3 is transported by binding to plasma VD binding protein. In the liver, hydroxylation by 25-hydroxylase in hepatocytes results in formation of 25-(OH)D3, which is the main form of VD in the human body. Following α-globulin binding and transfer to the kidney, 25-(OH)D 3 is again hydroxylated by 1-alpha hydroxylase (CYP27B1), and is finally converted into the biologically active 1,25-(OH)2D3, which exerts biological functions.15–19
In this study, we developed a mouse VD deficiency model and used it to compare the phenotypes of DCs stimulated by different amounts of BCG.
Materials and method
Experimental materials
C57BL/6 mice were purchased from Changzhou Cavans Laboratory Animal Co., Ltd. (Changzhou, China). 25(OH)D3 and 1,25(OH)2D3 detection kits were purchased from Elabscience (Houston, TX, USA). Fetal bovine serum (FBS) was purchased from BI (Ingelheim am Rhein, Germany). RPMI-1640 cell culture medium, penicillin and streptomycin were purchased from Hyclone (Logan, UT, USA). Granulocyte-macrophage colony-stimulating factor (GM-CSF) and interleukin (IL)-4 were purchased from Peprotech (Rocky Hill, NJ, USA). Inverted phase contrast microscope (Leica, Wetzlar, Germany) and flow cytometry (BD-C6, BD Biosciences, Franklin Lakes, NJ, USA) instruments were used. The study was approved by the Committee for Experiments With the Use of Laboratory Animals at Shenyang Military Region General Hospital (Shenyang, China; Approval No. AE20160823).
Feed preparation for VD deficient mice
After dispensing 50 L of double distilled water into a metal drum with a capacity of 50 L, 625 g of agar were added and heated at 105°C for 40 minutes. The mixture was placed in an incubator at 60°C. The proportions of the various raw materials were weighed and then mixed for 30 minutes, added to a dust-free pulverizer, and passed through a 200 mesh. The agar solution was divided in two and 250 mL of each fat-soluble vitamin solution (one containing VD, one without VD) were added, stirred well for 30 minutes and cooled at room temperature for 1 hour. Feed was stored in a −20°C freezer. 20
Establishment of a VD deficient mouse model
Thirty male specific pathogen-free C57BL/6 mice (6 to 8 weeks old and weighing 20–25 g) were purchased from Changzhou Cavans Laboratory Animal Co., Ltd. Animals were treated in accordance with ethical standards during the experiment, and were randomly divided into two groups: the normal group (N group) and the VD deficient group. The VD deficient group mice were fed with VD-deficient mouse feed, and the N group mice were fed with normal feed. The mice had free access to tap water containing 3% cesium chloride, and cages were kept in the dark. Cages were placed on ultra-clean workbenches, and their fronts were covered with opaque curtains. The cages were ventilated every 12 hours, and illuminated with yellow light without UV for 12 hours during the day to simulate the daytime environment. The light was turned off for 12 hours at night. Data from dead mice were discarded, leaving 12 and 10 mice remaining in the N group and the VD deficient group, respectively.
Detection of serum 25(OH)D3 and 1,25(OH)2D3 by ELISA
At 12 weeks, the tails of both groups of mice were cut. Blood (100 µL) was collected and the serum was separated by centrifugation. Levels of 25(OH)D3 and 1,25(OH)2D3 were assessed by ELISA. The procedure was carried out according to the kit instructions.
Culture and identification of mouse bone marrow-derived DCs (BMDCs)
Isolation of mouse BMDCs
C57BL/6 mice were sacrificed by decapitation and immersed in 75% alcohol for 5 minutes. The tibia and femur were aseptically removed and immersed in RPMI-1640 medium containing 1% fetal calf serum. After cutting off the ends of the bone, a 1-mL syringe was used to suck the RPMI-1640 medium into the bone marrow cavity and rinse again. The bone marrow was moved into another sterile culture dish. The cell suspension was collected from the culture dish, and centrifuged at 300 for 5 minutes. The supernatant was discarded, and the red blood cell lysate was resuspended to dissolve red blood cells. The supernatant was discarded after centrifugation at 300 ×g for 5 minutes, and the cells were collected after washing with phosphate-buffered saline (PBS).
Induction culture of BMDCs
Cells were suspended in RPMI-1640 medium containing 10% FBS and seeded in 24-well culture plates (1 × 10⁶ cells/mL per well) containing GM-CSF (20 ng/mL) and IL-4 (10 ng) in a 37°C, 5% CO2 cell culture incubator. After 7 days of culture, the plate was gently pipetted, and semi-suspended cells and loose adherent cells were harvested and resuspended in a 6-well culture plate. Lipopolysaccharide was added for 24 hours, and the resulting cells were classified as DCs. On day 6 of DC culture induction, 0, 1 and 2 mg/mL of BCG (SINOPHARM; Beijing, China) was added for 24 hours.
Observation and identification of mouse BMDCs
Scanning electron microscopy (SEM) specimen preparation
DC suspensions of the 12th day of culture were collected and resuspended in 0.1 M PBS. The cells were added to polylysine-coated coverslips and allowed to stand in a 37°C, 5% CO2 incubator for 15 minutes, allowing the cells to naturally settle on the slides. The cells were gently washed three times with physiological saline, and then fixed in 3% glutaraldehyde (pH 7.2–7.4) at 4°C, washed twice for 30 minutes with 0.1 M PBS, then fixed with 1% citric acid for 1 hour. The cells were rinsed twice with 0.1 M PBS, dehydrated with different concentrations of alcohol in sequence, replaced, dried and coated. Subsequent experiments were completed in the electron microscope room of the center laboratory of the school.
Transmission electron microscopy (TEM) specimen preparation
DC suspensions on the 10th day of culture were centrifuged at 300 ×g for 15 minutes, washed twice with 0.1 M PBS, and fixed with 3% glutaraldehyde. The fixed cells were dehydrated through a gradient of 50%, 70%, 90%, and 100% alcohol. Preparation of ultra-thin layers and subsequent steps such as soaking, embedding, and slicing were performed in the electron microscope room of the central laboratory of the school.
Detection of antigen presentation molecules on mature DCs by flow cytometry
DCs showing good growth states were digested with 0.25% trypsin for 3 minutes, centrifuged at 300 ×g for 5 minutes, and resuspended in PBS containing 1% bovine serum albumin (BSA) at a density of 1 × 10⁶ cells/mL. The cells were centrifuged at 300 ×g for 5 minutes. After removing the supernatant, cells were fixed with 0.1 mL of 4% paraformaldehyde for 30 minutes, and washed three times with PBS containing 1% BSA by centrifugation at 300 ×g for 5 minutes. Primary antibodies (CD11c-Cy3, CD86-Cy3, CD80-Cy3, MHC-I-Cy3, and MHC-II-Cy3) were added for 1 h at 4°C. IgG-Cy3 was used as an isotype control for gating. After centrifuging at 300 ×g for 5 minutes, cells were washed with PBS containing 1% BSA and adjusted to the appropriate cell density for flow cytometry.
Statistical analysis
Data were presented as the means ± standard errors of the means. Differences between two groups were assessed using t tests. Differences in the expression of cell surface markers were assessed using analysis of variance. Values of P < 0.05 were considered statistically significant. Statistical analyses were performed using SPSS version 23.0 (IBM Corp., Armonk, NY, USA).
Results
Normal mice and mouse model of VD deficiency
VD-deficient mice showed a significant decrease in activity, and walked on the ground. The VD group showed slow movement, darkening of the coat color, and back arching (Figure 1a). Analysis of VD active components in the serum by ELISA showed that levels of 25(OH)D3 and 1,25(OH)2D3 in the N group and the VD deficient group were significantly different (P < 0.001) (Figure 1b). The mean serum 25(OH)D3 concentrations in the N group and VD deficient group were 14.43 ± 1.74 ng/mL and 9.99 ± 0.35 ng/mL, respectively. The mean serum concentrations of 1,25(OH)2D3 in the N group and the VD deficient group were 59.73 ± 5.91 ng/mL and 37.72 ± 6.28 ng/mL, respectively. These results suggested that the VD deficient mouse model was successfully established.

Establishment of a mouse model of VD deficiency. (a) VD deficient group mice showed slowness of movement, darkening of coat color, and dorsal curvature of the back. (b) Comparison of VD active components in the sera of the two groups of mice. VD, vitamin D.
Morphological observation and identification of BMDCs
BMDC optical microscopy
On the first day, a large number of bone marrow cells floating in the medium were observed. Some cells adhered to the bottom of the culture plate, which could be mononuclear macrophages. The next day, the number of adherent macrophages increased (Figure 2). Many cells grown in clusters and some bone marrow cells died. On the third day, the adherent cell mass was further increased. On the fourth day, cells with a small number of short needles could be observed floating in the medium. Some cell clusters were semi-adherent. These cells represented DC cell clusters. On the sixth day of culture, a large number of DC cell clusters could be observed suspended in the medium. There were a large number of acicular protrusions on the surface of the cell membrane, which is a typical DC morphology.

Morphology of BMDCs. The figure shows the morphological changes in BMDCs cultured for 6 days. BMDC, bone marrow derived dendritic cell.
BMDC electron microscopy
TEM showed that mitochondria in the cytoplasm were quite abundant, but lysosomes and rough endoplasmic reticulum were less frequently observed. The shape of the nucleus was irregular and concentrated at one end of the cell. The cytoplasm also contained endocytic vesicles and large bubbles (Figure 3a). The surface of the DC membrane protruded into many long, dendritic processes. The length of these protrusions varied, demonstrating the typical cell morphology of DCs (Figure 3b).
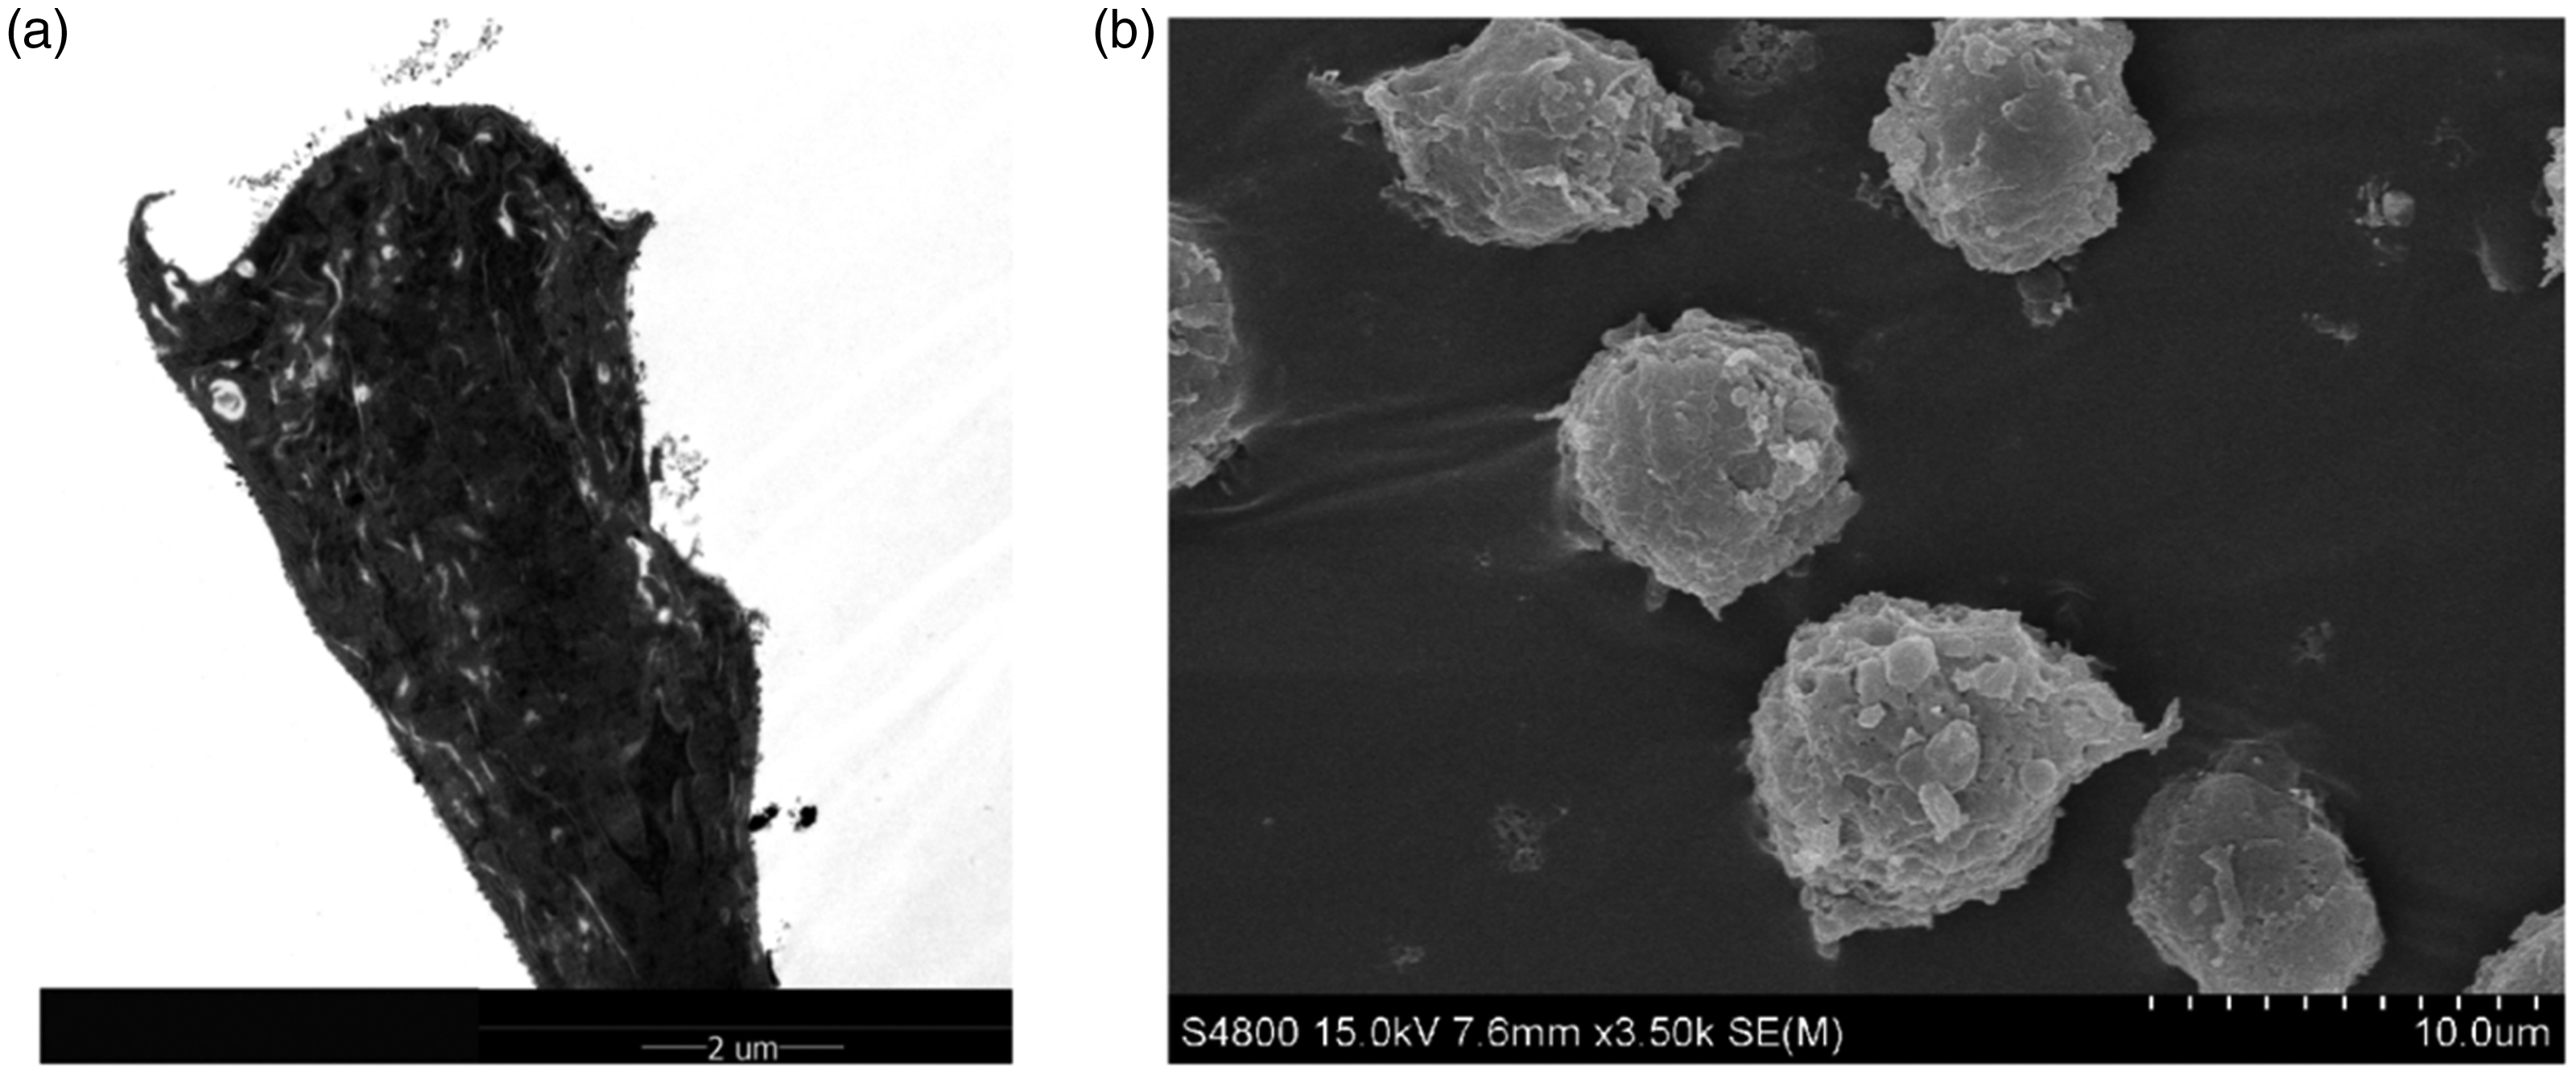
Electron microscopy of BMDCs. (a) TEM of BMDCs. (b) SEM of BMDCs. BMDC, bone marrow derived dendritic cell; TEM, transmission electron microscopy; SEM, scanning electron microscopy.
VD metabolism inhibits maturation of DCs
Mouse BMDCs were isolated and stimulated in vitro with GM-CSF. On the sixth day after induction of DCs, BCG (0, 1 and 2 mg/mL) was added for 24 hours to stimulate DC maturation (Figure 4). The proportion of DCs in the N group was about 10% without stimulation, about 50% after 1 mg/mL BCG stimulation, and about 85% after 2 mg/mL BCG stimulation. The proportion of DCs in the VD deficient group was about 15% without stimulation, about 78% after 1 mg/mL BCG stimulation, and about 95% after 2 mg/mL BCG stimulation. These results are shown in Figure 4.

DCs in the two groups of cells following stimulation with different concentrations of BCG. Changes in DC content in the two groups of BMDCs following stimulation with different concentrations of BCG are shown. DC, dendritic cell; BCG, Bacillus Calmette-Guérin.
Changes of surface molecule expression in BMDC cells in the two groups following stimulation with different concentrations of BCG were assessed by flow cytometry (Figure 5). The results showed that expression of MHC-I, MHC-II, CD11c, CD80 and CD86 molecules in the two groups was initially different (P < 0.01). Expression of all cell surface molecules was significantly different after treatment with BCG compared with the N group at 0 mg/mL BCG (P < 0.01). Expression changes in the VD deficient group were also significant compared with the VD deficient group at 0 mg/mL BCG (P < 0.01). Expression of MHC-I, MHC-II and CD80 in the VD deficient group was lower than that in the N group, and expression of CD11c and CD86 was higher than that in the N group. Following stimulation with 1 mg/mL BCG, MHC-II and CD86 expression levels in the VD deficient group changed dramatically. Following stimulation with 2 mg/mL BCG, MHC-II and CD86 expression was significantly decreased in both groups. No significant cytotoxicity induced by BCG was detected in DCs (data not shown). Although the cytokine treatments in the two groups were the same to enable analysis of the different stimulatory effects of BCG, changes in cell-surface molecule expression in the N group were slower than those in the VD deficient group. The results are shown in Figure 5.

Effect of BCG on BMDC differentiation and maturity. Phenotypic changes of BMDCs following BCG stimulation. **P<0.01 vs. 0 mg/mL in N control mice or VD-deficient mice. ##P<0.01 VD-deficiency group vs. N control group mice. BCG, Bacillus Calmette-Guérin; BMDC, bone marrow derived dendritic cell; N, normal; VD, vitamin D.
Discussion
VD deficiency is closely related to TB. 2 With increasing VD levels, the infection rate of TB is reduced. 15 VD deficiency refers to a low concentration of 25(OH)D rather than of 1,25(OH)2D in serum. 15 In this study, we first established a mouse model of VD deficiency, and then isolated BMDCs from model mice to simulate different physiological concentrations of VD. The phenotypic changes of BMDCs following stimulation by different concentrations of BCG were assessed.
VD has been shown to play a very important role in innate and acquired immunity against TB. 5 Many studies have reported that VD affects the innate immune response to TB.21–23 DCs are the most important antigen-presenting cells of the immune system and initiate acquired immunity to TB.14,24,25 In vitro and in vivo studies indicate that when DCs phagocytose M. tuberculosis, their biological properties are altered and they begin to express surface co-stimulatory molecules. This process represents the normal process of maturation of DCs as they migrate from peripheral tissues to lymph nodes. DCs in lymph nodes overexpress MHC-I and MHC-II as well as other surface co-stimulatory molecules (CD80, CD86). DCs play a key role in the initiation of CD4+ T cell responses and are important for the initiation of T cell responses to M. tuberculosis. The effects of VD on DCs have been extensively studied.26–28 We found that the percentages of CD86- and CD11c-positive BMDCs were increased in the VD deficient group, while the percentages of cells positive for MHC-I, MHC-II, and CD80 were decreased in the VD deficient group. As the BCG concentration increased, the percentage of MHC II-positive cells in the VD deficient group decreased significantly, while the percentage of MHC II positive cells in the N group changed more slowly. By comparing changes in cell surface molecules between the two groups, we found that the expression of MHC-I, MHC-II, CD80, and CD86 was inhibited as the BCG concentration increased. CD11C is an important marker for identifying BMDCs in mice, and CD86, CD80 and MHC II are costimulatory molecules in differentiated BMDCs. From our results, we conclude that VD can slow the differentiation and maturation of bone marrow-derived cells into DCs induced by M. tuberculosis. Rajashree et al. 14 suggested that reduced MHC II expression and variable CD86 expression are common features of functional impairment occurring in various immunodeficiency models. Penna et al. 26 suggested that 1,25(OH)2D3 can regulate the immune system by inhibiting DC differentiation and maturation into effective antigen-presenting cells and acting on the first step of the immune response. This conclusion is consistent with our findings.
By studying the effects of mycobacteria on DCs, the ability of M. tuberculosis to regulate the early responses of the immune system can be analyzed. DCs are antigen-presenting cells responsible for the generation of primary immune responses and are therefore critical for the induction of polarized effector T cells. The interaction of DCs with naive T cells not only leads to the induction of Th1 or Th2 cells, but also to the induction of regulatory T cells (Tregs). Treg cells comprise a number of T cell subsets that release or express regulatory molecules involved in reducing the apparent inflammatory response to both self and non-self antigens.12,29 Further studies will be performed to better understand the biological significance of our data.
Conclusions
We demonstrated that VD decreased the expression of DC antigen presentation molecules, affecting the phenotype of DCs and likely weakening their antigen-presenting capacity.