
Abstract
Objectives
To investigate the application value of the calcium-suppressed (CaSupp) images of dual-layer detector computed tomography (DLCT) in the evaluation of the temporomandibular joint (TMJ) discs.
Methods
Thirty-three healthy subjects underwent DLCT and magnetic resonance imaging (MRI) examinations. CaSupp images were reconstructed from the spectral-based images using a calcium suppression algorithm. The location, morphology, and thickness of the posterior band of the TMJ discs were evaluated on the oblique sagittal proton-density weighted images and CaSupp images.
Results
Of the 66 TMJ discs, anterior displacement was observed on 9 TMJ discs on MR images and 6 TMJ discs on CaSupp images, and posterior displacement was present on 3 TMJ discs on MR and CaSupp images. No significant difference was observed in TMJ disc displacement between MR images and CaSupp images (P value = 0.730). The TMJ discs without displacement had no significant difference in the thickness of the posterior band between the MR and CaSupp images (P value = 0.401).
Conclusions
The calcium-suppressed technique in DLCT may be a simple and preliminary way to evaluate the TMJ disc displacement and structure.
Keywords
Introduction
The temporomandibular joint (TMJ) is a synovial joint, and comprises the condylar fossa, condyle, disc, articular cavity, and a fibrous capsule. The TMJ disc commonly presents as a biconcave structure and has dense fibrous connective tissue, which can be visualized as a low signal on the proton-density weighted imaging (PDWI) sequence. 1 Other imaging modalities such as conventional computed tomography (CT), cone beam CT, ultrasonography, and conventional radiography can be used to evaluate osseous changes, while the TMJ disc cannot be viewed on these conventional imaging modalities. 2
Although temporomandibular disorder (TMD) is commonly diagnosed by magnetic resonance imaging (MRI), 2 some TMD patients with a contraindication to MRI may be evaluated with a CT scan. In clinical practice, CT arthrography may be used indirectly to observe the TMJ disc by injecting contrast media, which has not been widely applied in routine clinical examinations because of its invasiveness.3,4 Attempts were made to develop a new CT imaging technique to visualize the TMJ disc, and then the spectral CT imaging 5 would provide an important opportunity for the diagnosis of TMD. Until now, common types of spectral CT techniques have included dual-source (DS) CT, single-source fast kilovolt peak–switching (FS) CT, and single-source dual-layered (DL) detector CT, 6 which have been widely used in the clinical diagnosis and evaluation of bowel disease, 7 abdominal and pelvic trauma, 8 thyroid nodules,9,10 gastric cancer, 11 and lung cancer.12,13 The calcium-suppressed (CaSupp) technique (also called virtual non-calcium technique), which is a post-processing technique using spectral-based images, had also been used to visualize the bone marrow edema by removing the calcium components, in the evaluation of acute vertebral compression fractures,14–19 nondisplaced hip fractures, 20 and axial spondyloarthritis. 21 Therefore, it was reasonable to presume that the TMJ disc could be visualized on CaSupp images by removing the calcium components in the articular bone, just as the TMJ disc could be brought out by the contrast media on CT arthrography.
In the current study, we hypothesized that CaSupp DLCT images could assess the morphology and location of the TMJ discs. To address this hypothesis, dual-layer detector computed tomography (DLCT) and MRI scans were performed on 33 subjects. We prospectively evaluated the location, appearance, and the thickness of the posterior band of the TMJ discs on DLCT and MR images.
Methods
Subjects
The subjects were enrolled from the hospital staff and their relatives in March 2019. The inclusion criteria were (1) no trauma history to the TMJ, (2) no history of TMJ disorders, and (3) no contraindication to MRI. The exclusion criteria were (1) claustrophobia, (2) gestation or gestational intention, and (3) MR or CT images with significant artefacts.
This study was approved by the local Ethics Committee, and written informed consent was obtained from all subjects before the study. All of the DLCT and MRI protocols were routinely performed in clinical practice at our hospital in accordance with the relevant guidelines.
Dual-layer CT protocol
All of the CT images were obtained from a DLCT scanner (Spectral IQON, Philips Healthcare, Best, Netherlands). The CT scanning parameters were listed as the following: tube voltage 120 kVp with automated attenuation-based dose modulation, rotation time 0.5 s, pitch 0.359, collimation 64 × 0.625, slice thickness 3 mm, filed of view (FOV) 220 × 220 mm. The subjects only received the CT scan with a closed mouth, and the open mouth position CT scan was not performed in the current study.
Conventional images and spectral base images (SBI) were reconstructed from the same dataset with an axial slice thickness of 0.67 mm and an increment of 0.67 mm. Conventional images were reconstructed using iDose level 2 (Philips Healthcare), and SBI data were reconstructed based on Spectral level 2 (Philips Healthcare).
Calcium-suppressed image reconstruction
Hounsfield unit (HU)-based spectral CT images were generated with a dedicated CaSupp algorithm from the SBI data, which used spectral data to identify and suppress calcium that normally overlays the underlying tissues. In the CaSupp images, voxels containing calcium were removed and showed HU values without calcium contribution to the attenuation. The user has the ability to adjust the suppression index of calcium for better visualization of the lesion or tissue. The suppression index can be set with a range of 25 to 100, with a low index value indicating a low calcium composition weight on the target tissues.
All of the CaSupp images were generated from the SBI data with the same calcium suppression index 60 on an offline platform (Intellispace Portal, Philips Healthcare).
MR protocol
All MR data were obtained from a 3.0T MR system (Ingenia CX, Philips Healthcare). The MR protocols included an axial T2-weighted image (T2WI) with fat saturation and an oblique sagittal proton-density weighted imaging (PDWI) sequence with the closed mouth position. The parameters of the axial T2WI were listed as follows: repetition time 3000 ms, echo time 80 ms, slice thickness 2.5 mm, FOV 25 × 25 cm, Matrix 499 × 377, number of averages 2. The parameters of PDWI were listed as follows: repetition time 2000 ms, echo time 25 ms, slice thickness 3 mm, slice gap 0.3 mm, FOV 15 × 15 cm, Matrix 332 × 288, number of averages 3.
Image analysis
The MR images and CaSupp images were transferred to a Picture Archiving and Communication Systems (PACS) (AnyPacs V2.0, MEDICON DIGITAL ENGINEERING CO.LTD QINGDAO, China) for the visual evaluation. The image preprocessing steps included the following: (1) observing the disc displacement, including anterior or posterior displacement; (2) observing TMJ disc morphology: type I, inverted “S”; type II, thick posterior band; type III, thick anterior band; type IV, thick middle band; (3) measuring the thickness of the posterior band on the middle sagittal image, i.e, the maximal distance perpendicular to the tangent plane of the condyle of TMJ (Figure 1); (4) evaluating the TMJ disc displacement and classifying it according to the position of the disc and the condyle. 22 The observation of TMJ displacement and morphology was evaluated and interpreted by two radiologists, who reached a final consensus through discussion if they had different diagnoses. The radiologists were experienced in TMJ evaluation for more than 5 years, and they were blinded to the clinical history of the subjects. The posterior band was measured three times by one experienced radiologist, and the mean value was the final thickness value.

Measurement of the posterior band of the TMJ disc on the oblique middle sagittal MR image and CaSupp image was defined as the maximal distance (white double arrowheads) perpendicular to the tangent plane (white line) of the condyle of TMJ. A, MR image; B, CaSupp image. MR, magnetic resonance; CaSupp, calcium-suppressed.
Statistical analysis
The quantitative data with a normal distribution were presented as mean±standard deviation, while the non-normally distributing data were expressed as median (lowest value, highest value). The qualitative data were analyzed with a chi-squared test. The comparison of the posterior band thickness was performed with a paired-samples t-test. P < 0.05 was considered statistically significant. The statistical analysis was performed using MedCalc (Version 18.2.1).
Results
Thirty-five subjects were enrolled from the hospital’s staff and their relatives, and underwent the DLCT and MRI examination within 1 week. Two subjects with motion artefacts were excluded from the study, and the remaining 33 subjects were included in this study, including 16 women (mean age 38 ± 12.34 years, age range 20–58 years) and 17 men (median age 29 years [23 years, 73 years]).
Evaluation of the TMJ disc displacement
Anterior displacement (Figure 2) was observed for nine TMJ discs on MR images and for six TMJ discs on CaSupp images, and posterior displacement (Figure 3) for three TMJ discs on MR and CaSupp images. Of the eight TMJ discs with anterior displacement on MR images, two TMJ discs were normal (Figure 4) on the corresponding CaSupp images. The chi-squared test revealed that there was no significant difference between MR images and CaSupp images (chi-squared value = 0.628, P value = 0.730).

The anterior displacement (yellow arrows) of the TMJ disc. A, oblique sagittal proton-density weighted images; B, oblique sagittal CaSupp image; C, CaSupp image overlay on the conventional CT image. CaSupp, calcium-suppressed.

The posterior displacement (yellow arrows) of the TMJ disc. A, oblique sagittal proton-density weighted images; B, oblique sagittal CaSupp image; C, CaSupp image overlay on the conventional CT image. CaSupp, calcium-suppressed.

Anterior displacement of the TMJ disc was observed on the MR image (A) while the TMJ disc presented as normal on the corresponding CaSupp image (B) and fused CaSupp image (C). A, oblique sagittal proton-density weighted images; B, oblique sagittal CaSupp image; C, CaSupp image overlay on the conventional CT image; Yellow arrow, posterior band of the TMJ disc. MR, magnetic resonance; CaSupp, calcium-suppressed.
Observation of the TMJ disc appearance
Of the 54 TMJ discs without displacement, the number of type I, II, and III discs (Figure 5) were 44, 1, and 9 on MR images, and 43, 1, and 10 on CaSupp images, respectively. One TMJ disc presented as type I on MR images yet presented as type III on CaSupp images (Figure 6). The chi-squared test indicated that there was no significant difference among subtypes of TMJ appearances (chi-squared value = 0.064, P value = 0.968).
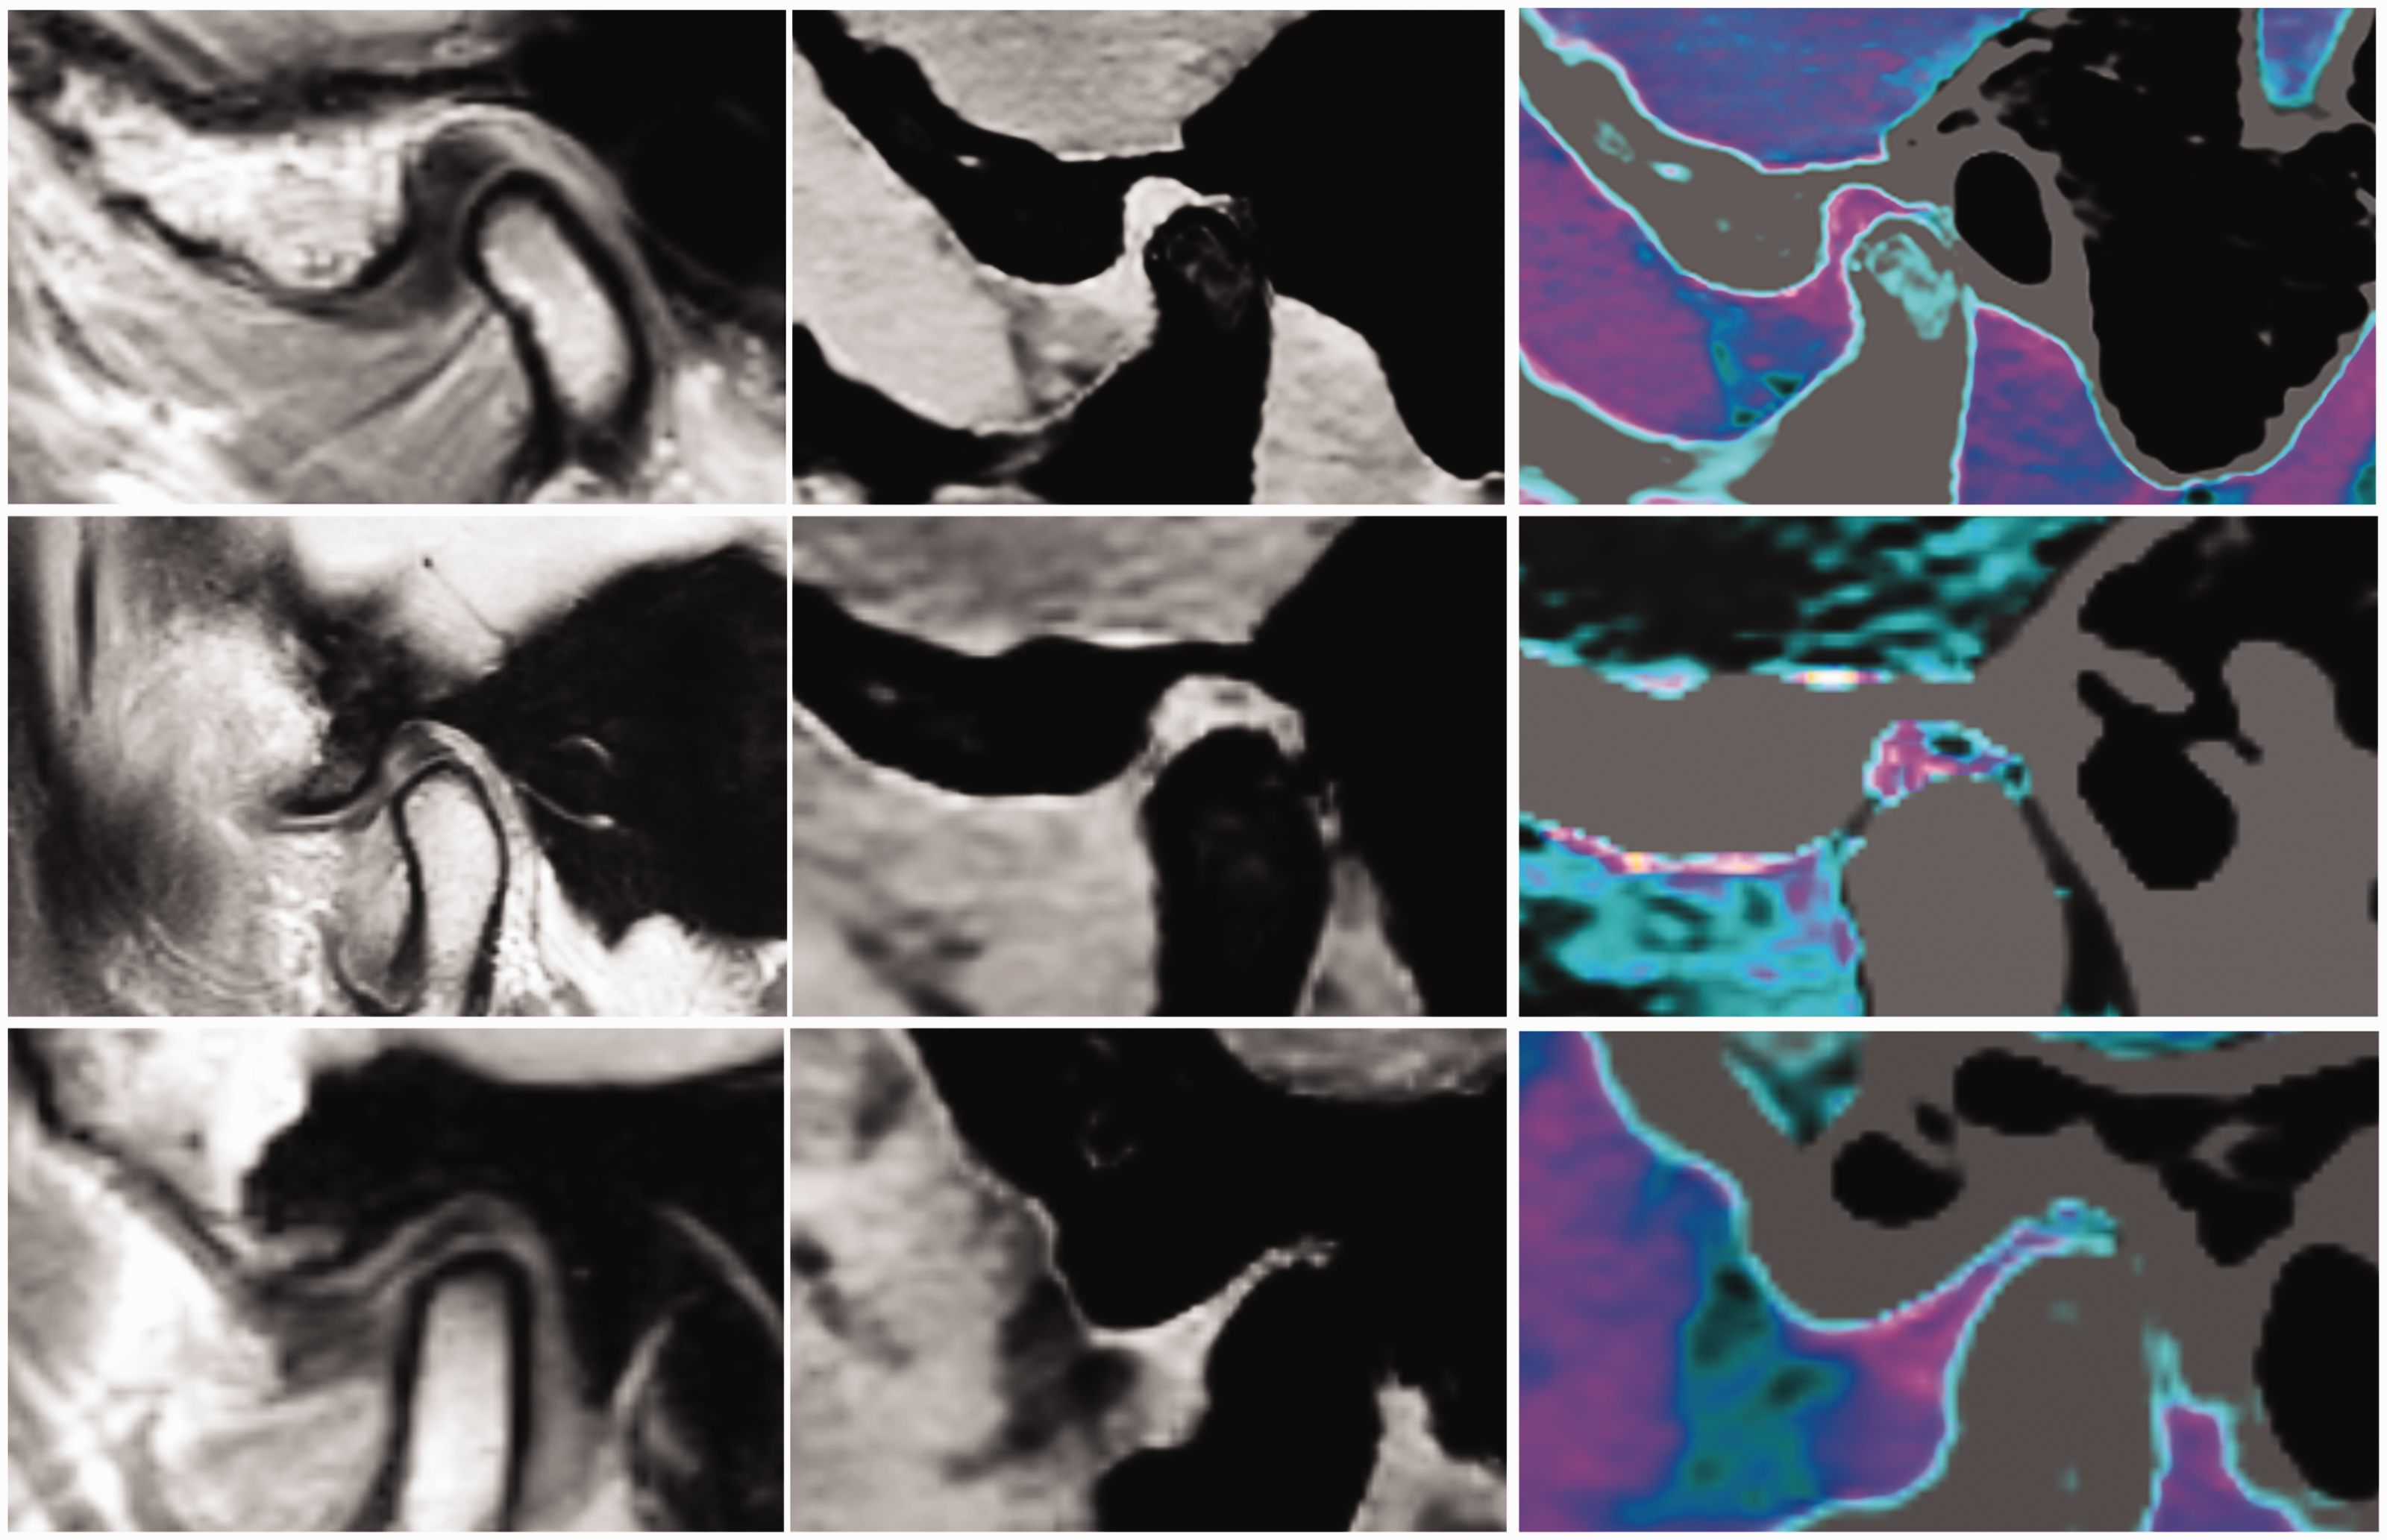
The subtypes of TMJ disc appearance on MR and CaSupp images. Top row, type I; Middle row, type II; Bottom row, type III; Left column, MR images; Middle column, CaSupp images; Right column, fused CaSupp images. MR, magnetic resonance; CaSupp, calcium-suppressed.

The TMJ disc presented as a type I (inverted “S”) on the MR image (A) and presented as a type III (thick anterior band) on the CaSupp image (B and C). A, proton-density weighted images; B, CaSupp image; C, fused CaSupp image; Yellow arrow, posterior band; White arrow, anterior band. MR, magnetic resonance; CaSupp, calcium-suppressed.
Comparison of the posterior band thickness
There was no significant difference in the mean thickness of the posterior band between MR images (2.589 ± 0.685 mm) and CaSupp images (2.618 ± 0.610 mm) (t value = 0.846, P value = 0.401) among the 54 TMJ discs (Figure 7). Excluding 2 TMJ discs with a different morphology on MR and CaSupp images, the remaining 52 TMJ discs were classified into three groups according the disc morphology subtypes: type I, 42 TMJ discs; type II, 1 TMJ disc; type III, 9 TMJ discs. There was no significant difference in posterior band thickness of the type I between MR images (2.819 ± 0.462 mm) and CaSupp images (2.639 ± 0.589 mm) (t value = 1.552, P value = 0.123) among the 42 TMJ discs, while there was a significant difference for the posterior band of the type III between MR images (1.551±0.552 mm) and CaSupp images (2.484 ± 0.752 mm) (t value = 3.164, P value = 0.005) among the 9 TMJ discs. The thickness of the posterior band for one type II TMJ disc was 2.6 mm on MR images and 2.8 mm on CaSupp images.

Comparison of the posterior band. Total TMJ discs included 54 cases; Type I TMJ discs included 43 cases; Type III TMJ discs included 9 cases.
Discussion
The CaSupp technique has been primarily used in clinical practice to evaluate bone marrow edema in vertebral compression fractures15,16,18,19 and axial spondyloarthritis 21 by removing the calcium components. In the current study, the CaSupp technique was also used to evaluate the TMJ disc by suppressing the calcium components on SBI. On CaSupp images, the bone structure was suppressed and showed low density, while the TMD disc remained relatively high density because of the absence of calcium. Compared with the CaSupp images, the bone structure of the TMJ present had high density on conventional CT images, which could influence the observation of the TMJ disc. However, the CaSupp images could overcome this shortage and also had a high spatial resolution (Matrix 584*482 and pixel size 0.4157*0.4157 mm in the current study).
For the CaSupp images, the key point was the calcium-suppressed index (CaSupp-I). In a previous study, CaSupp-I was set as 90 to observe the bone marrow edema for vertebral fractures. 19 Generally, the CaSupp-I can be adjusted from 25 to 100, and the value of CaSupp-I was increased with the calcium component weight increased. 19 In the current study, the CaSupp-I was set as 60, which could optimally present the TMJ disc. From a clinical perspective, the CaSupp images with CaSupp-I 60 also had a good visual assessment of the TMJ disc compared with conventional CT images.
The current study demonstrated that CaSupp images could clearly present the TMJ displacement compared with the gold standard, i.e., the MR PDWI, which suggested that CaSupp images could primarily be used to diagnose the displacement of the TMJ disc. In the patients with anterior displacement of the TMJ disc, there were two TMJ discs that were normal on CaSupp images, which could be related to the acquisition method. CaSupp imaging with a high spatial resolution could be performed with multiplanar reconstruction while MR sagittal PD imaging could not be performed because they were two-dimensional images with a 3-mm slice thickness. Therefore, the CaSupp images could clearly display the TMJ displacement, which might be one advantage of CT CaSupp images. Another reason for the discrepancy was the scanning location. In the MR scans, the oblique sagittal PDWI was generated by the location based on the axial and coronal images, while the DLCT could only generate axial images, and the oblique sagittal images were reconstructed using multiplanar reformation (MPR). The last reason might be that the soft tissue contrast was lower in the CaSupp images than in the MR images, which might impact the observation of the TMJ disc displacement. Posterior displacement of the TMJ disc was rare and not seen in any of the asymptomatic volunteers. 23 However, there were three volunteers with posterior displacement among the enrolled subjects. Therefore, the previous belief that posterior displacement is not present in asymptomatic volunteers may not be true, 23 and this should be explored in large studies in the future. The CaSupp technique would provide well-defined images to evaluate the posterior displacement. In this study, CaSupp images had good consistency with MR images in the judgment of the posterior displacement of the TMJ disc, although only three TMJ discs with posterior displacement were identified in this study.
Among all the TMJ discs, there was no significant difference in the evaluation of the disc appearance between CaSupp images and MR images. Further subtype analysis also revealed that CaSupp images had good consistency for the type I and type III TMJ discs, which suggests that CaSupp images may provide an accurate evaluation of the TMJ disc appearance.
In this study, quantitative analysis was performed to further identify the application value of the CaSupp technique in the evaluation of TMJ discs. The quantitative analysis of the thickness of the posterior band suggested that CaSupp images showed no significant difference compared with MR images among the TMJ discs without displacement. However, further subtype analysis demonstrated that CaSupp was consistent with MR images for type I discs, while a discrepancy for type III discs was present. The reasons for this may be correlated with the thickness of the posterior band. Type III discs had a relatively thin posterior band compared with type I discs, which would cause a relatively high measurement error.
The current study suggests that CaSupp DLCT imaging may be able to be used to evaluate the morphology, displacement, and thickness of the TMJ discs. Further applications in clinical practice should include the following: (1) patients with a contraindication to MRI; (2) patients with TMJ trauma (e.g., fracture) because CaSupp DLCT imaging could be used to evaluate bone fractures and the TMJ disc at the same time; (3) patients with a metal implant in the TMJ region because the metal implant could generate a metal artefact on MRI, which would impact the visual observation of the TMJ disc, while CaSupp DLCT can reduce the metal artefact using the spectral imaging; (4) patients with a lower income because the examination fee for an MRI is 3.75 times higher than that for DLCT for a TMJ examination in our hospital. Therefore, CaSupp DLCT imaging may not only provide a more valuable evaluation of the TMJ disc but may do so at a relatively low medical cost.
There were some limitations of the current study. First, the CaSupp-I was only set as 60, and a more optimal CaSupp-I setting should be investigated in future studies. Second, MR images were two-dimensional images, while CaSupp images were three-dimensional images, which had different spatial resolutions and might influence the evaluation of the TMJ disc. In the future, CaSupp images of the TMJ discs should be compared with three-dimensional MR images. Last, the current study only included healthy volunteers, although some of the subjects had disc displacement of the TMJ, which would cause some weakness in confirming the consistency with MR images in TMD patients. In the future, image enhancement techniques 24 can be performed on CaSupp DLCT images, which may improve the contrast of the TMJ disc.
In conclusion, the CaSupp technique in DLCT may provide a good evaluation of the TMJ disc, and may be considered as a simple and preliminary tool for evaluating the TMJ in clinical practice in the future.