
Abstract
Objective
To explore the correlation between high-resolution computed tomography (HRCT) phenotype and pulmonary function in patients with chronic obstructive pulmonary disease (COPD).
Methods
Fifty-six patients with COPD were retrospectively evaluated using pulmonary function tests (PFTs) and HRCT, and phenotypic pulmonary function parameters were analyzed.
Results
Thirty-one patients were classified as having imaging phenotype A, 11 were phenotype E, and 14 were phenotype M. The total lung capacity (TLC)% of phenotype E was significantly higher than that of phenotypes A and M. The residual volume (RV) to TLC ratio (RV/TLC) in phenotype A was significantly lower than that in phenotypes E and M. The forced expiratory volume in one second percentage (FEV1%) and FEV1/forced vital capacity (FVC) of phenotype A was significantly higher than that of phenotypes E and M.
Conclusion
FEV1/FVC and FEV1% were higher and RV/TLC was lower, indicating less severe emphysema, in patients with phenotype A compared with patients with phenotypes E and M. TLC% of patients with phenotype E was significantly higher than that of patients with phenotypes A and M. The degree of airflow limitation was most severe in patients with phenotype M.
Keywords
Introduction
Chronic obstructive pulmonary disease (COPD) is characterized by progressive and persistent airflow limitation. 1 COPD is a heterogeneous disease 2 that can present with multiple differences in clinical manifestation, physiological changes, and imaging performance. 3 The clinical diagnosis of COPD severity is primarily based on pulmonary function tests (PFTs). However, these indicators do not reflect the complexity of the disease. 4 As a general function test, PFT cannot accurately assess the degree of local pulmonary function damage in patients with heterogeneous emphysema. Although the forced expiratory volume in one second percentage (FEV1%) may be unchanged, clinical manifestations, imaging findings, disease progression, and response to treatment can show significant differences. 5 There are some limitations in the diagnosis and severity classification of COPD based on PFTs. 6 Research has shown 7 that the degree of pulmonary function decline is inconsistent with pathological changes. Han et al. 8 thus proposed the phenotype concept, which implies that “one or more of the characteristics of the disease can reflect the difference between COPD patients and the clinical prognosis (exacerbation of symptoms, response to treatment, rate of disease progression, or death)”. Researchers have subsequently identified many different phenotypes. 9 For example, interactions among clinical phenotype, FEV1 rapid decline phenotype, airway disease and emphysema phenotype, frequent acute exacerbation phenotype, and systemic inflammatory response phenotype have been observed. In recent years, many researchers have attempted to use different phenotypes of COPD to describe and study disease heterogeneity. Computed tomography (CT) is the method of choice for pulmonary modality imaging in COPD patients, and can be used to describe the changes in large and small airways and lung parenchyma in patients with COPD. 10 At present, the main use of CT in COPD is the quantitative analysis of emphysema and the correlation between pulmonary function and pulmonary function. In the present study, pulmonary function parameters observed using high resolution CT (HRCT) were compared and analyzed to determine whether a correlation exists between HRCT phenotype and pulmonary function of COPD.
Methods
Patients
We retrospectively examined data from pulmonary function patients with COPD admitted to the Second People's Hospital of Yunnan Province from December 2014 to August 2016. The data collected included gender, age, and smoking index. Diagnostic criteria for COPD were based on the 2016 Global Initiative for Chronic Obstructive Lung Disease (GOLD). 11 The exclusion criteria were as follows: pulmonary function indicative of a restrictive ventilation function obstacle; bronchiectasis, active pulmonary tuberculosis, bronchial asthma, lung tumor, diffuse lung, or history of recurrent left heart failure; signs of pneumonia, lung abscess, active pulmonary tuberculosis, bronchiectasis, lung cancer, lung consolidation, diffuse lung, pleural effusion, pneumothorax, pleural disease, or thoracic malformation as observed by CT scanning. Patients underwent PFT and HRCT within 3 days of admission. All patients provided written informed consent for their data to be retrospectively included in this analysis. This protocol was approved by the Hospital Scientific Research Ethics and Medical Ethics Committee.
Pulmonary function examination
Pulmonary function parameters were routinely determined using a MasterScreen system (Jaeger, Wurzburg, Germany) and included total lung capacity (TLC), forced vital capacity (FVC), FEV1%, and forced expiratory volume in one second of the forced vital capacity (FEV1/FVC).
Chest HRCT examination and image analysis
Prior to HRCT scanning, patients underwent breathing training to optimize the measurement of maximum inspiration. Scanning parameters included spiral scanning mode, 0.5 × 64 row, pitch of 1.484, and acquisition thickness of 0.5 mm. At the end of inhalation, conventional scanning was used with parameters of 120 kV and 50 mA. Image data were captured on a PACS workstation using the medical professional vertical screen (resolution 3M, Kortrijk, Belgium) and analyzed using a high-resolution bone algorithm with a lung window width of 1,250 Hu to evaluate the degree of emphysema and bronchial wall thickness, for which average values were obtained. The three dimensions of the upper, middle, and lower lobes were observed and measured at 1 cm of the aortic arch, 1 cm below the carina level, and 3 cm on the right side, respectively. Local magnification was 2.5×, and morphological changes in the small bronchi with a diameter of 2 to 4 mm in the extrahilar sub-segment were observed in detail.
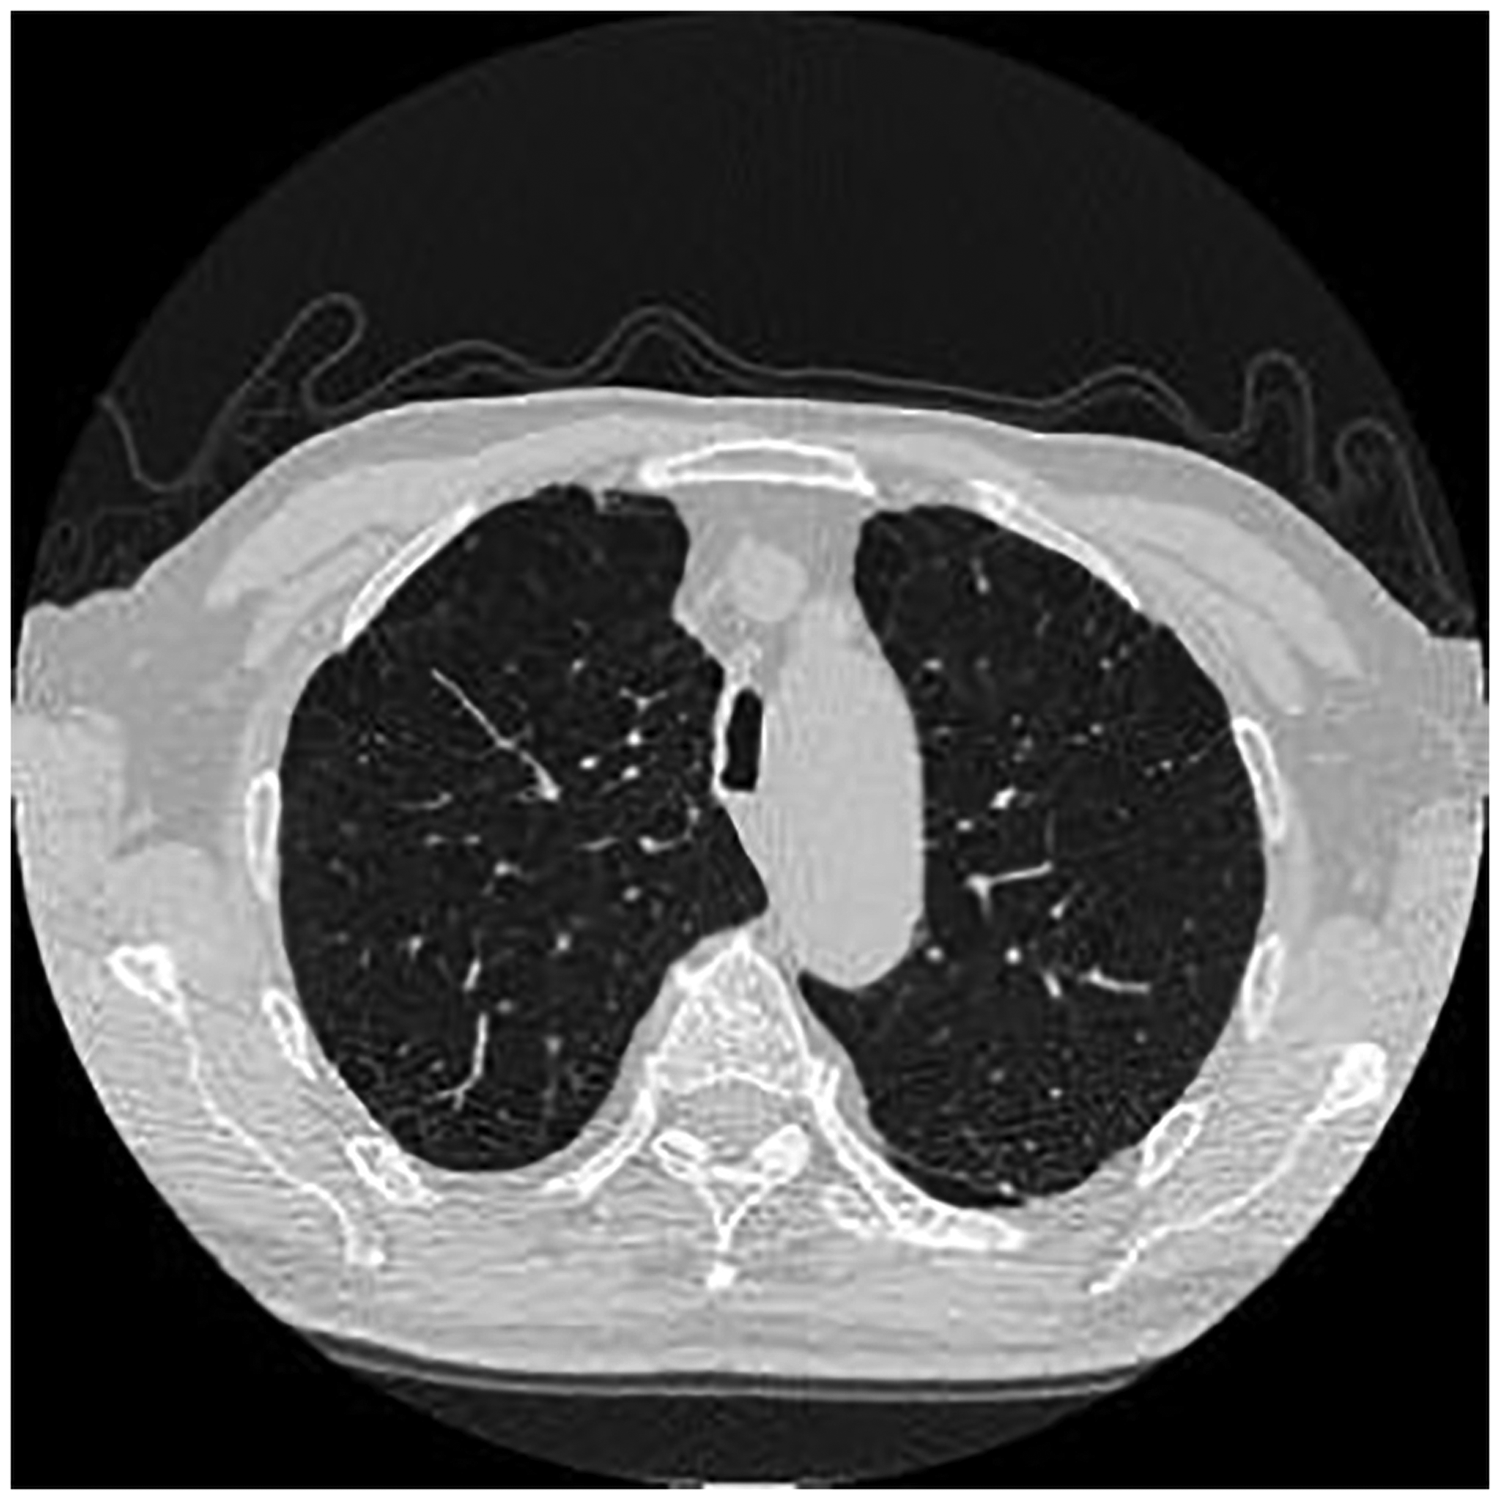
The area of pulmonary emphysema in the bilateral lung field was evaluated using the visual subjective semi-quantitative method. The ratio of bronchial wall thickness to adjacent pulmonary artery diameter was measured, and imaging classification of COPD 12 was as follows: phenotype A, no or mild emphysema (range: <25%), regardless of the presence of bronchial wall thickening (Figure 1); phenotype E, obvious emphysema (range: >50%) without bronchial wall thickening (Figure 2); and phenotype M, simultaneous presence of emphysema (range: >50%) with bronchial wall thickening (Figure 3). Two chest radiologists performed the COPD classification, and differences in opinion were discussed until a consensus was reached.

Phenotype A. Representative image with resolution 512 × 512.
Phenotype E. Representative image with resolution 512 × 512.

Phenotype M. Representative image with resolution 512 × 512.
Statistical method
SPSS 20.0 statistical software (SPSS Ltd., Chicago, IL, USA) was used for data processing. Analysis of variance for normally distributed measurements was used for a complete random data design. Measurement data were expressed as mean ± standard deviation and count data were expressed as rate and constituent ratio. Count data were analyzed using a chi square test. Where the number of cases was <5, a corrected chi square test was used. Correlation analysis was performed using Pearson correlation analysis. Inter-observer agreement was evaluated using a Kappa test. A least significant different (LSD) test was used for comparisons. Values of P < 0.05 were considered statistically significant.
Results
Phenotypic pulmonary function parameters
We identified 56 eligible patients, of which 31 (55.35%) had phenotype A, 11 (19.64%) had phenotype E, and 14 (25.00%) had phenotype M. For TLC%, phenotype A had a mean value of 110.84 ± 6.62, while phenotype E and M had a mean value of 125.89 ± 8.20 and 112.08 ± 5.94, respectively. The variance analysis of the random design data was statistically significant (P < 0.001). Phenotype E clearly had the highest TLC% compared with phenotypes A and M. The differences between phenotypes A and E and between phenotypes M and E were statistically significant. However, the difference between phenotypes A and M was not statistically significant.
For RV/TLC, phenotype A had a mean value of 45.73 ± 4.80, while phenotype E and M had a mean value of 55.39 ± 6.98 and 55.28 ± 4.59, respectively. The variance analysis of the complete random data design was statistically significant (P < 0.001), and RV/TLC in phenotype A was clearly lower than that in phenotypes E and M. For FEV1%, phenotype A had a mean value of 63.6 ± 13.02, while phenotype E and M had a mean value of 46.1 ± 17.96 and 48.2 ± 15.28, respectively. The variance analysis of the complete random data design was statistically significant (P = 0.001), and FEV1% in phenotype A was higher than that in phenotypes E and M. Furthermore, in the LSD-t of the pairwise comparison among phenotypes, there was no significant difference among the phenotypes, except for phenotype A when compared with phenotypes E and M. Phenotype lung function parameters. TLC, total lung capacity; RV/TLC, residual volume to TLC ratio; FEV1%, forced expiratory volume in one second percentage; FEV1/FVC, forced expiratory volume in one second of the forced vital capacity.

Correlation between imaging phenotype and lung function GOLD indexing
For phenotype A, there were 5 cases of GOLD I, 21 cases of GOLD II, 4 cases of GOLD III, and 1 case of GOLD IV. For phenotype E, there was 1 case of GOLD I, 2 cases of GOLD II, 6 cases of GOLD III, and 2 cases of GOLD IV. For phenotype M, there was 1 case of GOLD I, 3 cases of GOLD II, 8 cases of GOLD III, and 2 cases of GOLD IV. The differences between the three phenotypes were statistically significant (P = 0.006). The GOLD subgroup of moderate patients accounted for 67.7% of patients with phenotype A (21/31), while the severe subgroup accounted for 54.5% of phenotype E patients (6/11) and 57 % of patients with phenotype M (8/14) (Table 2).
Imaging phenotype and GOLD indexing.

GOLD, Global Initiative for Chronic Obstructive Lung Disease.
Discussion
COPD is characterized by airway obstruction (airway disease) and lung tissue damage (emphysema), 13 and characteristic pathological changes can be observed in the central and peripheral airways, lung parenchyma, and pulmonary vessels to varying extents in affected individuals. Multiple studies conducted 14 over the past 30 years have confirmed that luminal stenosis (airway remodeling) caused by small airway inflammation and scars is the most important cause of airflow limitation in COPD, and that variations in the range of pulmonary elastic retraction of the lung parenchymal destruction (emphysema) is a factor that clearly contributes to COPD. In the pathological form, some cases of severe emphysema present with or without bronchial wall thickening, while in other cases without significant emphysema, serious irreversible bronchial wall thickening or (and) lumen narrowing are present. 15 Thus, COPD cannot be considered simply an irreversible airflow-limited disease.
At present, PFT to determine the degree of airflow obstruction is the gold standard at present for the diagnosis of COPD. For COPD diagnosis and classification of lung function according to the FEV1/FVC and FEV1%, respectively, the clinical basis of clinical symptoms and PFTs are determined to assess the severity of the disease. A FEV1/FVC of <70% indicates that the airflow is limited, and that the obstruction may not be completely reversed. The severity of COPD can be divided into four grades according to the decrease in FEV1%. In clinical practice, however, there are some limitations to this approach. PFT results can be influenced by a number of factors, including a lack of patient cooperation during the PFT, declining physiological lung function in older adults, and inability of some critically ill patients to tolerate PFTs. In addition, pulmonary function indicators such as FEV1 do not fully reflect the pathological characteristics of COPD in patients with ventilation disorders. Patients with FEV1/FVC abnormalities frequently have irreversible airway damage. As a general function test, PFTs can accurately assess the distribution of uneven pulmonary emphysema and the degree of local lung damage. These factors are based on PFT data on COPD diagnosis and severity classification, which have some limitations. 6 Therefore, accurate evaluation of the changes in a patient’s emphysema and bronchial wall thickening cannot be achieved by simply conducting a lung function test and other comprehensive assessment methods. Hence, there is a need for improved detection methods.
The 2011 Spanish COPD Guide 16 was the first to indicate that treatment should be guided according to the phenotype and clinical characteristics of the patient, rather than being simply based on the severity of airflow limitation, and that COPD phenotypes are closely correlated to clinical outcomes. Han et al. 8 defined “phenotype” as a single or multiple disease characterized by differences between patients with COPD, which are associated with clinical outcomes (symptoms, increased disease, response to treatment, progression of disease, or death). At present, COPD phenotypic classification is mainly focused on clinical treatment and prognosis, but could potentially include the following: multidimensional index classification, classification of imaging characteristics, prognostic classification, physiological manifestation, frequent acute exacerbation, pathologic classification, and other factors. 17
Researchers have found 14 that airway remodeling in patients with COPD results in thickening of the bronchial wall. Hence, the thickness of the bronchial wall can be measured using HRCT, and the degree of emphysema quantified to reveal early changes in lung structure before the appearance of symptoms. This finding confirms that thickening of the bronchial wall is associated with pathological changes. 2 In the present study, 56 patients with COPD were phenotypically classified according to the degree of emphysema and bronchial wall thickness using HRCT. For phenotype A, with no emphysema or mild emphysema with or without bronchial wall thickening, there were 31 cases, while there were 11 cases of phenotype E, classified as emphysema without bronchial wall thickening. There were 14 cases of phenotype M, pulmonary emphysema with bronchial wall thickening. The majority of phenotype A patients were GOLD grade I, accounting for 67.7% (21/31) of the group. The majority of phenotype E patients were GOLD grade III, accounting for 54.5% (6/11), while for phenotype M, most patients were GOLD grade III, accounting for 57.1% (8/14). These findings suggest that patients with phenotype A were in the early stage of the disease and had mild symptoms, while patients with phenotypes E and M were more likely to develop disease progression compared with patients having phenotype A.
The present study shows that phenotype E and M patients with emphysema had higher RV/TLC compared with phenotype A patients, which is in accordance with the HRCT phenotype definition. However, there was no significant difference in FEV1/FVC, FEV1%, and RV/TLC between the phenotype E and M patients, indicating that the difference between these two cases was not caused by destruction of the lung parenchyma. However, the small airway bronchus thickening of the wall was not apparent in HRCT. Hence, compared with phenotype M patients, the decreased pulmonary function in phenotype E patients may be correlated to the decline in alveolar elastic retraction force. Thus, in the same group of COPD patients using the same indicators of lung function, different pathological changes can be observed. This finding is consistent with previous research. 14
In the present study, FEV1/FVC and FEV1% differed in patients with COPD according to the degree of emphysema and bronchial wall thickening. FEV1/FVC and FEV1% in phenotype A patients were significantly higher than in phenotype E and M patients. This indicates that the degree of airflow in patients with phenotype A was less severe and RV/TLC was lower than in the other two phenotypes, and that the degree of emphysema was therefore milder. Furthermore, this finding shows that the reduction in lung function in patients with phenotype A was less severe than that in the other two phenotypes. Furthermore, RV/TLC, an indicator of air flow retention, was higher for phenotypes E and M than for phenotype A. The TLC% for phenotype E (125.89 ± 8.20) was significantly higher than that for phenotype A (110.84 ± 6.62) and phenotype M (112.08 ± 5.94), indicating obvious emphysema in phenotype E. These results support the classification of COPD by phenotype.
The present study had several limitations. The use of manual measurement of the degree of bronchial wall thickening meant that the results were more subjective. Furthermore, our study population included more phenotype A patients than phenotype E and M patients, which may have affected the analysis. Finally, given the retrospective nature of this analysis, it was not possible to compare data from assessments performed before and after the treatment of patients. Further research is therefore needed to determine how different phenotypes respond to treatment.
Conclusion
HRCT can accurately reflect lung structure and pathological changes. Particularly in patients with no/mild or asymptomatic emphysema, an early and quantitative diagnosis can be achieved using HRCT, allowing for the intuitive evaluation of lung tissue morphology and function as well as a comprehensive assessment of the disease and prognosis.