
Abstract
Objective
To investigate the underlying functional network brain-activity changes in patients with adult comitant exotropia strabismus (CES) and the relationship with clinical features using the voxel-wise degree centrality (DC) method.
Methods
A total of 30 patients with CES (17 men, 13 women), and 30 healthy controls (HCs; 17 men, 13 women) matched in age, sex, and education level participated in the study. DC was used to evaluate spontaneous brain activity. Receiver operating characteristic (ROC) curve analysis was conducted to distinguish CESs from HCs. The relationship between mean DC values in various brain regions and behavioral performance was examined with correlation analysis.
Results
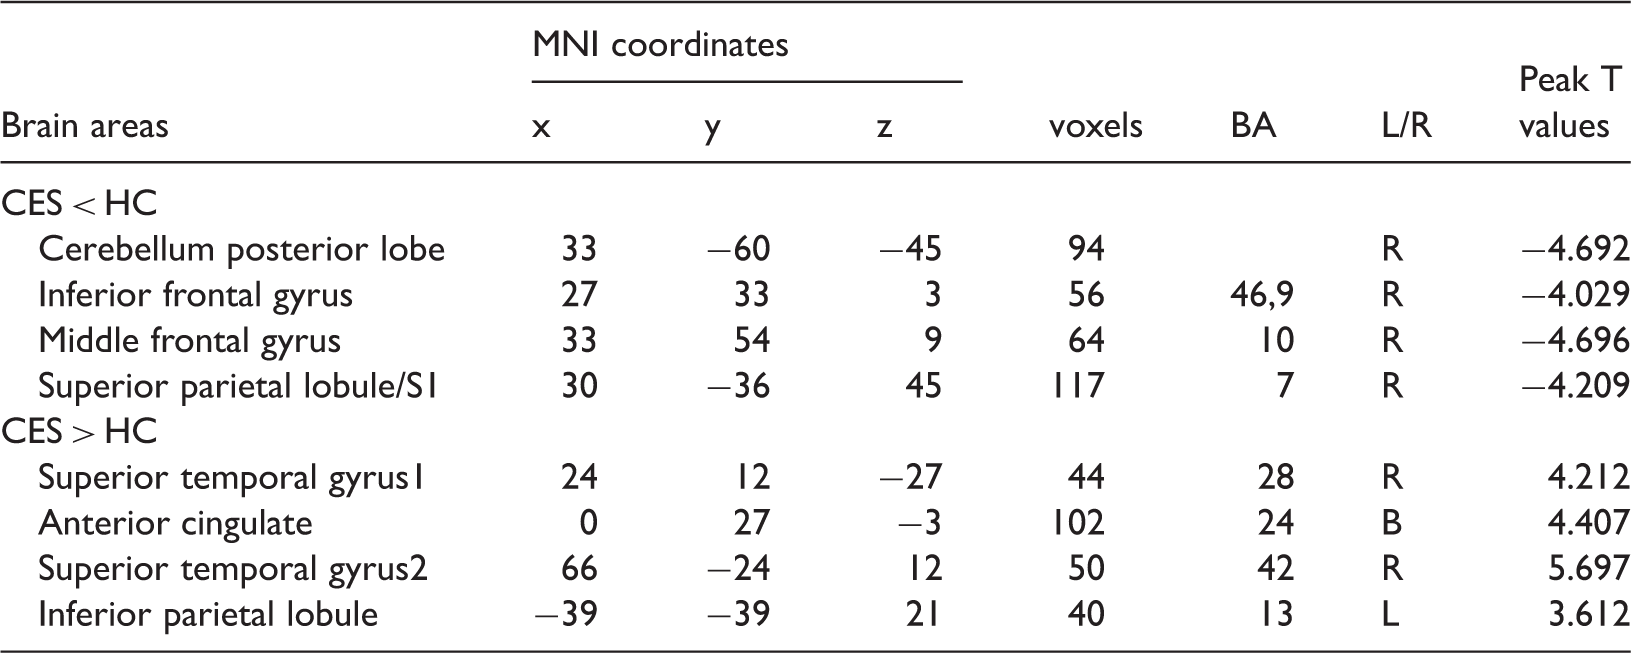
Compared with HCs, CES patients exhibited decreased DC values in the right cerebellum posterior lobe, right inferior frontal gyrus, right middle frontal gyrus and right superior parietal lobule/primary somatosensory cortex (S1), and increased DC values in the right superior temporal gyrus, bilateral anterior cingulate, right superior temporal gyrus, and left inferior parietal lobule. However, there was no correlation between mean DC values and behavioral performance in any brain regions.
Conclusions
Adult comitant exotropia strabismus is associated with abnormal brain network activity in various brain regions, possibly reflecting the pathological mechanisms of ocular motility disorders in CES.
Introduction
Strabismus is a common ocular motility disorder, with a prevalence at birth of 3.55% in Asian children. 1 Exotropia is the major type of strabismus in Iran. 2 Exotropia is often accompanied by amblyopia, and can lead to the impairment of binocular vision.3,4 Clinically, strabismus can be loosely classified into comitant and incomitant strabismus, and surgery is currently the most common treatment for the disorder.5,6
Ocular muscle abnormality is a common cause of strabismus. Defects of extraocular muscle pulleys (EOM) contribute to the onset of incomitant strabismus. 7 In addition, incomitant strabismus is often concurrent with the instability of rectus pulleys. 8 Anomalous extraocular muscles may also lead to vertical strabismus. 9 Neuronal activity within the oculomotor brain regions plays an important role in eye movement. The frontal eye field (FEF) is involved in eye movement control. 10 Moreover, the FEF may also be involved in conjugating eye movements. 11 A previous study reported that the gray matter volume of the FEF was increased in adult strabismus. 12 Thus, strabismus is not only accompanied by abnormal eye muscle function, but is also associated with dysfunction of oculomotor centers in the brain.
Functional magnetic resonance imaging (fMRI) has been successfully used for studying strabismus. One previous study reported that metabolic activity in ocular dominance columns was reduced in infantile monkeys with strabismus. 13 Another study reported that primary visual cortex activity was suppressed in patients with strabismus. 14 Moreover, another group demonstrated that there was lower fractional anisotropy (FA) in the middle occipital gyrus in strabismus patients. Although these studies showed morphological changes in the neurons of patients with strabismus, neuro-mechanical changes in comitant strabismus are still unclear. 15
Many previous studies have demonstrated that the brain consists of complex large-scale networks characterized by interregional interactions16,17 Voxel-wise degree centrality (DC) measures the network architecture of functional connectivity (FC) within the human brain connectome at the voxel level. 18 Unlike amplitude of low-frequency fluctuation (ALFF)19–23 and regional homogeneity (ReHo) techniques, 24 the DC method does not require the definition of regions of interest (ROIs). Thus, DC is a better network metric than other measurements because it counts the number of direct connections for a given voxel in a network and reflects its functional connectivity within the brain network without requiring a priori selection. The DC method has been successfully used to examine the neural pathological mechanisms of many diseases, including autism 17 and Parkinson’s disease. 25 In the current study, we examined functional network brain-activity changes in patients with CES and their relationship with clinical features.
Materials and methods
Subjects
A total of 30 adult patients (17 men, 13 women) with CES were recruited from the Ophthalmology Department of the First Affiliated Hospital of Nanchang University Hospital in Jiang Xi province of China. The criteria for CES included: 1) exotropia with uncorrected or corrected visual acuity (VA) > 1.0; and 2) the deflection angles of the strabismus group were equal. The exclusion criteria included: 1) acquired strabismus, incomitant strabismus; 2) conditions of eye diseases, trauma, or eye surgery; 3) conditions of psychiatric disorders (depressive disorder, delusional disorder), diabetes, cardiovascular disease, cerebral disease (cerebral hemorrhage, cerebral infarction, cerebral vascular malformation). In addition, we recruited 30 volunteers from Nanchang in Jiangxi province in China as healthy controls (HCs; 17 men, 13 women) with a similar age range, sex ratio, and education status. All HCs met the following criteria: 1) no ocular disease; 2) no psychiatric disease (depressive disorder, delusional disorder); and 3) ability to undergo MRI scanning (e.g., no metal devices in the body).
All research methods complied with the declaration of Helsinki. All subjects participated voluntarily, and were informed about the purpose, content, and risks of the study before providing written consent.
MRI data acquisition
All MRI data were collected on a Siemens Trio 3.0 T scanner with an 8-channel phased-array head coil. All subjects underwent MRI scanning. The MRI scanning parameters were based on those reported in a previous study. 26
fMRI data preprocessing
All functional data were pre-filtered with MRIcro (www.MRIcro.com) and preprocessed using SPM8 (http://www.fil.ion.ucl.ac.uk/spm), DPARSFA (http://rfmri.org/DPARSF) and the Resting-state Data Analysis Toolkit (REST; http://www.restfmri.net). More details of the data preprocessing were described in a previous study. 23
Using the DPARSF toolbox, the values of voxel-specific frame-wise displacement (FDvox) and voxel-specific total displacement (TDvox) values for each subject were calculated. Group differences of the mean FDvox were compared with a two-sample t-test.
Degree centrality
Based on the individual voxel-wise functional network, DC was calculated by counting the number of significant supra-threshold correlations (or the degree of the binary adjacency matrix) for each subject. The voxel-wise DC map for each individual was converted into a z-score map using the following equation: 18
Zi = DCi – mean (DC of all voxels in brain mask)/std (DC of all voxels in brain mask)
Statistical analysis
The difference in clinical manifestations between the CES and HCs was assessed with independent two-sample t-tests using SPSS 19.0 software (IBM, Armonk, NY). A general linear model (GLM) analysis was performed with the SPM8 toolkit to investigate the group differences in DC values between CES patients and HCs (significance level of P < 0.05, Gaussian random field [GRF] theory corrected). The relationship between mean DC values and behavioral performance was calculated using correlation analysis.
Brain-behavior correlation analysis
Clinical data of CES patients were collected, including the duration of CES and best-corrected VA of both eyes in all subjects using a logarithmic visual acuity chart. A correlation analysis was performed to evaluate the relationship between the mean DC values in different brain regions and the related clinical features in the CES group (significance level of P < 0.05).
Clinical data analysis
For behavioral performance, two-sample Student’s t-tests were used to analyze continuous data (significance level of P < 0.05). IBM SPSS for Windows, version 20.0 (IBM Corp.; Armonk, NY, USA) was used for the statistical analysis.
Results
Demographics and visual measurements
Demographics and clinical measures by group.

DC differences
Using spatial distribution maps, similar spatial distributions of the functional hubs (high DC) were identified in the two groups. Compared with HCs, CES patients exhibited significantly decreased DC values in the in the right cerebellum posterior lobe, right inferior frontal gyrus, right middle frontal gyrus and right superior parietal lobule/S1, and significantly increased DC values in the right superior temporal gyrus, bilateral anterior cingulate, right superior temporal gyrus, and left inferior parietal lobule (voxel P < 0.01 and cluster-level P < 0.05, GRF correction) (Figure 1 and Table 2). Figure 2 shows the mean values of altered DC between CES patients and HCs (voxel P < 0.01 and cluster-level P < 0.05, GRF correction). In the CES group, there was no significant correlation between mean DC values in any brain region and behavioral performance (P > 0.05).
Voxel-wise comparison of DC in the CES and HC groups. Significant differences in DC were observed in the right cerebellum posterior lobe, right inferior frontal gyrus, right middle frontal gyrus, right superior parietal lobule/S1, right superior temporal gyrus1, bilateral anterior cingulate, right superior temporal gyrus2 and left inferior parietal lobule. The red areas denote higher DC values, the blue indicates lower DC values. (P < 0.05 for multiple comparisons using Gaussian Random Field (GRF) theory (z > 2.3, cluster-wise P < 0.05 corrected). Brain regions with significant differences in DC between CES patients and HCs. The mean of altered DC values between the CES patients and HCs.

Receiver operating characteristic curve
We identified brain regions with different DC values between the CES and HC groups, which could be utilized as markers to separate CES from HCs. The areas under the curve (AUCs) were as follows: right superior temporal gyrus1 (0.711), bilateral anterior cingulate (0.728) (CESs > HCs) (Figure 3(a)), and primary somatosensory cortex/S1 (0.704) (CESs < HCs) (Figure 3(b)).
ROC curve analysis of the mean DC values for altered brain regions.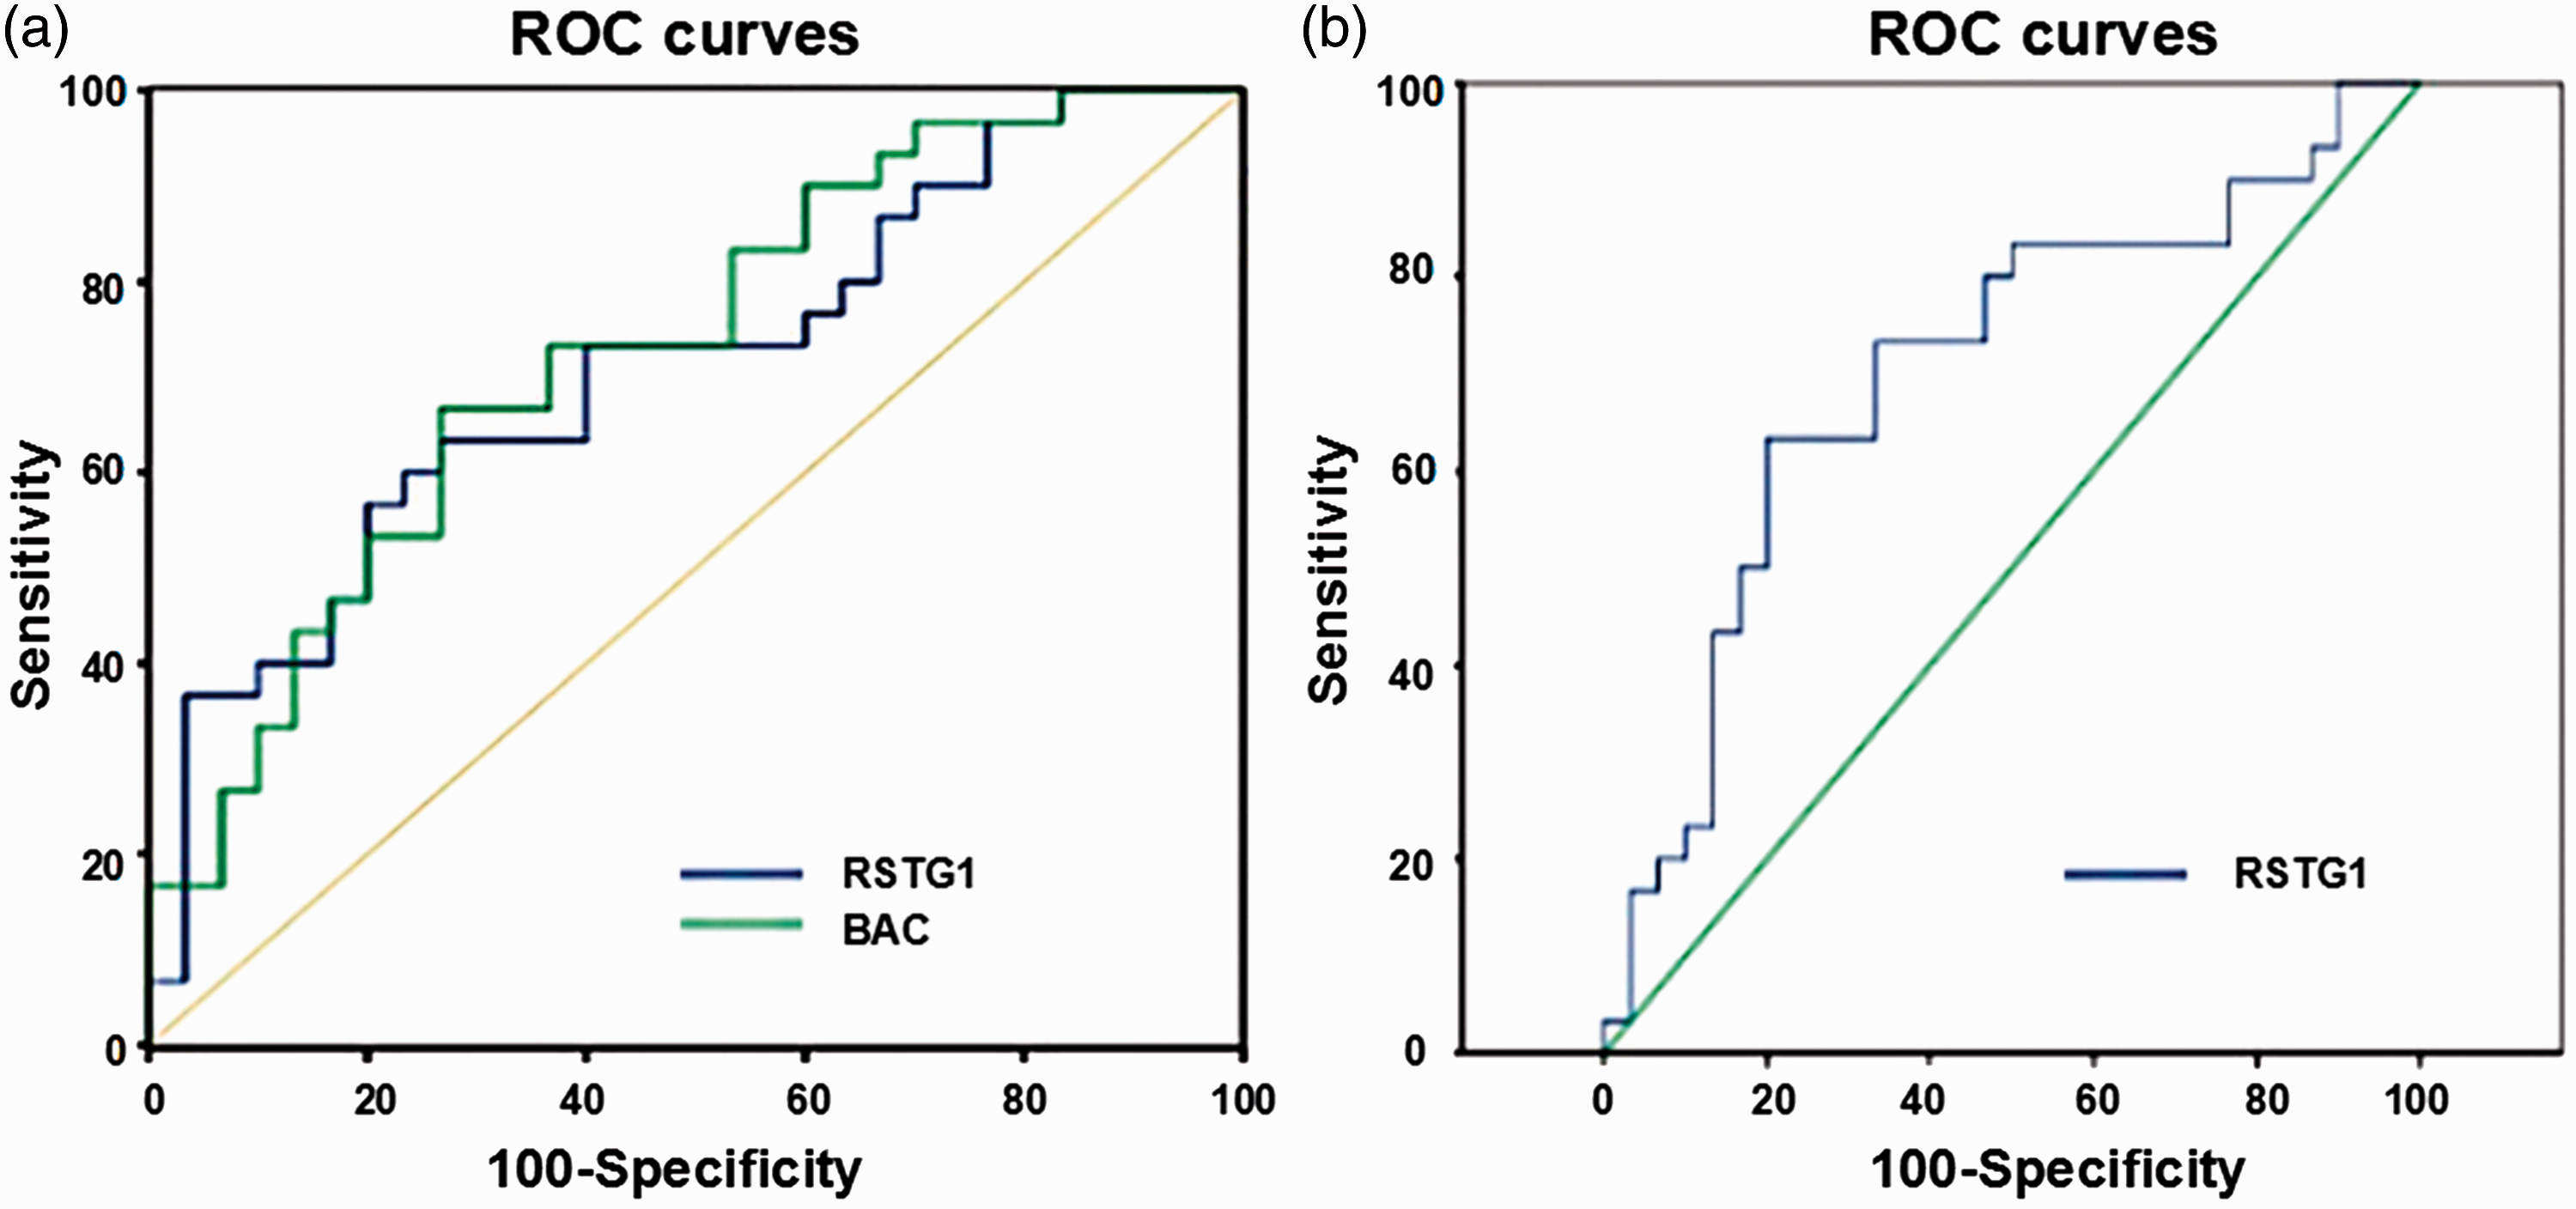
Discussion
To our knowledge, the current study is the first investigation of the effects of adult CES on functional network brain-activity changes using the DC method. Compared with HCs, adult CES patients exhibited significantly decreased DC values in the right cerebellum posterior lobe, right inferior frontal gyrus, right middle frontal gyrus and right superior parietal lobule/S1; and significantly increased DC values in the right superior temporal gyrus, bilateral anterior cingulate, right superior temporal gyrus, and left inferior parietal lobule.
Analysis of the decreased DC values in adult CES
The cerebellum posterior lobe is involved in motor coordination, and is reported to be responsible for the execution of accurate eye movements. 27 One previous study reported that the oculomotor vermis of the cerebellar cortex plays an important role in saccadic eye movements in monkeys. 28 Another study reported that the posterior interposed nucleus (PIN) in the cerebellum is involved in conjugating eye movements in strabismic monkeys. 29 A previous study in our lab revealed that patients with comitant strabismus exhibited increased amplitude of low-frequency fluctuation and regional homogeneity values in the bilateral cerebellum posterior lobe.30,31 Consistent with these findings, in the current study we observed lower DC values in the cerebellum posterior lobe of patients with CES. This suggests that CES may lead to dysfunction in the cerebellum posterior lobe, and that the impairment of ocular movement may correlate with abnormalities of the cerebellum posterior lobe in CES patients.
The frontal eye field (FEF) is located in the posterior part of the middle frontal gyrus, 32 which is mainly involved in the execution of eye movements. 33 Previous studies demonstrated that the FEF controls saccade modulation 34 and triggers the generation of saccade movements. 35 Additionally, FEF activity has been observed during visual search. 36 One previous study showed that the FEF, together with area V4, was active during visual search in monkeys. 37 Meanwhile, FEF lesions can lead to ocular movement disorders. 38 Yang reported that white matter volume in the right frontal gyrus was reduced in patients with infantile esotropia. 39 Moreover, our previous study showed that patients with comitant strabismus had significantly decreased amplitude of low-frequency fluctuation values in the bilateral medial frontal gyrus. 30 In accord with these previous findings, the current results showed that CES patients had significantly decreased DC values in the right middle frontal gyrus, which may reflect the dysfunction of the middle frontal gyrus in CES. We speculatively suggest that decreased DC values in the middle frontal gyrus may explain eye movement dysfunction in CES patients.
The superior parietal lobule is located in front of the postcentral sulcus, which includes Brodmann areas 5 and 7. Previous studies demonstrated that the SPL is responsible for transmitting visual information to the frontal lobe, 40 which controls visuo-motor integration. 41 Additionally, the SPL encodes visual and proprioceptive targets, 42 and plays a vital role in body position. 43 The SPL may be involved in redirected saccades and guided saccades. 44 In the current study, we found that CES patients exhibited significantly decreased DC values in the SPL. CES may lead to the dysfunction of the SPL, which may explain the dysfunction of eye movement in CES patients.
The primary somatosensory cortex (S1) is involved in the sensation of pain, 45 and is activated by the experience of touch. 46 Additionally, a previous study reported that the S1 contains neurons that transmit the eye position signal in monkey. 47 In the current study, we found significantly decreased DC values in the S1 in patients with CES. We speculate that CES patients may have exhibited dysfunction in the S1, potentially reflecting an impairment of the eye position sensory system in CES.
Analysis of the increased DC values in adult CES
The anterior cingulate cortex (ACC) is located in front of the cingulate cortex, and is responsible for many functions, such as mood regulation, 48 pain sensation 49 and cognition. 50 The ACC is also in charge of eye movement control. 51 Previous studies have demonstrated that the ACC is involved in saccadic movements. 52 The current results revealed significantly higher DC values in the ACC in patients with CES compared with HCs. These findings suggest that CES might cause dysfunction of the ACC.
The superior temporal gyrus is located in the temporal lobe, which is involved in the comprehension of language, 53 auditory-visual processing 54 and short-term memory. 55 In addition, previous studies have suggested that STG dysfunction may be related to a range of diseases such as schizophrenia, 56 psychosis 57 and Alzheimer’s disease. 58 In the current study, we found that the DC values in the STG were significantly higher in patients with CES, suggesting that CES may lead to the abnormalities in the STG.
Conclusion
Overall, the current results showed abnormal spontaneous activities in many brain regions in CES patients, which may be involved in the pathological mechanisms underlying ocular motility dysfunction in CES.
Prospects and limitations
The DC method is a useful technique for monitoring whole-brain activity in vivo. Moreover, as a type of rs-fMRI, the DC method can be performed in the resting state. However, the current study involved several limitations that should be considered. First, the time course of the disease differed between CES patients, which may have affected the accuracy of the results. Second, minor head movements during scanning in some subjects may have affected the scanning results.
Footnotes
Declaration of conflicting interests
The authors declare that there is no conflict of interest.
Funding
The authors disclosed receipt of the following financial support for the research, authorship, and/or publication of this article: This study was supported by the Natural Science Foundation of China (No: 81660158, 81160118, 81160148, 81460092, 81400372, 81400424); Jiangxi Province Voyage Project (No: 2014022); Natural Science Key Project of Jiangxi Province (No: 20161ACB21017); Youth Science Foundation of Jiangxi Province (No: 20151BAB215016); Key Research Development Foundation of Jiangxi Province(No: 20151BBG70223); Key Education Department Foundation of Jiangxi Province (No: GJJ160020); Education Department Foundation of Jiangxi Province (No: GJJ160122); Health Development Planning Commission Science Foundation of Jiangxi Province(No: 20164017, 20175115, 20175116); Health Development Planning Commission TCM Science Foundation of Jiangxi Province (No: 20150823).