
Abstract
Objective
To evaluate the impact of the peritoneal glucose load (PGL) on hydration status and inflammation in peritoneal dialysis (PD) patients.
Methods
This cross-sectional study evaluated stable PD patients using a novel PGL index (PGLI), which was calculated as the net glucose content (g) in the PD solutions administered in the daily PD prescription divided by the dry body weight (kg) assessed by whole-body bioimpedance spectroscopy. The relationship between PGLI and glycosylated haemoglobin (HbA1c), fluid overload (FO), and inflammatory markers was investigated.
Results
A total of 43 stable PD patients participated in the study. Significant positive correlations were found between PGLI and HbA1c, FO, plasma high sensitivity C-reactive protein (hsCRP), and plasma interleukin-6 (IL-6) levels. HbA1c, FO, plasma hsCRP and plasma IL-6 levels were significantly higher in patients with PGLI >3 g/kg/day compared with those with PGLI ≤3 g/kg/day.
Conclusions
PGLI values >3 g/kg/day may be associated with poor glycaemic control, over hydration and augmented inflammation. PGLI might be a useful tool for the quantitative assessment of the PGL and could be applied when managing PD patients.
Introduction
Peritoneal glucose load (PGL) contributes to the development of cumulative peritoneal membrane damage and increased permeability, leading to fluid accumulation and stimulation of the inflammatory process that is related to the early coronary atherosclerosis seen in peritoneal dialysis (PD) patients.1–3 Cardiovascular (CV) complications are the main cause of morbidity and mortality in patients with end-stage renal disease and dialysis patients.1,2
Diabetes mellitus is a well known traditional CV risk factor in the general population as well as in patients undergoing maintenance dialysis.4–8 Poor glycaemic control (glycosylated haemoglobin [HbA1c] ≥8%) in PD patients appears to be associated with higher mortality. 9 Glucose absorption from PD solutions also contributes to the harmful effects on the metabolic profile and hydration status.10–12 Some observational studies showed a higher risk for death in older diabetic PD patients compared with those on haemodialysis. 13 Therefore, reducing the PGL is particularly important in PD patients to reduce the risk for progression of CV complications. Previous studies have shown that fluid overload (FO) and PGL may contribute to the development of hypertension, left ventricular hypertrophy and atherosclerosis.14–17
Chronic inflammation is common in PD patients and considered a very powerful predictor of the development of CV disease and mortality in the general population as well as in people with chronic kidney disease.18–24 FO in PD patients stimulates the inflammatory process.25–27 Furthermore, the inflammatory process itself can cause an increase in peritoneal membrane permeability and fluid accumulation. 26
The present study aimed to evaluate the impact of PGL on hydration status and inflammation in stable PD patients using a novel PGL index (PGLI).
Patients and methods
Study design
This cross-sectional study enrolled stable patients who had received maintenance PD for 12–76 months in the Department of Nephrology and Hypertension, Peritoneal Dialysis Unit, Western Galilee Hospital, Nahariya, Israel between 1 June 2011 and 31 March 2012. Congestive heart failure, liver cirrhosis, and any evidence of infection in the 3 months prior to enrolment (i.e. tuberculosis, HIV, hepatitis B or C, urinary, periodontal, or pulmonary infections, and peritonitis), high or low transport peritoneal membrane characteristics, and age <18 years were considered exclusion criteria. The study protocol was approved by the Medical Ethics Committee of Western Galilee Hospital (no. 13211). All patients signed a written informed consent form before participating in the study. All patients followed their usual recommended diet and continued their permanent medications and peritoneal dialysis regimen.
Biochemical analyses
Blood samples for HbA1c were collected without anticoagulant or centrifugation and were then evaluated using a Sebia haemoglobin kit (Sebia, Lisses, France). Blood samples for serum albumin analysis were collected without anticoagulant, then centrifuged at 3200
Blood samples for plasma high sensitivity C-reactive protein (hsCRP) analysis were collected with 1.8 mg/ml ethylenediaminetetra-acetic acid (EDTA), then centrifuged at 3200
Calculation of the PGLI
The PGL was assessed by using a novel PGL index (PGLI) (g/kg/day), which refers to the net glucose content (monohydrated or unhydrated) (g) in the PD solutions administered in the daily PD prescription divided by the dry body weight (kg) assessed by whole-body bioimpedance spectroscopy (BIS):

Assessment of the hydration status
The hydration status was assessed by a safe, simple, repetitive, reliable and noninvasive whole-body BIS technique using a Fresenius Medical Care Body Composition Monitor (BCM) device (Fresenius Medical Care, Bad Homburg, Germany). 28 Fluid overload was defined as the excess of fluids (l) in the whole-body as assessed by using the BCM device.
Statistical analyses
All statistical analyses were performed using the SPSS® statistical package, version 19.0 (SPSS Inc., Chicago, IL, USA) for Windows®. Quantitative variables were described as mean ± SD. Qualitative variables were described using frequencies and percentages. Correlations between HbA1c, PGLI, plasma hsCRP and plasma IL-6 levels, and serum albumin levels were described using Pearson’s or Spearman’s correlation coefficient test. Independent t-test or Wilcoxon rank-sum test were used to compare quantitative variables between groups. Hierarchical multiple regression and receiver operating characteristics (ROC) curves were used to evaluate the influence of PGLI on FO, hsCRP and IL-6. A P-value ≤0.05 was considered statistically significant.
Results
Demographic and clinical characteristics of the stable peritoneal dialysis (PD) patients (n = 43) who participated in this study to evaluate the impact of peritoneal glucose load on hydration status and inflammation.
Data presented as mean ± SD or n of patients (%).
Kt/V is a dimensionless index that measures the fractional urea clearance during dialysis.
High transporters have high peritoneal membrane permeability or high effective peritoneal membrane area; and low transporters have low peritoneal membrane permeability or low effective peritoneal membrane area. Therefore, high average/low average transporters have intermediate values compared with high or low transporters.
CAPD, continuous ambulatory peritoneal dialysis; APD, automated peritoneal dialysis.
Statistically significant positive correlations were found between the PGLI and HbA1c levels (Pearson’s correlation coefficient test, P < 0.001, r = 0.94), fluid load (Spearman’s correlation coefficient test, P < 0.001, r = 0.89), plasma hsCRP levels (Spearman’s correlation coefficient test, P < 0.001, r = 0.92) and plasma IL-6 levels (Spearman’s correlation coefficient test, P < 0.001, r = 0.88) (Figures 1–4).
The correlation between peritoneal glucose load index (PGLI) and glycosylated haemoglobin (HbA1c) as measured in stable peritoneal dialysis patients (n = 43). The correlation between peritoneal glucose load index (PGLI) and fluid load as measured in stable peritoneal dialysis patients (n = 43). The correlation between peritoneal glucose load index (PGLI) and plasma high sensitivity C-reactive protein (hsCRP) as measured in stable peritoneal dialysis patients (n = 43). The correlation between peritoneal glucose load index (PGLI) and plasma interleukin-6 (IL-6) as measured in stable peritoneal dialysis patients (n = 43).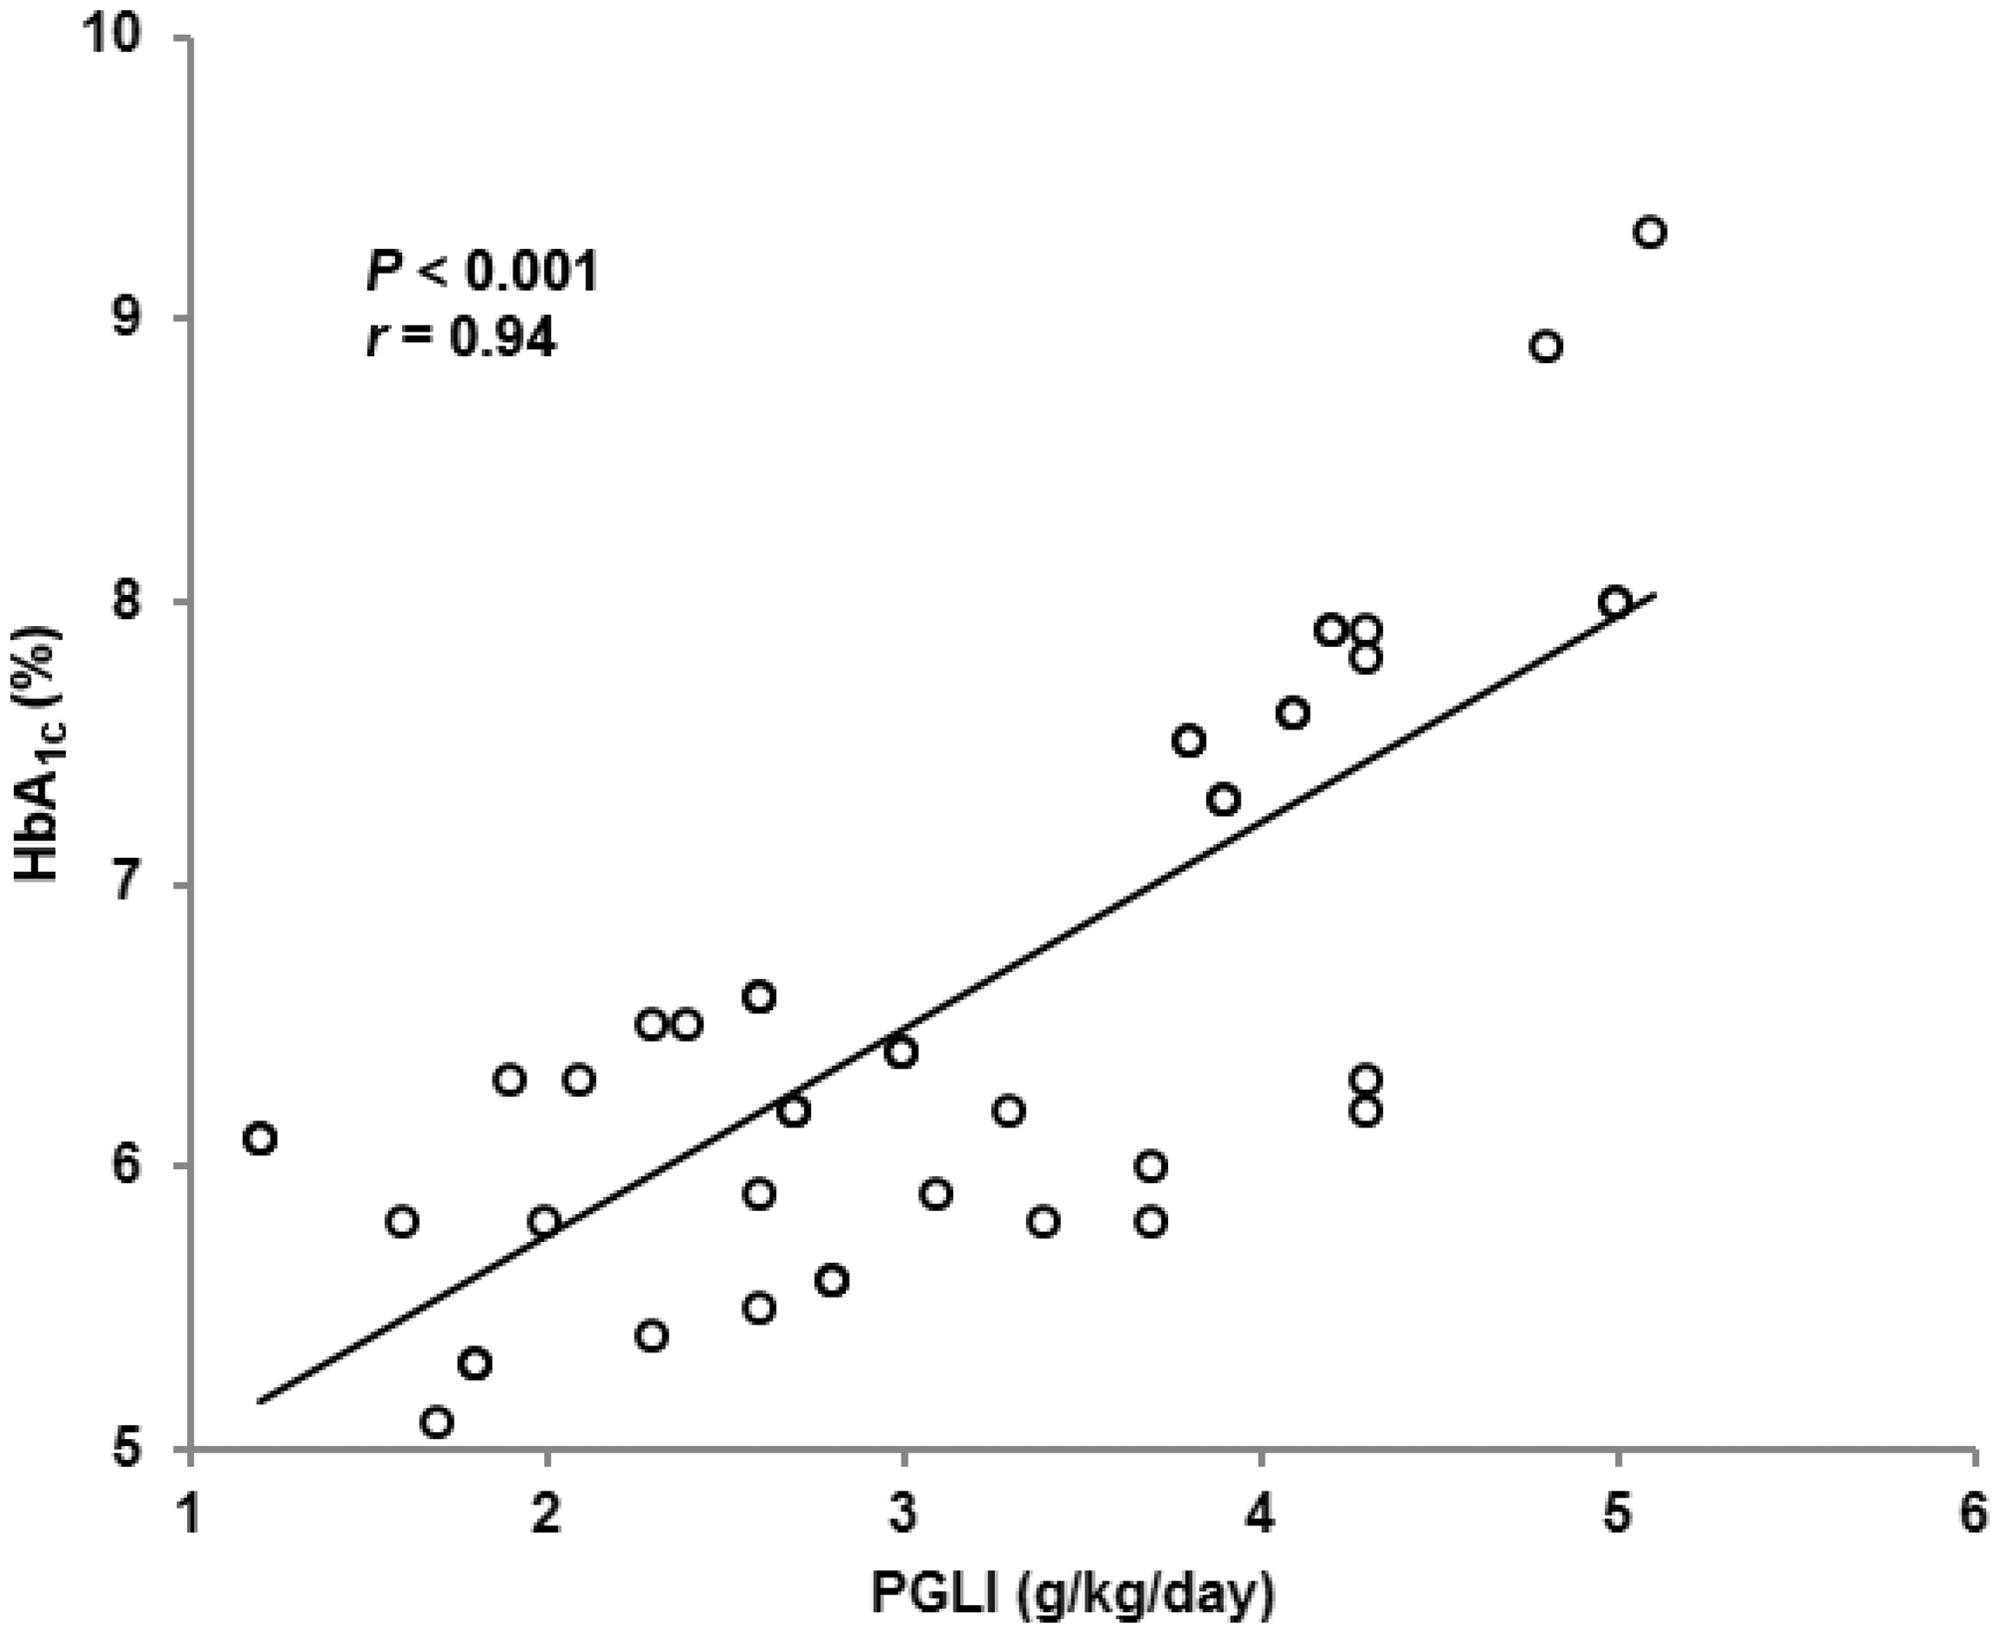


Comparison of glycosylated haemoglobin (HbA1c), fluid overload (FO), plasma high sensitivity C-reactive protein (hsCRP) and plasma interleukin-6 (IL-6) between patients (n = 43) with a peritoneal glucose load index (PGLI) ≤3g/kg/day and those with PGLI >3 g/kg/day.
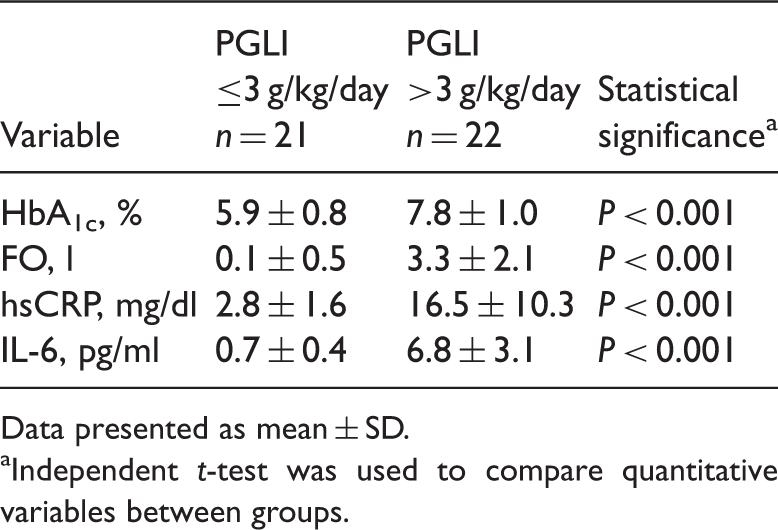
Data presented as mean ± SD.
Independent t-test was used to compare quantitative variables between groups.
Comparison of glycosylated haemoglobin (HbA1c), peritoneal glucose load index (PGLI), fluid overload (FO), plasma high sensitivity C-reactive protein (hsCRP) and plasma interleukin-6 (IL-6) between patients with and without diabetes mellitus.
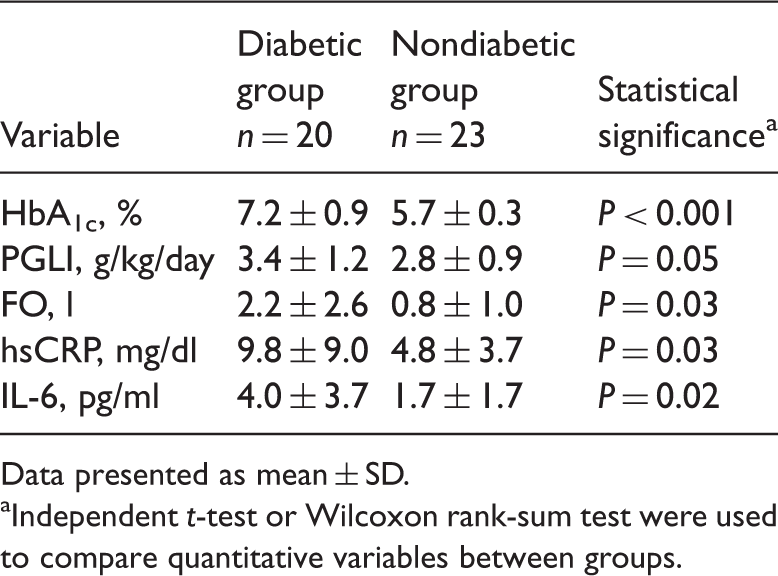
Data presented as mean ± SD.
Independent t-test or Wilcoxon rank-sum test were used to compare quantitative variables between groups.
Comparison of fluid overload (FO), plasma high sensitivity C-reactive protein (hsCRP) and plasma interleukin-6 (IL-6) between patients stratified according to their peritoneal glucose load index (PGLI) and the concomitant presence of diabetes mellitus.

Data presented as mean ± SD.
Independent t-test or Wilcoxon rank-sum test were used to compare quantitative variables between groups.
NS, no significant between-group difference (P > 0.05).
Hierarchical multiple regression analysis revealed that PGLI significantly influenced FO, plasma hsCRP and plasma IL-6 (P < 0.001 for all comparisons). This influence was maintained when diabetes was added as a confounder (P < 0.001). ROC curves were applied to determine the validity of the influence of PGLI on FO, plasma hsCRP and plasma IL-6 (Table 5; Figure 5).
Receiver operating characteristics (ROC) curves were applied to determine the validity of the influence of peritoneal glucose load index (PGLI) on fluid overload (FO), plasma high sensitivity C-reactive protein (hsCRP) and plasma interleukin-6 (IL-6). The results showed that PGLI significantly influenced all of these parameters. The validity of the influence of peritoneal glucose load index (PGLI) on fluid overload (FO), plasma high sensitivity C-reactive protein (hsCRP) and plasma interleukin-6 (IL-6) was confirmed by applying a receiver operating characteristics (ROC) curve for each parameter. AUC, area under curve; SE, standard error, CI, confidence interval.

Discussion
It is well known that diabetes mellitus is the most prominent cause of chronic kidney disease and is considered the major primary renal disease in dialysis patients. Out of a total of 43 patients enrolled in the present study, 20 (46.5%) had diabetes mellitus as the primary renal disease. This percentage of diabetic patients is similar to that observed in the majority of dialysis units and reflects the high proportion of diabetic patients requiring renal replacement therapy. Therefore, this present cross-sectional study included both patients with diabetes as well as nondiabetic patients. The significant positive correlations between the PGLI and HbA1c, FO, plasma hsCRP and plasma IL-6 levels suggest that when PD patients receive more glucose to their peritoneal cavity, this might impair their glycaemic control, result in a higher FO and it may exaggerate their inflammatory status.
In the present study, the hydration status was assessed accurately by whole-body bioimpedance spectroscopy and the peritoneal glucose load was determined accurately using PGLI. PGL leads to the development of cumulative peritoneal damage that appears over time as a result of prolonged exposure to glucose, glucose degradation products generated during glucose-based peritoneal dialysis solution (GBPDS) sterilization, advanced glycation end products, non-physiological pH and as a result of a higher incidence of peritonitis among PD patients receiving GBPDS.15–18 The peritoneal membrane damage activates two vicious circles: first, the increased permeability of the damaged peritoneal membrane leads to fluid accumulation that necessitates utilization of hypertonic PD solutions leading to higher PGL and so on (Figure 6). Secondly, the peritoneal membrane damage, increased membrane permeability and fluid accumulation stimulate the inflammatory process.15–18 Inflammation, in turn, enhances peritoneal membrane impairment and permeability leading to more fluid accumulation and so forth (Figure 6).
26
Moreover, the inflammatory process provoked by the impaired peritoneal membrane aggravates the peritoneal membrane damage leading to more inflammation with all that entails (Figure 6). Utilization of hypertonic GBPDS, FO and chronic inflammation are common problems in PD patients that contribute to the development of CV disease (Figure 6).18–24
The vicious circles initiated by an increase in peritoneal glucose load (PGL) that lead to peritoneal membrane impairment, fluid overload, augmentation of inflammation, and eventually increased cardiovascular morbidity and mortality.
This present study demonstrated that HbA1c, PGLI, plasma hsCRP, plasma IL-6 and FO values were significantly higher in patients with diabetes mellitus compared with the nondiabetic patients. The impact of the presence of diabetes mellitus on hydration status and inflammation in PD patients was evaluated in previous studies. For example, in a cross-sectional cohort of 639 patients from 28 centres in six European countries, which used the same BCM device as the present study to assess volume status, diabetes mellitus was shown to be associated with higher relative tissue hydration. 29 Moreover, diabetic PD patients were more likely to have inflammation than nondiabetic patients, and they presented with elevated hsCRP. 30 To the best of our knowledge, the impact of the PGL, assessed accurately by PGLI, on hydration status and inflammation in PD patients has not been evaluated in previous studies. The results of the present study demonstrated that the PGLI, as well as the presence of diabetes mellitus, may affect the hydration status and inflammation in PD patients. Higher PGLI in diabetic patients may provide an explanation for why diabetic PD patients had higher levels of HbA1c, inflammatory cytokine levels and FO. Diabetic PD patients, especially in cases with poor glycaemic control, frequently need higher GBPDS concentrations that contribute to higher PGLI, more glucose absorption from the peritoneal dialysis fluid, leading to higher HbA1c, more peritoneal membrane damage, increased membrane permeability, stimulation of the inflammatory process and fluid accumulation.9–12 No significant correlations between the analysed parameters and the dry weight were observed in the present study.
The present study demonstrated that FO, plasma hsCRP and plasma IL-6 values were significantly higher among diabetic patients with PGLI >3 g/kg/day compared with diabetic patients with PGLI ≤3 g/kg/day, which suggests that the PGLI tool may be useful when applied in diabetic PD patients. The present study also demonstrated that FO, plasma hsCRP and plasma IL-6 values were significantly higher in nondiabetic patients with PGLI >3 g/kg/day compared with diabetic patients with PGLI ≤3 g/kg/day, but the values of the tested parameters were lower than the values in diabetic patients with PGLI >3 g/kg/day. These present results suggest that a PGLI >3 g/kg/day had a greater negative impact on hydration status and inflammation than the presence of diabetes mellitus per se in diabetic PD patients who are known a priori to have higher tissue hydration and are more likely to have inflammation than nondiabetic patients.29,30
The present study demonstrated that the FO, plasma hsCRP and plasma IL-6 values were significantly higher in nondiabetic patients with PGLI >3 g/kg/day compared with nondiabetic patients with PGLI ≤3 g/kg/day, suggesting that the PGLI tool may be useful when applied in nondiabetic PD patients. The present study also demonstrated that the FO, plasma hsCRP and plasma IL-6 values in diabetic patients with PGLI ≤3 g/kg/day and in nondiabetic PD patients with PGLI ≤3 g/kg/day were similar, which suggests that PGLI >3 g/kg/day had a greater impact on hydration status and inflammation than the presence of diabetes mellitus alone.
It is inaccurate to conclude that higher PGLI had an influence on FO and inflammatory status (plasma hsCRP, plasma IL-6) without excluding the effect of diabetes as a confounder, so hierarchical multiple regression and ROC curve analyses were applied, which demonstrated that PGLI significantly influenced FO, plasma hsCRP and plasma IL-6. This influence was maintained when diabetes was added as a confounder.
The results of the present study revealed that the cut-off of PGLI that was associated with FO >1.0 l, HbA1c >7%, plasma hsCRP level >5 mg/dl and plasma IL-6 level >1.2 pg/ml was 3 g/kg/day (sensitivity 81–84%, specificity 85–94%, P < 0.001). Values of PGLI ≤3 g/kg/day seem to be appropriate but values >3 g/kg/day may be associated with FO and augmented inflammation that are considered well known risk factors for CV morbidity and mortality in patients with end-stage renal disease and on maintenance dialysis.
The findings of this present study showed that the PGLI may be a promising, simple, inexpensive, noninvasive and practical tool for the quantitative assessment and monitoring of the PGL and may be considered in managing diabetic as well in nondiabetic PD patients at the bedside or in an outpatient clinic. Management of PD patients is usually carried out by the patients themselves and sometimes by one of their family members. Consequently, patients, their relatives, family physicians and nephrologists should cooperate together in managing PD patients and all of them could easily use the PGLI tool for the assessment of the PGL, hydration status and inflammation.
The present study had a number of limitations and should be considered a pilot study that was conducted in a single centre and included a relatively small number of patients. Additional larger multicentre, randomized control trials with more homogenous groups are needed to determine the target objectives of PGLI.
In conclusion, PGLI values >3 g/kg/day may be associated with poor glycaemic control, over hydration and augmented inflammation in stable PD patients. PGLI seems to be a simple, inexpensive, noninvasive and practical tool for the quantitative assessment of the PGL that could be used during the management of PD patients.
Footnotes
Declaration of conflicting interest
The authors declare that there are no conflicts of interest.
Funding
This research received no specific grant from any funding agency in the public, commercial, or not-for-profit sectors.