
Abstract
Objective
To evaluate the diagnostic value of magnetic resonance diffusion-weighted imaging (DWI) and three-dimensional arterial spin labelling perfusion imaging (3D-ASL) in distinguishing cavernous haemangioma from parasellar meningioma, using histological data as a reference standard.
Methods
Patients with parasellar meningioma or parasellar cavernous haemangioma underwent conventional T1- and T2-weighted magnetic resonance imaging (MRI) followed by DWI and 3D-ASL using a 3.0 Tesla MRI. The minimum apparent diffusion coefficient (minADC) from DWI and the maximal normalized cerebral blood flow (nCBF) from 3D-ASL were measured in each tumour. Diagnosis was confirmed by histology.
Results
MinADC was significantly lower and nCBF significantly higher in meningioma (n = 19) than cavernous haemangioma (n = 15). There was a significant negative correlation between minADC and nCBF (r = −0.605).
Conclusion
DWI and 3D-ASL are useful in differentiating cavernous haemangiomas from parasellar meningiomas, particularly in situations when the appearance on conventional MRI sequences is otherwise ambiguous.
Keywords
Introduction
There are several types of parasellar tumours, including meningiomas and, rarely,1–3 cavernous haemangiomas.4,5 Magnetic resonance imaging (MRI) has dramatically increased the detection rate and apparent prevalence and morbidity of intracranial cavernous haemangiomas. 6 Parasellar meningiomas and cavernous haemangiomas are often indistinguishable on conventional T1 and T2-weighted imaging sequences. 1 As parasellar cavernous haemangiomas are rare, they are frequently misdiagnosed as meningiomas and subsequently resected, 1 but correct preoperative diagnosis allows for more appropriate treatment (radiation therapy rather than surgical resection).7–12
The MRI techniques of diffusion weighted imaging (DWI) and perfusion imaging have added a new dimension of physiological information to the anatomical data provided by conventional diagnostic imaging. 13 When the gross appearance of lesions is similar on DWI, the calculated apparent diffusion coefficient (ADC) is used to provide a more quantitative approach. 14 The minimum ADC (minADC) is a sensitive approximation of tumour cellularity, since the free diffusion of water molecules is inversely related to tumour density. 15
Perfusion imaging is valuable in evaluating tumour neovascularity and is chiefly composed of two imaging techniques: dynamic susceptibility contrast-enhanced perfusion weighted imaging (DSC-PWI) and arterial spin labelling (ASL). 16 Studies have shown that DSC-PWI is limited by significant susceptibility artefacts in the parasellar region, due to adjacent bones and air-filled structures of the skull base. 17 However, ASL, which uses MR-labelling of endogenous arterial water, can be utilized as an alternative to standard dynamic intravenous bolus contrast perfusion imaging. ASL is classified as either continuous or pulsed, based on whether blood proximal to the region of interest is labelled continuously or in discontinuous large-volume slabs. 18 Three dimensional-pseudocontinuous ASL (3D-ASL) combines the advantages of both ASL approaches, 19 allowing for 3D acquisition, shorter scan time at 3T and fewer susceptibility artefacts by using a spiral acquisition with fast spin echo techniques. 20 Parasellar meningiomas and cavernous haemangiomas are extra-axial lesions that are not contained within the blood–brain barrier. 21 Perfusion imaging reliably reflects angiogenesis and should allow direct comparison between these lesions, but, to the best of our knowledge, no studies have been performed to test this hypothesis.
The aims of the present study, therefore, were to evaluate parasellar meningiomas and cavernous haemangiomas quantitatively, using DWI and 3D-ASL, and compare the imaging findings with the histological diagnosis. We then explored whether the combination of these imaging sequences would improve diagnostic accuracy in the differentiation of these lesions.
Patients and methods
Study population
The study enrolled patients with parasellar lesions, diagnosed in the Department of Neurosurgery, PLA General Hospital, Beijing, China between October 2011 and September 2013. Exclusion criteria were: heart failure; renal failure; illness precluding safe completion of MRI scan; fibrous or psammoma meningioma (easily differentiated from cavernous haemangioma using conventional MRI sequences). All participants received preoperative MRI examinations including conventional MRI, DWI, and 3D-ASL. Medical and surgical records were obtained.
The Ethics Committee of the PLA General Hospital, Beijing, China approved the study, and patients provided written informed consent prior to inclusion.
MR imaging and data processing
All MR images were obtained using a 3.0 Tesla magnetic resonance scanner (Discovery 750; GE Healthcare, Milwaukee, WI, USA) and a 32-channel head coil. Conventional MR scan sequences included axial T1-weighted images (T1WI), axial T2-weighted images (T2WI), coronal and sagittal T2-FLAIR (fluid attenuated inversion recovery), postcontrast axial, coronal, and sagittal T1WI. Pre- and postcontrast T1WI sequences were performed using T1-FLAIR (repetition time/echo time/inversion time [TR/TE/TI] = 1750 ms/24 ms/780 ms). T2WI sequences were performed using T2 propeller (TR/TE = 4252 ms/103.7 ms, echo train length = 32, number of excitations [NEX] = 1.5). Coronal and sagittal T2-FLAIR used TR/TE/TI = 8500 ms/162 ms/2100 ms. Coronal, sagittal, and axial T1WI were acquired after injecting 0.1 mmol/kg of gadolinium-DTPA (Bayer Schering Pharma AG, Berlin, Germany).
The DWI was performed using fat-suppressed single-shot spin-echo echoplanar imaging (TR/TE = 6000 ms/73.7 ms, slice thickness = 5.0 mm, slice space = 1.5 mm, field of view [FOV] = 24 × 24 cm, matrix = 192 × 192, NEX = 2) with b = 1000 s/mm2 and no motion-probing gradients.
Three-dimensional-ASL PWI scans were performed using a pseudocontinuous ASL (pCASL) pulse sequence with a background-suppressed 3D FSE (fast spin echo). The variables used were: TR = 4653 ms; TE = 10.5 ms; postlabelling delay (PLD) = 1525 ms; FOV = 24 × 24 cm; matrix = 512 × 8; slice thickness = 4.0 mm; inter-slice gap = 0 mm; NEX = 3; 36 tag pairs and control acquired in 4 min 30s. The scan position extended from the scalp to the skull base.
Apparent diffusion coefficient and cerebral blood flow (CBF) measurements were independently obtained by two trained neuroradiologists with 5 and 7 years of brain perfusion MRI experience, respectively (X.L. and Y.L. W.). Patient-related information was removed from all images, and observers were blinded to the histological diagnosis. Each radiologist evaluated each scan on two separate occasions within a 2-month period, giving a total of four measurements.
Data from DWI and 3D-ASL were transferred to an offline workstation (Advantage Workstation, AW 4.5.1; GE Medical Systems). ADC and CBF colour maps were then postprocessed using GE FuncTool software. ADC and CBF values of the region of interest (ROI) were obtained from the ADC and CBF maps respectively, on the same workstation. All consecutive slices that included the solid portion of the tumour were initially selected, and 5–10 elliptical ROIs (30–40 mm2, ∼8–10 pixels) were manually placed on each slice of the ADC and CBF maps (avoiding nonhomogeneous areas due to cystic changes, haemorrhage or calcifications, as demonstrated on conventional pre- and postcontrast MR images [Figures 1 and 2]). A total of 20–30 ROIs were placed in each case, and the ROI with the lowest ADC value was selected to serve as the representative minADC value. Similarly, the ROI with the maximal CBF value was selected to represent the maximal CBF. Maximal CBF values were normalized by placing ROIs (approximately 1.0 cm2 each) on normal-appearing bilateral frontal lobe periventricular white matter.
22
Tumour-to-healthy tissue perfusion ratios (normalized CBF; nCBF) were calculated by dividing the overall mean tumour CBF by the mean normal frontal lobe white matter CBF.
Magnetic resonance images of the brain of a 56-year-old woman with a right parasellar meningioma (white arrows). (A) T2-weighted image; (B,C,D) axial, coronal and sagittal postcontrast T1-weighted images, respectively; (E) diffusion-weighted image; (F) region of interest (ROI) for tumour minimum apparent diffusion coefficient (minADC) on the ADC map; (G) ROI for maximal tumour normalized cerebral blood flow (nCBF) on the three-dimensional-pseudocontinuous arterial spin labelling (3D-ASL) CBF map. The colour version of this figure is available at: http://imr.sagepub.com Magnetic resonance images of the brain of a 58-year-old woman with a left parasellar cavernous haemangioma (arrows). (A) T2-weighted image; (B,C,D) axial, coronal and sagittal postcontrast T1-weighted images, respectively; (E) diffusion-weighted image; (F) region of interest (ROI) for tumour minimum apparent diffusion coefficient (minADC) on the ADC map; (G) ROI for maximal tumour normalized cerebral blood flow (nCBF) on the three-dimensional-pseudocontinuous arterial spin labelling (3D-ASL) CBF map. The colour version of this figure is available at: http://imr.sagepub.com

After 2 months, ROIs were repositioned and both parameters were re-evaluated by the same two neuroradiologists. The mean of the minADC and maximal nCBF value from both timepoints was found and was used as the final result.
Histology
Tissue samples were fixed in formalin and embedded in paraffin wax. Samples were prepared with haematoxylin and eosin, as well as immunohistochemical stains, and evaluated by a neuropathologist with 11 years’ experience. Tumours were classified according to published guidelines. 23
Statistical analyses
Data were presented as mean ± SD. Between-group differences in minADC and CBF ratios were analysed using one-way analysis of variance and Student’s unpaired t-test, respectively. Spearman’s rank correlation analysis was applied between the minADC and nCBF ratio. All statistical analyses were performed using SPSS® version 16.0 (SPSS Inc., Chicago, IL, USA) for Windows®. The level of significance was set at P < 0.05.
Results
Presenting symptoms in patients with parasellar meningioma or parasellar cavernous haemangioma.
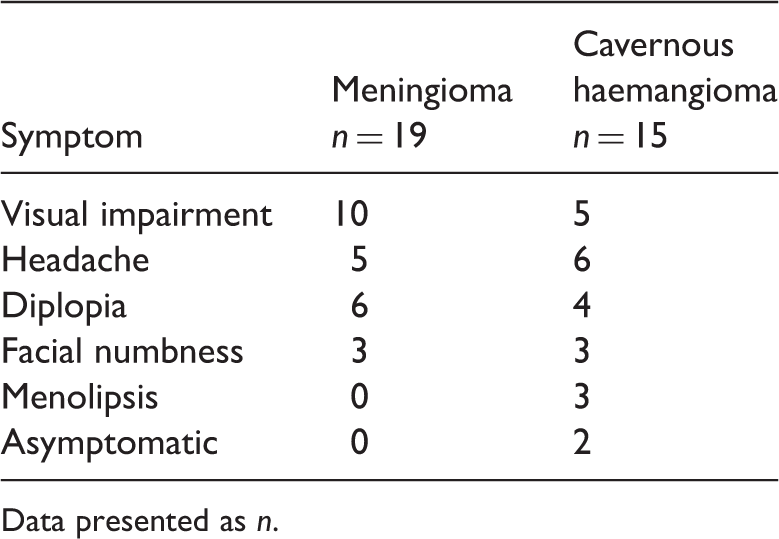
Data presented as n.
Data regarding minADC and maximal nCBF are given in Table 2. MinADC was significantly lower and nCBF was significantly higher in meningiomas than in cavernous haemangiomas (P < 0.001 for both comparisons). There was a significant negative correlation between nCBF and minADC (r = −0.605, P = 0.001; Figure 3).
Spearman’s rank correlation analysis of minimum apparent diffusion coefficient (minADC) and maximal normalized cerebral blood flow (nCBF) in parasellar meningiomas and cavernous haemangiomas. Data derived from magnetic resonance diffusion-weighted imaging and three-dimensional arterial spin labelling perfusion imaging. 1, meningioma; 2, cavernous haemangioma; r = −0.605, P = 0.001. The colour version of this figure is available at: http://imr.sagepub.com Maximal normalized cerebral blood flow (nCBF) and minimum apparent diffusion coefficient (minADC) of parasellar meningiomas and cavernous haemangiomas. Data derived from magnetic resonance diffusion-weighted imaging and three-dimensional arterial spin-labelling perfusion imaging. Data presented as mean ± SD. Student’s t-test for independent samples.

Discussion
Meningiomas are the most common nonglial primary intracranial neoplasms, and parasellar meningiomas (which include lesions of the cavernous sinus, planum sphenoidale, diaphragma sellae and clinoid process) account for 15% of all sellar tumours (excluding pituitary adenomas) and 20–30% of all meningiomas.4,24 Intracranial cavernous haemangiomas represent 5–13% of all central nervous system vascular malformations, and are classified as intra- or extra-axial. Extra-axial cavernous haemangiomas in the parasellar cavernous sinus account for ∼0.4–2% of all intracranial cavernous haemangiomas and < 2% of parasellar lesions. 5 Meningiomas and cavernous haemangiomas often share a similar appearance on conventional pre- and postcontrast MRI sequences: hypo- or iso-intensity on T1WI, slight to prominent hyperintensity on T2WI, a homogeneous or heterogeneous appearance, homogeneous or heterogeneous enhancement on postcontrast T1W1, and occasional flow voids and dural tails. 25
Around 66.7–87.5% of parasellar cavernous haemangiomas are misdiagnosed as meningiomas,26,27 and parasellar meningiomas (particularly angiomatous meningiomas) are often mistaken for cavernous haemangiomas. 28 Both meningiomas and parasellar cavernous haemangiomas have a propensity to occur in middle-aged women, 25 which is in accordance with the findings of the present study where patients had a mean age of 47.5 years and a strong female bias. Taken together, epidemiological and conventional imaging findings are insufficient to differentiate between these lesions.
While conventional contrast enhanced MRI does supply some degree of information regarding tumour morphology and angiogenesis, additional sequences are often necessary to gain additional pathophysiological information and enable a confident radiological diagnosis. DW image appearance was insufficient to differentiate between lesions in the present study, due to its inherent low signal-to-noise ratio, the subtle signal changes observed and the differing experience of the interpreting radiologists. The quantitative ADC value can be used to demonstrate the relative degree of restricted diffusion and assist in diagnosis, even when DW images appear equivocal. ADC values for parasellar meningiomas in the present study were similar to those reported by others,14,29 but there are no reports detailing the ADC values of cavernous haemangiomas. The minADC of parasellar meningiomas was significantly lower than that of cavernous haemangiomas in the present study; these differences can be explained by differences in lesion histology.
Meningiomas are solid tumours arising from arachnoid meningothelial cells. Although microscopic features differ among subtypes, all are solid lesions with characteristic arachnoid villi present in whirlpool or concentric circles and contain varying degrees of fibrosis, vascular elements, collagen, reticulin matrix, and so on. Thus, mean minADC values of meningiomas are slightly higher than those of normal white matter. 30 In contrast, cavernous haemangiomas are not true neoplasms but rather are vascular hamartomas, 25 comprised of collections of vascular spaces lined by thin walls devoid of smooth muscle. There are two morphological subtypes of cavernous haemangioma: type A is composed of many thin-walled caverns lined by a single layer of endothelial cells and embedded in a collagenous matrix; type B forms as a discrete, lobulated, mulberry-like nodule composed of endothelial-lined vessels prone to haemorrhage. 1 Due to the lack of pathologically significant cellular stroma outside the thin endothelial walls and collagenous matrix, these lesions are considerably less solid than true neoplasms and consequently demonstrate higher ADC values (signifying less restricted diffusion). 31
Perfusion imaging demonstrated robust discrimination between lesions, in the present study. As expected, the nCBF values of meningiomas were significantly higher than those of cavernous haemangiomas. In general, blood-flow parameters correlate with the degree of tumour vascularity and are thus consequently increased in tumours with a high rate of pathological angiogenesis.32,33 Meningiomas typically derive their blood supply from the external carotid via dural branches and generally possess a rich vascular supply, with variations in degree among the various subtypes.34–36 When viewed via histology or 3D-ASL, meningiomas appear as highly vascular lesions with elevated perfusion. 34 In contrast, cavernous haemangiomas, while vascular in nature, are malformations without a well-formed arterial supply or mature venous drainage. As haemangiomas are not characterized by angiogenesis or significant hyperperfusion, they appear as areas of relative hypoperfusion on 3D-ASL imaging. 37
The vast majority of meningiomas in the present study had nCBF values higher than those of cavernous haemangiomas. An exception was a single patient whose parasellar cavernous haemangioma was originally misdiagnosed as a meningioma, based on its appearance on conventional imaging and 3D-ASL (nCBF value, 9.216). The patient underwent operative resection, which was complicated by life-threatening intraoperative haemorrhage. The pathology of this particular case was reported as a type B cavernous haemangioma containing an arteriovenous shunt, explaining the highly unusual perfusion characteristics. Of note, the minADC of this lesion was 1.320 × 10⁻³ mm2/s, which is close to the mean minADC of parasellar cavernous haemangiomas in the present study. Therefore the success rate of MR diagnosis can be improved by combining 3D-ASL and DWI.
There was a significant inverse correlation between minADC and nCBF values in the present study, suggesting that high vascularity (high nCBF) is correlated with increased cellularity (low ADC) in these lesions. Given these findings, a parasellar lesion with high perfusion and greater degree of restricted diffusion supports the diagnosis of a meningioma. Conversely, the combination of low nCBF and high minADC values is consistent with a cavernous haemangioma, allowing for the exclusion of a meningioma and ideally preventing inadvertent surgical complications.
The current study is limited by its small sample size, which prevents meaningful comparison between different tumour subtypes. Additionally, because 3D-ASL is dependent on multiple factors (e.g. blood transit time, choice of PLD time, and patient age), our use of a fixed PLD may introduce nonrandom bias. Several PLD should be applied in each case to select an optimal PLD for each individual. Further studies, with larger sample sizes and individualized PLD, would be of benefit.
In conclusion, DWI and 3D-ASL are optimal MRI sequences for differentiating parasellar cavernous haemangiomas from meningiomas. The nCBF and minADC values give correlated but distinct physiological information, and their combination can dramatically improve diagnostic accuracy. Because of their otherwise-similar appearance on conventional sequences, this differentiation can be used in clinical practice to prevent the misdiagnosis of the less common parasellar cavernous haemangioma as meningioma, and the suboptimal therapeutic decisions that ensue.
Footnotes
Declaration of conflicting interest
The authors declare that there are no conflicts of interest.
Funding
This research received no specific grant from any funding agency in the public, commercial, or not-for-profit sectors.
Acknowledgement
We thank D. Qiu-Ping Gui from the Department of Pathology, Chinese PLA General Hospital, who prepared and evaluated the tissue samples.