
Abstract
Objective
Using magnetic resonance imaging (MRI), this study aimed to demonstrate the appearance of hepatocytes following ligation of the right portal vein or combined ligation of the right portal vein and right hepatic artery, in a rat model.
Methods
Ninety adult Sprague–Dawley rats (body weight 250–300 g) were divided into three groups (n = 30 per group): ligation of the right portal vein (Group A); combined ligation of the right portal vein and right hepatic artery (Group B); no intervention to obstruct blood supply (control group). Rats were then randomly subdivided into five groups that underwent examination at 3 h and 1, 3, 7 and 14 days postprocedure (n = 6 per group). Livers were examined by routine MRI, diffusion-weighted imaging (DWI) and magnetic resonance spectroscopy (MRS). After examination, each group of rats was sacrificed. Right hepatic lobes were removed and examined by pathology in six rats per timepoint; transmission electron microscopy (TEM) was undertaken in up to three rats per timepoint.
Results
Hepatocyte apoptosis and necrosis, by right portal vein ligation and combined right portal vein and right hepatic artery ligation respectively, were confirmed by pathology and TEM. In Group A, there were slight increases in intensity of T1- and T2-weighted images and in the apparent diffusion coefficient (ADC). In addition there were larger areas under the lactic acid and lipid peaks on MRS. In Group B, there were increased T1 and T2 signals, a decrease in the ADC and an increase of the area under the lactic acid peaks on MRS.
Conclusions
Hepatocyte apoptosis and necrosis induced by ligation procedures exhibited specific changes that were evident on MRI, DWI and MRS, and could be detected in vivo by MRI, in a rat model.
Introduction
The liver has a dual blood supply, with 75% of the total flow coming from the portal vein and 25% from the hepatic artery.1,2 Liver pathology depends on whether one or both of these blood vessels are blocked. Simultaneous ligation of the portal vein and hepatic artery completely obstructs the blood supply to the liver and leads to massive hepatocyte necrosis in the lobes.3–7 Ligation of one branch of the portal vein induces atrophy of the lobe irrigated by that vessel and compensatory hypertrophy of the rest of the liver. 8 Numerous reports have shown that the atrophy induced by ligation is due to hepatocyte loss through apoptosis and/or necrosis.9–12
As a fast-developing technology, magnetic resonance imaging (MRI) has ushered radiology into an era of evaluating metabolism and function. Developments in MRI, such as nuclear magnetic resonance spectroscopy (MRS) and diffusion-weighted imaging (DWI), have taken these techniques far beyond their original roles as the workhorses of structural and pharmaceutical chemistry and clinical imaging; they are now used to detect previously inaccessible and unrecognized biological phenomena in living cells and tissues undergoing apoptosis. 13
At present, pathologists differentiate apoptosis and necrosis only by invasive investigation. We believe that there is a lack of noninvasive methods to differentiate apoptosis and necrosis clinically. To the authors’ knowledge, there are no reports on the evaluation and differentiation of apoptosis (induced by portal vein ligation) and necrosis (induced by combined portal vein and hepatic artery ligation), using MRI, DWI and MRS. As the appearance of apoptosis induced by portal vein ligation on MRI, DWI and MRS is not well defined, further research is necessary to clarify the ability of these techniques to detect and characterize hepatocyte apoptosis.
The present study was designed to demonstrate the appearance of hepatocyte apoptosis and necrosis in a rat model, using MRI, DWI and MRS, following microsurgical interruption of the right portal vein or both the right hepatic artery and right portal vein.
Materials and methods
Study institute and ethical approval
This study was conducted at Tongji Hospital in Shanghai, China between January 2004 and July 2005. This work was approved by the Ethics Committee of Tongji Hospital.
Animals and study design
Ninety adult Sprague–Dawley rats were utilized in this study. a The rats were supplied by the Shanghai branch of the Chinese Academy of Sciences; they were housed in ventilated and clean conditions under a 12-h light/dark cycle, and were supplied with standard food pellets (BETA mice food, Chinese Academy of Sciences, Shanghai) and tap water ad libitum. The rats were aged 3 months and had a body weight of 250–300 g. There was no sex preference.
First, rats were randomly divided into three groups (n = 30 per group). For the apoptosis group (Group A), only the right portal vein was surgically ligated. Rats in the necrosis group (Group B) underwent combined ligation of the right hepatic artery and the right portal vein. Rats in the control group underwent a sham ligation, with no interruption of the hepatic blood supply.
Rats were then subdivided into five further groups (n = 6 per group) to correspond with five designated timepoints: 3 h, and 1, 3, 7 and 14 days postprocedure. Rats in each of the groups were transferred to the MRI room for MRI, DWI and MRS at the designated timepoint; the methodology for pathological examination is described below.
Surgical procedures
All surgical procedures were conducted under microscopy (by B.H. and S.Z.). Instruments and surgical apparatus were prepared according to the intervention that each rat was to receive. Animals were anaesthetized with an intraperitoneal injection of 40 mg/kg pentobarbital sodium. After a midline abdominal incision, the colon, intestine and stomach were pulled to the left side and covered with gauze soaked with physiological saline. The liver was carefully exposed at its right-upper part and the hepatic hilum was dissected to identify the right hepatic artery and right portal vein clearly. In Group A, only the right portal vein was ligated; in Group B, both the right portal vein and the right hepatic artery were ligated. In the control group, no blood vessels were ligated. The ligation typically took 30–45 min. At the end of the surgical procedure, the abdominal wall was carefully sutured and the animal was observed until it regained consciousness.
MRI, DWI and MRS
Following surgical ligation, rats underwent MRI, DWI and MRS at the five designated timepoints (n = 6 per group, per timepoint) using a 1.5 T Edge Eclipse MRI system (Marconi, Highland Heights, OH, USA). After anaesthesia, rats were placed in a right lateral recumbent position in the centre of the magnetic field and covered with a small blanket to maintain body temperature. These examinations usually took 40 min, and a small round surface coil with an inner diameter of 9.0 cm was used. The examinations and their findings were reviewed by the authors.
Routine MRI consisted of spin echo sequence T1-weighted imaging (T1WI) in the axial plane and two fast spin echo sequence T2-weighted imaging (T2WI) in the axial and coronal planes. Repetition and echo times for T1WI were 400 and 12.0 ms, and for T2WI were 3124 and 78.4 ms. The b-values were 100, 300 and 500 s/mm2. Other parameters for both T1WI and T2WI were the same: field of view 11.0 cm; matrix 192 × 256; slice thickness 2.0 mm; no gaps; mean number of signals, two. The apparent diffusion coefficient (ADC) was determined by the following method: on T1WI, T2WI, b = 100, 300, 500 of the DWI and ADC image; three continuous levels were chosen, which clearly showed the lesions. Three circular areas were then drawn, to show region of interest (ROI): each area was ∼ 3.0 mm in diameter. The signal strength value (SI) was automatically recorded in the right liver lobe, using the VistA imaging workstation (http://www.va.gov/health/imaging/). For DWI, repetition and echo times were 16 000 and 4.7 ms, respectively.
The point resolved spectroscopy sequence (PRESS) was used for MRS. The voxel was placed according to the T2WI. Voxel size was 3.0 × 3.0 × 3.0 mm3. A magnetic shim was conducted before the MRS sequence. Repetition and echo times were 1500 and 35.0 ms, respectively. The PRESS sequence took 5 min 24 s.
Signal intensity of MRI and DWI images
Because the signal intensity of an MRI is a computer-justified number, it is only of value when it is used for comparison. The present study selected two ROI on the right and left lobes, in an image that most clearly outlined areas of the lobes. Each ROI was ≥2.0 mm in diameter and >40 pixels in size. Vessels, fat and artefacts were avoided. Mean and SD signal intensities were obtained for each group for the right and left lobes. Signal intensity values between the right and left lobes were compared as indicators of signal changes after blood supply intervention. There were three sequences of images on DWI obtained with b-values of 100, 300 and 500 s/mm2, and there were five pairs of signal intensity values, because there were at least five sequences of axial imaging with the same position parameters: T1WI, T2WI and three DWI. The same position for signal measurement was secured by copying all the position parameters on different pulse sequences. Signal intensities were also compared between treatment groups.
MRS peak and area measurements
Magnetic resonance spectroscopy measurements were done using the MRI computer monitor (n = 6 per group, per timepoint). The peak height and the area under the curve were automatically calculated and recorded. Four compounds were selected for measurement at different resonance frequency positions: choline (3.22 ppm), glutamic acid (2.14 ppm), lipid (0.95 ppm) and lactic acid (1.33 ppm). Peak area means and SDs were computed when 4–6 rats in the same group had been studied.
Pathological examinations
After MRI, DWI and MRS, rats were anaesthetized and incised along the middle line of the abdominal wall (n = 6 per timepoint). Sizes, shapes and colours of the right and left lobes were recorded. A double dose of pentobarbital sodium was injected through the inferior vena cava and immediately after death, the whole liver was dissected. Within the sterilized gauze, tissue samples from the right lobes were carefully cut for transmission electron microscopy (TEM) in up to three rats per timepoint.
For TEM, three or four tissue cubes (1.0 × 1.0 × 1.0 mm3) per rat were rinsed in 0.9% saline, then fixed in phosphate-buffered saline (PBS; pH 7.2), 2% glutaraldehyde PBS-fixed liquid, 1% osmic acid PBS fixatives, 2%PBS, 50% propylene oxide, 2% lead citrate (all chemicals supplied by DAKO, Glostrup, Denmark), avoiding tissue squashing or contamination during the process. Slices (1–2 -µm thick) were made using a V-shaped ultrathin slicing machine (LKB; DAKO); the membrane, cytoplasmic organelles and nucleus were examined using a H-500 TEM (Hitachi, Japan).
Subsequently, the right and left lobes were preserved in separate bottles containing 25% formalin solution until examination by light microscopy on Day 14.
For light microscopy, all liver samples were embedded in paraffin wax and were sliced into sections 5 µm thick. Haematoxylin and eosin (H&E) staining was performed according to standard methods. The staining method for apoptosis was terminal deoxynucleotidyl transferase-mediated dUTP nick-end labelling (TUNEL; ApopTag® S7100, DAKO, Glostrup, Denmark). For measuring the proliferation of hepatic tissue after right hepatic blood supply intervention, a proliferating cell nuclear antigen (PCNA; DAKO) index was determined after staining of both the right and left hepatic slices.
All H&E-stained slices were reviewed for changes in hepatic tissues under light microscopy, by two experienced pathologists (B.H. and S.Z.). Cellular swelling, deep nuclear staining, nuclear shrinking, karyoclasis, nuclear dissolving, inflammatory cell penetration and hepatic sinus structure were all recorded. For evaluation of apoptosis, five views of each slice under ×400 magnification were selected; the number of apoptosis-positive cells, brown and with nuclear shrinking, was recorded and averaged, to calculate the apoptosis index. The apoptosis index is the number of apoptosis-positive cells divided by the total number in view × 100, reported as a percentage. The same method was used to measure the PCNA index, where purple granules in the cells were used as indicators of positivity.
Statistical analyses
Statistical analyses were undertaken using SPSS® version 13.0 (SPSS Inc., Chicago, IL, USA). Analysis of variance (ANOVA) methods were used to compare between-group differences.
Results
In Group A, right lobes showed no change at 3 h after ligation, but showed atrophy in all examinations from 1 day after ligation (Figure 1); left lobes showed compensatory hypertrophy (Figure 1a). In Group B, the right lobes were brown 3 h after ligation and became yellow and dry at later timepoints (Figure 2).
Hepatocyte apoptosis (induced by right portal vein ligation) after 7 days in a study in rats. (a) Atrophy of the right lobe (arrow) and compensatory hypertrophy in the left lobe on general observation; (b) haematoxylin and eosin staining in the right lobe; (c) terminal deoxynucleotidyl transferase-mediated nick-end labelling in the right lobe; (d) proliferating cell nuclear antigen staining in the left lobe: positive cells indicated by arrows; (e) appearance on transmission electron microscopy in the right lobe: apoptotic bodies (arrows); (f) nucleus border gathering, which is a specific characteristic of apoptotic cells in the right lobe. Appearance on MRI: (g) T1-weighted imaging; (h) T2-weighted imaging; (i) diffusion-weighted imaging (b-value 300). Original magnification: B × 200; C, D × 400; E, F × 6000. The colour version of this figure is available at: http://imr.sagepub.com Hepatocyte coagulation necrosis (induced by combined portal vein and right hepatic artery ligation in a rat model) after 3 hours (a), 1 day (b–e), 3 days (f) and 7 days (g, h). (a) Appearance on light microscopy (high magnification); (b, h) appearance on light microscopy: haematoxylin and eosin stain (low magnification); (c–e) appearance on MRI: T1-weighted imaging (c); T2-weighted imaging (d); diffusion-weighted imaging (b-value 300; e); (f) appearance on transmission electron microscopy: cell necrosis; (g) dry and yellow tissue in the right lobe (arrow) and compensatory hypertrophy in the left lobe. Original magnification: b, h × 200, a × 400, f × 800. The colour version of this figure is available at: http://imr.sagepub.com

Under light microscopy, some changes were evident in Group A. At 3 h after ligation, there was no destruction in the right lobe, but karyopycnosis and an enlarging sinus hepaticus were evident at 1 day, local necrotic areas near central veins were observed at 3 days, vacuolar degeneration of hepatocytes was observed at 7 days (Figure 1b) and all bubbles coalesced at 14 days. In Group B, some changes were evident, such as vacuolar degeneration of cells near the central vein at 3 h after ligation (Figure 2), which was similar to Group A at 7 and 14 days. Coagulative necrosis and infiltration of inflammatory cells were evident after 1 day (Figure 2).
Extracellular spaces in right lobes of Group A were larger than in the control group (Figure 3a). Apoptotic cells showed karyopyknosis and stained brown with TUNEL; this was found at all timepoints after ligation in Group A (Figure 1). There were some apoptotic cells after only 3 h in Group B. Some positive cells on PCNA staining were seen in the left lobes (Figure 1d) in both Group A and Group B. The proliferation index in Group A was computed and, as shown in Figure 3b, increased gradually after ligation, reaching a peak between 1 and 3 days after ligation.
Indices of hepatocyte apoptosis (induced by right portal vein ligation), compared with no ligation, in a rat model. Rats were assessed at various timepoints between 3 h and 14days postprocedure. (a) Extracellular space area; (b) apoptosis and proliferation. Data presented as mean ± SD. *P < 0.05, analysis of variance.
There were some typical changes in apoptotic cells visible on TEM in Group A after 7 days, including decreased cell volume, karyopyknosis, border gathering, nuclear membrane shrinkage and apoptotic body merging, but cells and cell membranes remained intact (Figures 1e and f). In Group B, there was some nuclear condensation, fragment formation and dissolution at 3 h and 1 day after ligation (data not shown), which became structureless and necrotic after 3 days (Figure 2f).
Figure 4 shows the T1WI, T2WI and DWI signals in the apoptosis, necrosis and control groups. In Group A, the T1WI, T2WI and DWI signals increased at 3 h, 1 and 3 days after ligation (Figure 4), but decreased at 7 and 14 days (Figure 1g–i). In Group B, the T1WI, T2WI and DWI signals increased (Figure 2c–e). T1WI signals were the highest in Group A and T2WI and DWI signals were the highest in Group B, whereas the T2WI signals in Group A were between those of the necrosis and control groups (Figure 4).
Change in signal intensity in a comparison of hepatocyte apoptosis in rats (induced by right portal vein ligation) and necrosis (induced by combined right portal vein and right hepatic artery ligation) and sham group (no ligation) from 3 h to 14 days postprocedure. (a) T1-weighted imaging. (b) T2-weighted imaging. (c) Diffusion-weighted imaging (DWI). Data presented as mean ± SD. *P < 0.05, **P < 0.01, analysis of variance.
Figure 5 shows the relative ADC signals for b-value 300 in the three groups and the ADC signals for three b-values in Group B. Relative ADC signals were the highest in Group A and the lowest in Group B; ADC signals decreased when the b-value increased.
Relative apparent diffusion coefficients (rADC; a) in a rat model comparing hepatocyte apoptosis (induced by right portal vein ligation) and necrosis (induced by combined portal vein and right hepatic artery ligation), at timepoints between 3 h and 14 days postprocedure. ADC values between deferent b-factors (b) at each timepoint in combined portal vein and right hepatic artery ligation group. Data presented as mean ± SD. *P < 0.05, **P < 0.01, analysis of variance. PV, portal vein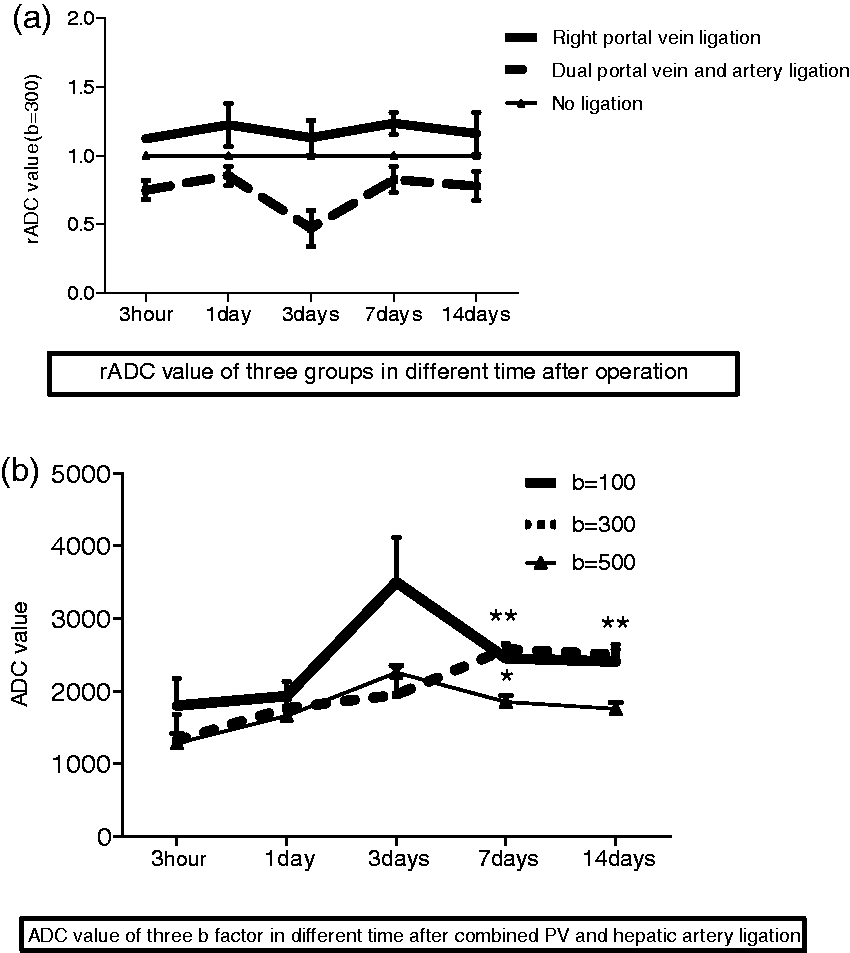
As shown in Figure 6, in the apoptosis and necrosis groups, the areas under the choline and glutamic acid peaks increased, compared with the control group. Within Group A, the area under the lipid peaks was the largest and the areas under the lactic acid peaks were the smallest; in Group B, the areas under the lactic acid peaks were the largest (Figure 6).
Comparison of hepatocyte apoptosis in rats induced by right portal vein ligation and necrosis induced by combined right portal vein and right hepatic artery ligation between 3 h and 14 days postprocedure. Areas under the choline (Cho; a), glutamic acid (Glx; b), lipid (Lip; c) and lactic acid (Lac; d) peaks. Data presented as mean ± SD
Discussion
In the present study, ligation of the right portal vein (Group A), and combined ligation of the right portal vein and right hepatic artery (Group B), induced hepatocyte apoptosis and coagulative necrosis, respectively, in a rat model. The right lobes in Group A became atrophied and the nonligated left lobes showed compensatory hypertrophy. The apoptosis index was the highest at 3 days after ligation. This result is different from that of Bilodeau et al. 9 who found that the 48-h timepoint represented the estimated peak of liver injury. In Group B, the nonligated left lobe also exhibited hypertrophy. These results were supported by pathology and microscopy and were in line with other reports. 14
The mechanisms of apoptosis and necrosis (by portal vein ligation and combined portal vein and hepatic artery ligation, respectively) have been reported. 3 It is to be expected that hepatic tissue will become necrotic if both the hepatic artery and portal vein are blocked.3–7 It has been found that hepatic artery ligation will not produce any hepatic tissue changes because of the rapid establishment of lateral circulation. 7 However, there is a specific pathological process leading to apoptosis if the portal vein is blocked and there is a patent hepatic artery.9–12 Therefore, necrosis and apoptosis in the right lobe will occur if both the right hepatic artery and right portal vein or only the right portal vein are ligated, respectively. After portal vein ligation, damage to hepatocytes was dramatically less than after combined portal vein and hepatic artery ligation. 3 Changes in portal vein blood flow are known to be compensated by changes in hepatic arterial flow, thus defining a hepatic artery buffer response: 15 and Sumanovski et al. 16 demonstrated increased angiogenesis in the abdominal cavity in a rat portal vein ligation model. The initial response to portal branch ligation and probably, therefore, partial hepatectomy seems to be nonspecific for >8 h. Thereafter, p53, c-Ha-ras, cyclin E and Cdk2 seem to drive cellular proliferation, whereas interleukin-1α is associated with cellular atrophy. 17
Magnetic resonance imaging of the effects of portal vein ligation and combined portal vein and hepatic artery ligation has not been reported, to the authors’ knowledge. The present study observed specific apoptotic and necrotic changes (on MRI, DWI and MRS) in the study groups that underwent ligation of the right portal vein (Group A) and combined ligation of the right portal vein and right hepatic artery (Group B). These changes were in line with histological findings. MRI (especially, advanced techniques, such as DWI and MRS) have become powerful tools to reflect functional and micromolecular changes after portal vein ligation, or combined portal vein and hepatic artery ligation.
Pathological and TEM analysis showed that in Group A, which underwent portal vein ligation, there was more apoptosis and little degeneration (and ballooning degeneration), compared with in Group B. This was also evident at each timepoint of the study, from 3 h onwards, with the greatest difference being observed at 7 days, and only local necrosis at 14 days (Figure 3b). Some characteristic changes were consistent with more apoptosis-like pathological changes. For example, there were some changes when the right portal vein was ligated, such as right lobe atrophy and apoptosis, and compensatory hypertrophy of the nonligated lobe. At 3 h after ligation, T1WI, T2WI and DWI signals increased (Figure 4, possibly because of the shortage of portal vein blood), but decreased at 7 and 14 days (Figure 1g-i). Because of apoptosis in the right lobe, extracellular spaces became larger than those in the control group and the ADC signal became higher. On MRS, the area under the lipid peaks was larger, and the areas under the glutamic acid and lactic acid peaks were smaller in Group A than in the control group.
On the contrary, there was more necrosis but apoptosis was rarely seen across the timepoints in Group B (i.e. rats undergoing combined portal vein and hepatic artery ligation). Pathological changes in terms of the coagulative necrosis that we observed in Group B might explain the characteristic changes evident on MRI, including long T1 and long T2 signals in T1WI and T2WI, high DWI signals, the lowest rADC value and high lactic acid peaks on MRS. As with the changes occurring after brain infarction on DWI and MRS, 18 there were specific changes in Group B in the present study, including high DWI signals, lower ADC signals and larger areas under the lactic acid and glutamic acid peaks, compared with the control group. The T1WI, T2WI, DWI and MRS changes in Group B were first observed at 3 h and continued to be observed in samples collected at other timepoints.
Thus, the authors consider that MRI has two advantages: judging the success or otherwise of liver vessel ligation, during liver surgery procedures; detecting apoptosis and necrosis in vivo on the basis of MRI features, although apoptosis was typically confirmed by light microscopy, TEM, TUNEL staining and other such procedures used in this study.
There have been some reports of successful detection of apoptosis with MRI. The cell shrinkage associated with apoptosis can be detected due to changes in tissue water T2 and T1 relaxation times and the ADC. MRS approaches that have been used to study apoptosis in vivo have largely centred on the formation of cytoplasmic lipid bodies, detected by MRS. 19 Shen et al. 20 were the first to use MRS on living cells in vitro to detect metabolic changes in apoptosis. Hakumäki et al. 21 extended this approach by showing that MRS could detect increases in lipid signals following tumour treatment in vivo. Two groups using Jurkat T cells have shown that apoptosis is accompanied by an increase in cytoplasmic lipid droplets and a proportional increase in the lipid signal in MRS spectra.21,22 MRI provides spatial and temporal resolution that is superior to that of MRS. Liimatainen et al. 21 showed in the BT4C rat glioma model that, in HSV-tk transfected tumours, the spin–lattice (T1) and spin–spin (T2) relaxation times of water molecules in the tissue and their rates of diffusion increase during ganciclovir therapy. These animal models of apoptosis were different from ours in that they established tumour-cell apoptosis using drugs or radiation in vitro or in vivo, whereas the present results were achieved by right portal vein ligation. Noninvasive detection of apoptosis is likely to be a useful tool in the clinic, both for monitoring disease progression and for assessing response to treatment. MRS and, in particular, MRI are emerging as powerful noninvasive tools for clinical diagnosis. 23
There are some limitations to the present study. For example, the field intensity of the 1.5 T MRI apparatus was not high enough to get the optimum signal-to-noise ratio, images and accurate rADC values and MRS findings
In conclusion, hepatocyte apoptosis (induced by portal vein ligation) and coagulation necrosis (induced by combined portal vein ligation and hepatic artery ligation), respectively, exhibit specific characteristics on MRI, DWI and MRS. MRI, especially functional MRI, is likely to be a powerful tool to detect hepatocyte apoptosis and necrosis in vivo, and to become a clinical tool to judge the success of surgical procedures such as portal vein ligation and combined portal vein and hepatic artery ligation.
Footnotes
Declaration of conflicting interest
The authors declare that there are no conflicts of interest.
Funding
This work was supported by the Pudong New Area of the Development of Science and Technology Innovation Fund (PKJ2011-Y10), the Pudong New Area Health System Discipline Leaders (PWRd2011-05), the Shanghai health and family planning commission Fund (201440458) and the Pudong New Area of the Development of Science and Technology Innovation Fund (PKJ2014-Y20).
Acknowledgements
The authors thank Ruyong Tang for guidance with the pathological results and Jianping Fang for help with the pathological examinations (Pathology Department, Tongji Hospital, Shanghai).
a
Before the present study was undertaken, a pilot experiment (utilizing two rats each timepoint) was performed. From the pilot study, it was considered feasible to conduct the larger experiment described in this paper. The conclusions of the study as reported here were drawn from the findings observed in both the pilot experiment and the main experiment.