
Abstract
Background
In magnetic resonance-guided high-intensity focused ultrasound (MR-HIFU) treatment of uterine fibroids, the immediate ablation response is significantly affected by blood perfusion. The variability of measurement for blood perfusion is critical due to the inherent non-uniformity of tumor perfusion and its dependence on reproducible region of interest (ROI) placement.
Purpose
To investigate the value of whole-tumor ROI (ROIwt) analysis for quantitative perfusion in predicting immediate ablation response of uterine fibroids in MR-HIFU.
Material and Methods
Thirty-one fibroids in 28 eligible patients were treated with MR-HIFU. Quantitative perfusion parameters (Ktrans, Kep, and Vp) derived from dynamic contrast-enhanced MRI were obtained before MR-HIFU treatment. The ROIwt and single-layer ROI (ROIsl) were used for quantitative perfusion analysis. T1 contrast-enhanced MRI immediately after MR-HIFU treatment was conducted to determine the non-perfused volume ratio (NPVR). Intraclass correlation coefficient (ICC) was used for consistency test. Spearman’s correlation and multivariate linear regression were used to investigate the predictors of the NPVR. Received operating characteristic (ROC) curve was used to test the predictive efficacy of quantitative perfusion parameter.
Results
The intra- and inter-observer ICC of the quantitative perfusion parameters from ROIwt were higher than those from ROIsl. Multivariate analysis showed that the Ktrans of ROIwt was a predictor of the immediate ablation response. ROC analysis displayed that the AUC of Ktrans of ROIwt is 0.817 in predicting the ablation response.
Conclusion
Pretreatment Ktrans of ROIwt is more reliable and stable than that of ROIsl. It could be a predictor for the immediate ablation response of uterine fibroids in MR-HIFU.
Keywords
Introduction
Magnetic resonance-guided high-intensity focused ultrasound (MR-HIFU) is an emerging therapy technique to heat and coagulate tissue deep within the body, without damaging surrounding tissue (1–3). It is capable of reducing the size of the uterine fibroid and consequently relieving the fibroid-related symptoms while maintaining an excellent safety profile (4). The non-perfusion volume ratio (NPVR) is used to evaluate the ablation response. It is the ratio of the ablated portion to total fibroid volume immediately after ablation acquired from contrast-enhanced (CE) T1-weighted (T1W) imaging. It is a surrogate marker of the ablation response and serves as a measure of technical success (5).
NPVR immediately after MR-HIFU treatment is significantly affected by blood perfusion of uterine fibroids (6). Dynamic contrast-enhanced MR imaging (DCE-MRI) can quantitatively assess tumor blood perfusion and further predict the ablation response of uterine fibroids (7). In such a quantitative perfusion assessment, the variability of measurement might be more critical due to the inherent non-uniformity of tumor perfusion on a pixel-by-pixel basis. Also, it is highly dependent on reproducible region of interest (ROI) placement (8).
There are a variety of studies based on different ROI delineation methods to explore the relationship between fibroid blood perfusion and ablation response, such as single-layer ROI (ROIsl) analysis (6,9), treatment cell-based ROI analysis (treatment cells projecting into the baseline DCE-MRI) (7). However, no comparison of different ROI delineation methods has been performed in previous studies, leading to a lack of standardized operating procedures of ROI selection in the evaluation of MR-HIFU treatment for uterine fibroids. Confusion in data measurement could arise, which is not conducive to data stability and repeatability. Given that the assessment of MR-HIFU treatment of uterine fibroids is based on the volume reduction of the whole fibroid, we assume that the use of whole-tumor analysis might be more suitable for the pretreatment perfusion assessment.
For this purpose, the aim of the present study is to compare the reproducibility of two most commonly used ROI delineation methods in quantitative perfusion analysis: whole-tumor ROI (ROIwt) and ROIsl. Further, another aim of the present study is to investigate the value of ROIwt analysis in predicting immediate ablation response of uterine fibroids in MR-HIFU.
Material and Methods
Patients
MR-HIFU screening of patients in this study was a part of a clinical trial. It evaluated the efficacy and safety of the volumetric MR-HIFU system for the treatment of symptomatic uterine fibroids. This study was approved by the institutional review board of our institution. Informed consent was obtained from all individuals included in the study.
Between October 2013 and June 2015, a total of 52 women with one or more symptomatic uterine fibroids were screened. Patient inclusion criteria were: (i) premenopausal or perimenopausal women aged 18–55 years; (ii) absence of current or foreseeable pregnancy; (iii) no contraindication to MRI or contrast agents; and (iv) voluntary attendance at all study visits. Patient exclusion criteria were: (i) significant systemic or other pelvic diseases (endometriosis, ovarian tumor, acute pelvic disease, adenomyosis, or other mass); (ii) hematocrit < 25%; and (iii) scar in the ultrasound path along lower abdominal wall. After applying our inclusion and exclusion criteria, the eligible patients underwent MRI to screen the fibroids. Fibroids meeting the following requirements were enrolled: (i) diameter of target fibroid in the range of 3–10 cm by B-mode ultrasound; (ii) distance from abdominal wall skin to the center of the targeted fibroid <10 cm; (iii) volume of fibroid planned to be ablated < 300 mL; (iv) fibroid degeneration not exceeding 50% of the total volume of fibroids in MRI; (v) fibroids signal intensity (SI) on T2-weighted (T2W) imaging lower than that of myometrium; and (vi) no suspected malignancy.
MRI protocols
All MRIs were performed on a 1.5-T MR unit (Achieva, Philips, the Netherlands) using a 16-channel XL torso coil. All patients underwent conventional MRI including T1W imaging and T2W imaging during the screening procedure. Enrolled patients underwent DCE-MRI scans in the sagittal plane 7–10 days before treatment as follows: the pre-contrast scans were obtained using two different flip angles (5° and 15°) for T1 mapping as a baseline. After five baseline sets, gadopentetate dimeglumine (0.1 mmol/kg; Magnevist, Bayer Schering Pharma, Germany) was administered through an intravenous indwelling needle (20 G) at the rate of 2 mL/s, followed by a 20-mL bolus of saline administered at the same injection rate. Then 55 contrast-enhanced sets of images (total = 60 dynamics) without delay between acquisitions were acquired. MR imaging protocols are shown in Table 1.
Parameters of MR protocols.
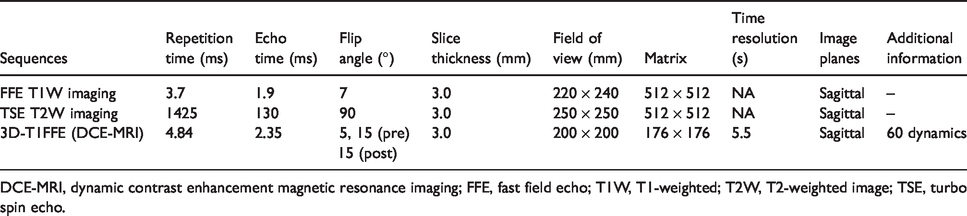
DCE-MRI, dynamic contrast enhancement magnetic resonance imaging; FFE, fast field echo; T1W, T1-weighted; T2W, T2-weighted image; TSE, turbo spin echo.
Baseline features assessment
Basic information of the patients was acquired during the screening stage. The symptom severity score (SSS) derived from uterine fibroid symptom and health-related quality of life questionnaire were evaluated by the gynecologist on the day of treatment (10). The location (submucosal, intramural, and subserous), diameter in the center slice, volume, number, and distance from abdominal wall skin to the center of the targeted fibroid were evaluated by the radiologist. Maximal axial diameter (a), coronal diameter (b), and sagittal diameter (c) were used to obtain the fibroid volume (πabc/6). The uterine fibroids were divided into two types according to the signal intensity (SI) by visual inspection: type 1 = low SI compared to that of skeletal muscle; and type 2 = higher SI than that of skeletal muscle and lower than that of the myometrium. According to the study of Funaki et al. (11), only type 1 and type 2 fibroids are suitable candidates for MR-HIFU, whereas type 3 fibroids are not.
Image analysis
The quantitative perfusion parameters were acquired with dedicated DCE-MRI postprocessing software (Omni-Kinetics; GE Healthcare, Milwaukee, WI, USA) as follows: (i) the two non-enhanced image sequences with different flip angles of 5° and 15° were loaded to estimate the tissue T1 mapping; (ii) a reference region model accompanied by arterial input function (AIF) and T1 mapping was used to calculate the parametric maps; and (iii) three quantitative DCE parameter (Ktrans, Kep, and Vp) were obtained by delineation of ROI at each slice of the target fibroids (12). Ktrans is a surrogate of capillary permeability and blood perfusion. Kep represents the flux rate constant between extravascular extracellular space and plasma. Vp represents the fraction of blood plasma within a voxel.
Two observers (with 10 and 15 years of diagnostic experience in pelvic MRI, respectively) performed two unique ROI measurements manually. All the selective ROI placement focused on those areas where there was enhancing component from the DCE-MRI, avoiding areas of degeneration, hemorrhage, and necrosis. ROIsl was placed on the slice with the largest diameter in the sagittal plane (Fig. 1). ROIwt was placed slice-by-slice in the sagittal plane of the target fibroid, without the bipolar slice of the fibroid to avoid the partial volume effect (Fig. 1). By drawing ROI slice-by-slice, the DCE parameters of the whole tumor were obtained by using the fusion function of the software. All the measurements were performed again by Observer 1 two weeks after the first measurement. The average result of Observer 1 with 10 years of diagnostic experience was used to assess the prediction role of DCE-MRI in immediate ablation response. The time used to outline the ROI was recorded.
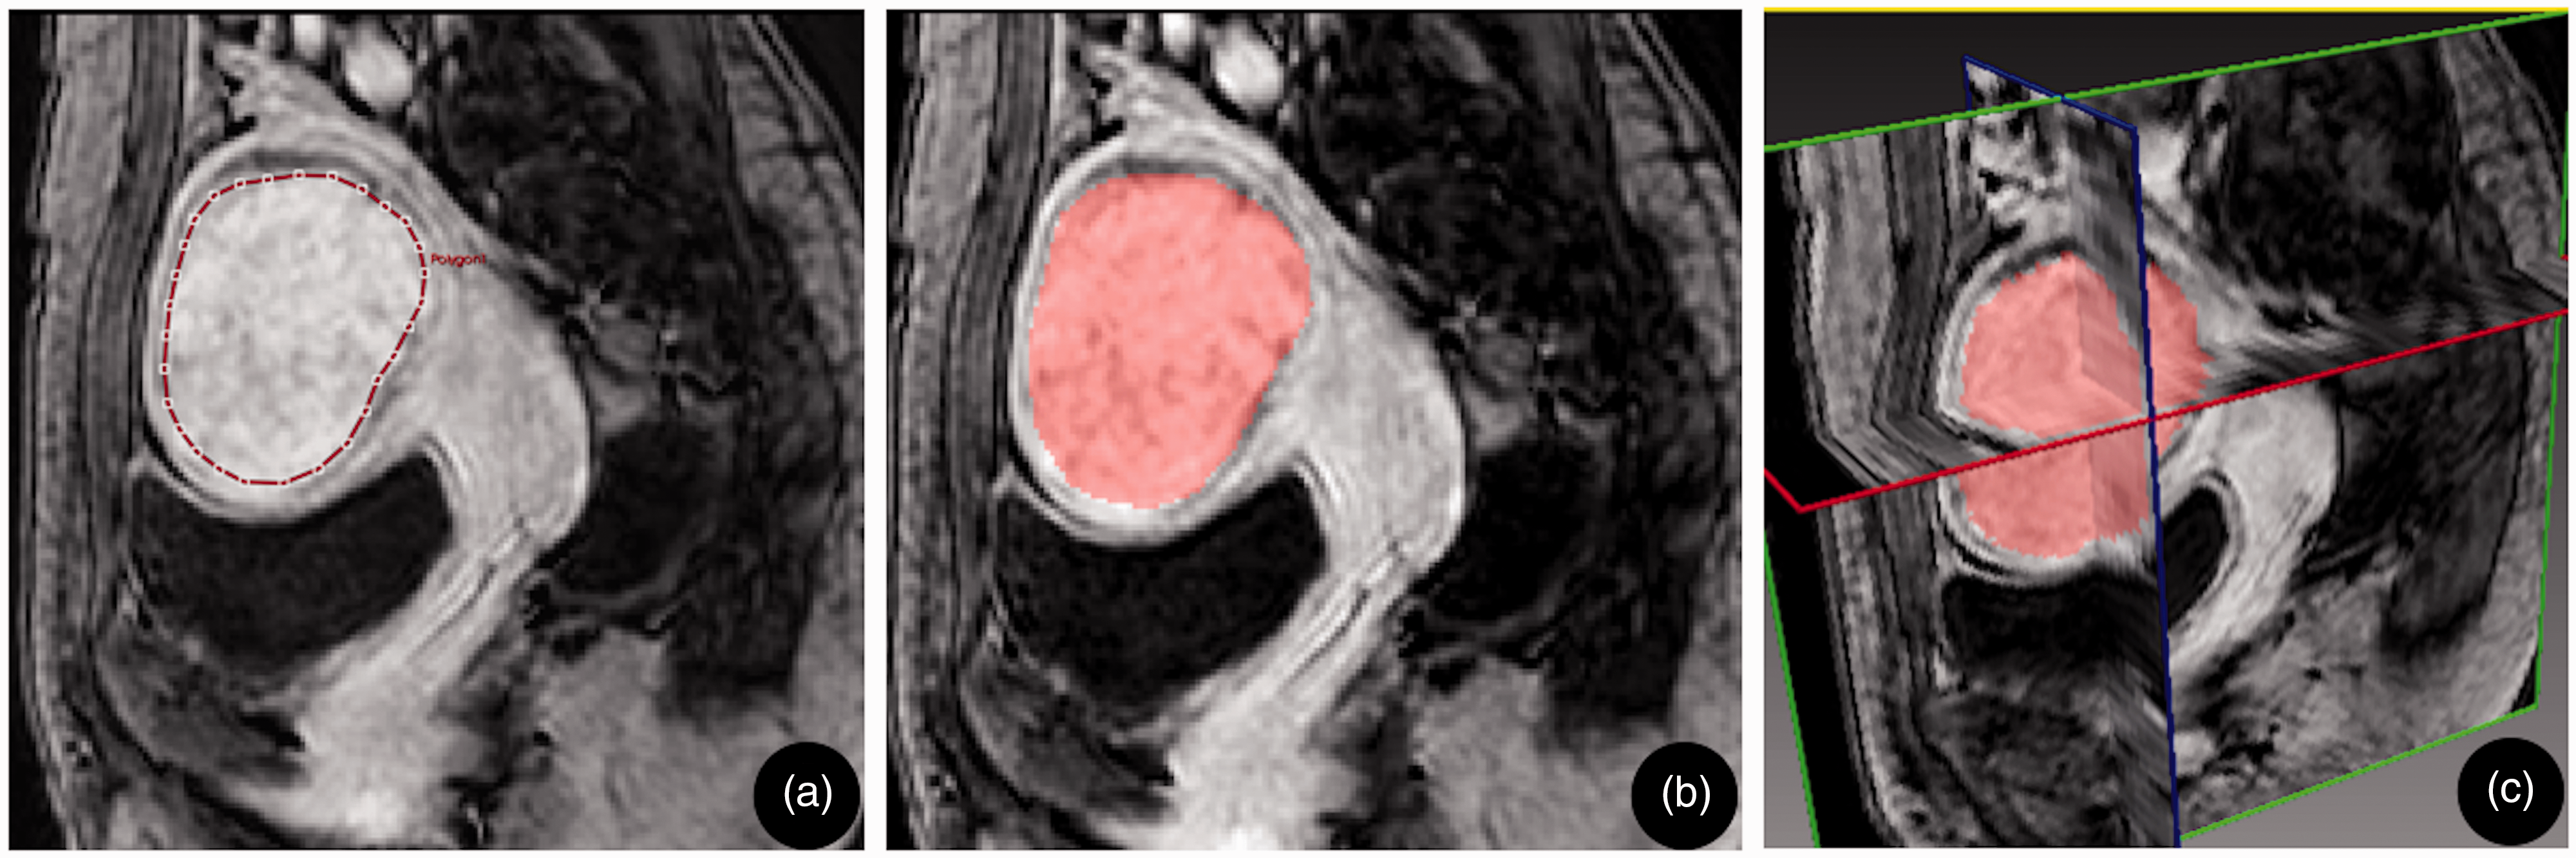
Schematic diagram of ROIsl and ROIwt selection. A 43-year-old woman who complained of menorrhagia and urinary frequency was treated with MR-HIFU, with baseline SSS 50. A contrast-enhanced T1W image in a sagittal plane (a, b) and in a 3D view (c). (a) ROIsl selection. At the maximum diameter of the fibroid center, an irregular ROI was delineated approximately 3 mm below the fibroid boundary. (b) ROIwt selection. ROI was placed slice-by-slice in the target fibroid, without the bipolar slice of the fibroid to avoid the partial volume effect. Merged the ROIs delineated at all slices and obtained the sagittal fusion ROI. (c) The 3D image obtained by the ROIwt selection. The red, green, and blue lines represent the axial, sagittal, and coronal images, respectively, through the center of the fibroid. 3D, three-dimensional; MR-HIFU, magnetic resonance-guided high-intensity focused ultrasound; ROIsl, single-layer region of interest; ROIwt, whole-tumor region of interest; T1W, T1-weighted.
MR-HIFU procedure and post-therapeutic NPV assessment
All treatments were conducted using a clinical extracorporeal MR-HIFU system (Sonalleve, Philips) integrated into a 1.5-T MR scanner. The system comprised a phased-array 256-channel transducer (radius of curvature = 12 cm, aperture = 13 cm, operable at 1.2 or 1.45 MHz) equipped with a mechanical displacement device with five degrees of freedom (three translational and two rotational). It enabled volumetric ablation with binary feedback control monitored by MR thermometry (13).
Immediately after MR-HIFU treatment, CE-T1W imaging was performed with intravenous administration of gadopentetate dimeglumine (0.1 mmol/kg; Magnevist, Bayer Schering Pharma, Germany, 2 mL/s, followed by a 20-mL bolus of saline administered at the same injection rate). The non-perfused volume (NPV) was acquired using the sum of the non-enhanced areas of each slice multiplied by the slice thickness. The NPVR was calculated as the ratio of NPV by the fibroid volume. Due to the lack of a uniform standard for the definition of ablation, we referred to some studies that >60% of NPVR represented an ablation response in MR-HIFU therapy (2,14).
Statistical analysis
The variables are expressed as mean ± SD. The Dice similarity coefficient (DSC) is used to evaluate the reproducibility of ROI selection methods (15). The DSC is defined as: DSC = (2 × (A ∩ B))/(A + B), where A, B, and A ∩ B are the ROIs selected by the two observers and the overlapping area between the two, respectively. The DSC is a statistical measure of the spatial overlap of ROIs from the two observers, with a range of 0–1, with 0 indicating no overlap and 1 indicating complete agreement between the two observers. Intraclass correlation coefficient (ICC) and Bland–Altman plots were used to evaluate the reliability of inter-observer and intra-observer analysis of the two ROI selection methods. ICC < 0.5, in the range of 0.5–0.75, in the range of 0.75–0.9, and >0.9 are indicative of poor, moderate, good, and excellent reliability, respectively (16). Spearman’s correlation and multivariate linear regression analyses were carried out to investigate the potential predictors of the NPVR. Receiver operating characteristic (ROC) curve analyses were used to test the predictive efficacy of two ROI selection methods. A P value < 0.05 was considered statistically significant. Statistical analysis was performed using SPSS for Windows (SPSS Statistics 22.0, IBM Corp., Armonk, NY, USA) and MedCalc (MedCalc 13.0, Mariakerke, Belgium).
Results
Patients and MR-HIFU treatment
Of the 30 enrolled patients, two cases were excluded because of motion and breathing artifacts, which was unsuitable for DCE-MRI data analysis. The final study group comprised 28 patients (mean age = 43.8 years, age range = 37–54 years) with 31 fibroids (mean maximal diameter = 5.7 cm; range = 3.4–9.2 cm; mean volume = 78.4 mL; range = 17.6–297.6 mL). The baseline characteristics of the study population were summarized in Table 2. The duration of total ablation, NPV, and NPVR were 146.1 ± 78.0 min (range = 55.1–399.3 min), 40.9 ± 34.1 mL (range = 8.1–138.3 mL), and 61.7% ± 19.4% (range = 27.3%–99.1%), respectively.
Baseline characteristics of patients and fibroids.
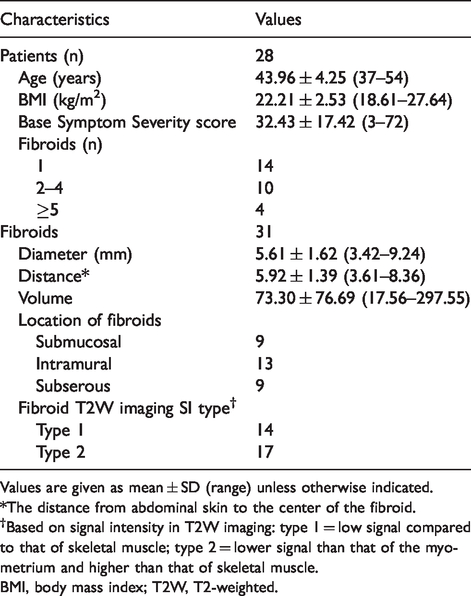
Values are given as mean ± SD (range) unless otherwise indicated.
*The distance from abdominal skin to the center of the fibroid.
†Based on signal intensity in T2W imaging: type 1 = low signal compared to that of skeletal muscle; type 2 = lower signal than that of the myometrium and higher than that of skeletal muscle.
BMI, body mass index; T2W, T2-weighted.
Reproducibility analysis of the two ROI selection methods
The DSC values of the two ROI selection methods were 0.86 ± 0.07 for ROIwt and 0.84 ± 0.06 for ROIsl. The intra-observer and inter-observer ICCs of the two ROI selection methods was displayed in Table 3. It displayed that all the ICCs of quantitative perfusion parameters of ROIwt were higher than those of ROIsl (P = 0.035). In Fig. 2, the Bland–Altman plots are presented with the intra-observer agreement for quantitative perfusion parameters of ROIwt and ROIsl. Fig. 3 displays the inter-observer agreement for quantitative perfusion parameters of ROIwt and ROIsl. Three quantitative perfusion parameters of the two ROI selection methods indicated excellent intra-observer and inter-observer consistency. The time used to outline ROIwt (67.27 ± 24.43 s) was longer than that of ROIsl (9.30 ± 2.40 s) (P = 0.003).
The intra-observer and inter-observer ICCs of the two ROI selection methods.
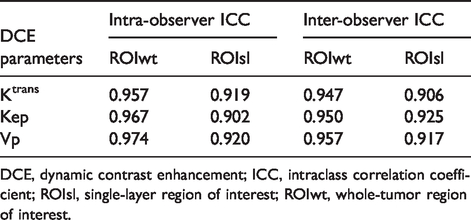
DCE, dynamic contrast enhancement; ICC, intraclass correlation coefficient; ROIsl, single-layer region of interest; ROIwt, whole-tumor region of interest.
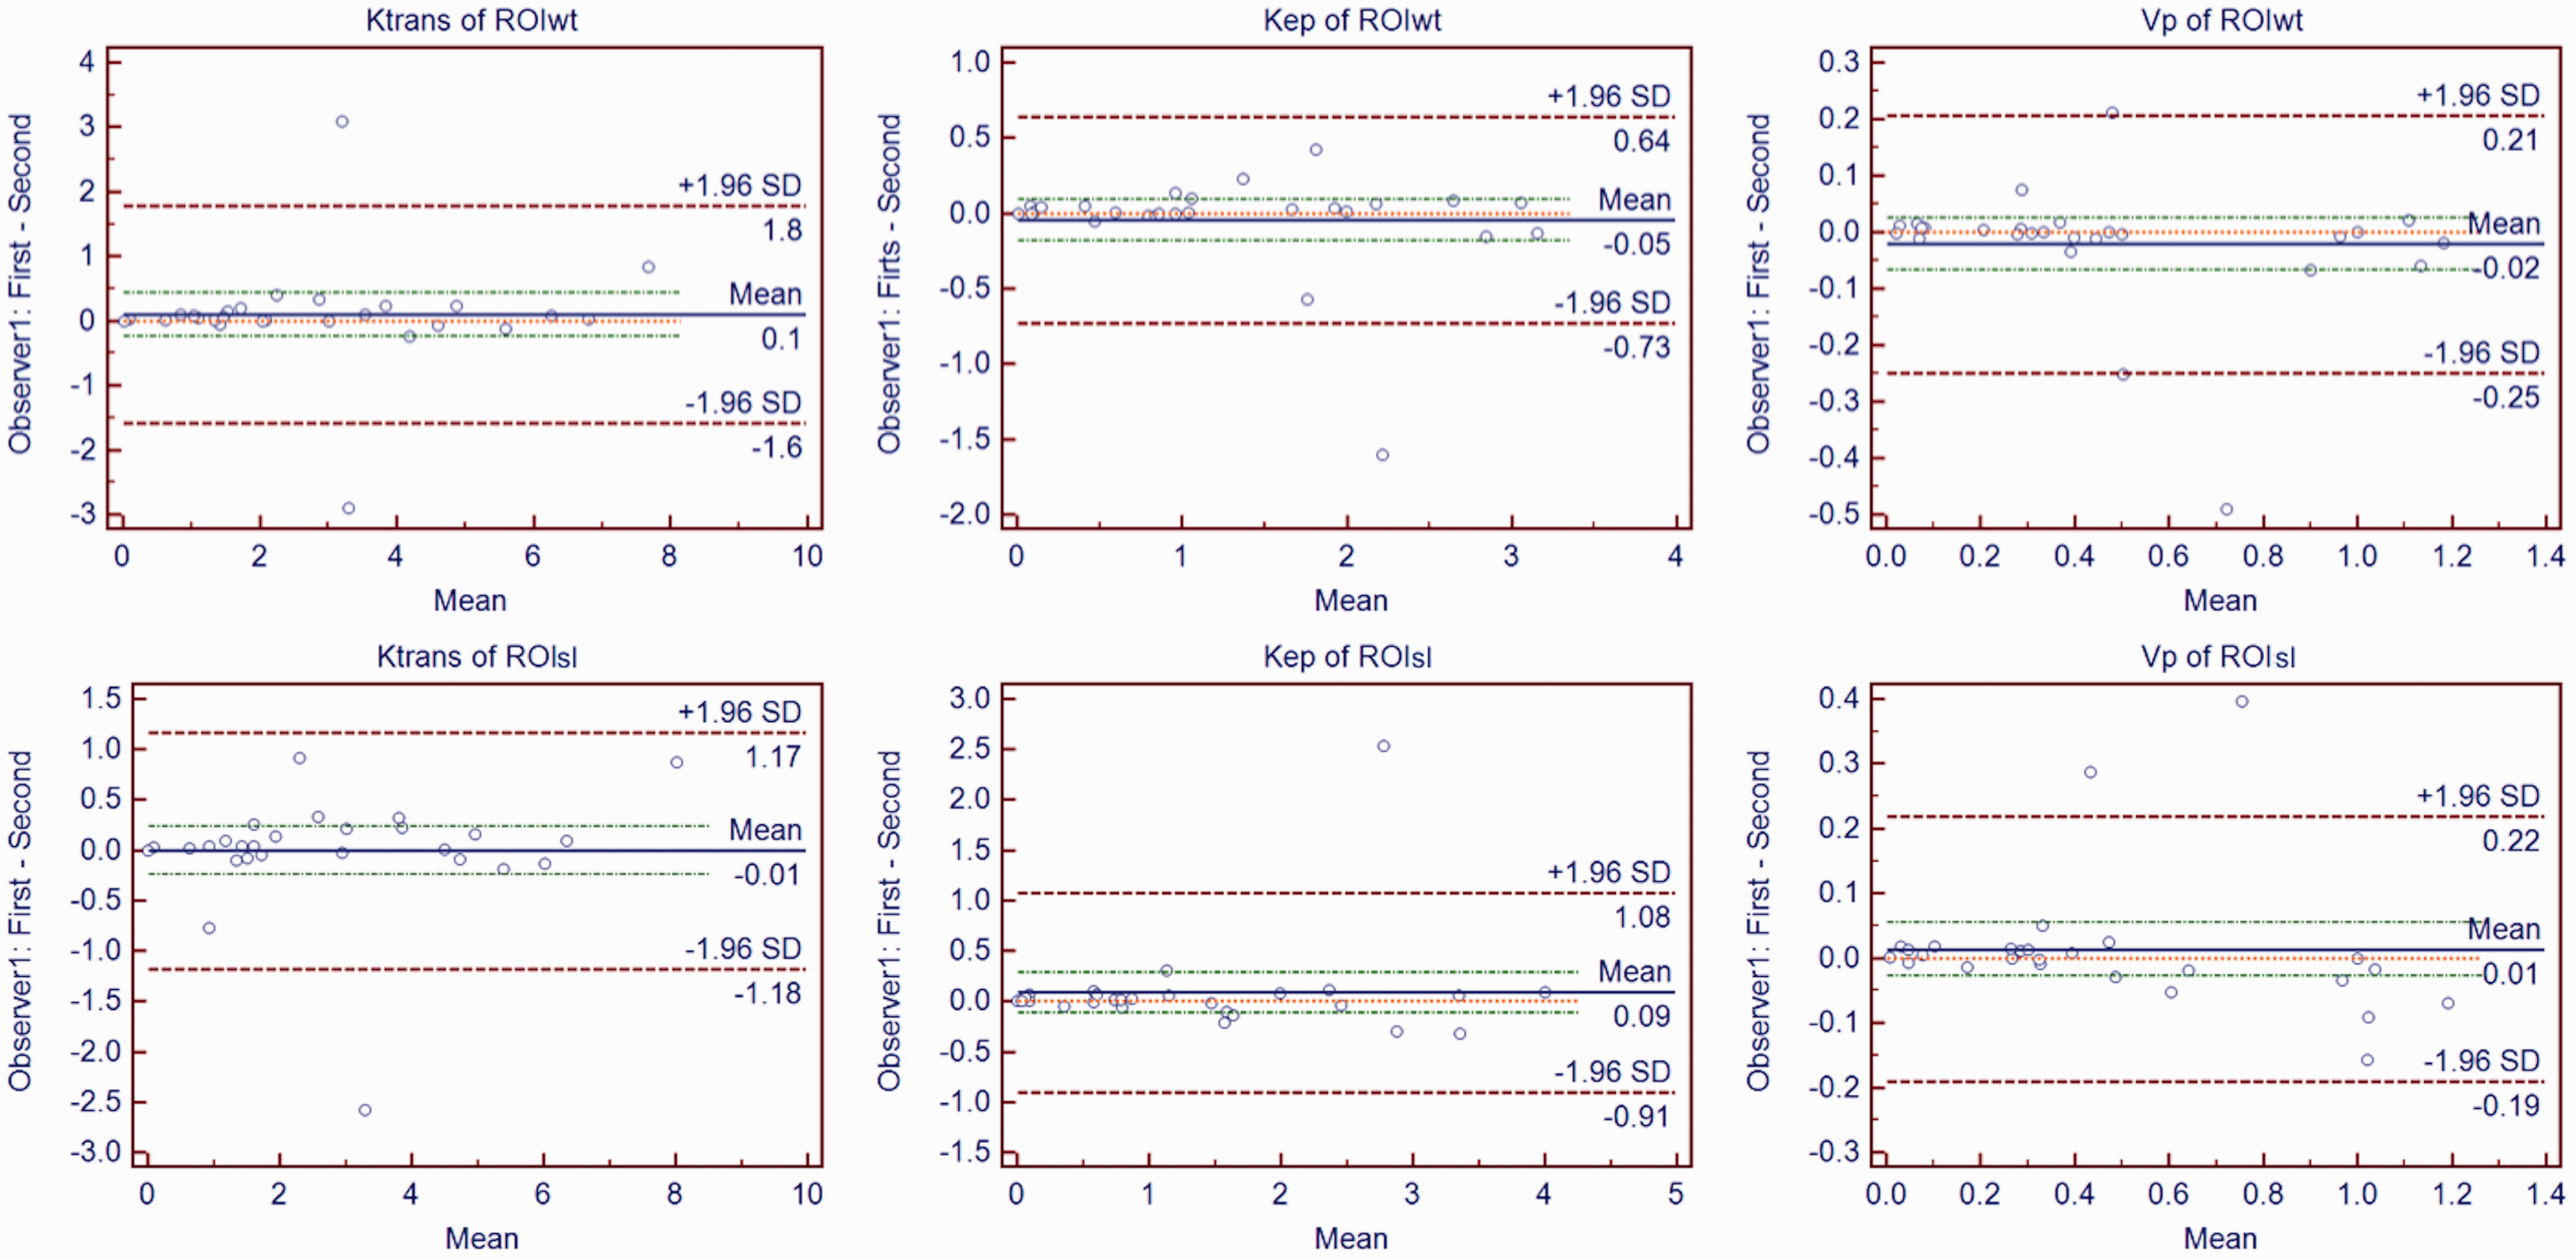
Bland–Altman plots of intra-observer agreement for ROIwt (first row) and ROIsl (second row) measurement. Differences of Ktrans, Kep, and Vp values between the two measurements of Observer 1 (y-axis) were plotted against mean values of Ktrans, Kep, and Vp between the two measurements of Observer1 (x-axis). The central red dashed line was the line of equality (difference = 0). The blue solid line represented the mean absolute difference, with a 95% CI of mean of the two measurements (two red dashed lines). The two green dashed lines represented the 95% CI limits of agreement. It showed that the three quantitative perfusion parameters of the two methods of ROI selection displayed an excellent intra-observer agreement. CI, confidence interval; ROIsl, single-layer region of interest; ROIwt, whole-tumor region of interest.
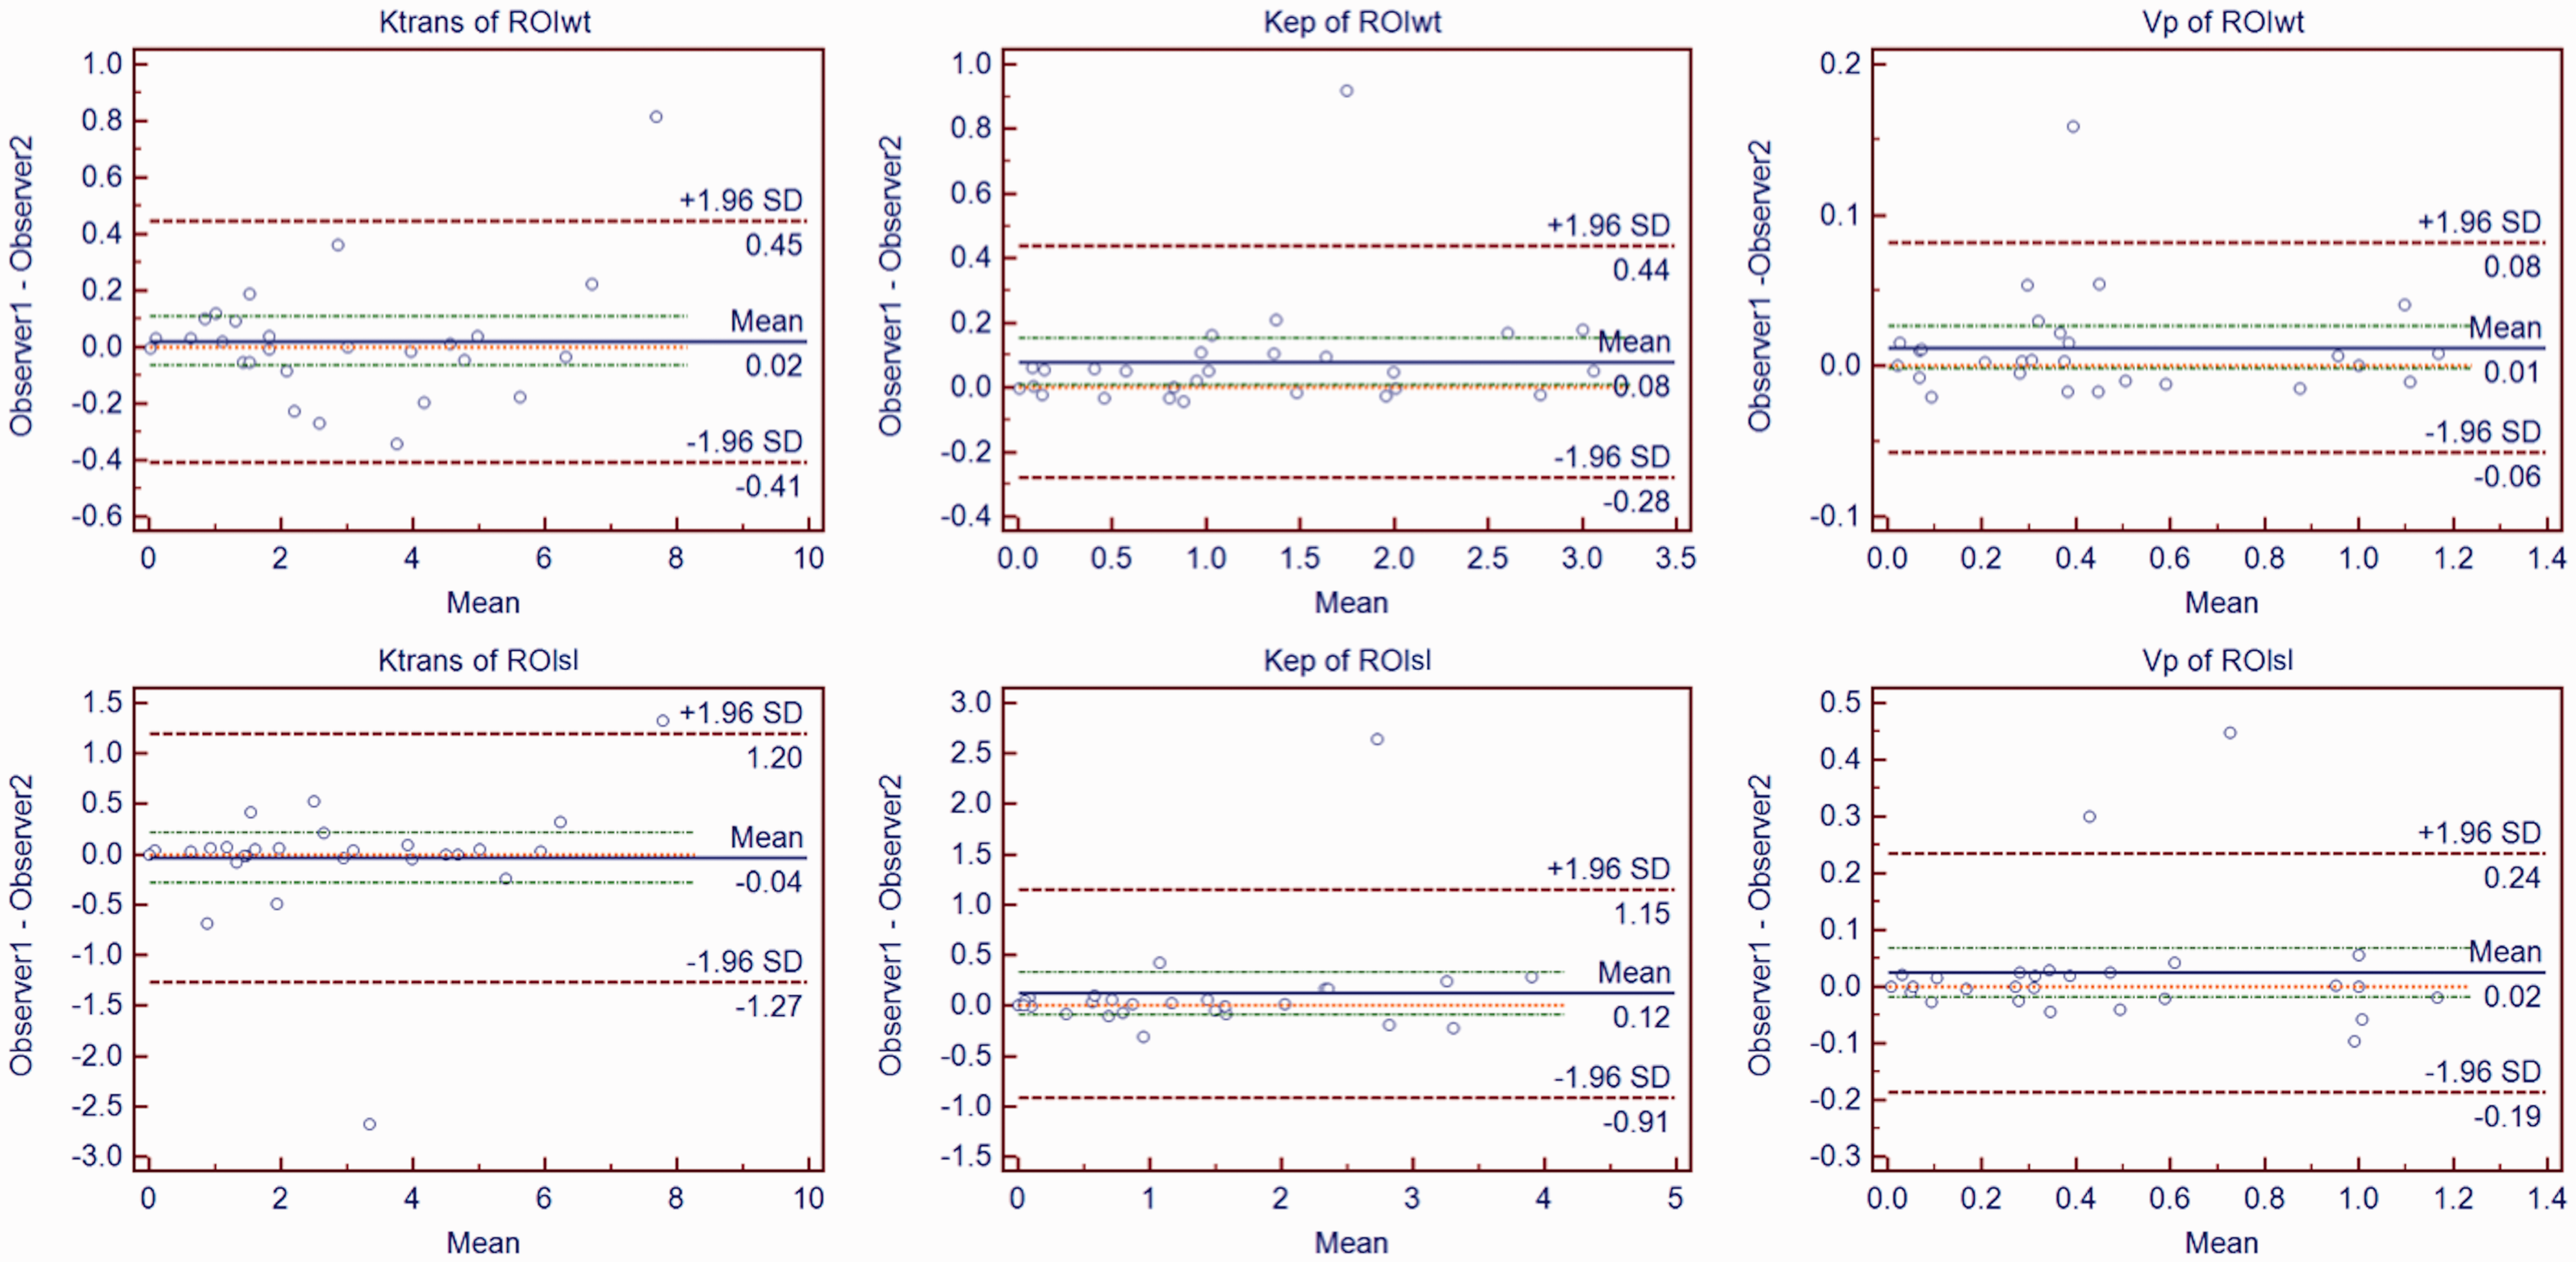
Bland–Altman plots of inter-observer agreement for ROIwt (first row) and ROIsl (second row) measurement. Differences of Ktrans, Kep, and Vp values between the two observers (y-axis) were plotted against mean values of Ktrans, Kep, and Vp between the two observers (x-axis). The central red dashed line was the line of equality (difference = 0). The blue solid line represented the mean absolute difference, with a 95% CI of mean difference of the two measurements of Observer 1 and Observer 2 (two red dashed lines). The two green dashed lines represented the 95% CI limits of agreement. It showed that the three quantitative perfusion parameters of the two ROI selection methods displayed an excellent inter-observer agreement. CI, confidence interval; ROIsl, single-layer region of interest; ROIwt, whole-tumor region of interest.
Analysis of predictors of immediate ablation response
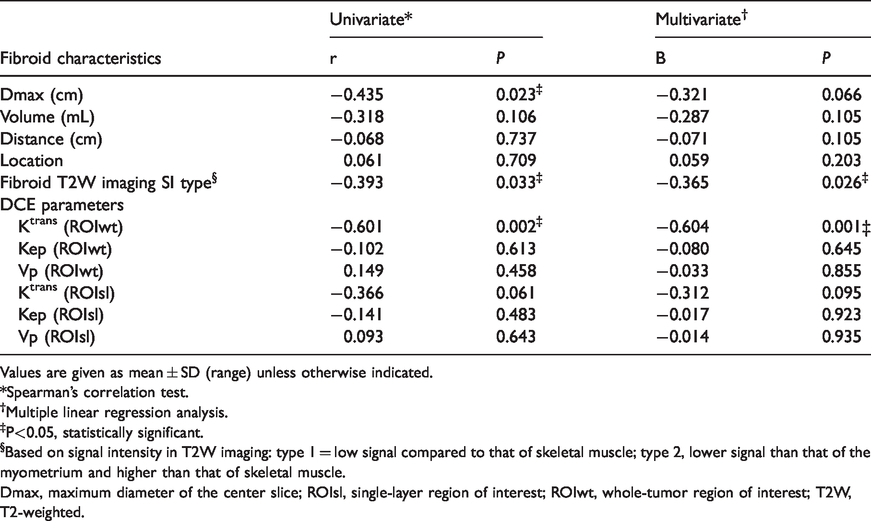
Spearman’s correlation test was applied to evaluate the relationship between NPVR and all fibroids characteristics. It included quantitative perfusion parameters of the two ROI selection methods, diameter, volume, distance, T2 SI type, and location. Relationship between NPVR and Ktrans of ROIwt, maximum diameter, and T2 SI type was revealed. Spearman’s correlation coefficients were –0.601 (P = 0.002), –0.435 (P = 0.023), and –0.393 (P = 0.033), respectively (Table 4). No relationship between NPVR and volume, distance, and location was found. Multivariate linear regression showed that Ktrans of ROIwt and T2 SI type were predictors of immediate ablation of fibroids, with regression coefficient –0.604 (P = 0.001) and –0.365 (P = 0.026), respectively.
Multivariate analysis of fibroids characteristics on ablation response.
Values are given as mean ± SD (range) unless otherwise indicated.
*Spearman’s correlation test.
†Multiple linear regression analysis.
‡P<0.05, statistically significant.
§Based on signal intensity in T2W imaging: type 1 = low signal compared to that of skeletal muscle; type 2, lower signal than that of the myometrium and higher than that of skeletal muscle.
Dmax, maximum diameter of the center slice; ROIsl, single-layer region of interest; ROIwt, whole-tumor region of interest; T2W, T2-weighted.
ROC analysis of Ktrans from whole-tumor ROI in predicting the ablation response
ROC curve analysis was used to evaluate the value of Ktrans obtained from the ROIwt selection methods in predicting the ablation response. It showed that the AUC of Ktrans of ROIwt to predict good ablation response of fibroids was 0.817 (Fig. 4). When the cut-off value of Ktrans of ROIwt was set at 3.2 by the Yoden index, the sensitivity and specificity to predict good ablation response were 84.6% and 72.7%, respectively.
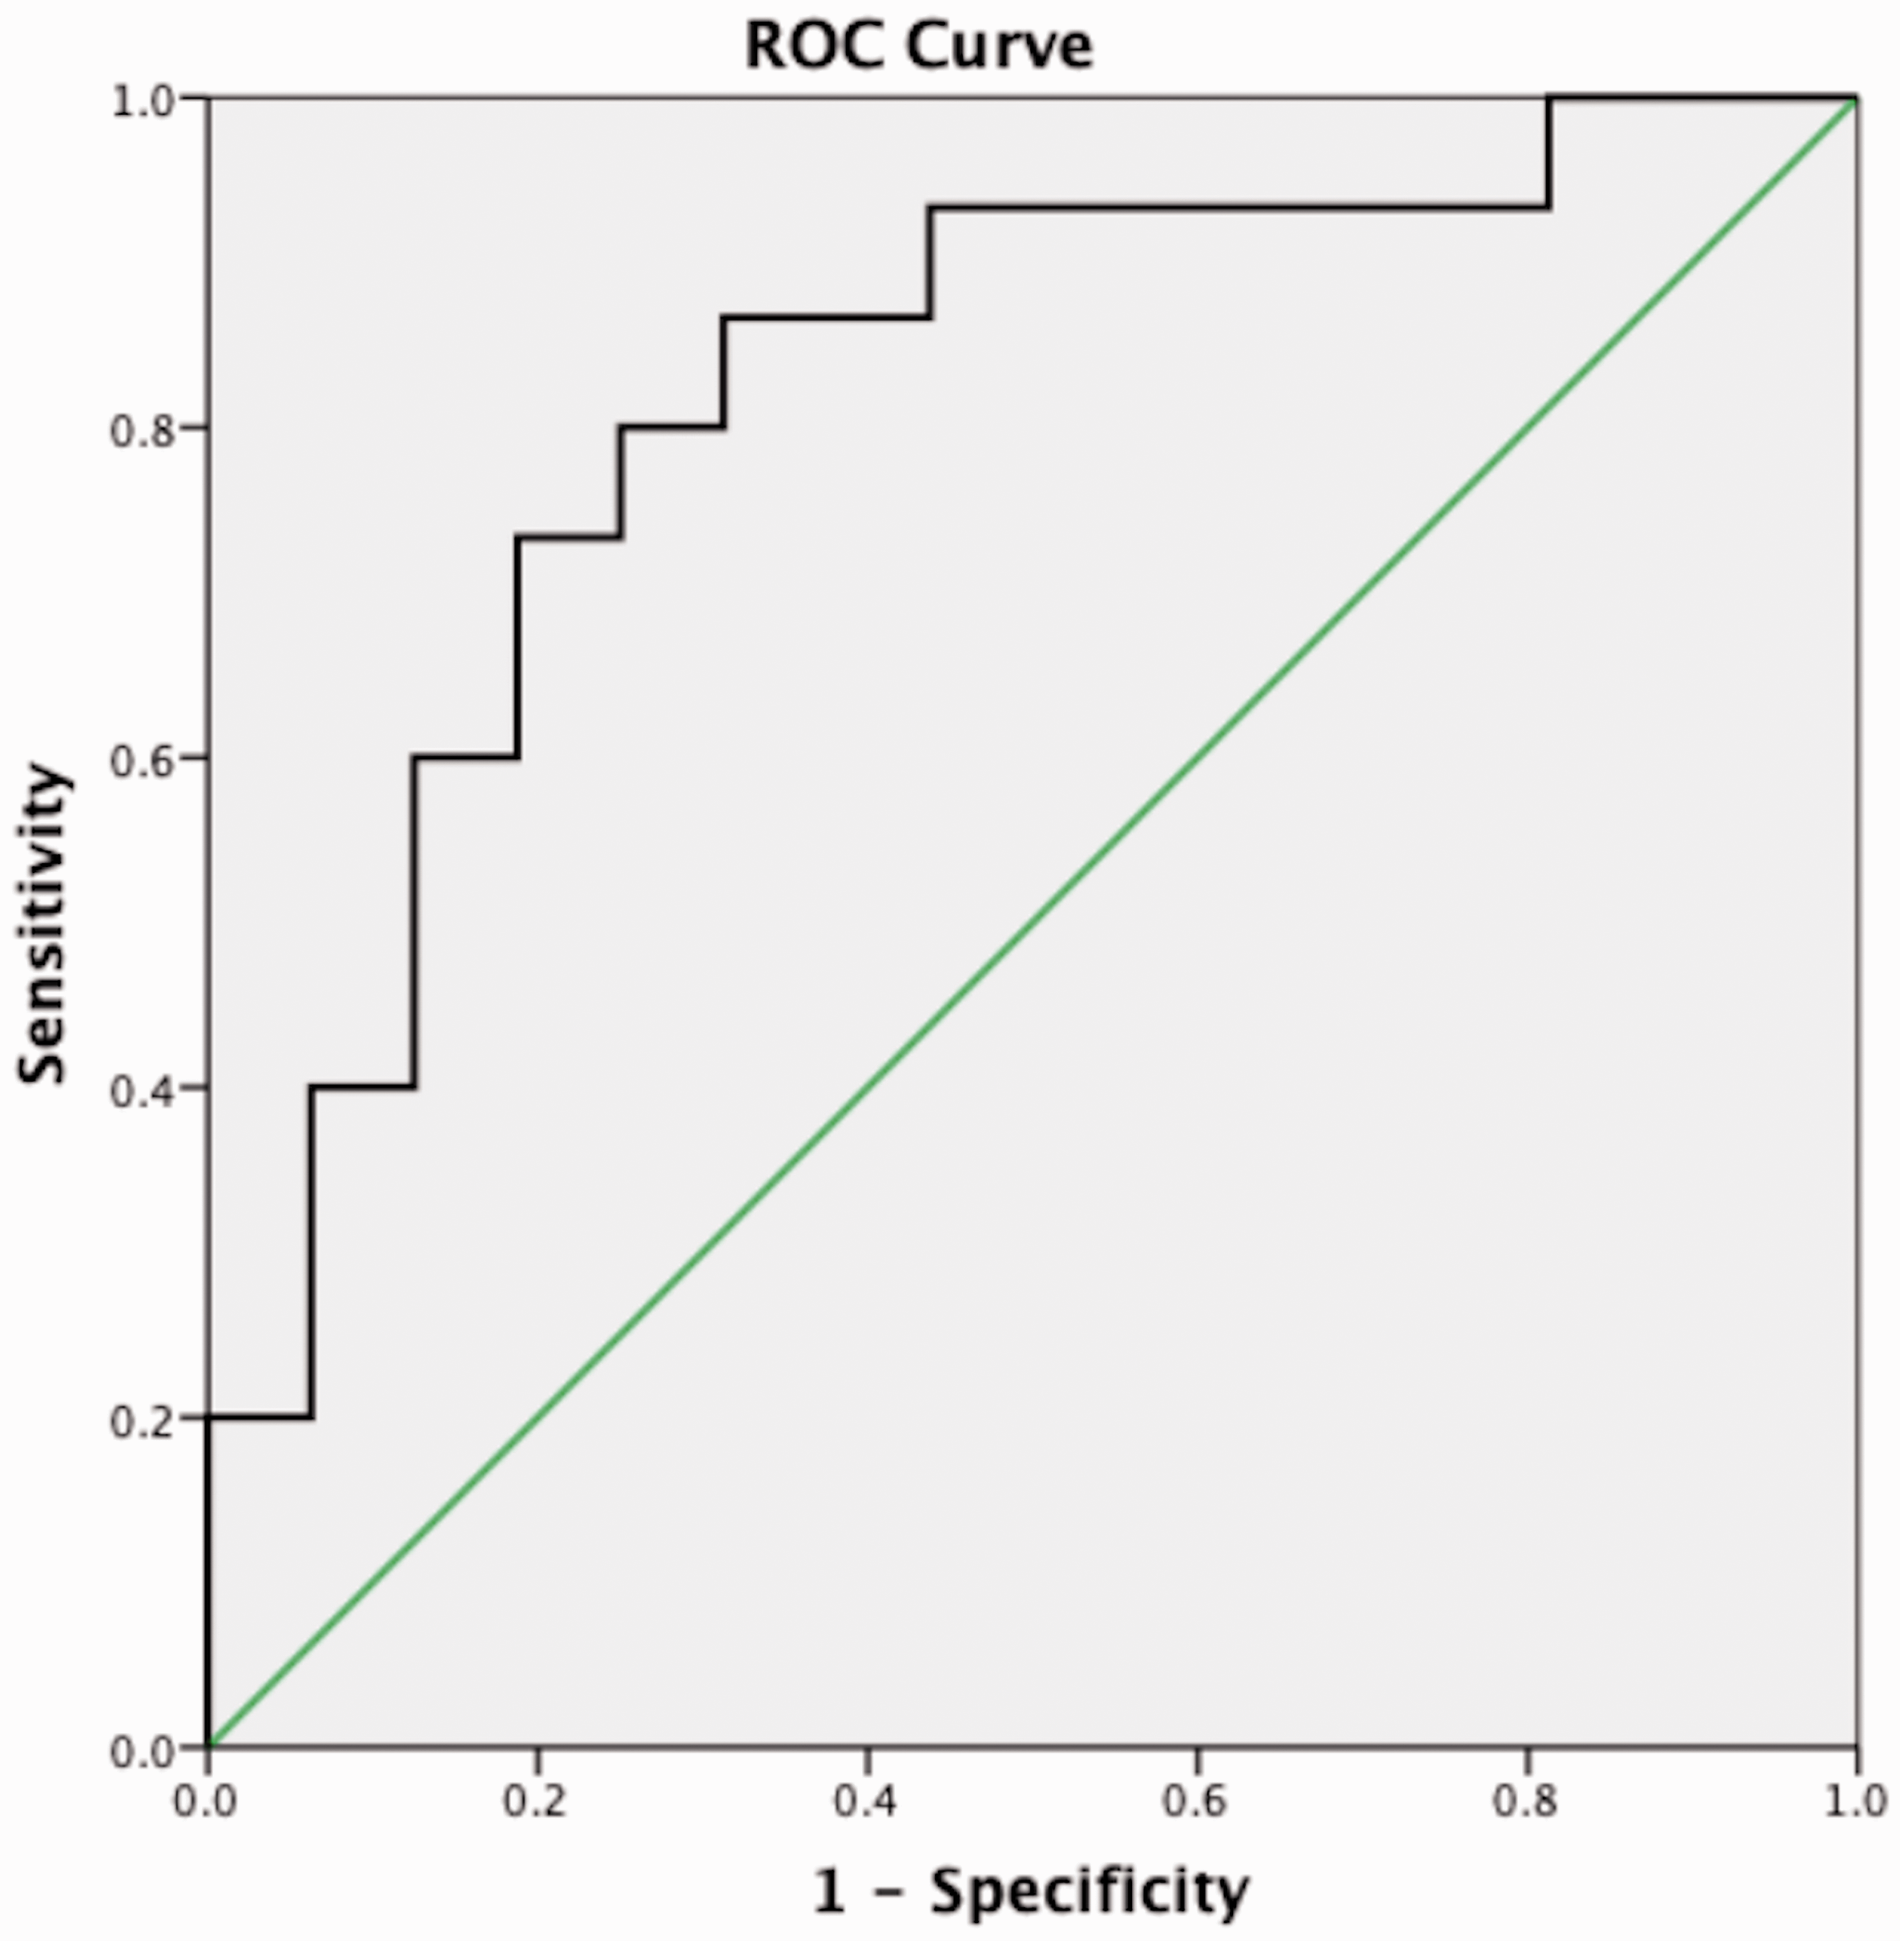
ROC curve for predictive efficacy of the Ktrans from the ROIwt selection. When using ≥60% as good ablation response for NPVR, it showed that the AUC of Ktrans from ROIwt was 0.817. AUC, area under the curve; NPVR, non-perfused volume ratio; ROC, receiver operating characteristic; ROIwt, whole-tumor region of interest.
Discussion
This study used two different ROI selection methods to analyze the quantitative perfusion parameters of uterine fibroids. We aimed to find the optimal method of ROI selection to predict the immediate ablation response in MR-HIFU treatment of uterine fibroids. The results showed that the Ktrans of quantitative perfusion from ROIwt had higher stability and efficacy in predicting the ablation response compared to the ROIsl.
The result from ICC analysis and Bland–Altman plots showed that both of the two ROI selection methods displayed good consistency. DSC analysis showed that the two methods of ROI selection had good consistency in delineating ROI between different observers. All of the results suggested that the perfusion parameters from the two methods of ROI selection were stable. The consistency of both intra- and inter-observer of ROIwt was higher than that of ROIsl, which suggests ROIwt is more reliable and more consistent than ROIsl. Therefore, analyzing the values of all pixels within the whole tumor is feasible in blood perfusion evaluation. This is consistent with the results of corresponding literature that the whole-tumor analysis yielded more stable quantitative characterization of tumor compared with the single-layer measurement (17–19).
Among all the characteristics of fibroids, Ktrans of ROIwt showed the highest negative correlation coefficient of –0.601. This is similar to previous studies which showed blood perfusion is the most important factor influencing the ablation efficiency of MR-HIFU treatment (6,7,9,20,21). Although blood perfusion plays a pivotal role in predicting the ablation response of uterine fibroids in MR-HIFU, there is no standard on how to determine ROI. Single-layer ROI delineation method for blood perfusion evaluation was applied in some studies to predict the ablation response of fibroids (6,9). However, it has significant limitations in reflecting the overall continuity of the tumor and adequately describe tumor heterogeneity (19). In addition, the measurement difference between observers is another significant concern (22). In another study, treatment cells were projected cell-by-cell into baseline DCE-MR images (7). However, it is technically difficult to accurately transplant treatment cells into DCE-MR images and calculated the NPVR of each treatment cell. Moreover, considering all treatment cells within a tumor as a single independent sample might result in selection bias. While, in the MR-HIFU treatment, the NPV represents the non-perfused volume of the whole fibroid. It is based on the volume rather than the single slice. Therefore, we supposed it was necessary to use volume-based whole-tumor data for quantitative perfusion analysis.
Only the Ktrans from ROIwt had a negative relationship with NPVR among the DCE parameters of ROIwt and ROIsl. It showed an efficacy of 0.817 in ablation response prediction with excellent sensitivity and specificity, which confirms the validity of whole-tumor quantitative perfusion analysis in MR-HIFU. To the fibroids with higher Ktrans, rapid blood circulation from the surrounding zone at a lower temperature dissipates the heat accumulation within the target tissue. It will lead to inadequate local temperature control for an effective ablation (23). T2 SI is another known predictor of ablation response. Fibroids with high T2 SI represent a degenerative and cellular fibroid with vascularization and fluid-rich tissues. That heterogeneity scatters the ultrasound wave, obstruct focusing, and retards temperature elevation (24).
Compared to ROIsl analysis, ROIwt analysis takes more time. The results showed that the average ROI outlining time of whole tumor was 67 s. However, this difference was only in the 1-min dimension and was insignificant or negligible relative to the entire research process. Although ROIsl takes a shorter time, its inherent lack of representation promoted more and more researchers tend to use the whole-tumor method for analysis (17–19). ROIwt measurement was easy to achieve standardization in the clinical implementation process and expected to provide standardized data measurement procedures for further multicenter experiments.
The present study had some limitations. First, the study sample size was small. This study was based on a clinical study of volumetric MR-HIFU in a Chinese population of uterine fibroids. Considering the safety of treatment, the inclusion and exclusion criteria were strict and thus enrollment was limited to a small number of patients. Further research is needed to expand the sample size to confirm the results. Second, there is currently no gold standard for determining effective ablation response. The effective ablation response threshold selected in the ROC curve analysis in this study was based on the study by Morita et al. (2). Although some studies have shown that 80% of NPVR have a good therapeutic effect (4), there is currently no large sample multicenter study to confirm this. Third, only immediate NPVR was considered to determine the ablation response of MR-HIFU treatment. In further studies, follow-up results should be observed to assess the long-term efficacy of MR-HIFU.
In conclusion, ROIwt analysis provided more reliable and consistent measurements than ROIsl analysis. The quantitative perfusion parameter of Ktrans for whole-tumor analysis is a predictor of the immediate ablation efficacy of uterine fibroids. It could help to effectively screen patients with uterine fibroids suitable for MR-HIFU treatment.
Footnotes
Acknowledgements
The authors thank Dr Yueling Wang and Dr Xiaobin Han in the Department of Obstetrics and Gynecology for preparing and monitoring the patients in this study. They also thank Professor Jie Zheng from the Clinical Research Center of the hospital for his help with statistics. Finally, the authors thank all participants for their loyalty and cooperation.
Declaration of conflicting interests
The authors declared no potential conflicts of interest with respect to the research, authorship, and/or publication of this article.
Funding
The authors disclosed receipt of the following financial support for the research, authorship, and/or publication of this article: This study was supported by the National Natural Science Foundation of China (No. 81771810, 81471631 and 51706178), National Key Research and Development Program of China (2016YFC0100300).