
Abstract
Self-employment hours, as measured using the Current Population Survey (CPS), occasionally vary widely from one quarter to the next, and these variations can result in large fluctuations in measures of quarterly labor productivity produced by the U.S. Bureau of Labor Statistics. In this paper, we examine whether certain aspects of the CPS sample design, including sample weighting, the rotation group framework, imputation methods, and proxy-reporting, are associated with these large variations. We find that volatility in the number of self-employed is much higher when comparing changes in self-employment among workers who are not in the sample in two consecutive quarters compared with those who are in the sample in consecutive quarters. In addition, proxy-responses make larger contributions to self-employment growth in more quarters than do self-responses, and month-to-month changes in class-of-worker status occurring with transitions between proxy- and self-responses in the CPS panel contribute to increased volatility. Finally, imputed self-employment is more volatile than nonimputed self-employment, but there are few imputed responses.
1. Introduction
Although unincorporated self-employed workers currently make up only 6% of the workforce, volatility in their aggregate hours worked sometimes has a disproportionate effect on quarterly labor productivity measures for the nonfarm business sector published by the U.S. Bureau of Labor Statistics (BLS). Productivity growth is measured as the difference between the growth in output and the growth in total hours worked. Thus, any change in hours will impact measured productivity growth. Figure 1 shows the annualized growth in quarterly hours for unincorporated self-employed/unpaid family workers (SEUFW), employees, and all workers over the 2000 to 2019 period. (Data for all figures are available in table form in Supplemental Material.) The hours growth for SEUFW is much more volatile than that for employees and, in some quarters, we see spikes in the SEUFW hours series that lead to substantial gaps between the employee and all worker hours series.
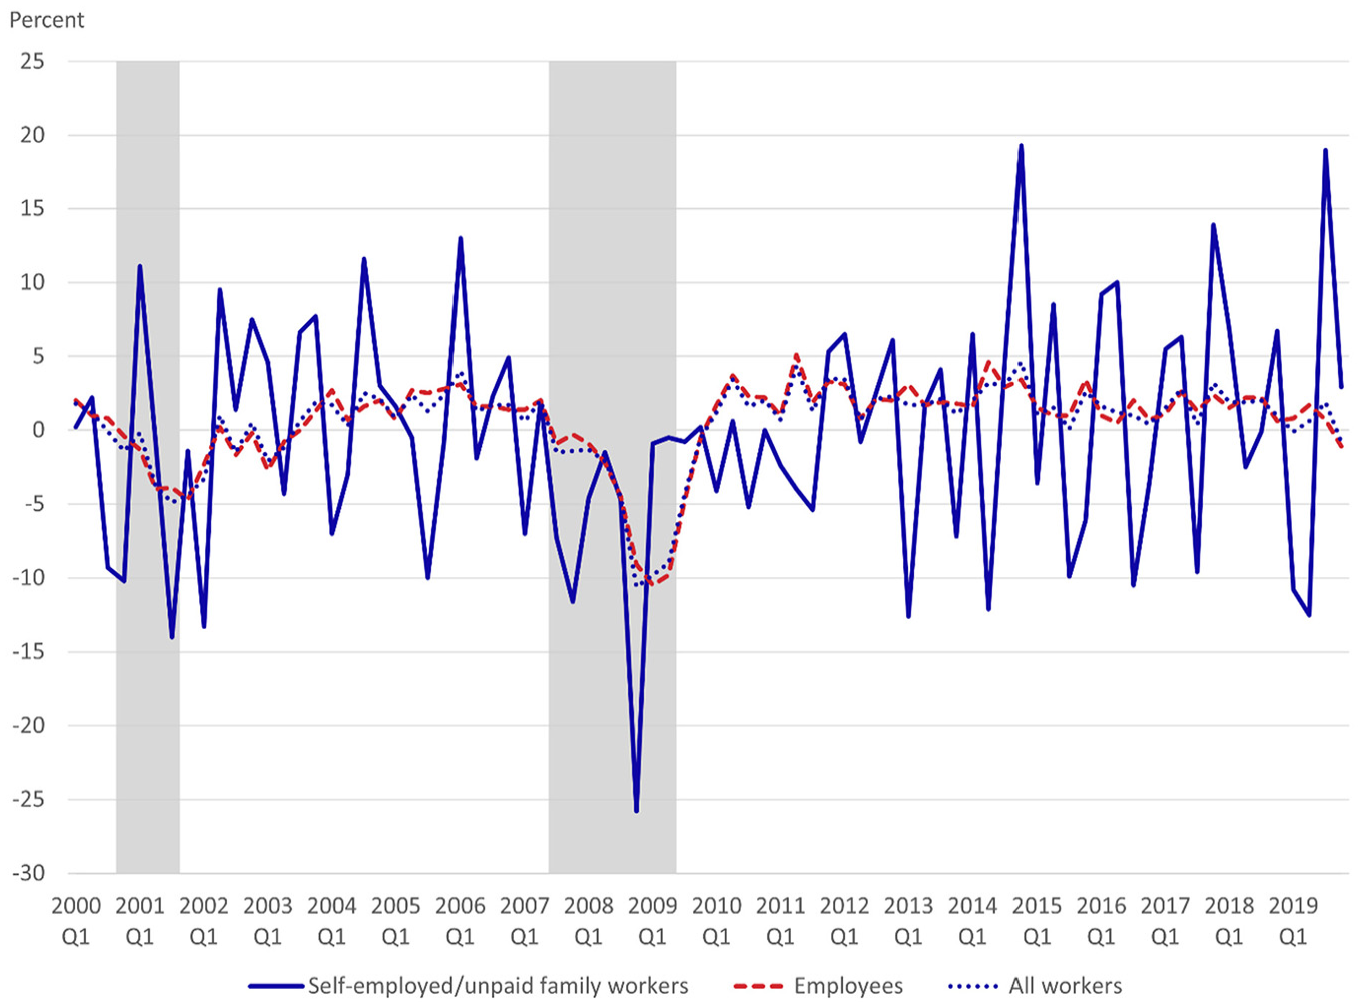
Annualized quarter-to-quarter percent change in hours for unincorporated self-employed/unpaid family workers, employees, and all workers in the nonfarm business sector, seasonally adjusted, first quarter 2000 to fourth quarter 2019.
Figure 2 shows the percentage-point contributions to annualized quarterly growth in total hours worked in the nonfarm business sector by employees and SEUFW, where contributions are measured as the product of the percent change in hours of the relevant group and the share of total hours worked by that group in the previous quarter. The solid blue portion of the stacked bar represents the contribution of SEUFW hours to the growth in total hours worked, while the red and white lined portion represents the contribution of employee hours. The solid red dot represents the growth in total hours worked. Given SEUFW’s relatively small share of the workforce, we would expect their impact to be minimal and the dot to be close to the end of the red and white lined bar. In most instances, the relative contribution of SEUFW compared with employees is quite small. However, in some quarters, their contribution is large relative to their size in the workforce, and in nine of the eighty quarters shown in Figure 2, it even exceeds that of employees. For example, in the third quarter of 2019, total hours grew by about 1.9%, with SEUFW contributing 1.4 percentage points to the growth in hours worked and employees contributing only 0.6 percentage point to the growth in hours worked (a factor of 2.3 larger). We see that the growth in hours worked by SEUFW can even change the sign of the growth in total hours, as it did, for example, in the first quarter of 2019 when the contribution of employee hours was +0.7 percentage point, while the contribution of SEUFW hours was −0.8 percentage point, resulting in a total growth in hours worked of −0.1%. Another example of SEUFW’s outsized growth is in the fourth quarter of 2014. In that quarter, total hours grew by 4.6%, with SEUFW contributing 1.5 percentage points to the growth in hours and employees contributing 3.1 percentage points to the growth in hours worked.
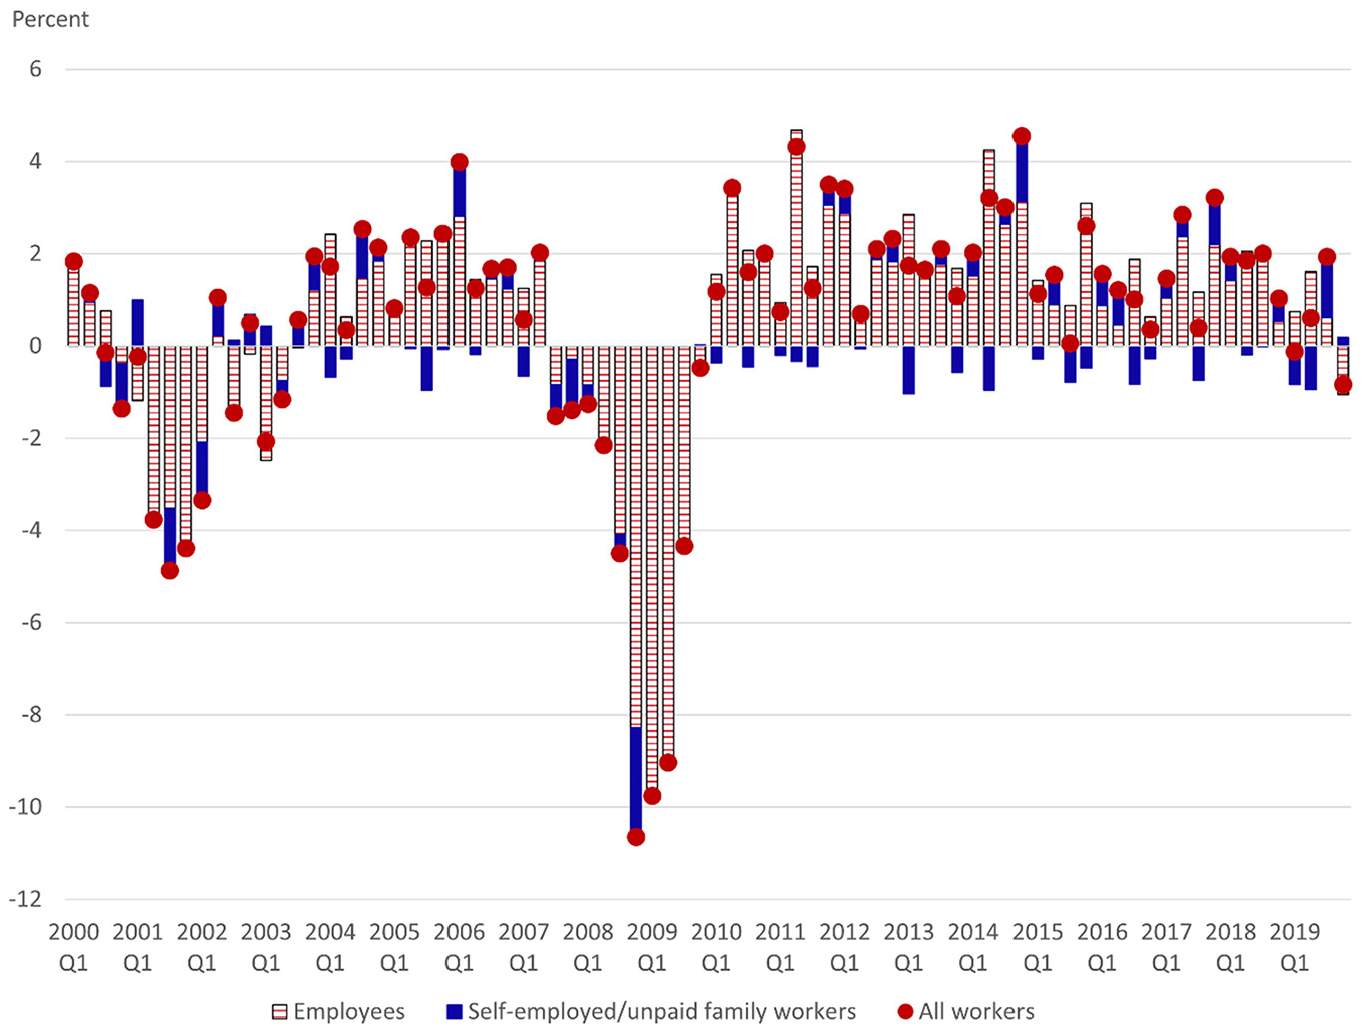
Contributions to the annualized quarter-to-quarter percent change in hours worked in the nonfarm business sector, by class of worker, seasonally adjusted, first quarter 2000 to fourth quarter 2019.
For BLS productivity measures, hours of work for employees are primarily obtained from establishment responses to the BLS Current Employment Statistics (CES) survey. The CES universe captures the incorporated self-employed, who are classified as employees of their own businesses, but it does not include SEUFW (Bowler and Morisi 2006). BLS obtains hours for SEUFW from the basic monthly Current Population Survey (CPS) using responses to the question about respondents’ class of worker at the job(s) worked in the previous week.
Self-employment can appear volatile for two broad reasons. First, self-employment is genuinely volatile, because people open and close businesses and often use self-employment as a bridge between wage-and-salary job spells (Cahill et al. 2013; Fairlie and Fossen 2020; Von Bonsdorff et al. 2017). People also become self-employed to have more flexibility, including flexibility in their hours, so their hours may vary more from one month to the next compared with those of employees. Second, because the unincorporated self-employed are a small share of the labor force, estimates of the number of self-employed will have higher variance than estimates of the number of employees.
Thus, the volatility in SEUFW hours could be due to volatility in the number of SEUFW, the volatility in their average hours worked, or both. Figure 3 shows that the majority of the growth in annualized aggregate SEUFW hours (red dot) is the result of changes in the number of SEUFW (shown in red and white lines in the stacked bar) rather than changes in their average hours worked (shown in solid blue in the stacked bar), although the latter is not economically insignificant. The average absolute value of the employment contribution is 5.3 percentage points, while the average absolute value of the average hours worked per person is 3.1 percentage points. In addition, in some of the quarters where we saw outsized growth in SEUFW hours, for example, the fourth quarter of 2014, first quarter of 2019, and third quarter of 2019, the contribution of employment to the change greatly exceeds the contribution of hours. Henceforth, most of our analysis focuses on how the CPS survey design is related to changes in the number of self-employed. In addition, hereafter, even though the BLS productivity program combines hours of the SEUFW, our analyses focus on volatility in unincorporated self-employment (SEU) only, because unpaid family workers represent a very small percentage of the workforce. For example, in the fourth quarter of 2019, unpaid family workers’ hours were only 0.05% of total hours in the nonfarm business sector.
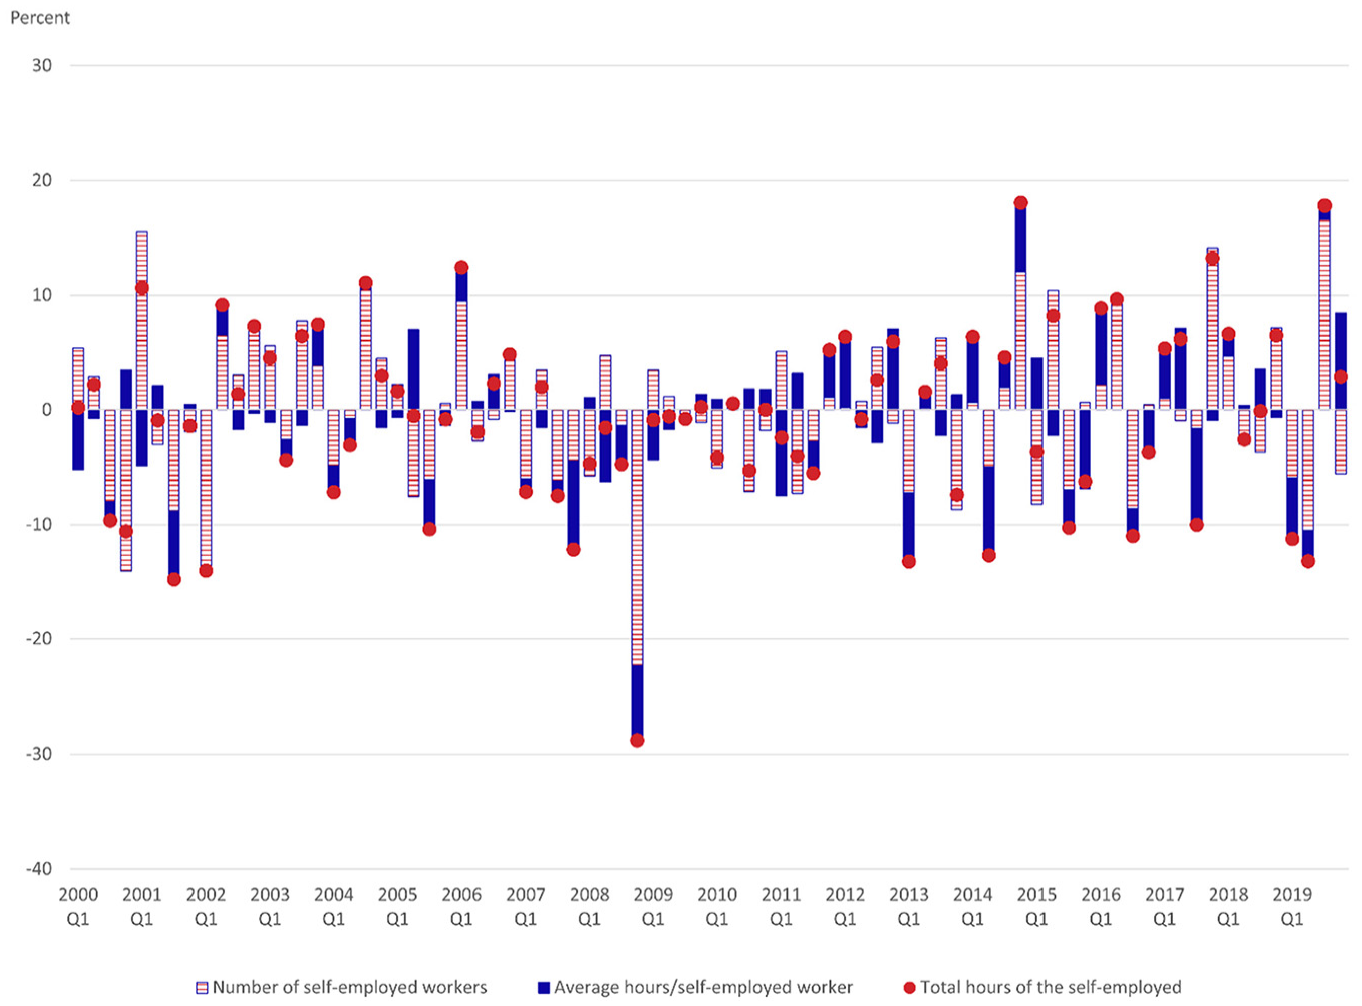
Contributions of the number of unincorporated self-employed/unpaid family workers and average hours per unincorporated self-employed/unpaid family worker to the quarter-to-quarter percent change in hours of the unincorporated self-employed/unpaid family workers in the nonfarm business sector, seasonally adjusted, first quarter 2000 to fourth quarter 2019.
Several features of the CPS sample design might be related to the unincorporated self-employed’s measured hours, including the sample rotation framework (with eight different rotation groups in each month and respondents in each rotation group in the sample for four consecutive months, then out of sample for eight months, and back in again for four additional consecutive months, where the months in the rotation are referred to as month in sample [MIS] 1–8), sample weighting, proxy-reporters answering on behalf of other household members, and imputation of class-of-worker status. These features have the potential to change total hours worked by changing the number of unincorporated self-employed workers, independent of changes to their average hours of work. Though, they also could change average hours of work.
We first examine volatility in the number of unincorporated self-employed jobs in the nonfarm business sector, which at least partially results from sampling error because of the small number of self-employed individuals in the CPS, to determine whether any adjustments could be made to reduce volatility in quarterly labor productivity measures. We begin by using cross-sectional data from 2000 to 2019, just before the turbulent effects of the COVID-19 pandemic began. We briefly describe how the number of unincorporated self-employed changed over the period and examine whether changes in CPS population weights as household response rates fell (and the population grew) impacted the volatility in the unincorporated self-employed series. We then show differences in SEU levels and growth rates by several other CPS design features: proxy- versus self-reporters; imputed versus nonimputed responses; and different rotation groups. Using the CPS panel feature, we examine workers’ month-to-month transitions into and out of SEU to determine whether reported transitions might stem from reporter type transitions and/or imputation status transitions. We then experiment with editing imputed and proxy-responses to try to reduce volatility in SEU. Finally, we provide evidence that the unincorporated self-employed have greater variation in their average weekly hours worked compared with employees.
2. Volatility in the Number of Unincorporated Self-Employed and the CPS Design Features
2.1. CPS Design Features
In this section, we first describe the basic monthly CPS sample design and its complexities and how it might be related to volatility in the number of unincorporated self-employed. Then, in the sections that follow, we investigate which of the design features contribute to the volatility in the number of unincorporated self-employed.
The CPS is the U.S. labor force survey jointly sponsored by the U.S. Census Bureau and BLS. Each month, about sixty thousand households from all fifty states and the District of Columbia are eligible for the survey. The CPS has a rotating panel design that is designed to minimize volatility in monthly estimates by ensuring some degree of continuity of households across months and across years for the same month. Sampled households are in the survey for four consecutive months, then are out of the sample for the next eight consecutive months before returning for a second set of four consecutive months. In each month, there are eight rotation groups. Two of the eight month-in-sample (MIS) groups are outgoing (MIS 4 and 8) and two are incoming (MIS 1 and 5). Approximately 75% of the sample continues from one month to the next. However, for its principal federal economic indicator, quarterly labor productivity, the BLS Productivity Program estimates the number of unincorporated self-employed workers as a simple three-month average over the quarter. In a quarter-to-quarter comparison of CPS respondents, of the respondents in the 24 MIS-month pairs (three months in a quarter times eight MIS groups in each quarter) in the second quarter, those in twelve of the pairs were present in at least one month during the previous quarter, while those in the other twelve pairs were not.
Figure 4 shows this rotation pattern for the first and second quarters of a year. Each letter represents a different cohort. The southeast-pointing arrows show how the cohorts move through the sample over time. For example, January is the first MIS for cohort “a,” February is the second MIS for cohort “a,” etc. The horizontal arrow indicates when a cohort is in MIS 4 or 8 (an outgoing rotation group) and will thus not appear in the next quarter. In the second quarter, the dot-shaded cohorts replace the outgoing cohorts (the gray-shaded groups from the first quarter). If the number of unincorporated self-employed workers differs between the twelve outgoing cohorts and the twelve incoming cohorts due to sampling variability, then some of the change in self-employment is spurious. When this difference is large, it can potentially dwarf the real change in self-employment.
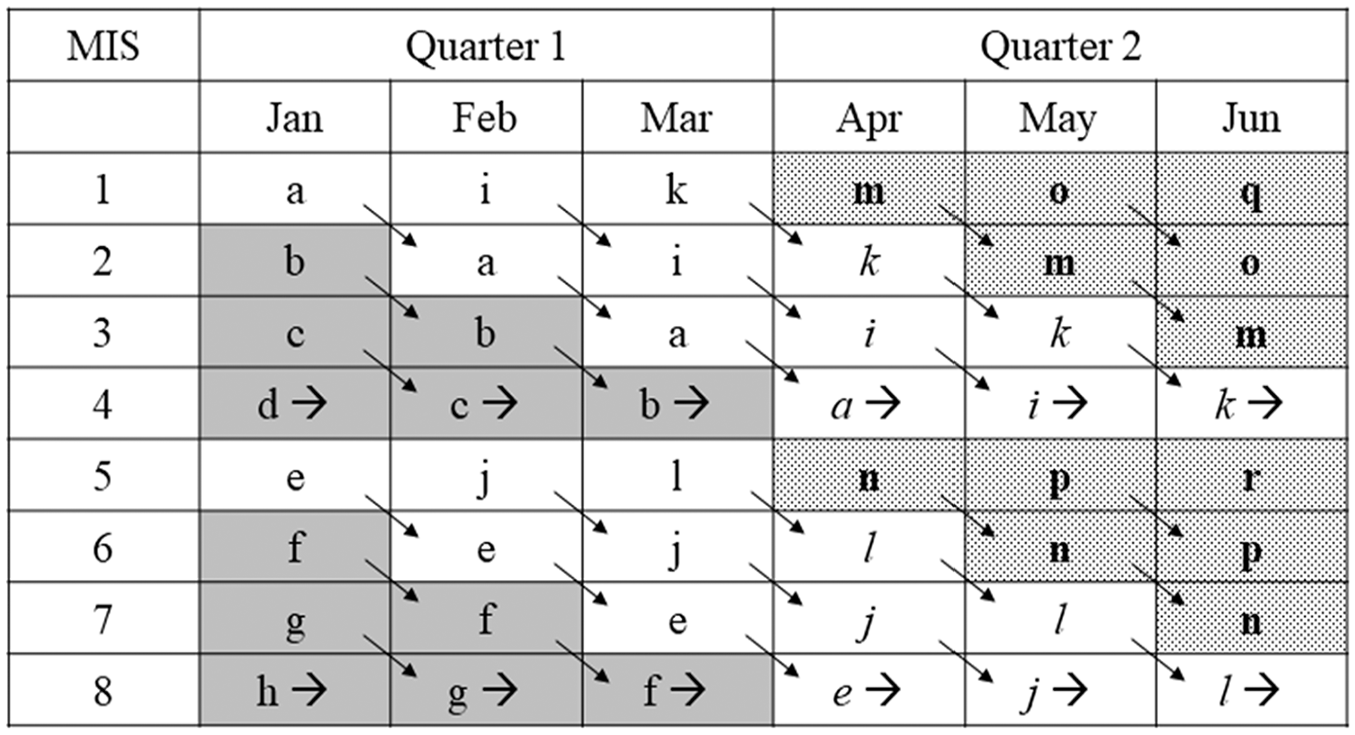
Example of sample rotation group changes from one quarter to the next.
CPS provides several different survey weights. Each set of weights is designed so that the weighted sum of the respondents matches the U.S. civilian noninstitutionalized population over the age of sixteen and certain subpopulations based on the latest decennial Census population with adjustments for births and deaths and net international migration. To calculate hours, the BLS Productivity Program uses second stage weights for main jobs to allow for the inclusion of fifteen-year-olds and outgoing rotation weights for secondary jobs, because respondents are asked about their class of worker on secondary jobs in outgoing rotation months only. Longitudinal weights are provided for analyses of labor force transitions from one month to the next. These latter weights are available in MIS 2 to 4 and 6 to 8 only. For more details on weighting, see U.S. Census Bureau (2019).
Self-employment status, like employment or unemployment status, is an outcome and is therefore not a stratifying variable in sampling or in the weighting process. Thus, self-employment estimates should be an unbiased estimate of the number of unincorporated self-employed, but the small number of unincorporated self-employed in the economy means that this estimate can vary quite a bit from month to month. In the next section, we explore whether an increase in household nonresponse and thus an increase in the CPS weights may be contributing to the volatility.
Usually, one household member, referred to as the household respondent, responds to the survey questions for all household members aged fifteen and over; however, the household respondent may change from one month to the next. Thus, questions about one household member are self-reported, while questions about others are mostly answered by proxy. A teenager might answer for their parent, a parent for their children, one spouse for another, etc. We refer to the two reporter types for a household member as a proxy-reporter or self-reporter. In a limited number of cases, labor force questions are answered by both proxy and self, in which case, we treat the response as self-reported, assuming that household respondents consulted with other household members to provide more accurate responses. However, in those instances, we have no way to determine if the class of worker question specifically was reported by proxy or self.
Volatility in SEU might be related to proxy-reporting. Approximately half the responses to the class of worker question are reported by proxy, but the share of proxy-responses can vary somewhat from one month to the next. The different reporters may have different perspectives about what the class of worker type is. For example, while the CPS household respondent may be able to identify self-employment for a family member who clearly owns a small or medium-sized business (like a retail shop), for some work arrangements (like independent contractors receiving), this identification may be more difficult and proxy-reporters may classify their family member in this case as an employee (Abraham et al. 2021, 2024). Or a parent answering for their teenager or young adult may not know if their child, who is more likely to have intermittent employment during this stage in their life, is employed (or self-employed) and may be more likely to report non-employment on their behalf (Contreras et al. 2024). There is also some evidence that older workers who have retired from a career job but perform some informal work activities may be less likely to self-report that they are employed (Bracha and Burke 2023); and that proxy- and self-reporters differ on a significant portion of answers to labor force questions in the CPS and proxy-reporters miss informal work activities that may be happening sporadically (Abraham and Amaya 2019; Boehm 1989). Throughout the household’s time in sample, the respondent answering on behalf of the household may change, resulting in the reporter type for each member switching from self to proxy or vice versa. When there are transitions in the reporter type as households move through the CPS, it is possible that there are more likely to be transitions in reported SEU status, given these different perspectives.
Dependent interviewing was introduced in the CPS with the 1994 survey redesign, with the goals of reducing respondent burden and spurious month-to-month transitions across occupations and industries (Polivka and Rothgeb 1993). With dependent interviewing, in MIS 2 to 8 the interviewer asks the household respondent retrospective questions about whether each household member still works for the same employer that they worked for in the previous month, with the interviewer reading aloud the name of the household member’s employer. Naming the employer seems to reduce transitions between self-employment and other employment states from one month to the next (Fujita et al. 2024). However, from January 2008 to April 2009, the CPS phased in a Respondent Identification Policy (RIP) to protect the confidentiality of respondents’ information from other household members. Under the RIP, the original household respondent is asked in their initial interview whether their answers to survey questions, including answers about employer names, can be shared with other household members who may respond in their absence in subsequent months (U.S. Census Bureau 2015). Following the introduction of the RIP, many respondents declined to allow their information to be shared. This led to a sharp increase in the number of transitions across employers and transitions between SEU and employee statuses (Fujita et al. 2024). Fujita et al. (2024) also find some evidence that even those workers with the same employer across months may report switches between SEU and employee-type work. Although such a transition is possible, Fujita et al. (2024) conclude that the number of transitions in formal classification is implausibly high.
Sometimes, the household respondent does not answer the class-of-worker question because they do not know the answer to the question or refuse to answer it. In these cases, the Census Bureau imputes the response. The Census Bureau uses two imputation procedures to edit missing responses to the class of worker question: (1) longitudinal edits, where information from the previous month’s entry is used if available and (2) hot deck imputation, where a value is assigned from a different respondent with similar age, race, and sex characteristics. The latter type of imputation could lead to volatility in the SEU series, while we would not expect a change in class of worker if there was a longitudinal edit. Hereafter, when we refer to imputations, we are referring to hot deck imputations.
2.2. Weighted Versus Unweighted Unincorporated Self-Employment
In this subsection, we begin by analyzing weighted and unweighted SEU series for those over the age of fifteen in the nonfarm business sector from quarter 1 of 2000 to quarter 4 of 2019. We start the series in 2000 because productivity is consistently measured back to this year for detailed industries from which aggregate labor productivity measures are built up. The period following the start of the COVID-19 pandemic is excluded because the size of the changes in SEU during the COVID-19 pandemic overshadows the normal volatility in the series, making it hard to see this volatility graphically.
To show the effects of weighting on volatility, Figure 5 presents counts of the unincorporated self-employed in the nonfarm business sector from the basic monthly CPS (averaged to quarters taking a simple average), with unweighted counts on the right axis and weighted counts on the left axis. See U.S. Bureau of Labor Statistics and U.S. Census Bureau (2000–2019) for CPS data. Note that in the third quarter of 2001, there is a spike in the unweighted series that is the result of a permanent one-time increase in the CPS sample size from about fifty thousand to about sixty thousand households in July 2001 (Helwig et al. 2001).
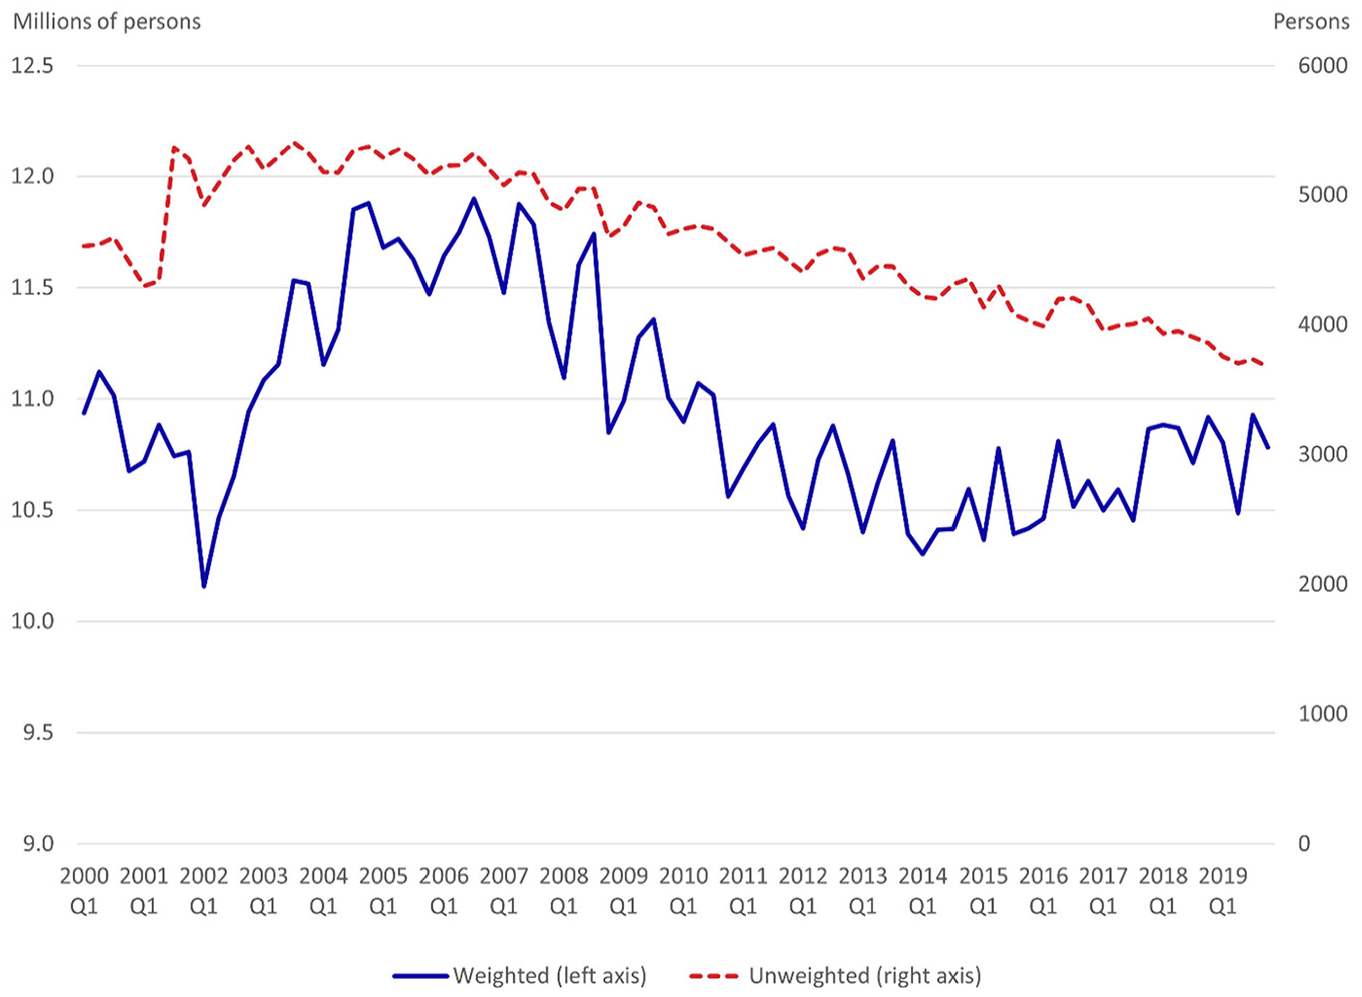
Weighted and unweighted unincorporated self-employment in the nonfarm business sector, first quarter 2000 to fourth quarter 2019.
One factor that may contribute to volatility in estimates of the number of self-employed is the recent decline in the number of respondents in the CPS relative to the U.S. population, resulting from a combination of an uptick in household nonresponse and an increasing population. The CPS household refusal rate rose gradually starting around 2010 from 8% to over 15% in 2019, with some households never responding and an increasingly greater share responding in some but not all months (Bernhardt et al. 2024). This resulted in a reduction in the number of respondents and an increase in population weights for all respondents. The impact of the decline in the number of CPS respondents can be seen in Figure 5. The unweighted series shows SEU falling steadily since the beginning of 2005. However, while the weighted series also begins to decline in 2005, it becomes essentially flat hovering around 10.7 million after 2010, reflecting the increased weight on each respondent. In addition to falling household response rates, respondent weights have been increasing over time because the US population has increased.
Figure 6 shows the average CPS weight for all respondents as well as for the nonfarm unincorporated self-employed. While the average weight is slightly lower for the unincorporated self-employed (because weights for demographic groups that are typically not self-employed are higher over the period), weights have been increasing fairly consistently for both groups since 2001, following the permanent one-time increase in the CPS sample size. Thus, there does appear to be something systematically different about the weights for the unincorporated self-employed. In addition, the increase in the weight does not appear to directly contribute to the volatility in the SEU hours series. Nevertheless, any volatility in the estimates will be magnified when there is an increase in the average weight that occurs when there are fewer respondents or as the U.S. population grows.
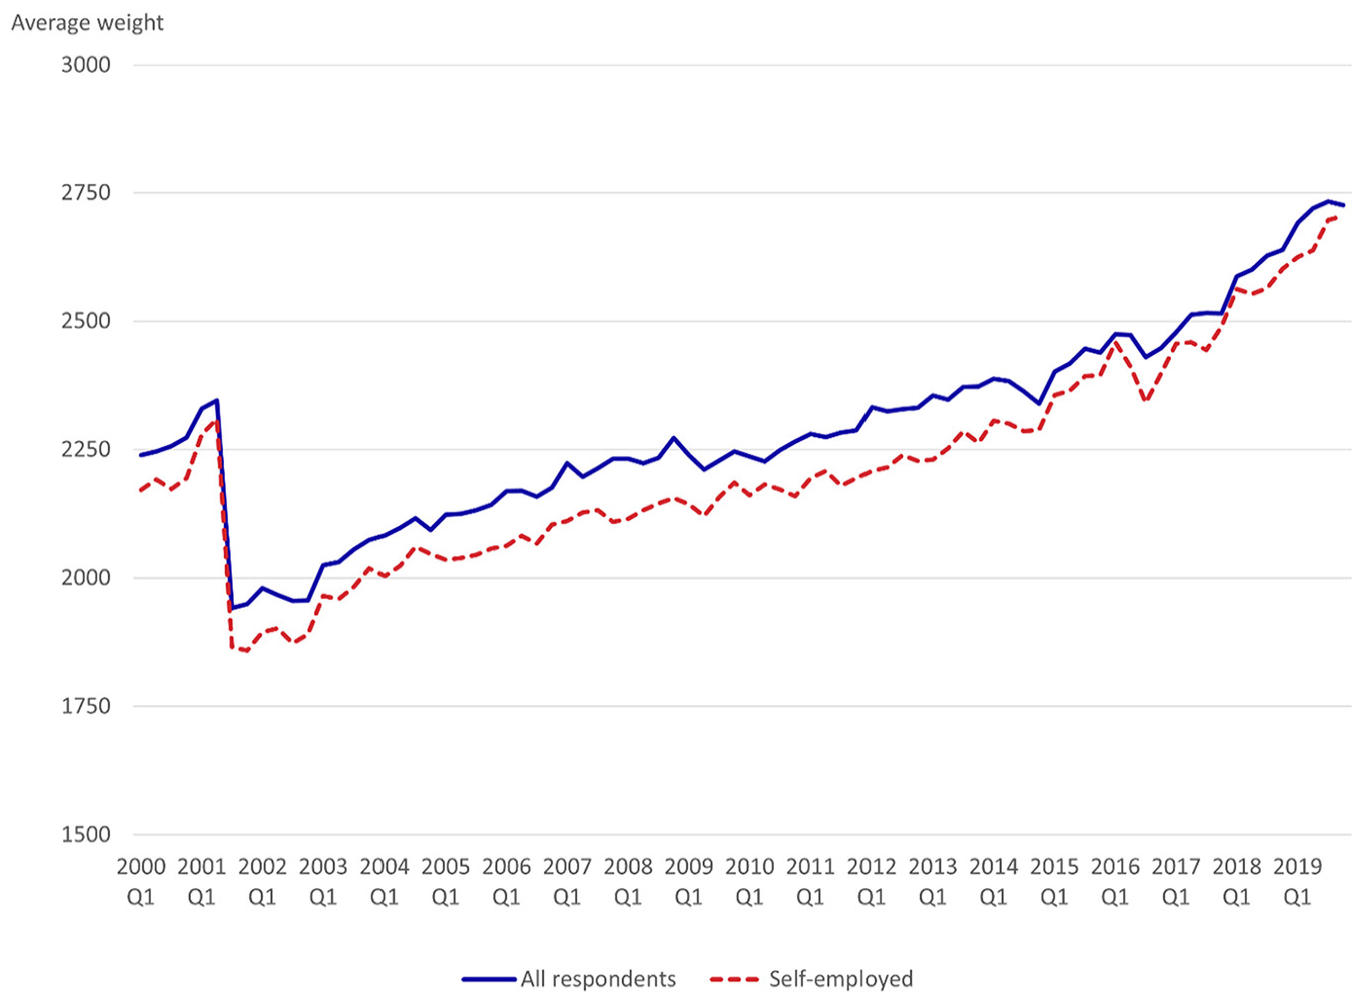
Average Current Population Survey final weight for all respondents and for the nonfarm unincorporated self-employed, first quarter 2000 to fourth quarter 2019.
Figure 7 presents the weighted and unweighted quarter-to-quarter growth rates for SEU. The sharp increase observed in the unweighted count in the third quarter of 2001 is because of the previously-mentioned one-time increase in the CPS sample size. Otherwise, for the most part, the weighted and unweighted series are similarly volatile (varying ±5%), although there appears to be more volatility in the weighted series compared with the unweighted series after 2016. For example, in the third quarter of 2019, when there was an outsized change in SEU compared with the change in employees, the weighted series grew more than four times faster than the unweighted series (4.19% vs. 0.83%).
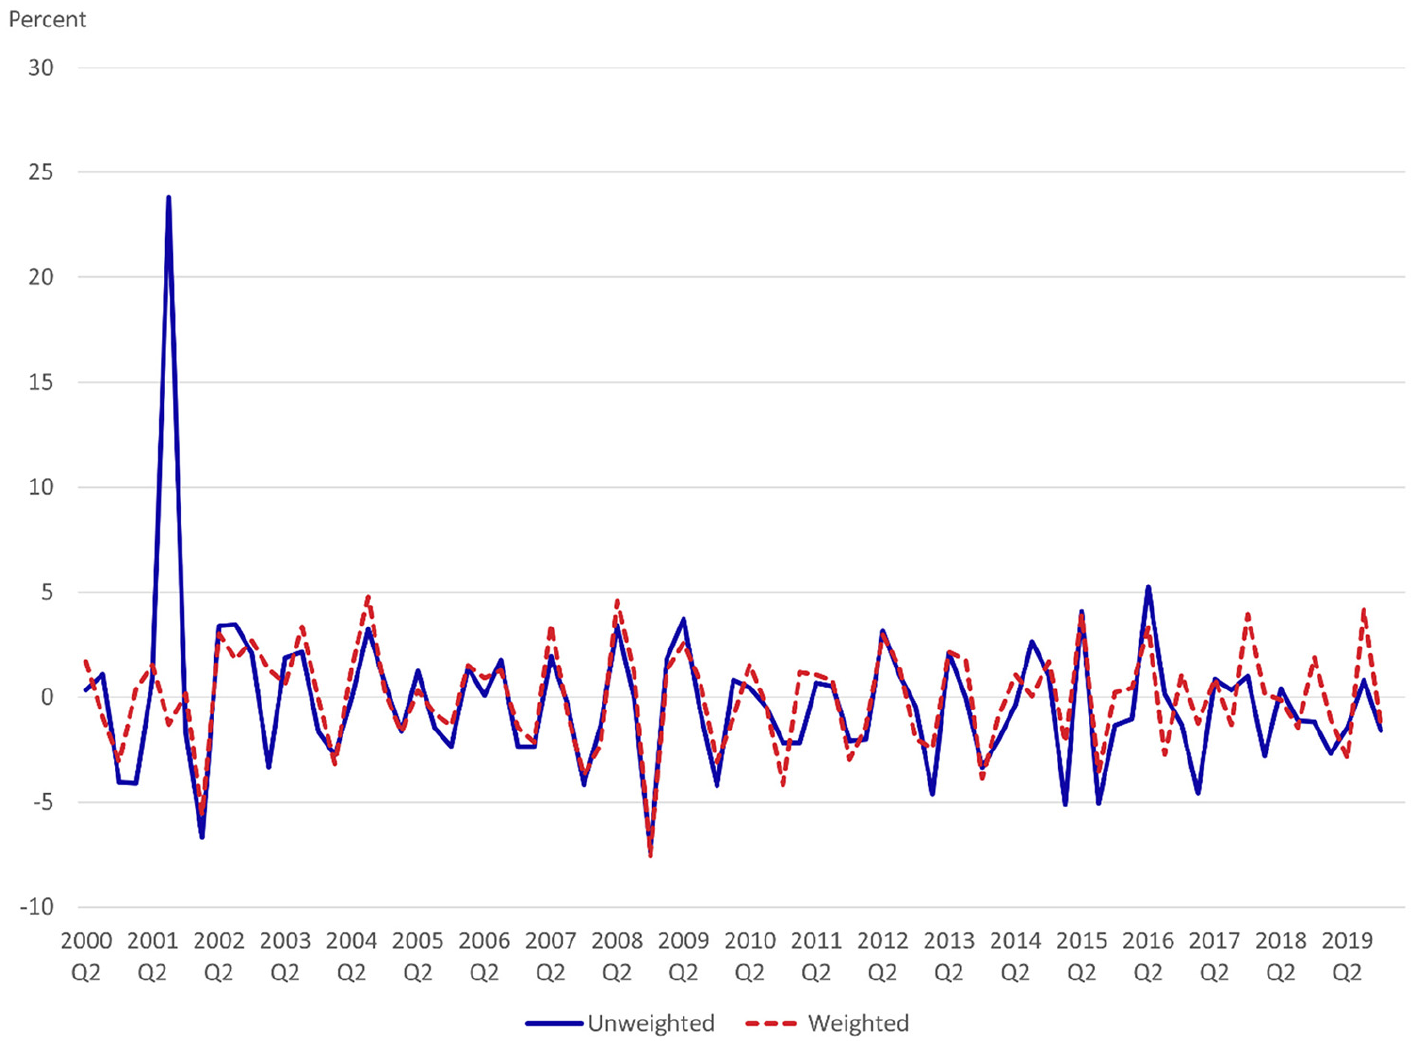
Weighted and unweighted growth in unincorporated self-employment in the nonfarm business sector, quarter-to-quarter percent change, second quarter 2000 to fourth quarter 2019.
Our primary concern is volatility in the estimates that is not due to volatility in the SEU population. However, we note that Abraham et al. (2021) find that compared with their income tax records, a large and growing number of respondents to the Annual Social and Economic Supplement to the CPS (CPS-ASEC) did not report self-employment earnings, which they attribute to a growth in “gig” work that people forget to report or to people not perceiving themselves as independent contractors. Their research suggests that the true self-employed population may be higher than shown in Figure 5. In 2015, they estimated that annual self-employment from tax records was 19.4 million, whereas the average in the basic monthly CPS that year was 10.5 million. Remember here that our reference period is the quarter so you cannot directly compare our estimates with their annual ones; however, estimates from the CPS-ASEC are close to those from the basic monthly CPS. BLS also found that 13% of independent contractors in February 2001 and 2005 were misclassified as wage and salary workers in the CPS (Bowler and Morisi 2006). On the other hand, it is also possible that some people are fabricating self-employment income on their taxes in order to claim the earned income tax credit (EITC). Using the universe of U.S. tax returns to compare taxpayer-reported self-employment and third-party-reported payments to “gig” and other contract workers, more recent research from Garin et al. (2025) concludes that rather than the rise in self-employment rates observed in the tax data being an actual increase in “gig” work, the divergence between the CPS and the income tax records is primarily due to rising self-reports of self-employment income by individuals during the EITC phase-in range as people learn about the tax incentives of claiming the EITC.
2.3. Rotating Sample Design
Figure 8 compares the quarterly levels of SEU by whether the person was present in at least one month in the previous quarter. The sample here is restricted to main jobs only, because questions about secondary jobs are asked only in outgoing rotation months and thus there is no sample overlap between quarters. The quarterly estimates for each group (those not present in the previous quarter and those present in the previous quarter) are calculated by summing the unincorporated self-employed for the twelve MIS-month pairs and dividing them by 3. An upward spike in one quarter in SEU among those who were not present in the previous quarter is often followed the next quarter by a similar spike in SEU among those who were present the previous quarter, as the same underlying cohorts move through on their way out of the sample.
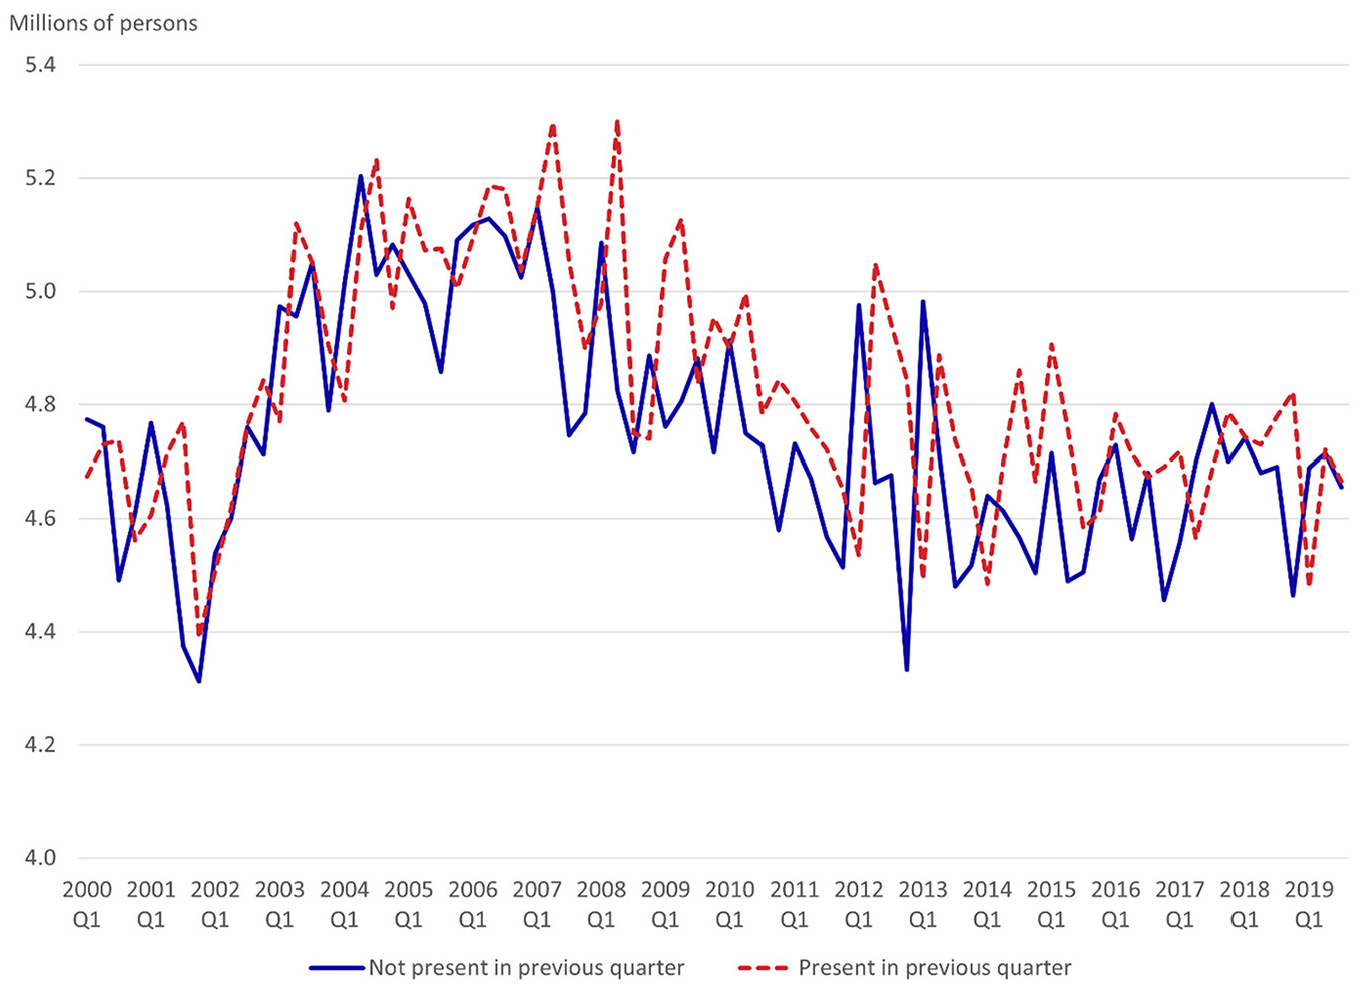
Unincorporated self-employment in the nonfarm business sector by whether present in previous quarter, first quarter 2000 to fourth quarter 2019.
A quarterly change in SEU can be broken into two components: (1) the growth among respondents who were present in the sample in both quarters and (2) the growth among those who were not present in the sample in both quarters. The latter is the difference in SEU between the incoming and outgoing rotation groups. Figure 9 shows the overall growth in SEU, as well as these two components. Most of the downward spikes in overall growth seem to be driven by the difference in SEU between incoming and outgoing rotation groups. Except for one upward spike in the overall SEU growth rate in the second quarter of 2015, a large increase in the growth rate of overall SEU is most often associated with a spike in the difference in SEU between incoming and outgoing groups. Comparing the variance in the growth rates of the two components over the 2000 to 2019 period, we find that the standard deviation of the series for those who were present in both quarters is 1.04, but the standard deviation of the series for those who were not present in both quarters is much larger, 2.18. Thus, a large part of the volatility in the SEU growth series results from those who were not present in both quarters. It is important to note that volatility in SEU would be even larger in the absence of the sample rotation design.
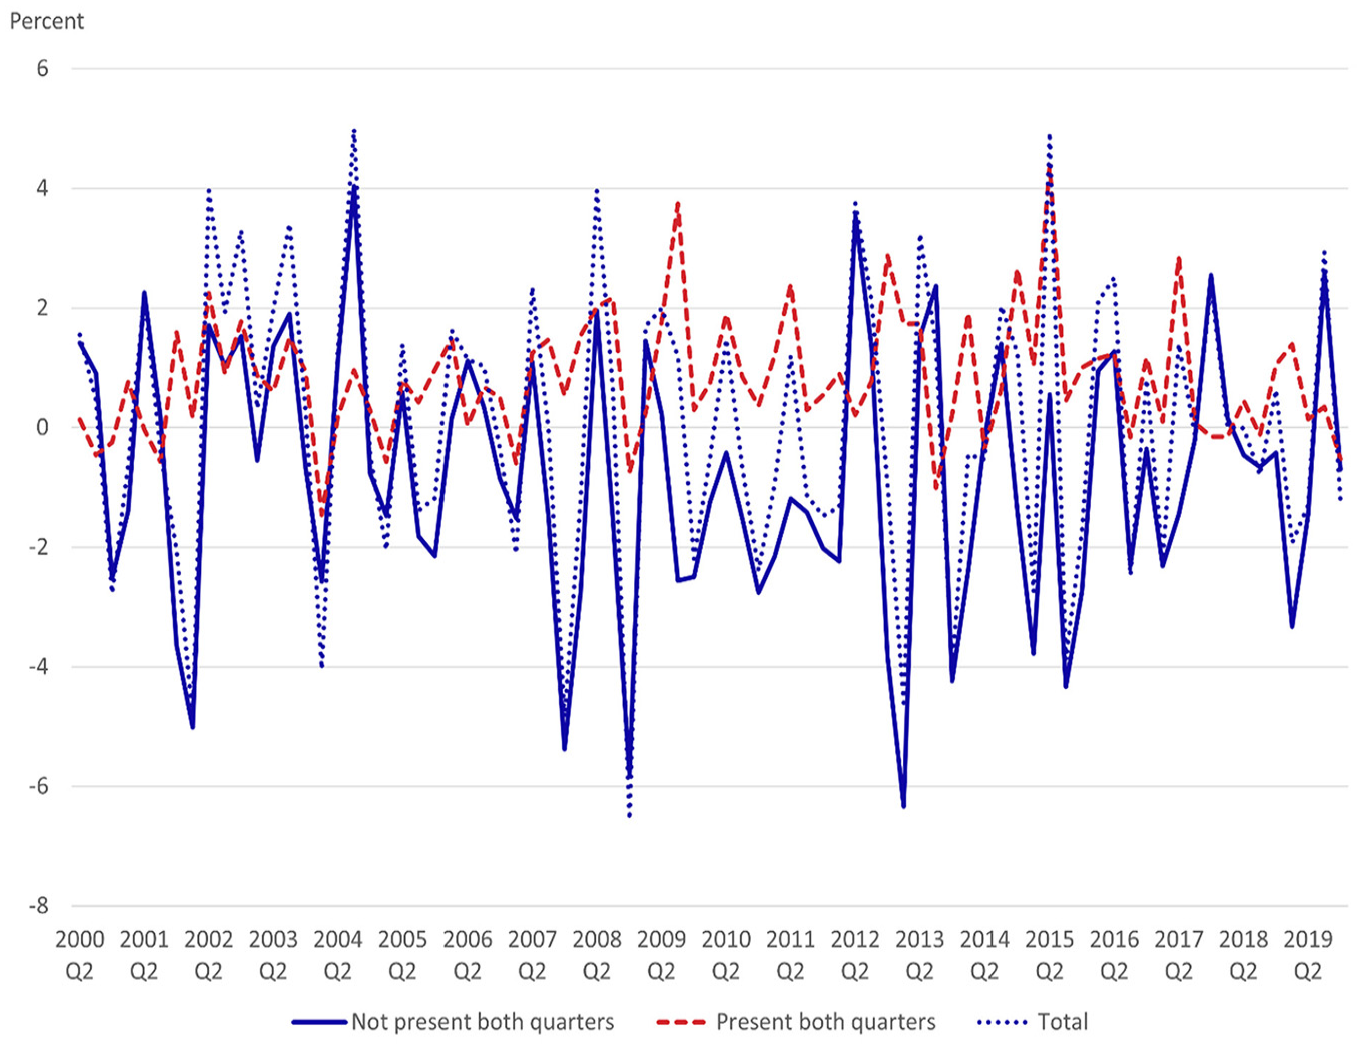
Growth in unincorporated self-employment in the nonfarm business sector, by whether present in the sample in both quarters, quarter-to-quarter percent change, second quarter 2000 to fourth quarter 2019.
2.4. Proxy- Versus Self-Reporters
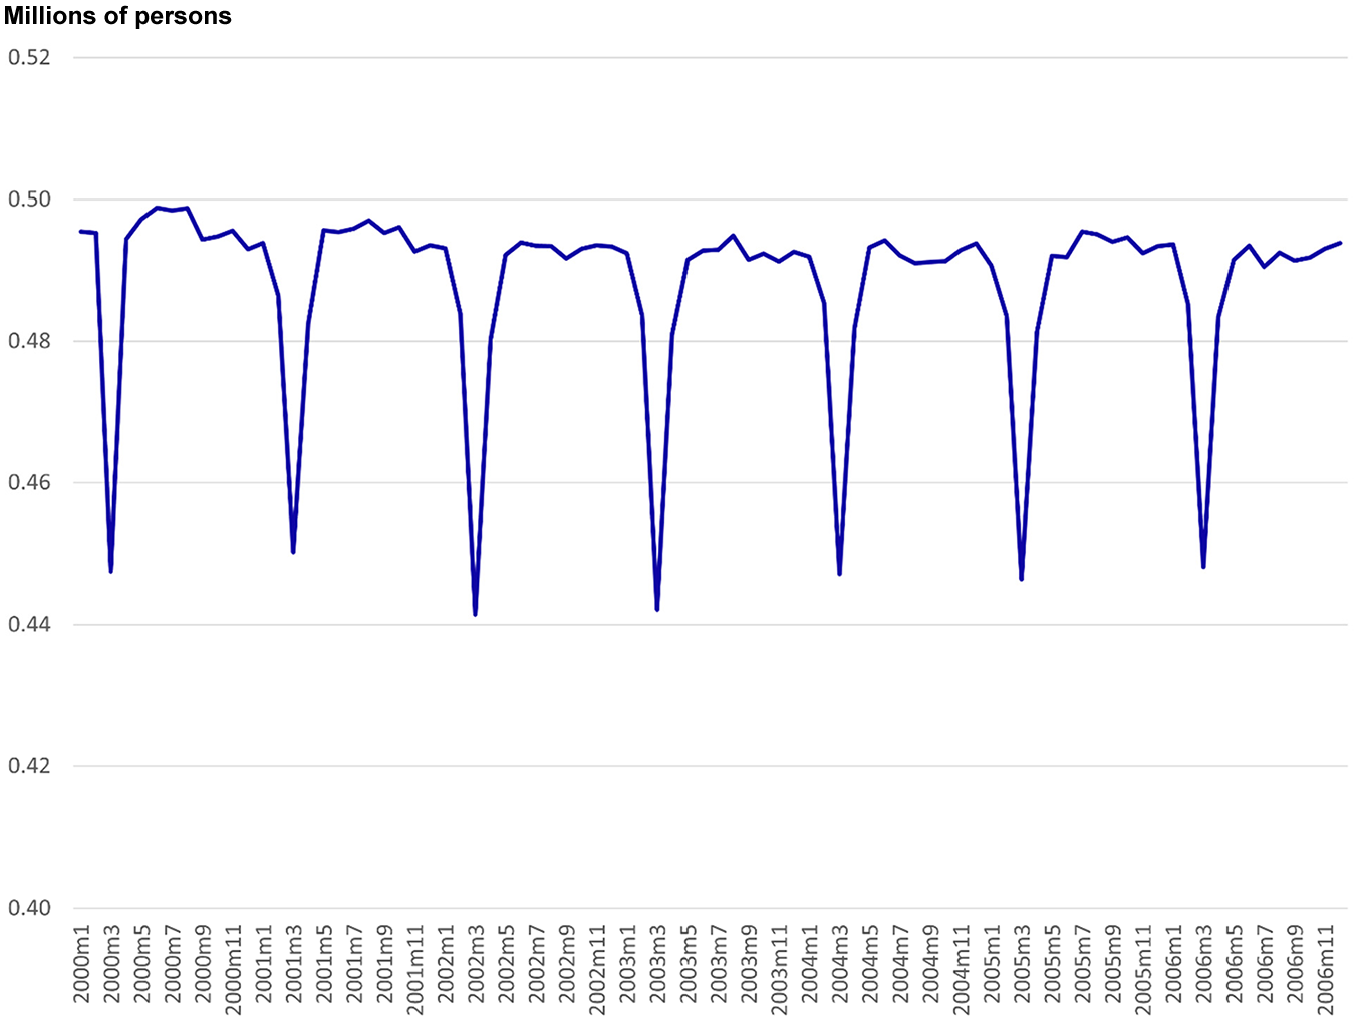
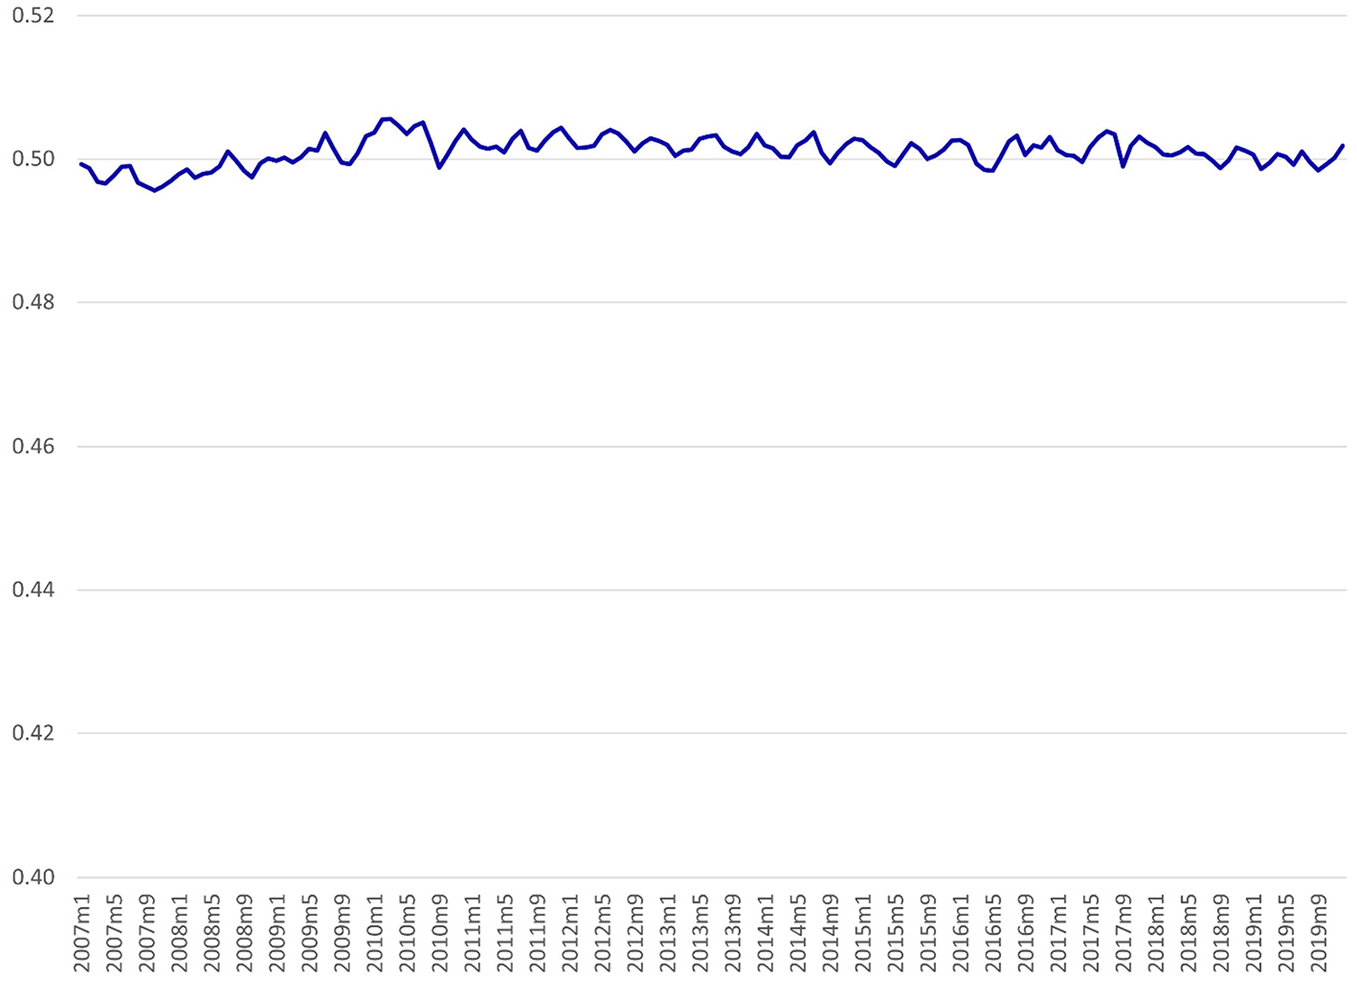
Figures 10 and 11 show the weighted levels and contributions to the quarter-to-quarter percent change for the unincorporated self-employed, respectively, for those responses obtained directly from the respondent compared with those obtained by proxy. There are significant differences in both reporting by reporter type and volatility in the reporting by reporter type. Household respondents report SEU less often for other household members than they do for themselves. This may not be random, as some worker characteristics, such as work-from-home capabilities, might be related to both the propensity to be a self-reporter and to be unincorporated self-employed. On average, 42% of the unincorporated self-employed are reported by proxy (Figure 10), even though about half of class of worker question responses come from proxies.
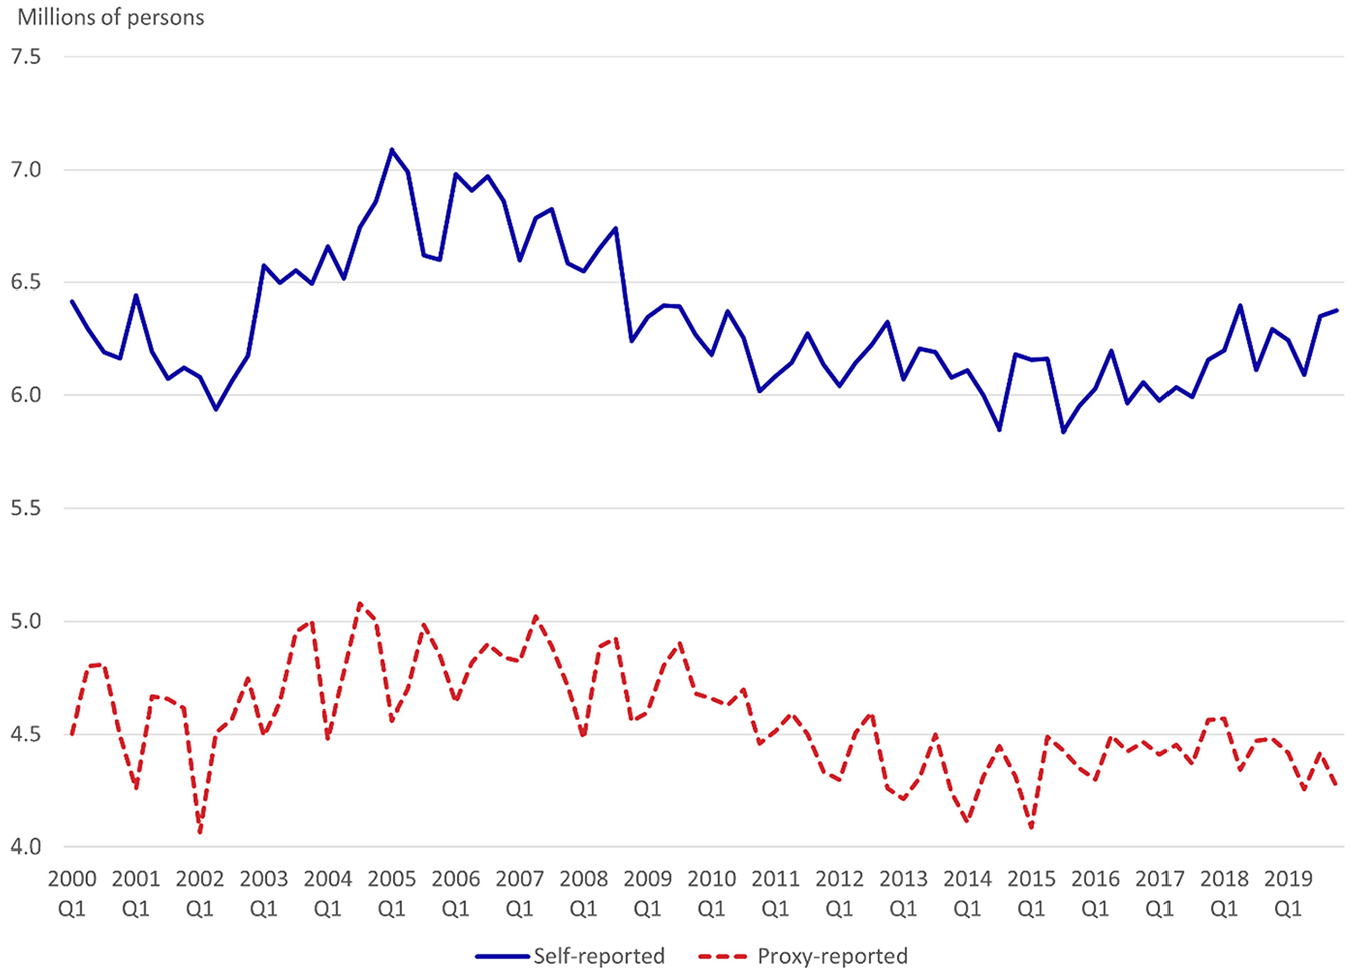
Unincorporated self-employment in the nonfarm business sector by reporter type, first quarter 2000 to fourth quarter 2019.
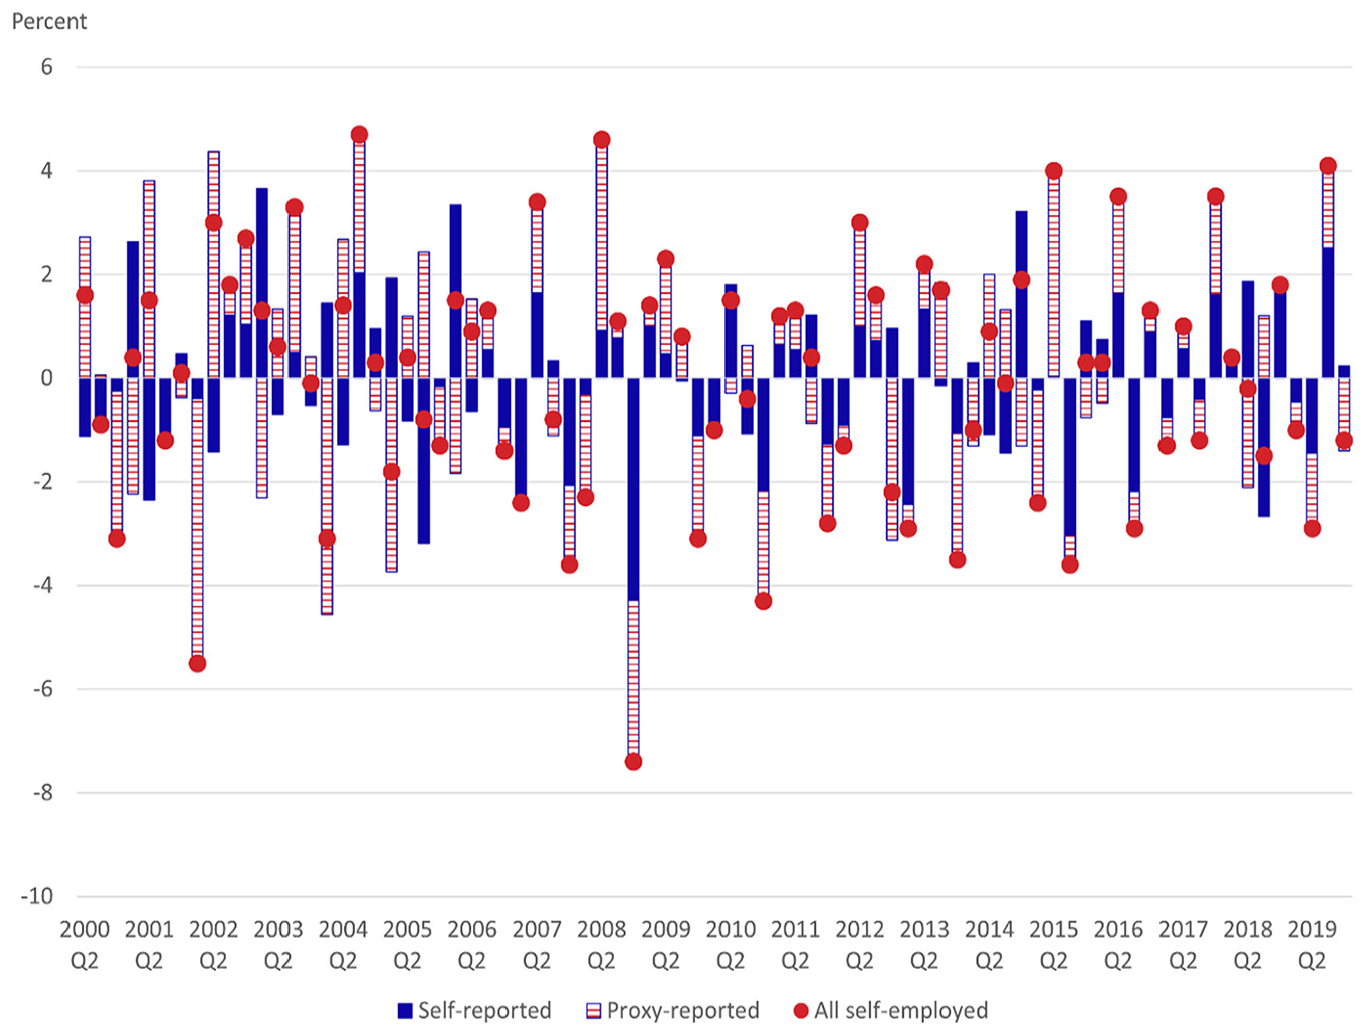
Contributions to the quarter-to-quarter percent change in unincorporated self-employment in the nonfarm business sector by reporter type, second quarter 2000 to fourth quarter 2019.
There is greater volatility in the quarter-to-quarter percent change in the SEU series reported by proxy-reporters than there is in that reported by self-reporters—the standard deviation is 4.6 for proxy-reporters and 2.7 for self-reporters (Table 1). In addition, the tails of the distribution of the growth rates are much longer for proxy-reporters than they are for self-reporters. In Figure 11, we show the percentage-point contributions of self- and proxy-reporters to the total growth in SEU. The solid blue portion of the stacked bar represents the contribution of self-reporters to the growth in unincorporated self-employed, the red and white lined portion represents the contribution of proxy-reporters, and the red dot represents the total growth in SEU. On average, the unincorporated self-employed reported by proxy make much larger contributions to the quarter-to-quarter percent change in SEU than do the self-reported unincorporated self-employed despite there being fewer unincorporated self-employed workers reported by proxy. We also find many instances where the contributions of the two groups to SEU growth move in opposite directions, with one negatively contributing to the growth and the other positively contributing to growth.
Distribution of Quarterly Growth Rates for the Unincorporated Self-Employed in the Nonfarm Business Sector by Reporter Type, First Quarter 2000 to Fourth Quarter 2019.
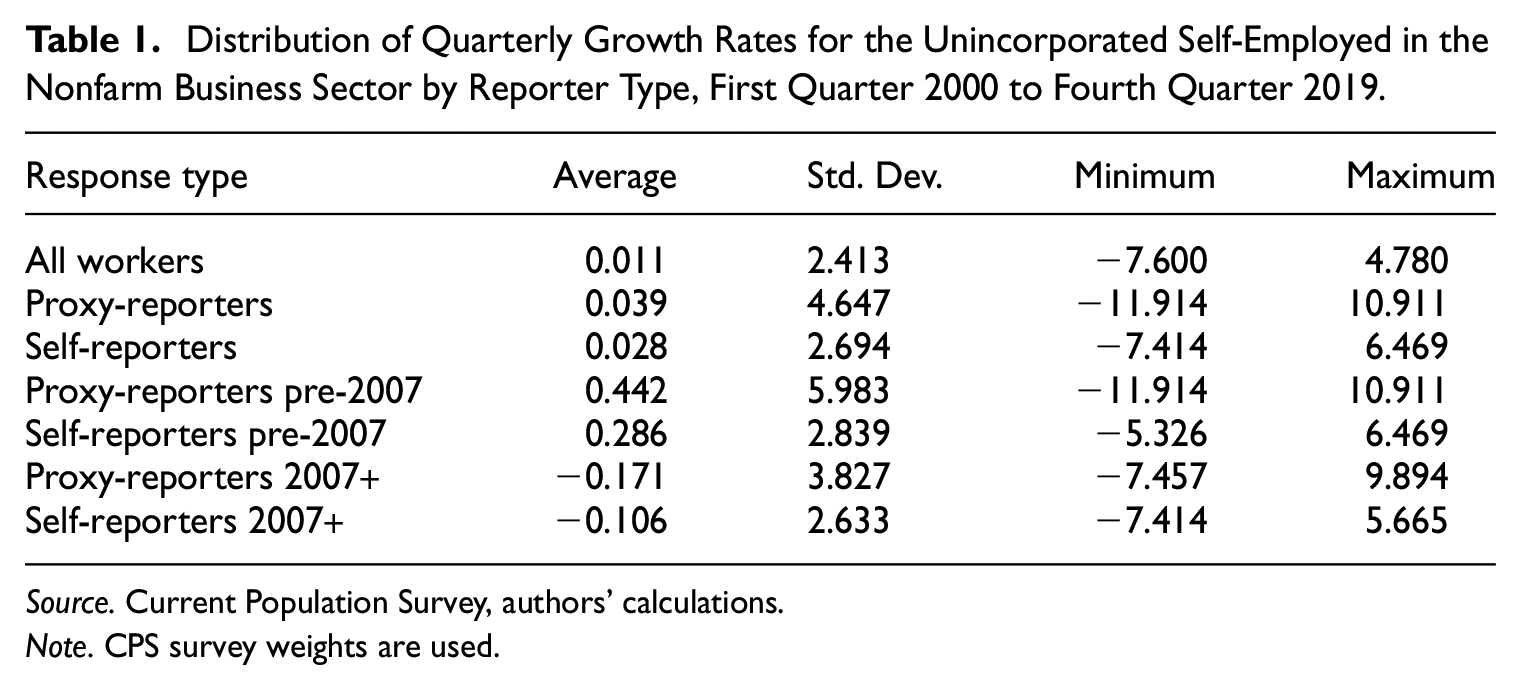
Source. Current Population Survey, authors’ calculations.
Note. CPS survey weights are used.
It also is possible that some of the observed variation in the relative contributions of the two groups to the growth in SEU results from quarterly changes in the share of proxy-responses out of all responses. Digging deeper into the data, we found evidence that the share of proxy-responses fell each March prior to the introduction of the Windows BLAISE© software for data collection in 2007 that resulted in higher quality survey results overall (see Figures 12 and 13). (For more information on how the Windows BLAISE© software features improved survey quality, see p. 111 of U.S. Census Bureau [2019].) These dips in the proxy-response rate during the earlier period correspond with spikes in the self-proxy response rate (not shown), so there must have been something related to the prior survey instrument and the March CPS-ASEC that resulted in an increase in responses being recorded by the interviewer as being reported by both self and proxy (also remember we coded self-proxy responses as self-responses so there are spikes in the self-responses). However, after the Windows BLAISE© software was introduced, both the proxy-response rate dips and the self-proxy response rate spikes went away. In Figure 11, the contributions to the quarter-to-quarter percent change in SEU by the proxy-reporters are all positive moving from the first to second quarter of each year in the 2000 to 2006 period, while the contributions of the self-reporters are all negative, which is consistent with the dips in the proxy shares. However, proxy-reporters still contribute more to the growth than do self-reporters in the post-2007 period (Table 1).
Share of proxy-responses, by month, 2000 to 2006.
Share of proxy-responses, by month, 2007 to 2019.
2.5. Imputed Versus Nonimputed Responses
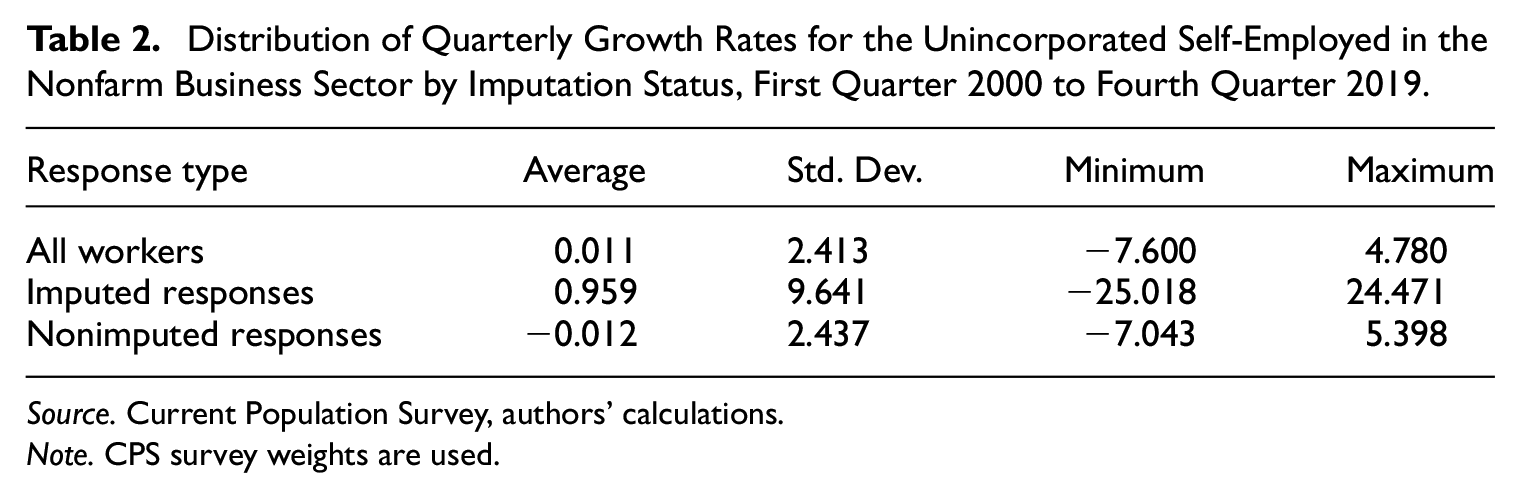
For the unincorporated self-employed, the number imputed by hot deck has been rising slowly since 2000, from 0.4 million in the first quarter of 2000 to 0.6 million in the fourth quarter of 2019, and it may be that SEU status is not missing at random (Eggleston et al. 2022). However, in 2019, the weighted count of the imputed self-employed was still less than 7% of the weighted count of the nonimputed self-employed (Figure 14). In Table 2, we find that growth rates are on average substantially larger for the imputed unincorporated self-employed than for the nonimputed unincorporated self-employed, and their standard deviation is almost four times the size of the standard deviation for the nonimputed unincorporated self-employed series. This is likely to some degree because of the substantially smaller number of imputed responses. In Figure 15, we examine the percentage-point contributions of the imputed and nonimputed unincorporated self-employed to the total growth in SEU. The red and white striped portion of the stacked bar represents the contribution of imputed values to the growth in SEU, the dark blue portion represents the contribution of the nonimputed values, and the solid red dot represents the total growth in SEU. We find in some quarters (9 out of the 79 quarters examined), the contributions of the imputed self-employed exceeded the contributions of the nonimputed.
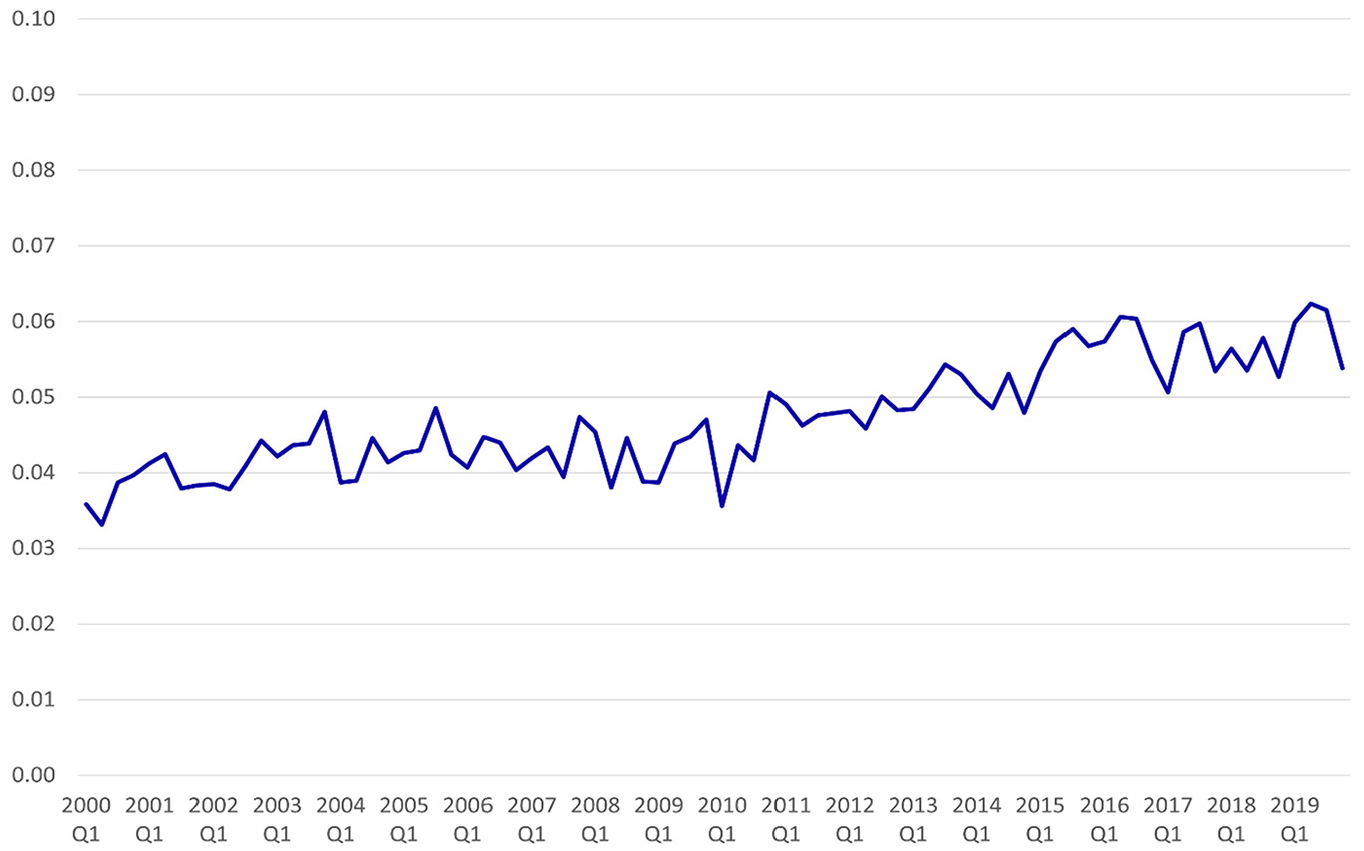
Share of imputed unincorporated self-employed in the nonfarm business sector, first quarter 2000 to fourth quarter 2019.
Distribution of Quarterly Growth Rates for the Unincorporated Self-Employed in the Nonfarm Business Sector by Imputation Status, First Quarter 2000 to Fourth Quarter 2019.
Source. Current Population Survey, authors’ calculations.
Note. CPS survey weights are used.
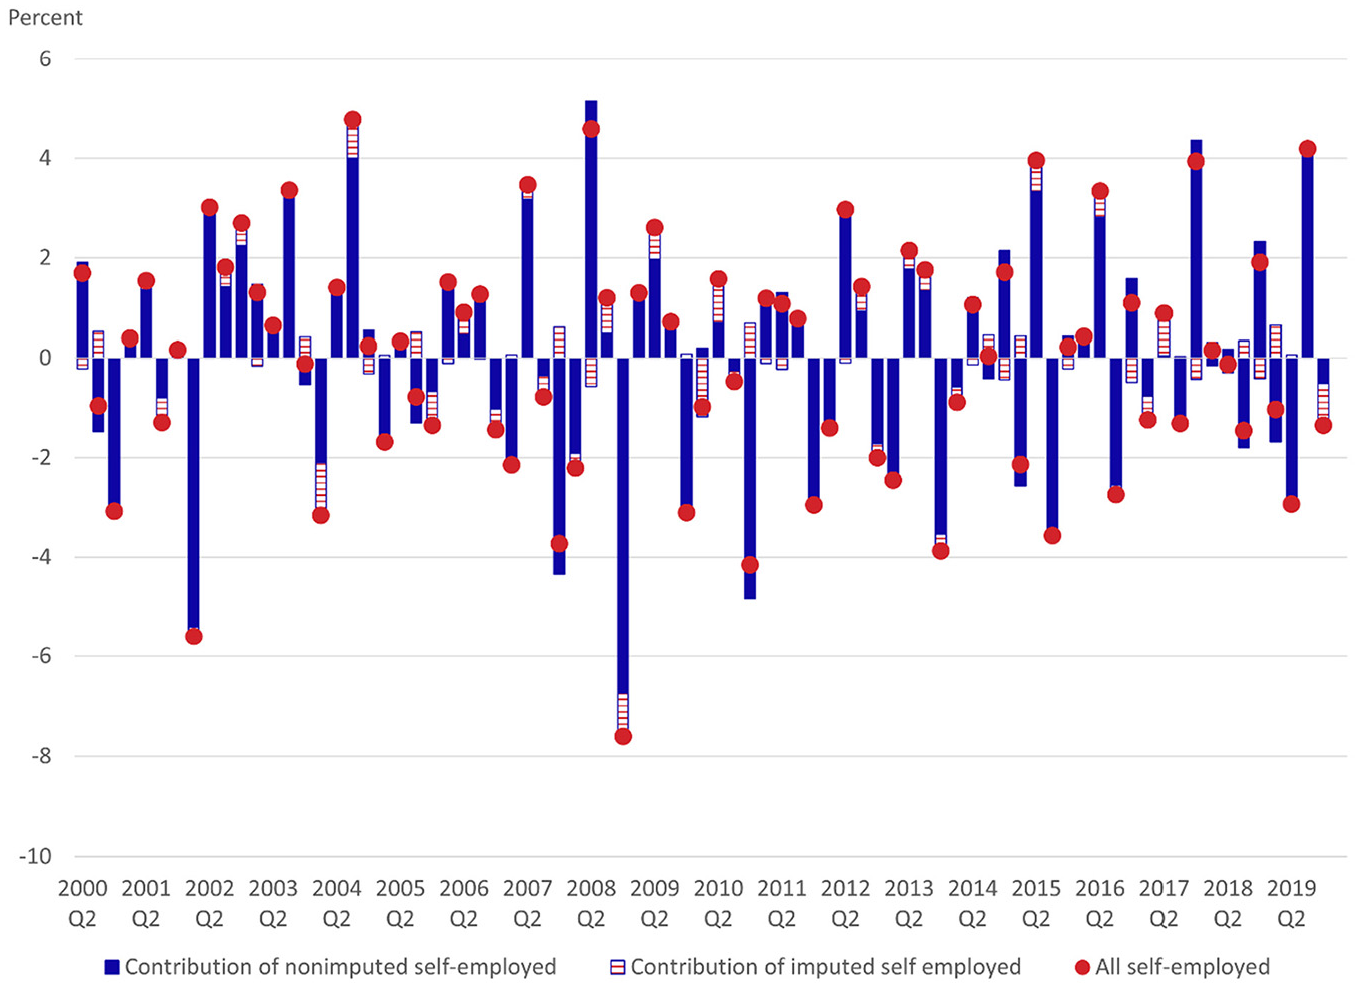
The contributions of imputed and nonimputed unincorporated self-employment to the growth in unincorporated self-employment in the nonfarm business sector, quarter-to-quarter percent change, second quarter 2000 to fourth quarter 2019.
2.6. Panel Data Analysis: Respondent Transitions into and out of Unincorporated Self-Employment
Although we have identified several survey-related reasons for quarter-to-quarter volatility in the number of unincorporated self-employed, there are reasons that workers do, in fact, move in and out of SEU. For example, workers sometimes use SEU as a bridge between wage-and-salary job spells so they can pay their bills while looking for a new job (Cahill et al. 2013; Fairlie and Fossen 2020; Von Bonsdorff et al. 2017). Some unincorporated self-employed decide to incorporate their businesses, sometimes in response to changes in tax laws (Cole and Sokolyk 2018). However, Fujita et al. (2024) also find that following the introduction of the RIP in 2008, employer-to-employer transitions increased dramatically among individuals with transitions in the reporter type in adjacent months as well as among those where there was a different proxy-reporter across months. Thus, it is important to examine not only cross-sectional changes in SEU, but also to look at transitions into and out of SEU from one month to the next.
To examine transitions, we match respondents’ consecutive month-to-month responses using unique household and person identifiers and sex. We examine month-to-month transitions within MIS 1 to 4 and within MIS 5 to 8 of the CPS panel. We compare respondents’ reported work status and class of worker across matched months and observe movements between SEU and other classes of work or non-employment.
In four panels, Figure 16 shows the quarterly average number of workers who reported one class of work in the current month and who reported being unincorporated self-employed in the previous month. These are month-to-month transitions out of SEU into another class of work or non-employment. The number of unincorporated self-employed in the current month who reported being unincorporated self-employed in the prior month fell from 8.2 million in 2000 to 7.8 million in 2019 (panel B). (This represents a shrinking share of the total unincorporated self-employed, from 0.92 to 0.89).
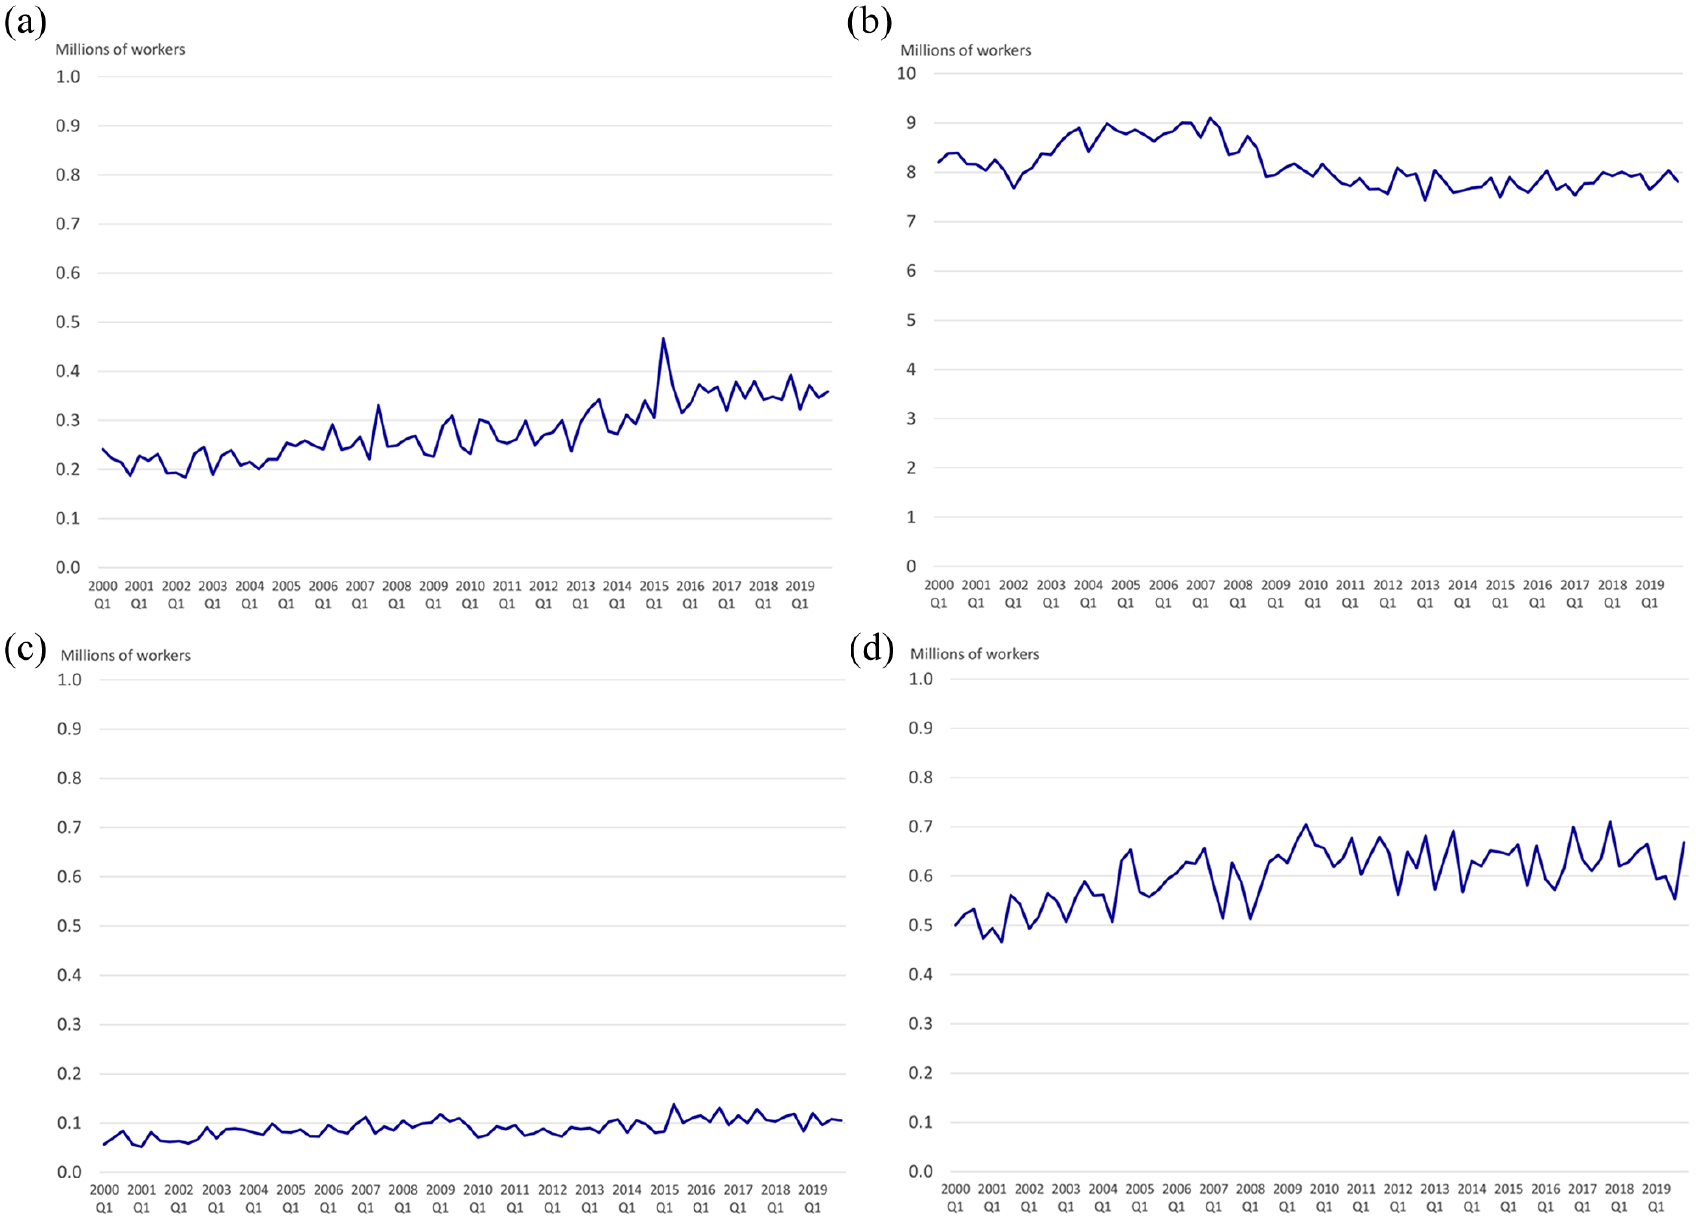
Transitions from unincorporated self-employment in the previous month to different classes of work or non-employment, first quarter 2000 to fourth quarter 2019: (a) employees, (b) unincorporated self-employed, (c) incorporated self-employed, and (d) not employed.
Figure 17 repeats the analysis but for workers who transition into SEU. Figure 17 Panel B is the same as Figure 16 Panel B but presented again for symmetry. Both Figures 16 and 17 show that the number of workers reporting being unincorporated self-employed in one month and some other class of worker in the next or previous month is small but has been increasing over time. About 120,000 more employees reported having been unincorporated self-employed the previous month in 2019 than in 2000, and 170,000 more nonemployed persons reported being unincorporated self-employed the prior month in 2019 than in 2000. Similarly, the number of unincorporated self-employed who reported having been employees in the previous month increased from 240,000 in 2000 to 360,000 in 2019.
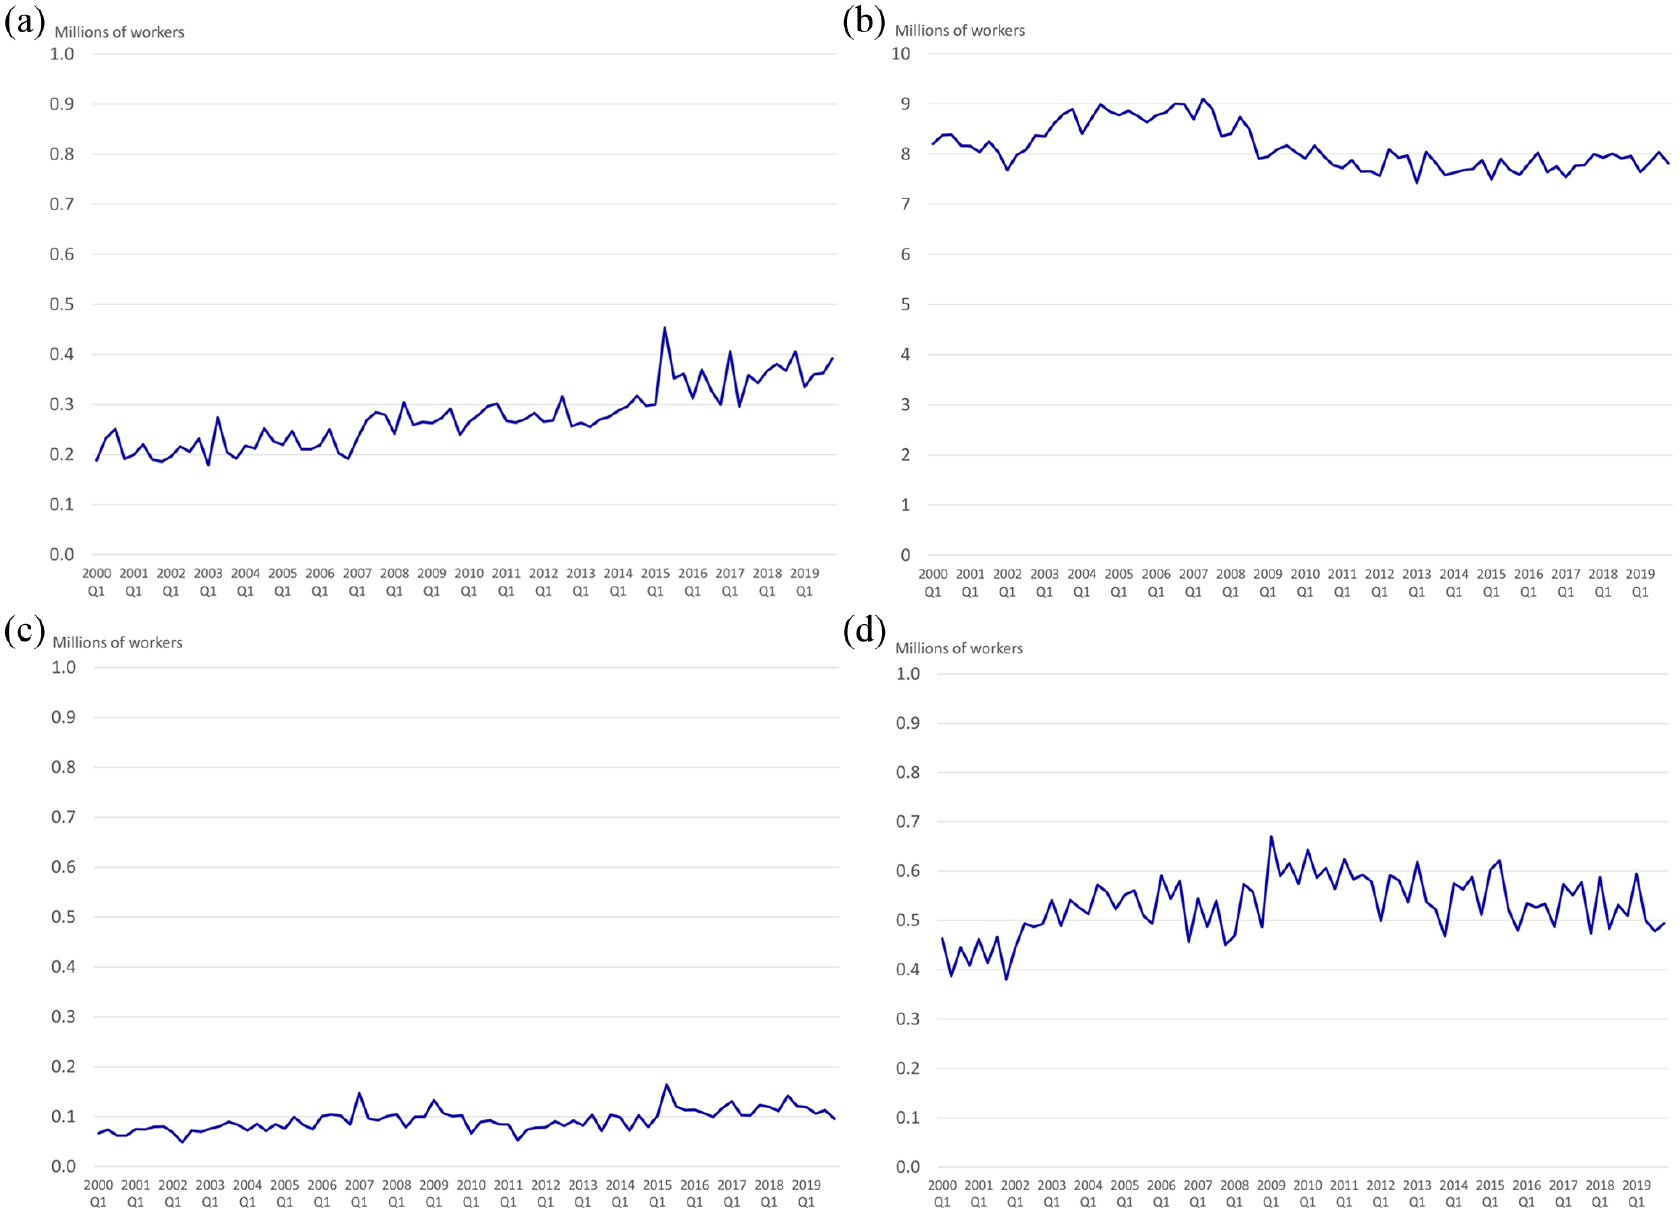
Transitions from different classes of work and non-employment in the previous month to unincorporated self-employed, first quarter 2000 to fourth quarter 2019: (a) employees, (b) unincorporated self-employed, (c) incorporated self-employed, and (d) not employed.
Transitions between SEU and incorporated self-employment are also increasing over time. These transitions both into and out of SEU suggest either lots of experimentation with self-employment or inconsistent reporting month over month. Prior research (Cole and Sokolyk 2018) suggests that the normal progression among the self-employed is to move from unincorporated to incorporated status rather than the reverse, and once established, it is rare for businesses to change their legal form of organization. While these transitions might be attributable to imputations or proxy-reporters, we also looked at consecutive months where neither month was imputed and consecutive months where both were self-reported and still find transitions in incorporation status for the self-employed in both directions (not shown). Therefore, there also is likely some confusion on the part of the self-employed about their incorporation status.
Because the household respondent can change from month to month in the sample, there is an opportunity to look at transitions when the reporter type changes. In Figure 18, we show quarterly average shares of the unincorporated self-employed in the current month who were reported as being employees, incorporated self-employed, or not employed in the previous month by each current and previous month reporter type pair (self in both months referred to as self-self hereafter, proxy in current month and self in previous month referred to as proxy-self hereafter, self in current month and proxy in previous month referred to as self-proxy hereafter, and proxy in both months referred to as proxy-proxy hereafter). We note that when there is a proxy reporter in consecutive months, which household member is the proxy-reporter could differ each month in households with three or more people aged 15 and older. However, we do not make any distinction about whether the proxy-reporter changed. (Here, we do not show transitions out of SEU to other work statuses. Because CPS longitudinal weights are designed to weight current period respondents to the population, a transition out of SEU must be measured as a share of the other work statuses respondents transition into. This results in a much larger denominator than in Figure 18 and miniscule shares.)
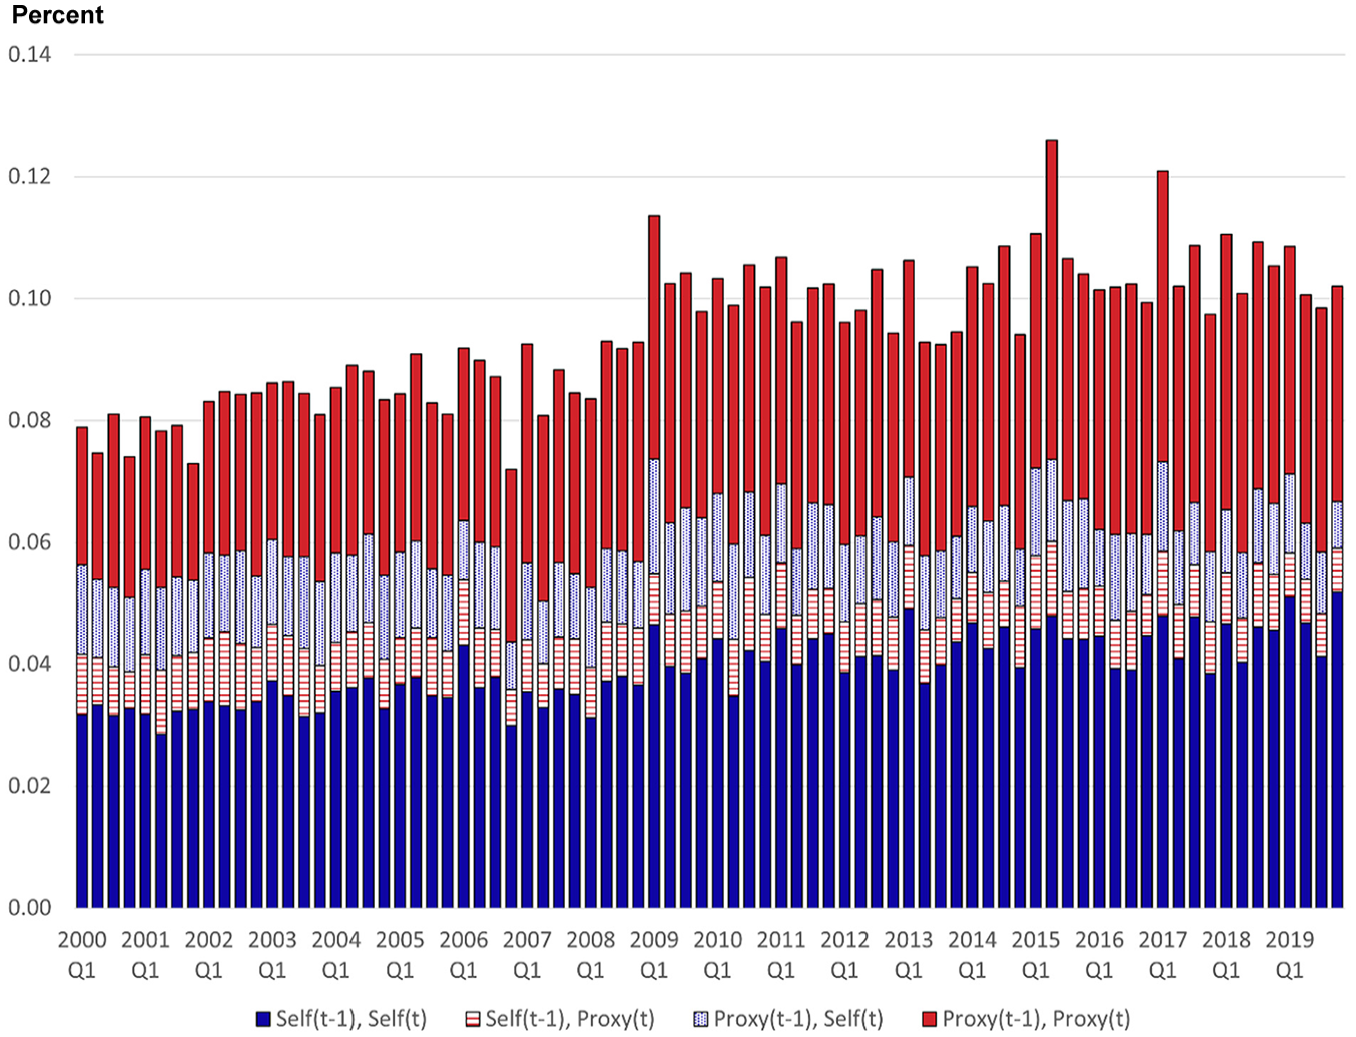
The share of unincorporated self-employed in the current month who were not unincorporated self-employed in the previous month by current and previous month reporter type, nonfarm business sector, first quarter 2000 to fourth quarter 2019.
Figure 18 shows that transitions into SEU are rising. In almost all quarters, more than half of the transitions occur when there is also a change in reporter type or the response is reported by proxy in both months. Over the period, there is a rise in transitions occurring among the self-self group and the proxy-proxy group, but not among the reporter-type switchers.
Figure 19 shows the quarterly average transitions into SEU from all other work statuses combined as a share of the unincorporated self-employed in the current month by the current and previous month imputation status pair (nonimputed in both months referred to as nonimpute-nonimpute hereafter, imputed in current month and nonimputed in previous month referred to as impute-nonimpute hereafter, nonimputed in current month and imputed in previous month referred to as nonimpute-impute hereafter, and imputed in both months referred to as impute-impute hereafter). There is a noticeable increase in transitions into SEU among those in the nonimpute-nonimpute group as well as among those in the nonimpute-impute group in the post-2008 period, the period following the adoption of the RIP.
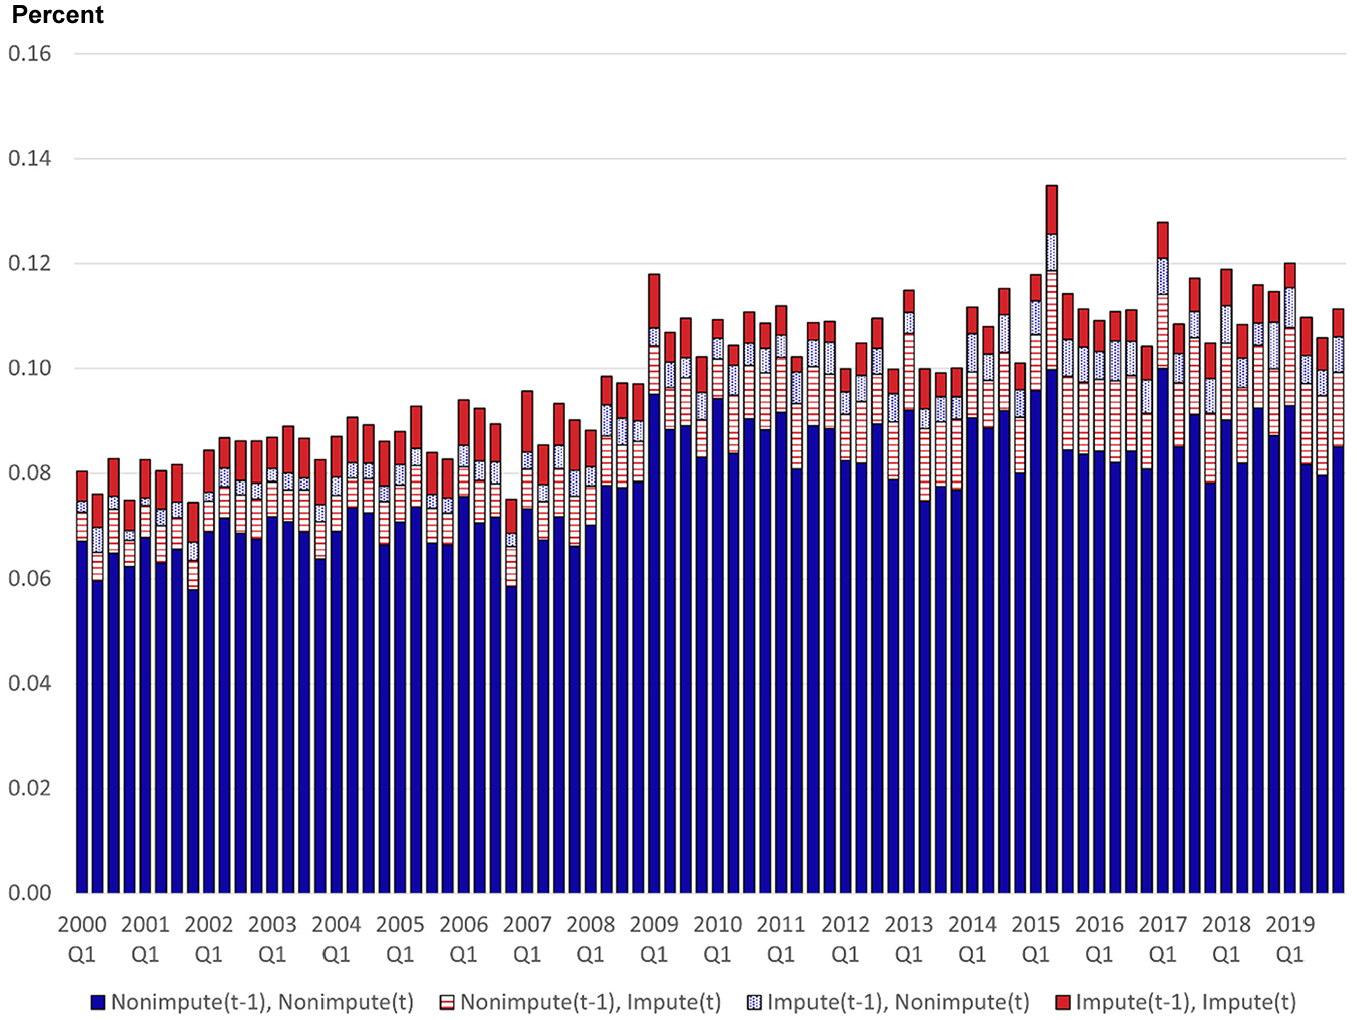
The share of unincorporated self-employed workers in the current month who were not unincorporated self-employed in the previous month by current and previous month imputation status, nonfarm business sector, first quarter 2000 to fourth quarter 2019.
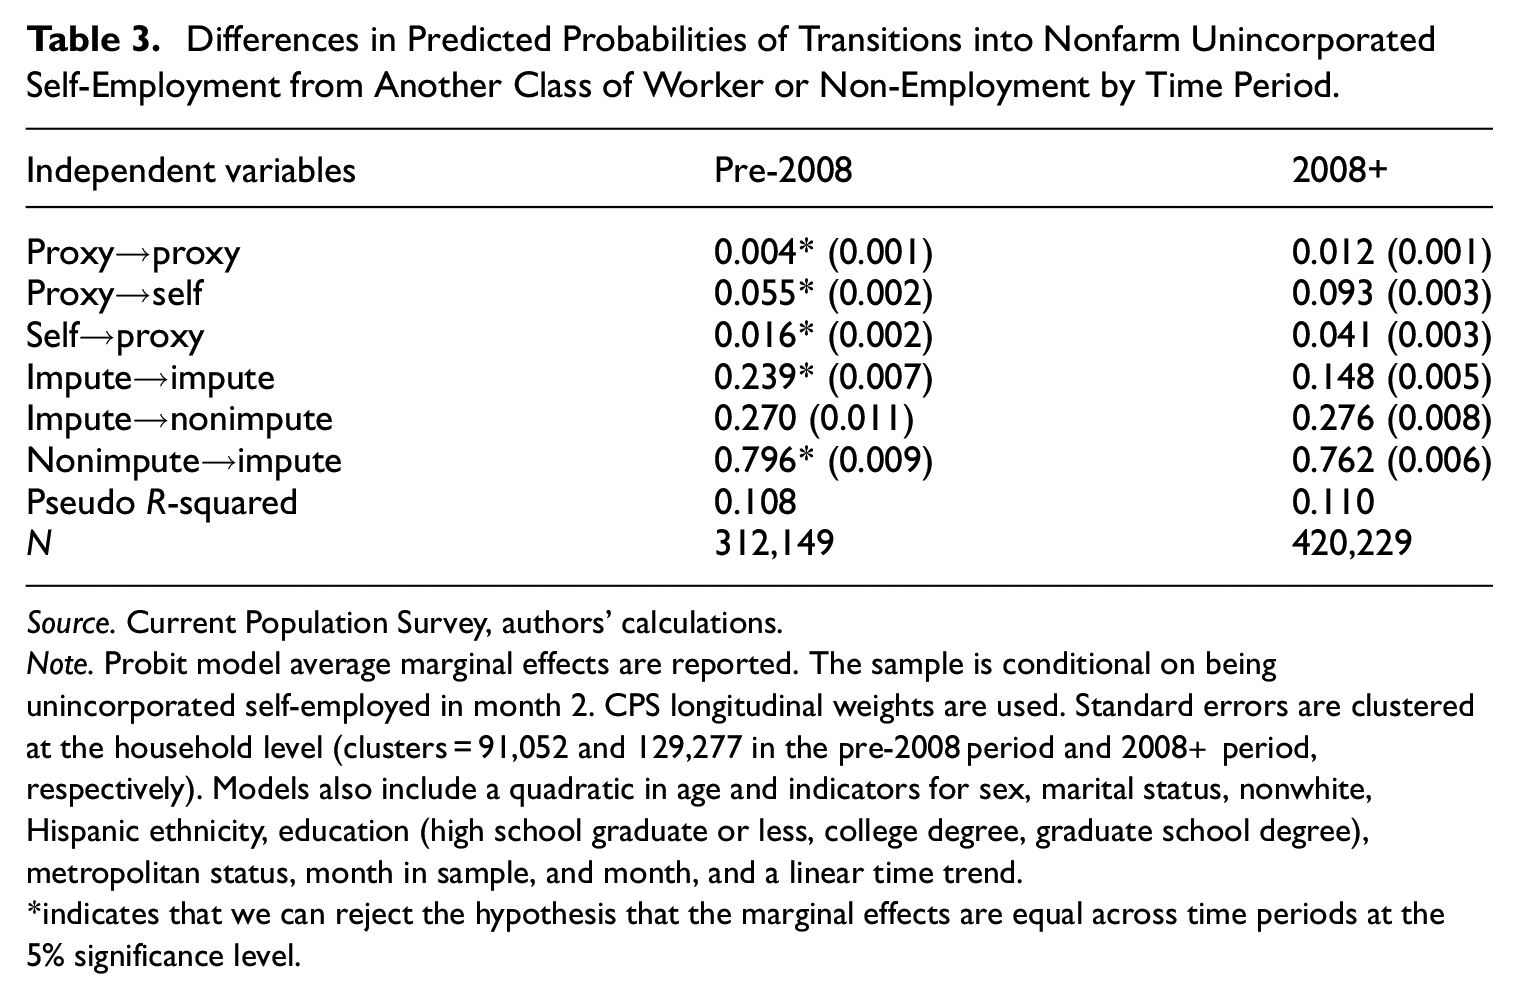
In Table 3, we present differences in predicted probabilities of transitioning into SEU from other employment statuses based on probit models that examine how reporter status and imputation status in adjacent months affect month-to-month transitions. These models control for both reporter status and imputation status, which are not mutually exclusive. They also control for other factors that may determine self-employment such as a quadratic in age, and indicators for sex, marital status, nonwhite, Hispanic ethnicity, education, metropolitan status, MIS, and month, and a linear time trend. The models are conditional on being unincorporated self-employed in the second month of the transition. Given the introduction of the RIP in 2008, we estimate models separately for those interviewed in the pre-2008 period and those interviewed in 2008 or later. We then test whether we can reject the hypothesis that the marginal effects are equal across time periods.
Differences in Predicted Probabilities of Transitions into Nonfarm Unincorporated Self-Employment from Another Class of Worker or Non-Employment by Time Period.
Source. Current Population Survey, authors’ calculations.
Note. Probit model average marginal effects are reported. The sample is conditional on being unincorporated self-employed in month 2. CPS longitudinal weights are used. Standard errors are clustered at the household level (clusters = 91,052 and 129,277 in the pre-2008 period and 2008+ period, respectively). Models also include a quadratic in age and indicators for sex, marital status, nonwhite, Hispanic ethnicity, education (high school graduate or less, college degree, graduate school degree), metropolitan status, month in sample, and month, and a linear time trend.
indicates that we can reject the hypothesis that the marginal effects are equal across time periods at the 5% significance level.
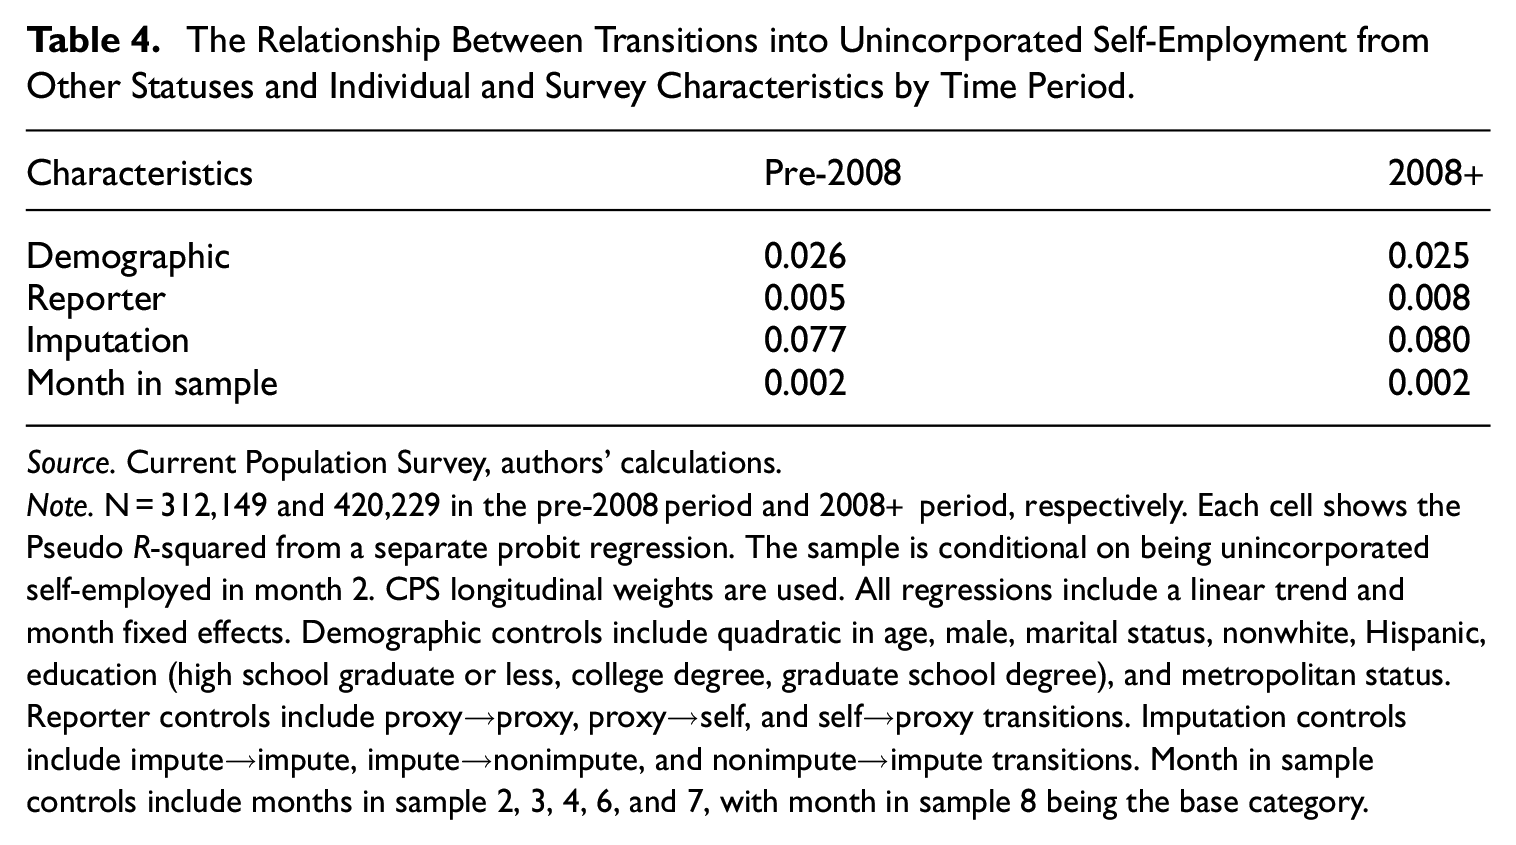
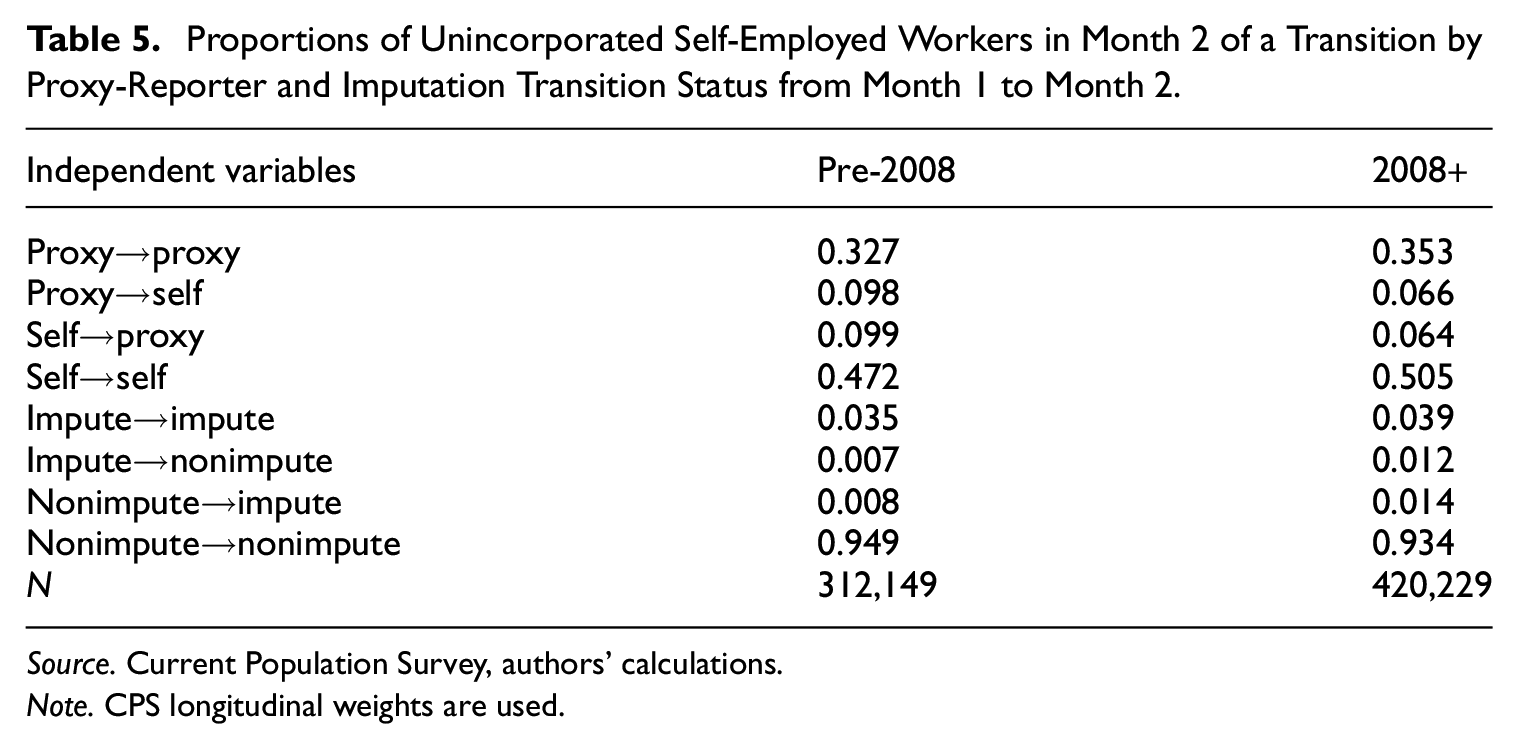
The set of reporter transition status variables measures the possible transitions between proxy- and self-responses, with the self-self group being the omitted reference group. Similarly, the set of imputation transition status variables measures the possible transitions between imputed and nonimputed responses, with the nonimpute-nonimpute group being the omitted reference group. Together, the set of imputation transition status variables contributes the most to explaining SEU transitions, increasing the pseudo R-squared substantially (Table 4). However, we note that only 5% to 7% of transitions are imputed in either or both months (Table 5), so the impact of these imputation status transitions on the transitions in SEU is likely still minimal. We also note that we see a small increase across the time periods in the contribution of the reporter transition status variables in explaining transitions, which would be consistent with the introduction of the RIP.
The Relationship Between Transitions into Unincorporated Self-Employment from Other Statuses and Individual and Survey Characteristics by Time Period.
Source. Current Population Survey, authors’ calculations.
Note. N = 312,149 and 420,229 in the pre-2008 period and 2008+ period, respectively. Each cell shows the Pseudo R-squared from a separate probit regression. The sample is conditional on being unincorporated self-employed in month 2. CPS longitudinal weights are used. All regressions include a linear trend and month fixed effects. Demographic controls include quadratic in age, male, marital status, nonwhite, Hispanic, education (high school graduate or less, college degree, graduate school degree), and metropolitan status. Reporter controls include proxy→proxy, proxy→self, and self→proxy transitions. Imputation controls include impute→impute, impute→nonimpute, and nonimpute→impute transitions. Month in sample controls include months in sample 2, 3, 4, 6, and 7, with month in sample 8 being the base category.
Proportions of Unincorporated Self-Employed Workers in Month 2 of a Transition by Proxy-Reporter and Imputation Transition Status from Month 1 to Month 2.
Source. Current Population Survey, authors’ calculations.
Note. CPS longitudinal weights are used.
We find that relative to when responses are not imputed in both months, respondents are 76 to 80 percentage points more likely to transition from any other status to SEU when their class of worker status is imputed in the second month (the probability is statistically significantly higher in the pre-2008 period). Respondents are about 27 percentage points more likely to transition from any other status to SEU when their class of worker status is imputed in the first month. And they are 15 to 24 percentage points more likely to transition when their class of worker status is imputed in both months (the probability is statistically significantly higher in the pre-2008 period). These results suggest that the imputed data may lead to additional noise in the series, although as stated in the previous paragraph, few observations are imputed in either or both months and so the overall contribution to volatility is likely minimal, which is consistent with Figure 19.
Looking at the reporter transition status variables, we see that the probability of transitioning employment statuses is highest when the respondent transitions from proxy to self, or vice versa, relative to the self-self group. Compared with the self-self group, respondents are 6 to 9 percentage points more likely to report a transition when the reporter type changes from proxy to self and 2 to 4 percentage points more likely to report a transition when the reporter type changes from self to proxy (the probabilities are statistically significantly higher in the 2008+ period, which is consistent with the introduction of the RIP). Given that 6% to 10% of the observations are proxy-self or vice versa transitions (see Table 5), their overall contribution to volatility is likely larger than that of respondents imputed in either or both months, which is consistent with Figure 18.
2.7. Editing Proxy- and Imputed Responses
Using the CPS panel, we evaluate the potential for editing responses when transitions between SEU and other classes of work/non-employment are accompanied by changes in reporter type or imputation status. These edits have the potential to reduce volatility in the SEU series.
The BLS productivity program produces quarterly measures, but it processes the CPS data monthly. However, unlike the monthly CPS, which is not revised in subsequent months, productivity measures are revised in response to revisions to output numbers. Edits to responses in the final month in each quarter could be made using the subsequent month’s responses before the first revision is released. There are many transition patterns over the eight months respondents are in the sample, with associated patterns of imputation or proxy-response that could plausibly be edited. Here we consider the impact of a rather conservative edit where the transitions are possibly spurious—editing class of worker reports where a reported class of worker in one month in sample is sandwiched between two matching but differently reported class of workers in surrounding months and there are concurrent changes in reporter type or imputation status.
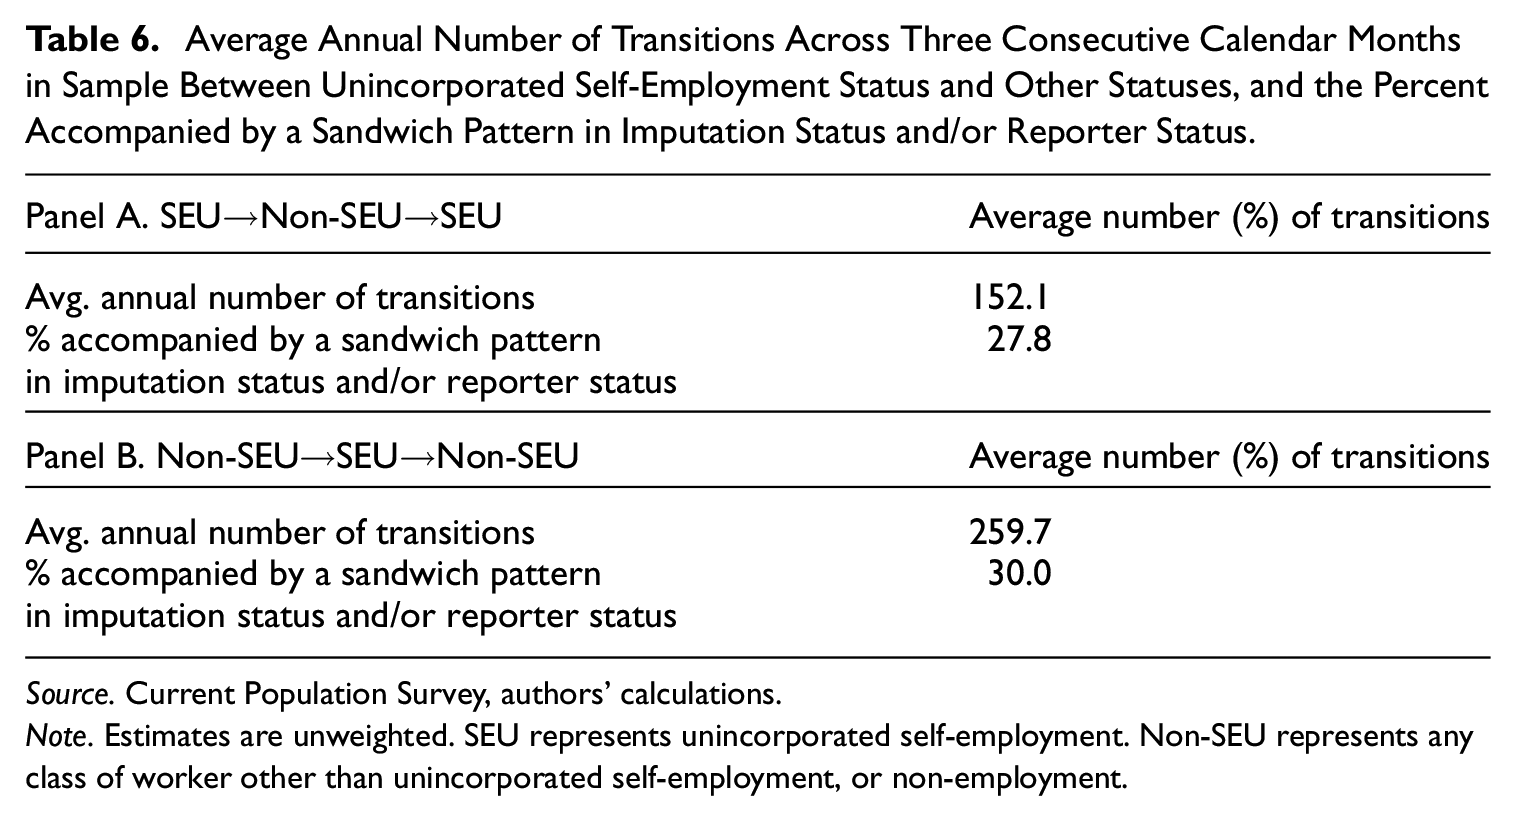
In Table 6, we show the average annual number of transitions of two different types over each three-month consecutive calendar months in sample—unincorporated self-employment to not unincorporated self-employment and back to unincorporated self-employment [SEU→Non-SEU→SEU] and Non-SEU→SEU→Non-SEU. Non-SEU includes employment and non-employment states. We also show the percentage of these transitions that coincide with a sandwich pattern in imputation status and/or proxy status where we edit the sandwiched response. The pattern could be one of the following four patterns: (1) imputed→not imputed→imputed, (2) not imputed→imputed→ not imputed, (3) proxy→self→proxy, or (4) self→proxy→self.
Average Annual Number of Transitions Across Three Consecutive Calendar Months in Sample Between Unincorporated Self-Employment Status and Other Statuses, and the Percent Accompanied by a Sandwich Pattern in Imputation Status and/or Reporter Status.
Source. Current Population Survey, authors’ calculations.
Note. Estimates are unweighted. SEU represents unincorporated self-employment. Non-SEU represents any class of worker other than unincorporated self-employment, or non-employment.
There are only a small number of edits that can be made each year where the sandwich imputation status and/or proxy status pattern suggests replacing the sandwiched class of worker with the class of worker from surrounding months is a reasonable edit. On average, over the 2000 to 2019 period, 4,400 CPS respondents (unweighted) each year are classified as unincorporated self-employed. However, only 152 respondents per year on average are reported as being unincorporated self-employed in one month, another class of worker the following month, and then again being classified as unincorporated self-employed in the third consecutive calendar month. Of those, about 28% were accompanied by a sandwich pattern in imputation or reporter status. On average, 260 respondents were reported as not being unincorporated self-employed in surrounding months but being unincorporated self-employed in the sandwiched month. About 30% of these transitions are accompanied by a sandwich pattern in imputation or reporter status.
Figure 20 plots quarterly SEU comparing the series without making edits to the series after making edits to sandwiched months for the transitions where there was a sandwiched change in class of worker that was accompanied by a sandwich pattern in imputation status and/or reporter status. We see that some of the peaks of the series are minimized after making these edits. However, we note that there would be a cost to making these edits, both in terms of the subjectivity required and the ease of replicability in official statistics. Although the changes to SEU after editing are small and would thus have minimal impact on productivity measures, editing the series might have a larger impact on other research, such as research on monthly self-employment dynamics, and so this editing process may be worth exploring in other work using the CPS.
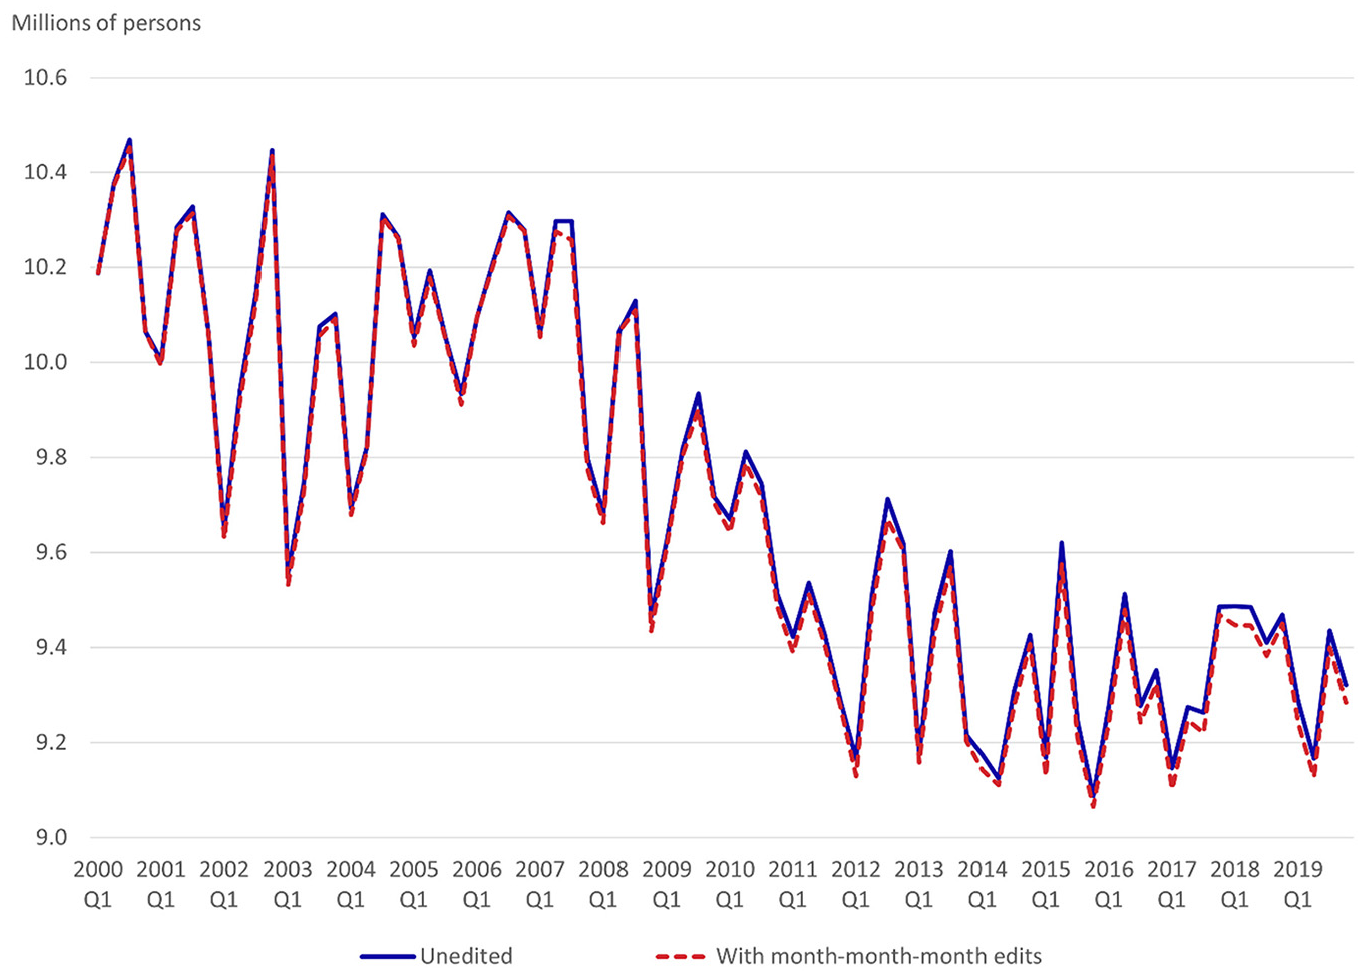
SEU with and without editing sandwiched transition months in transitions out of and into self-employment accompanied by transitions between reporter types or imputation statuses, nonfarm business sector, first quarter 2000 to fourth quarter 2019.
3. Volatility in Average Weekly Hours Worked
In addition to volatility in SEU levels, fluctuations in average weekly hours worked by the unincorporated self-employed also contribute to volatility in their total hours worked. The unincorporated self-employed have more autonomy in their work than do employees, and many choose self-employment to gain hours flexibility (Lim 2019). Over the 2000 to 2019 period, 20% of the unincorporated self-employed reported that their usual hours varied, while only 7% of employees reported that their hours varied. Variability in hours could make it more difficult for respondents to report self-employment hours accurately, leading to increased noise in the estimates. We also expect the estimates for the unincorporated self-employed to be more volatile given the smaller sample sizes. The volatility in average weekly hours also may be driven by some of the same factors (rotation group framework, changes in reporter type, changes in imputation status) driving the volatility in SEU levels that we explored earlier.
Looking at main jobs only, we compare quarter-to-quarter percent changes in average weekly hours worked by the unincorporated self-employed with those worked by employees and find that the average weekly hours worked of the unincorporated self-employed are much more volatile (Figure 21). The standard deviation of the unincorporated self-employed series is over twice the size of the standard deviation of the employee series (1.42% vs. 0.67%). This relatively larger volatility could be contributing to some of the outsized volatility in total hours observed in Figure 2. For example, three quarters in the post-Great Recession period (2016 Q2, 2019 Q1, and 2019 Q3) were especially concerning because the contribution to the growth in hours by the self-employed exceeded that of employees. In these quarters, the percent change in average weekly hours worked by the unincorporated self-employed was substantially greater than that for employees.
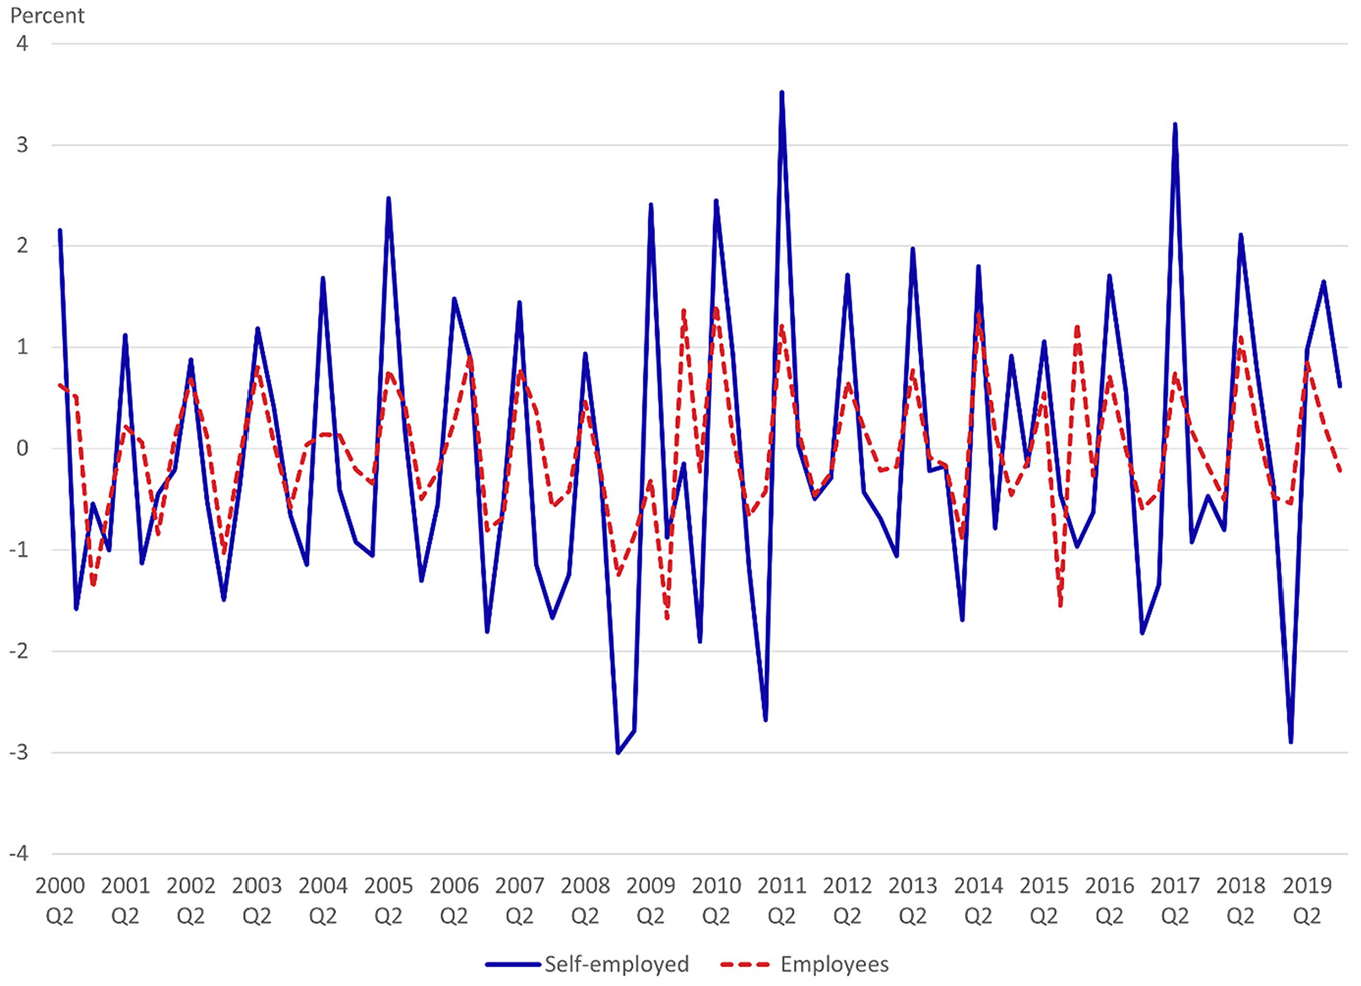
Quarter-to-quarter percent change in average weekly hours worked on main jobs by class of worker, nonfarm business sector, second quarter 2000 to fourth quarter 2019.
4. Concluding Remarks
SEU hours, as measured using the CPS, occasionally vary widely from one quarter to the next, and these variations can result in large fluctuations in BLS productivity measures. In this paper, we examined whether certain aspects of the CPS sample design, including sample weighting, the rotation group framework, imputation methods, and proxy-reporting, are associated with these large variations. As can be clearly seen in Figure 9, the difference in growth rates between those present in both quarters and those not present in both quarters due to sampling variation is a large contributor to volatility in quarter-to-quarter estimates of SEU. Transitions between proxy- and self-responses also add to volatility and, to a lesser extent, so does imputed data. We experimented with editing class of worker responses when a reported class of work in one month was sandwiched between two matching but different classes of work in surrounding months and there was an accompanying sandwich pattern in reporter status or imputation status. However, this did not appear to substantially smooth the series. In addition, editing involves subjective decision making and would be nontrivial to implement in official statistics. Volatility in sampling weights after 2016 also may have magnified some of the volatility in SEU. The CPS is exploring introducing an online version of the questionnaire to increase response rates, which could potentially reduce volatility (U.S. Census Bureau 2024). In a companion article, Cunningham et al. (2023) discuss how the combination of directly compositing SEU hours—as is done to construct official employment and unemployment statistics—and removing part of the irregular component capturing primarily sampling error—as calculated part of the seasonal adjustment process—smooths the SEU series while preserving cyclical changes.
Supplemental Material
sj-pdf-1-jof-10.1177_0282423X251354908 – Supplemental material for Why are Measures of Aggregate Hours Worked by the Unincorporated Self-Employed So Volatile?
Supplemental material, sj-pdf-1-jof-10.1177_0282423X251354908 for Why are Measures of Aggregate Hours Worked by the Unincorporated Self-Employed So Volatile? by Cindy Michelle Cunningham and Sabrina Wulff Pabilonia in Journal of Official Statistics
Footnotes
Acknowledgements
All views expressed in this paper are those of the authors and do not reflect the views or policies of the U.S. Bureau of Labor Statistics. We thank Patrick Carey, Lucy Eldridge, Steven Haugen, Nicholas Johnson, Justin McIllece, Stephen Miller, Drake Palmer, Anne Polivka, Matthew Russell, Ayşegül Şahin, Jay Stewart, Michael Sverchkov, Brady West, and members of the BLS Technical Advisory Committee for helpful comments.
Funding
The author(s) received no financial support for the research, authorship, and/or publication of this article.
Supplemental Material
Supplemental material for this article is available online.
Received: September 9, 2024
Accepted: June 2, 2025
References
Supplementary Material
Please find the following supplemental material available below.
For Open Access articles published under a Creative Commons License, all supplemental material carries the same license as the article it is associated with.
For non-Open Access articles published, all supplemental material carries a non-exclusive license, and permission requests for re-use of supplemental material or any part of supplemental material shall be sent directly to the copyright owner as specified in the copyright notice associated with the article.