
Abstract
Data from online non-probability samples are often analyzed as if they were based on a simple random sample drawn from the general population. As the exact sampling frame for these non-probability samples are usually unknown, there is no general method to construct unbiased estimators. This raises the question of whether estimates based on online non-probability samples are consistent across sample vendors and concerning estimates based on probability samples. To address this question, we analyze data collected from eight different online non-probability sample vendors and one online probability-based sample. We find that estimates from the different non-probability samples can be very inconsistent. We suggest averaging estimates across multiple vendor samples to avoid the risk of a maximum estimation error. We evaluate several averaging approaches, including a LASSO regression procedure which identifies a subset of vendors that, when averaged, produce estimates that are more consistent with the reference probability-based estimates, compared to any single vendor. Our results show that estimates based on different vendors’ samples display different selection biases, but there is also some commonality among some vendor-specific estimates, thus there could be strong gains in estimation precision by averaging across a selection of multiple non-probability sample vendors.
1. Introduction
The rise of the internet created a plethora of opportunities to collect social survey data online. Web surveys now outpace all traditional “offline” survey modes, such as mail, telephone, and face-to-face (Callegaro et al. 2014). But unlike traditional survey modes which have well-defined population frames, Web surveys face a major challenge in drawing probability-based samples that are representative of the general population. Although some Web surveys use offline sampling methods to recruit probability samples of the general population (Blom et al. 2016), these methods are costly and often exceed survey budgets. Therefore, out of necessity, many researchers and private companies, instead draw non-probability samples from large pools of individuals who voluntarily sign up to become members of an online panel.
The difficulty of performing statistical inference based on non-probability samples is relevant for academic research, where analyses based on non-probability Web samples are increasingly making their way into the scientific literature (e.g., Alcántara et al. 2017; Bernauer and Gampfer 2015; Dockrell et al. 2013; Gathergood and Wylie 2018; Stancu et al. 2016), with little guarantee that results derived from one Web survey can be replicated in another. The use of non-probability samples is often due to the prohibitive cost of collecting a traditional probability sample. Therefore, it is important for researchers to understand the extent to which an arbitrarily chosen web survey vendor produces similar (or different) errors compared to another vendor. If there is variability across non-probability sample vendors with respect to the errors they produce, researchers could potentially exploit this variability and improve their estimates by purchasing multiple samples from different vendors and averaging the samples in order to minimize the risk of basing their inference on a single, potentially very selective sample.
In the present study, we address these issues by examining the variability in estimates obtained from several non-probability Web surveys conducted by multiple vendors in parallel, and demonstrate the advantages of averaging survey estimates across the different vendors versus simply commissioning a sample with a single vendor. In addition, we apply a LASSO procedure to investigate whether a more optimal subset of vendors can be identified for averaging that improves upon a simple “take-all” averaging approach. The LASSO procedure’s success would suggest that by piecing together estimates from different vendor samples into a more accurate single estimate the different estimation errors associated with different non-probability samples could help cancel one another out, resulting in an estimation error that is closer to the one of a probability sample from the target population.
1.1. Background/Research Questions
Most non-probability opt-in panels exclusively use online methods to recruit panelists, thus samples drawn from them will automatically omit non-internet users as well as internet users who did not join the panel. Given that these segments of the general population will be excluded from selection, there is a risk that samples drawn from opt-in panels result in biased estimates. Indeed, comparison studies tend to show that probability-based surveys produce more accurate estimates than non-probability surveys across a variety of outcome variables (Cornesse et al. 2020). Moreover, comparisons between online non-probability surveys fielded by different panel vendors suggest that there is significant variability in the estimates obtained from them (Blom, Ackermann-Piek, et al. 2017; Kennedy et al. 2016; MacInnis et al. 2018; Yeager et al. 2011).
These inconsistent results suggest that researchers may not obtain similar results from different opt-in panels. This poses a challenge for researchers interested in using online non-probability surveys to produce reliable and reproducible estimates of the general population. If the error properties of non-probability surveys are constant across panel vendors, then researchers can be confident that they will obtain similar results regardless of which vendor they choose. However, if the error properties of non-probability samples differ widely across sample providers—which the empirical literature suggests to be the case—then relying on a single arbitrary panel provider is a risky proposition as the purchased vendor sample may lead to larger estimation errors than those provided by alternative vendors. It may be more prudent for the researcher to allocate portions of their planned sample across multiple vendors, accounting for variability across different vendor samples and avoiding inadvertently basing their entire analysis on a single vendor that yields sample estimates with the highest error.
In practice, researchers typically contract only one panel vendor to carry out their Web survey. However, from a minimax perspective (Savage 1951), the alternative strategy of contracting multiple vendors to conduct the survey is more advisable, as the researcher minimizes their “maximum regret” by avoiding inadvertently contracting the vendor whose sample is associated with the largest estimation error. Minimax estimators have a long history in statistics, with Wald developing an early example (Wald 1939). Gabler et al. (2000), Hodges and Lehmann (2011), and Inada (1984) continued to develop minimax estimators, among many others.
The estimates produced from each vendor sample could then be averaged, giving equal weight to each sample, to produce an overall estimate that has a smaller estimation error than the sample with the largest possible error. If there is reason to believe that a set of vendor samples might have better data quality compared to the others, then a weighted average could be performed, giving higher weight to those vendors. This is the approach taken by poll aggregators, such as FiveThirtyEight, who perform a weighted average across multiple polls giving higher weight to the higher-rated polls (Silver 2019). However, typically there is very little (if any) information available that might distinguish between levels of data quality for different panel vendors with respect to a specific outcome variable. Identifying reliable quality indicators for non-probability samples is an open area of research.
In addition to averaging estimates across a large set of arbitrary vendor samples, a key question is whether a smaller set of vendors exits which would improve the accuracy of the averaged estimates even further. To address this question, we consider a regression analysis method, specifically, the least absolute shrinkage and selection operator (or LASSO). This method is used to determine whether some non-probability sample vendors provide redundant information through common error sources while other vendors provide distinct information that can be exploited to enhance the estimation accuracy for a given substantive outcome.
Our study aims to addresses the following research questions:
Do non-probability samples furnished by different panel vendors produce common errors, resulting in consistent survey estimates with similar accuracy? In other words, to what extent can researchers be confident that a non-probability survey conducted by one, arbitrarily chosen, vendor will produce estimates with similar accuracy compared to a different vendor?
Is it beneficial from an error perspective to exploit between-vendor variation by averaging survey estimates across multiple vendor samples?
Does there exist an optimal and parsimonious subset of vendor samples that further minimizes error in the averaged survey estimates, relative to averaging across all-available vendor samples? If so, future work could explore whether or not these patterns were consistent over time, enabling researchers to better optimize their selection of vendors
To address these questions the article proceeds as follows. First, we introduce our methodological framework for inference based on probability and non-probability samples (Subsection 2.1). After this, we discuss averaging estimators across different vendors (Subsection 2.2) and extend this idea to apply a data-driven LASSO-based procedure to investigate whether a more optimal and parsimonious subset of vendor samples exists that improves the accuracy of the averaged estimates (Subsection 4.2). Note that we do not examine methods which use a reference probability sample to predict the probability of being included in a non-probability sample (as in Elliott and Valliant (2017)), as our focus in this paper is on the differences between non-probability samples. In Section 3 we describe the data used to carry out our study. We then proceed to discuss the results of our analysis by assessing the extent to which non-probability samples furnished by different vendors produce consistent estimates for several substantive models of interest and then demonstrate the benefits of averaging the estimates across multiple vendor samples in order to minimize the risk of a worst-case error (Subsection 4.1). In Subsection 4.2 we show the results of our LASSO-based averaging estimators. Finally we discuss our proposed methods including their implications for collection data using non-probability sample surveys in Section 5.
2. Methods
2.1. Theoretical Framework
In this section we introduce some formal definitions and notation used to describe probability and non-probability sample surveys. A probability sample
It should be noted that in practice
We define a non-probability sample
To compare a survey with a probability sample to one with a non-probability sample, we assume that in both cases the same measurement instrument is applied, that is, both surveys measure the same variables for the elements in their respective samples. Now let
We are interest in the following finite population regression model:

where
The lack of information on
where
The existing literature on treating informative sampling uses auxiliary variables that describe the sampling (Pfeffermann 2011). While access to full design information and the estimation of response propensities for probability samples are in practice only possible for survey managers, such information can be passed on to analysts via the inclusion of survey weights, stratification, and clustering variables in the dataset. The absence of a known sampling frame, the reliance on willing respondents to self-select into the online access panel, and the general inability to model the recruitment process makes it impractical for non-probability surveys to supply analysts with the same information to account for informative sampling as probability-based surveys are able to. Often the most non-probability surveys can do is to provide some post-stratification or calibration weights (Särndal and Lundström 2005), which are used to force representativeness of the weighted sample distribution toward the margins of a reference population for some limited set of covariates, for example, categories of age, gender, geographical region. Whether these weights are suitable or sufficient to account for informative sampling cannot be tested in the absence of any reference data, such as from a population register or probability sample with a known sampling design.
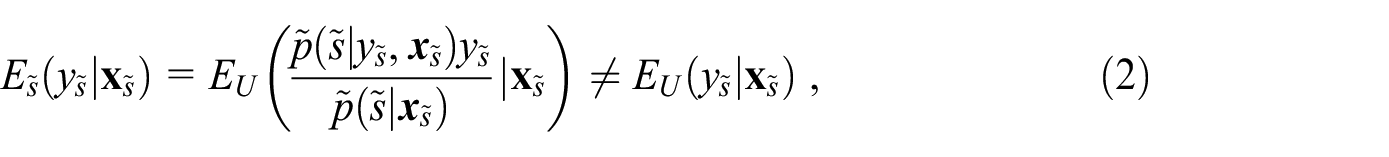
Suppose we would like to estimate a statistic
If we have access to a probability sample, with an unbiased estimation strategy

as the selection bias of the sampling design
Given our restriction that the non-probability surveys under consideration—that they measure the same variables as a probability survey—in combination with the limited control that analysts usually have over
2.2. Averaging Model Estimates Across Multiple Non-Probability Surveys
We primarily consider the situation where the researchers are interested in making model-based predictions for certain outcome variables, where the estimated regression coefficients are used to make predictions. If the different non-probability datasets result in different estimation errors (e.g., sign, magnitude, etc.) as expected, then given our ignorance as to which dataset is best, the same regression model can be fit on each dataset and the different coefficients can averaged. This prevents results with unusually high estimation errors from producing extremely wrong predictions, while taking advantage of datasets that make different errors. Datasets that make opposite errors can help cancel out the errors, resulting in more accurate predictions.
As a simple numerical example, let us consider individual level predictions made by two models fit on separate non-probability datasets, with the first model predicting
The aim is to minimize the estimates’ maximum (worst-case) distance from the true value while being ignorant of which dataset(s) is (are) best. Making a prediction based on a single dataset while ignorant of quality has a chance of producing a worst-case situation, as the researcher could end up picking the worst dataset by chance. Averaging never performs as poorly as the worst dataset (unless all datasets are equally good or bad). Conducting a weighted average based on a priori information (e.g., costs, reputation, or even sample size) will always have a chance of inducing more distance from the true value, as extra weight could be inadvertently given to the worst dataset(s).
Next, we provide a formal description of the estimation problem and briefly discuss model parameter averaging. Suppose there is a set of
For any given combination of vendors the following estimator can be computed:
where
2.3. LASSO Averaging
To make an informed selection of vendors, reference data are needed. A probability sample
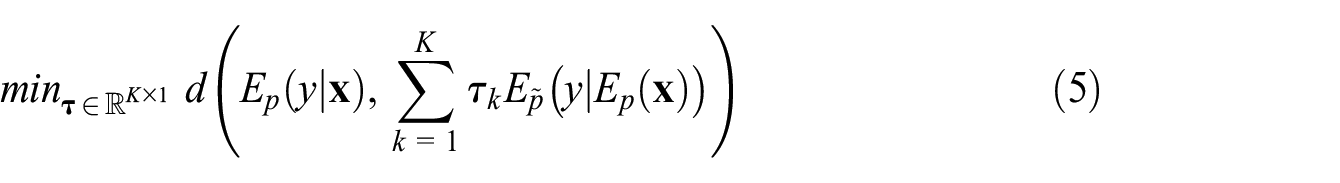
where
One way to solve the problem in Equation (5) is to express it as a regression of
To solve the optimization problem in Equation (5), LASSO regression is used, which is a modified version of ordinary least squares (OLS) regression, which attempts to select a set of coefficients
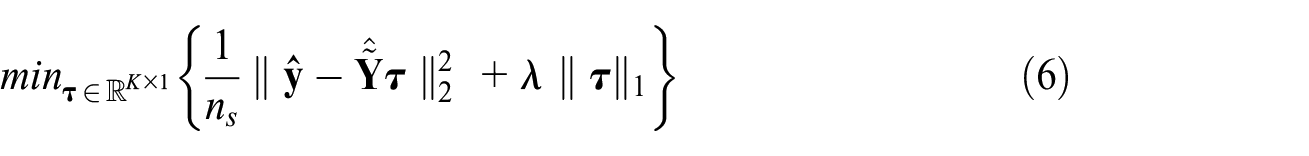
where
LASSO is an appropriate selection method (instead of OLS) due to its ability to determine which datasets are similar enough that they drop out, that is, have a
As LASSO drops variables that don’t improve model fit (depending on a tuning parameter,
2.4. Averaging Estimators
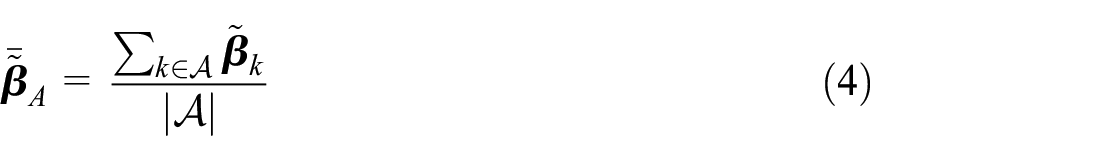
Here we consider weighted and unweighted averages of estimated parameters to estimate the model of interest. For this we define a general class of estimators that average parameter estimates from different non-probability samples:
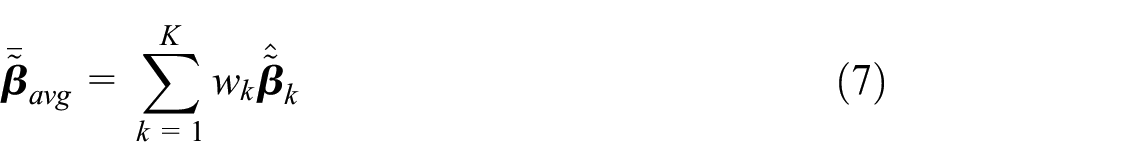
where
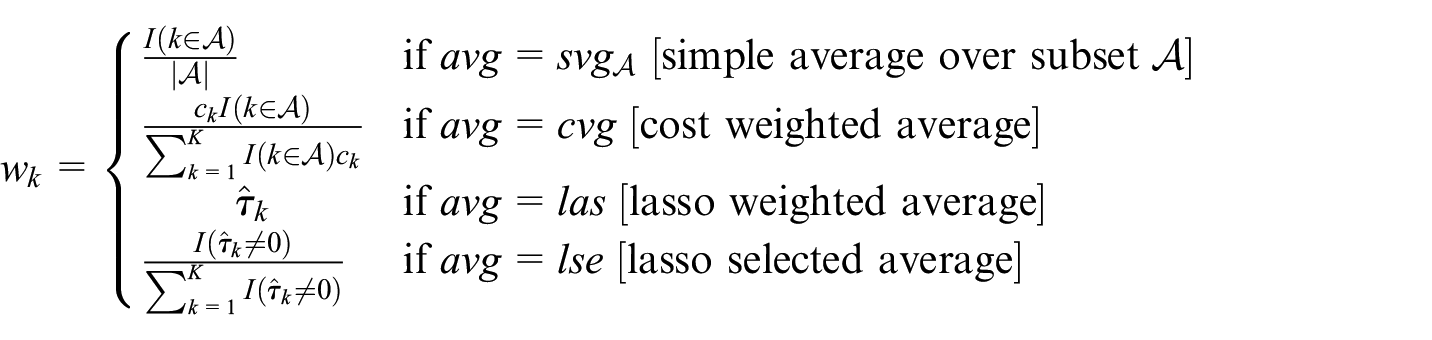
where
The first estimator,
The other two estimators use additional information from a probability sample to weight (or alternatively, select) estimates from the non-probability samples. The weights of the estimator
It is important to note that we use these latter two estimators only to show whether there exists a smaller subset of vendor samples which, when averaged, reduces estimation error further than simply averaging across all vendor samples. In practice, these estimators would not be feasible given the usual absence of a reference probability sample.
Our main interest lies in the distance between probability and non-probability sample prediction error of the estimated models of interest. To evaluate these quality indicators, we compare the following measures across the estimates.
To assess the prediction precision of the estimator
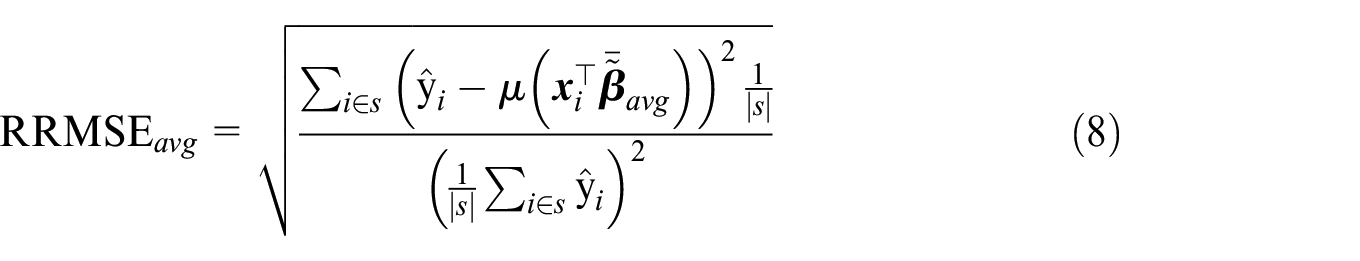
We opt to use
3. Data
To assess the variability in vendor-specific sampling error and demonstrate the different averaging procedures in a real-world application, we use one probability and eight non-probability Web surveys which implemented identical questionnaires during overlapping time periods. The probability survey comes from the German Internet Panel (GIP), which is a population-based panel survey representative of the German general population. The GIP is an ongoing, household panel survey of adults (16–75 years) residing in Germany. It is conducted by the University of Mannheim. The GIP sample is selected based on a multi-stage stratified area probability design. First, a random sample of geographic districts in Germany are drawn. Then a random sample of households are drawn and all age-eligible household members are invited to join the panel (Blom et al. 2015). Because GIP data are exclusively collected online, households without internet access and/or an internet-capable browsing device are provided with either or both to facilitate coverage of the offline population and access to the online questionnaires (Blom, Herzing, et al. 2017). The initial recruitment round was conducted in 2012 and yielded a cumulative panel registration rate of 18.5%. A second recruitment round was conducted in 2014 and yielded a cumulative panel registration rate of 21.0%. After joining the panel, panelists are invited every two months to login and complete a Web survey of about twenty to twenty-five minutes containing a range of question modules on social, political, and economic issues. We use the questionnaire module administered in the March 2015 wave of the GIP, in which 68.7% of panelists (or 3,426 out of 4,989) completed the Web survey. Survey weights are also available for the GIP. These were computed by raking to population benchmarks on the following variables: marital status, household size, age, and education.
The eight non-probability Web surveys were commissioned as part of a separate methodological project assessing the accuracy and response quality of non-probability surveys conducted by the GIP team (Blom, Ackermann-Piek, et al. 2017; Cornesse and Blom 2023). Each non-probability survey was conducted by a different survey vendor in response to a call for proposals. The call stipulated that vendors recruit a sample consisting of approximately 1,000 respondents that are representative of the general population of Germany aged 18 to 70 years. No explicit instructions on how representativeness was to be achieved were provided in the call, and this decision was left to the vendors’ discretion. Out of seventeen responses to the call, seven vendors met the technical and budgetary criteria of the study and were accepted. Upon learning about the aims of the methodological project, an eighth vendor contacted the GIP team and volunteered to carry out one of the surveys free of charge. A list of the eight non-probability surveys is provided in Table 6.1 in the Supplemental Appendix in the Data Section. Details of the recruitment, including quota sampling variables and costs are included. To preserve confidentiality, the names of the eight non-probability survey vendors are referred to as Survey 1, Survey 2, and so on, ordered by the total survey costs (least expensive to most expensive).
We consider ten substantive models of interest, which we index by G1, G2,
For the non-probability sample we used the R glm function from the stats package (R Core Team 2024) and for probability sample the svyglm function from the R survey package (Lumley 2020) to fit all ten models. For the non-probability samples no survey weights were used in the estimation and for the probability sample the survey weights for the GIP sample were used.
4. Results
4.1. Comparison of Sample Quality and Simple Averaging
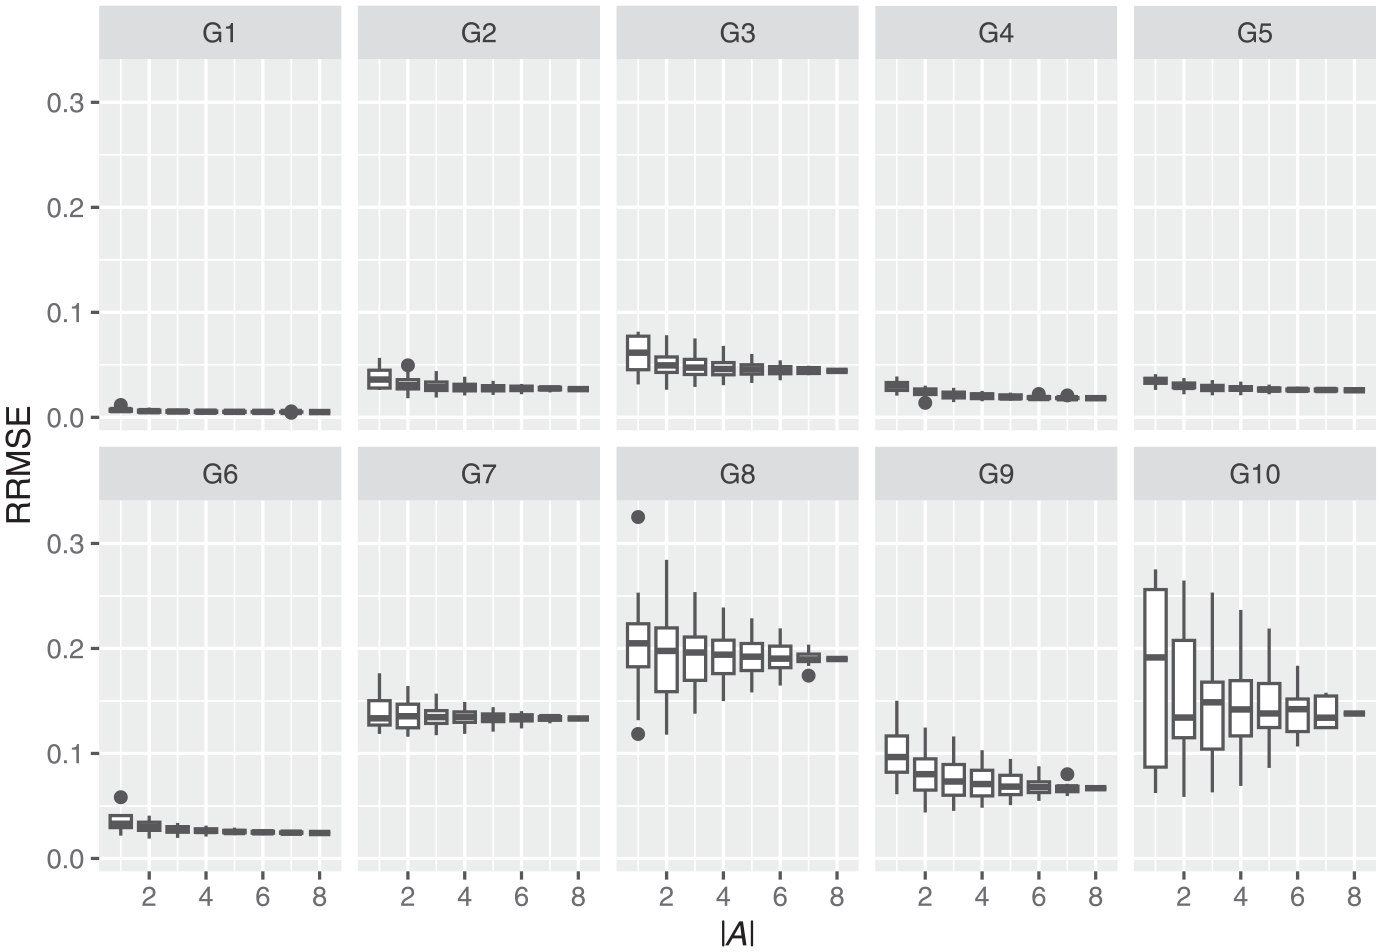
Table 1 shows the
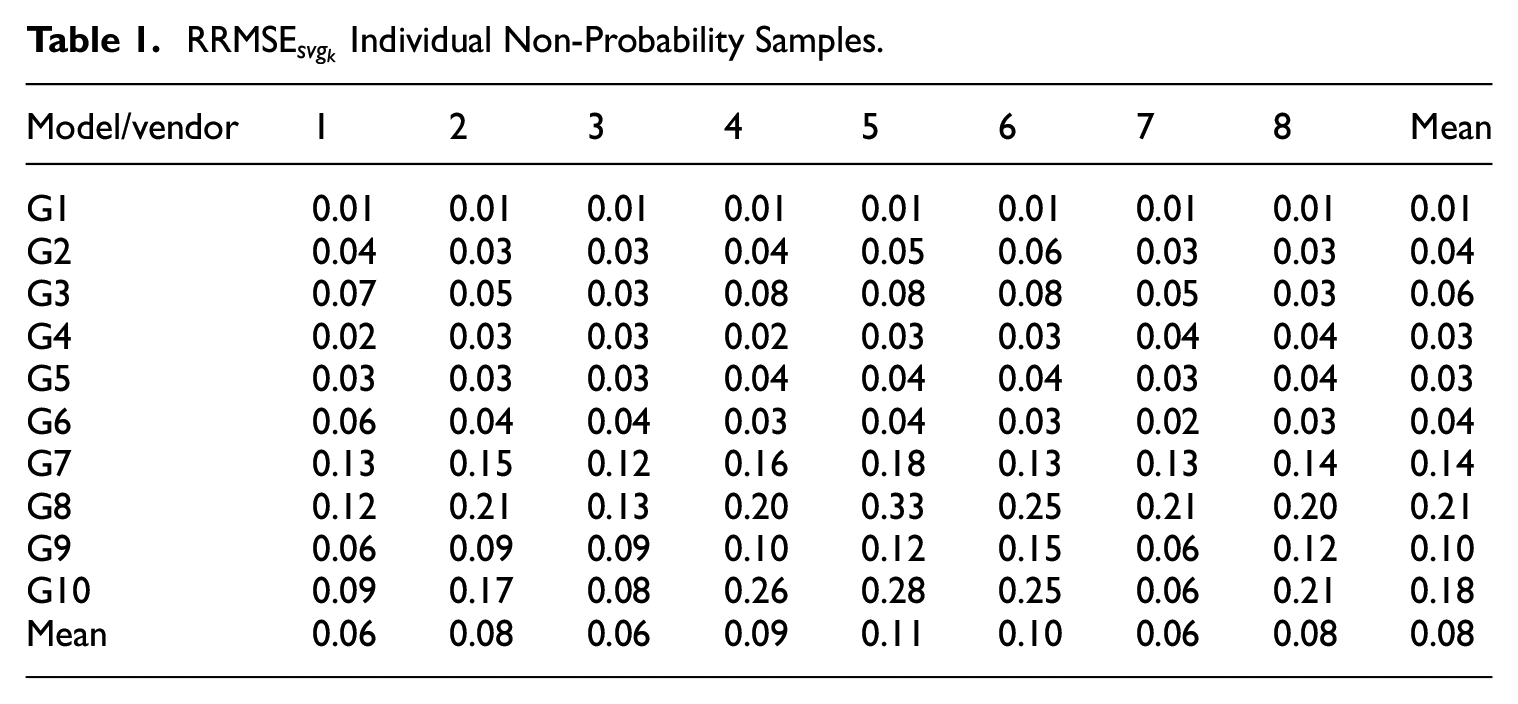
The deviations that some non-probability sample estimates display with respect to the probability sample data, hint at a selection bias from the estimation strategy based on the non-probability samples, as described in Equation (3). With regard to the first research question, we may conclude that researchers should not rely on a single sample from an arbitrarily selected vendor and that model estimates are not reproducible across the different vendors. Thus, there is a clear argument for averaging estimates from different vendors, to hedge the maximum regret (or error) and exploit the variation across vendors. The interested reader can find in the Supplemental Appendix Tables A1 to A10, one for each model, containing the parameter estimates obtained from each of the non-probability samples, and additionally the parameter estimates from the GIP benchmark probability sample. There it can be explored, in more detail, how different the parameter estimates from the different non-probability samples are between each other and compared to the reference GIP sample estimates.
Figure 1 shows the distribution of
Since summary statistics, like means, are also very important for many practitioners, we included Tables 6.2 and 6.3 in the Supplemental Appendix in order to show the means of our variables of interest and covariates for all eight non-probability samples and the GIP. To evaluate how the mean of our variables of interest differs between the non-probability samples and the probability sample we compute the conditional mean of our variables of interest for each non-probability sample using the model parameter estimates from the non-probability sample and the mean of the covariates from the probability sample. Then we compute the relative difference between the mean of the variables of interest from the probability sample and the conditional means. We do this analysis two times. One time using all of the above listed covariates and a second time using only age, sex, and education as covariates, to see what the effect of a more restricted and conventional set of control variable would be.
The results of this analysis can be found in the Supplemental Appendix in Tables 6.6 and 6.5 for the analysis using all covariates and the restricted set of covariates respectively. As a comparison Table 6.4 is also included which shows the relative distance between the unconditional means of the non-probability samples and the probability sample. The results of the analysis are mixed. Out of the eighty means considered we see that only for forty-two the relative difference for the unconditional means is higher than that for the unconditional mean using all covariates. When we consider the restricted set of covariates this number only increases to 43. Overall we cannot observe large changes in the relative differences if we decrease the number of covariates. We see that across the variables of interest, the cumulative relative difference is higher for the conditional mean than for unconditional means for 3 out of the 8 vendors. For the restricted set of covariates, this increases to 4. These findings suggest that the non-probability sampling designs are informative, despite controlling for a range of socio-demographic covariates.
A priori there is no indication of which vendors to avoid. Given the apparent informative selection of the non-probability samples we want now turn to evaluating the four averaging estimators, and identifying whether a more informed selection of vendors exists that, when averaged, minimizes error relative to the reference GIP probability sample.
4.2. Comparison of Informed and Simple Averaging Estimators
To address the second research question, we show results obtained from several alternative averaging estimators, including the two LASSO averaging estimators
Figure 2 shows the RRMSE for all four estimators, that is,
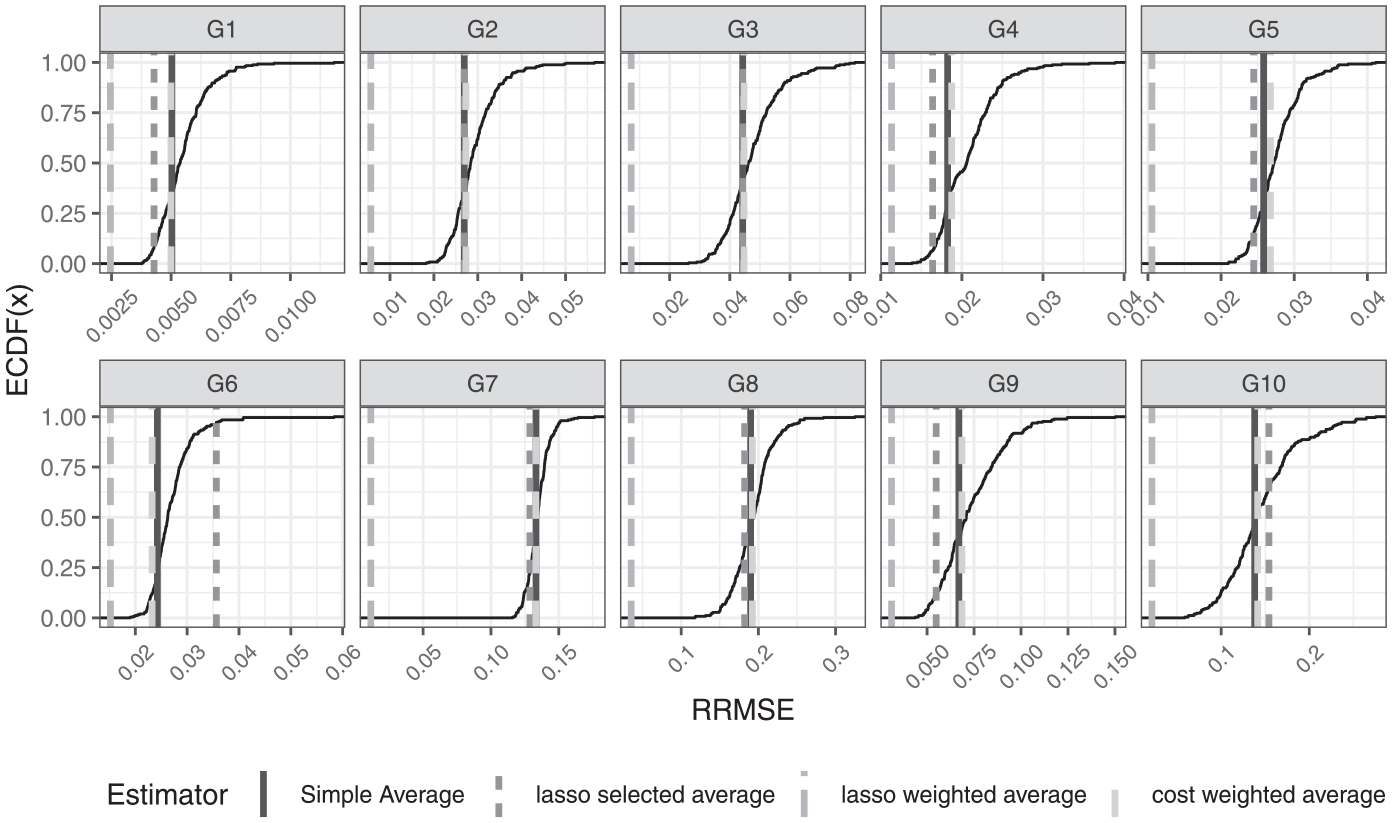
Root Relative Mean Square Error:
Figure 2 shows that the various estimators (e.g., LASSO weights, LASSO select, etc.) perform mostly as well as or better than the simple mean for around 50% of all possible combinations of vendors. The LASSO weighted estimator
Table 2 shows the ratios
RRMSEs in Relation to Simple Average.
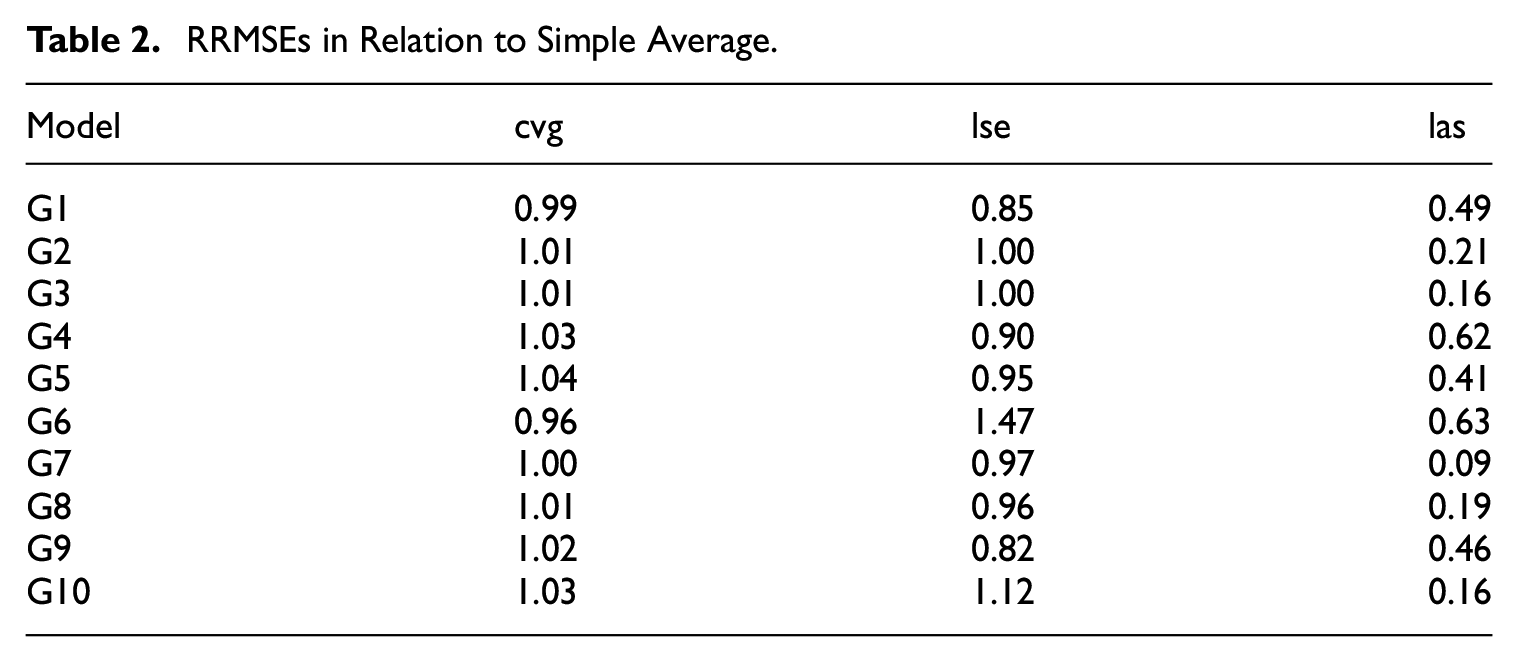
The LASSO selected estimator
The RRMSE results for the averaging estimators clearly show that the LASSO informed selection and weighting of vendors can result in considerable improvement in estimation precision. Considering that the two LASSO estimators,
For the interested reader we also evaluate the deviation of non-probability sample model coefficient estimates from the reference probability sample estimates. The results and discussion of this analysis and can be found in Supplemental Appendix 6.4.
Table 3 shows, for each model, which non-probability samples are selected for the LASSO estimators
LASSO Selection Frequency of Non-Probability Samples.
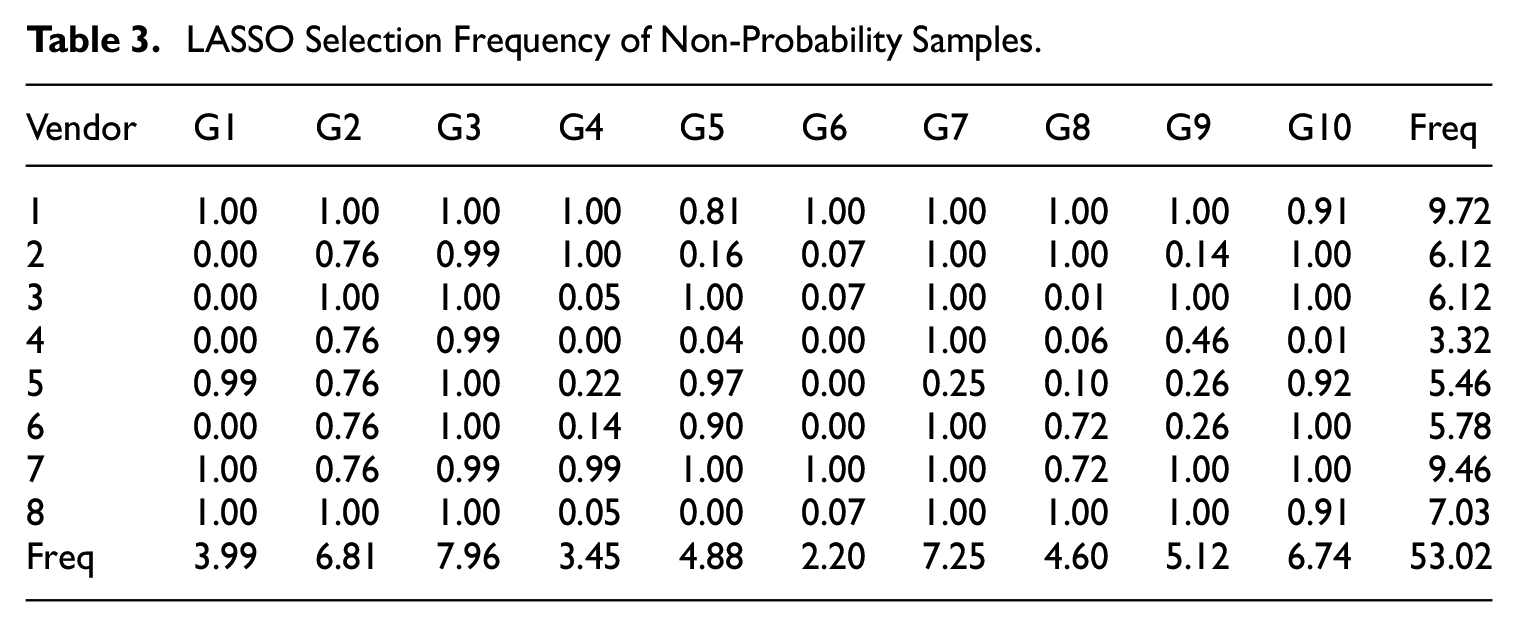
As can be seen in Figure 1, Models G1, G4, G5, and G6 generally have lower RRMSEs when estimated on the various non-probability vendors than models G2, G3, G5, G7, G8, and G10. This may account for the results observed in Table 3, where the LASSO procedure selects fewer vendors when estimating each model. If each non-probability dataset is similarly (in)accurate (having a consistent and/or low RRMSE), providing little additional information useful for prediction, LASSO would select fewer datasets in order to reduce the number of parameters in its final model.
The patterns of the row and column sums of Table 3 suggest two things. First, the row sums indicate that different vendors produce samples that have very different errors for each model, and that there are vendors that are, on average, less suitable to estimate the models. Otherwise LASSO would have either: (1) selected the same vendors (as their non-probability samples provide important information), or (2) selected competing vendors with roughly equal probability, as the non-probability samples would improve the predictive model similarly. An example of the second possibility can be seen in Table 3, where for model G2, vendors 2, 4, 5, 6, and 7 are selected equally often, suggesting that they are somewhat interchangeable. In contrast, vendors 1, 3, and 8 are always selected for model G2, as they provide information not contained in the other vendors’ samples. Second, the differences in the column sums show that the degree of selection bias in the non-probability samples differs depending on the outcome variable of interest.
To further investigate the selection bias of the eight sample vendors, we examine the weights of estimator
LASSO Weights of Non-Probability Samples.
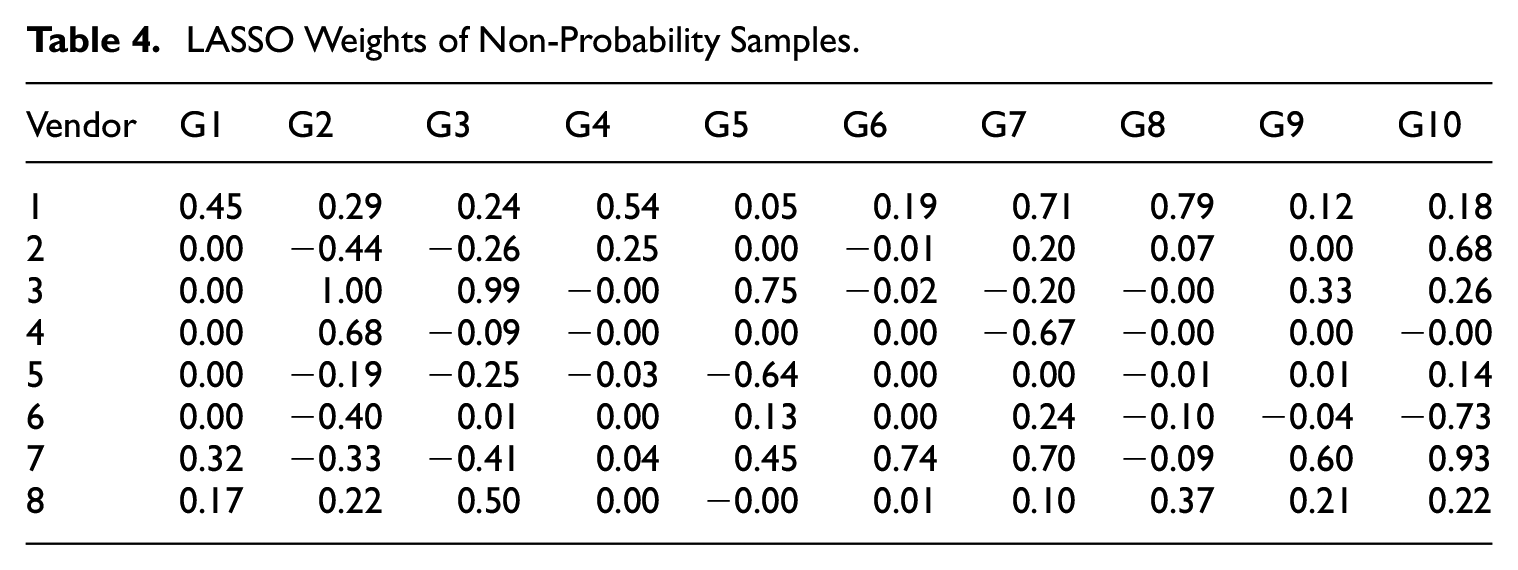
Table 4 shows that the weights can be both positive and negative, indicating that for some vendor samples there is a negative relationship between their measurement of the variable of interest and that of the GIP probability reference sample. We find a strong negative relationship between the probability sample and non-probability samples 4 and 5 for models G7 and G5, respectively. For all models, except G1, there is a mix of negative and positive weights for all vendors, except for vendor 1. Vendor 8 also has only positive weights, except for model G5, where its weight and selection frequency are comparably low.
Now, to see the relationship between the inclusion of a non-probability sample and its weight, we plot the selection frequencies of Table 3 against the average weights of the Table 4, which is displayed in Figure 3 for each model separately.
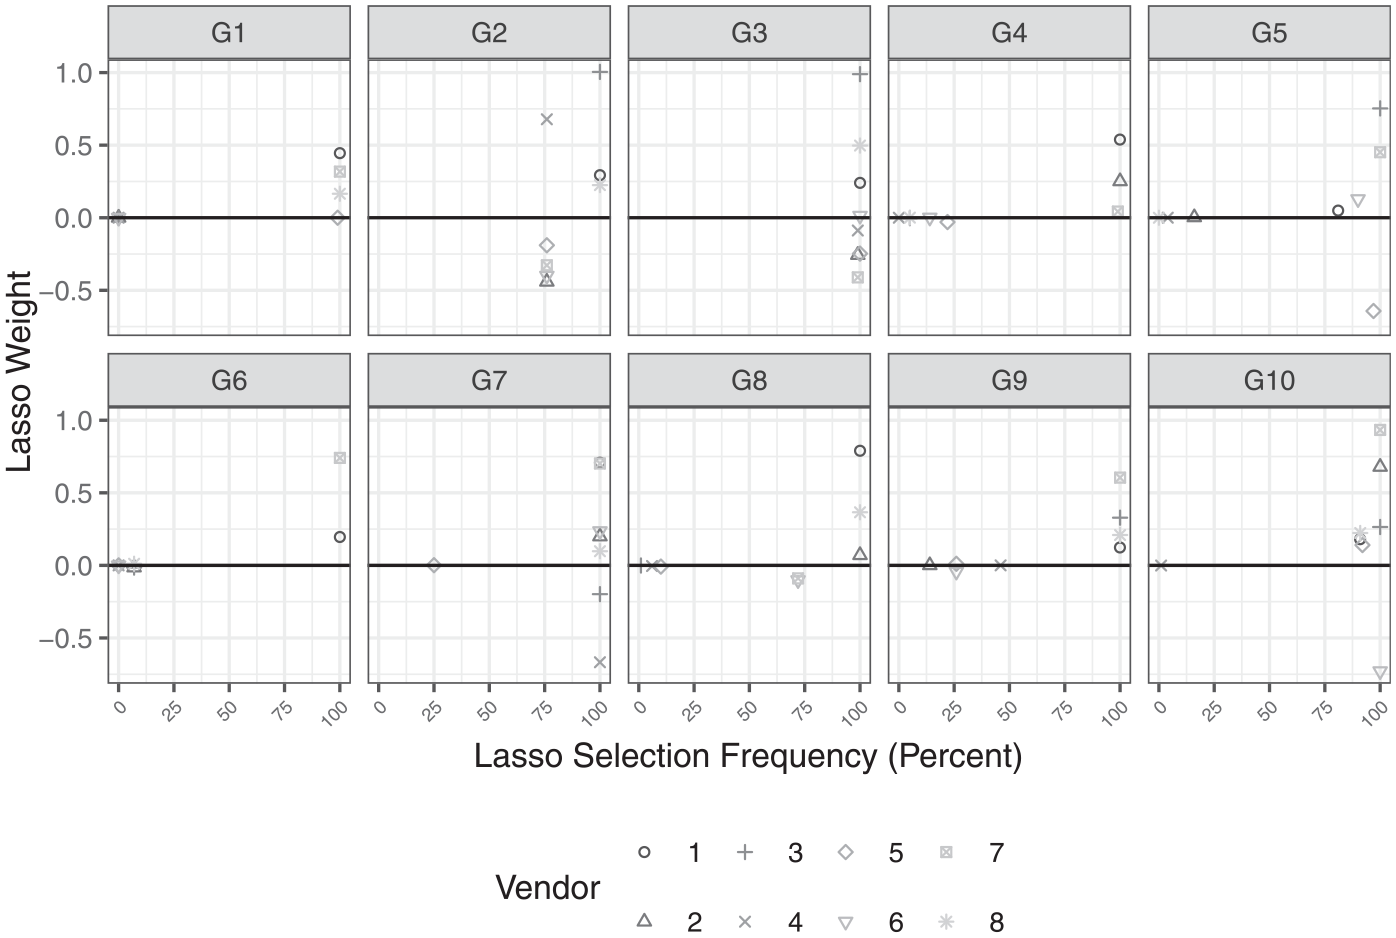
LASSO weights and LASSO selection frequency.
There are two observations that can be made. First, negative weights with high nominal values only occur for models G2, G3, G7, and G10, where most vendor samples are selected for inclusion in the LASSO estimators
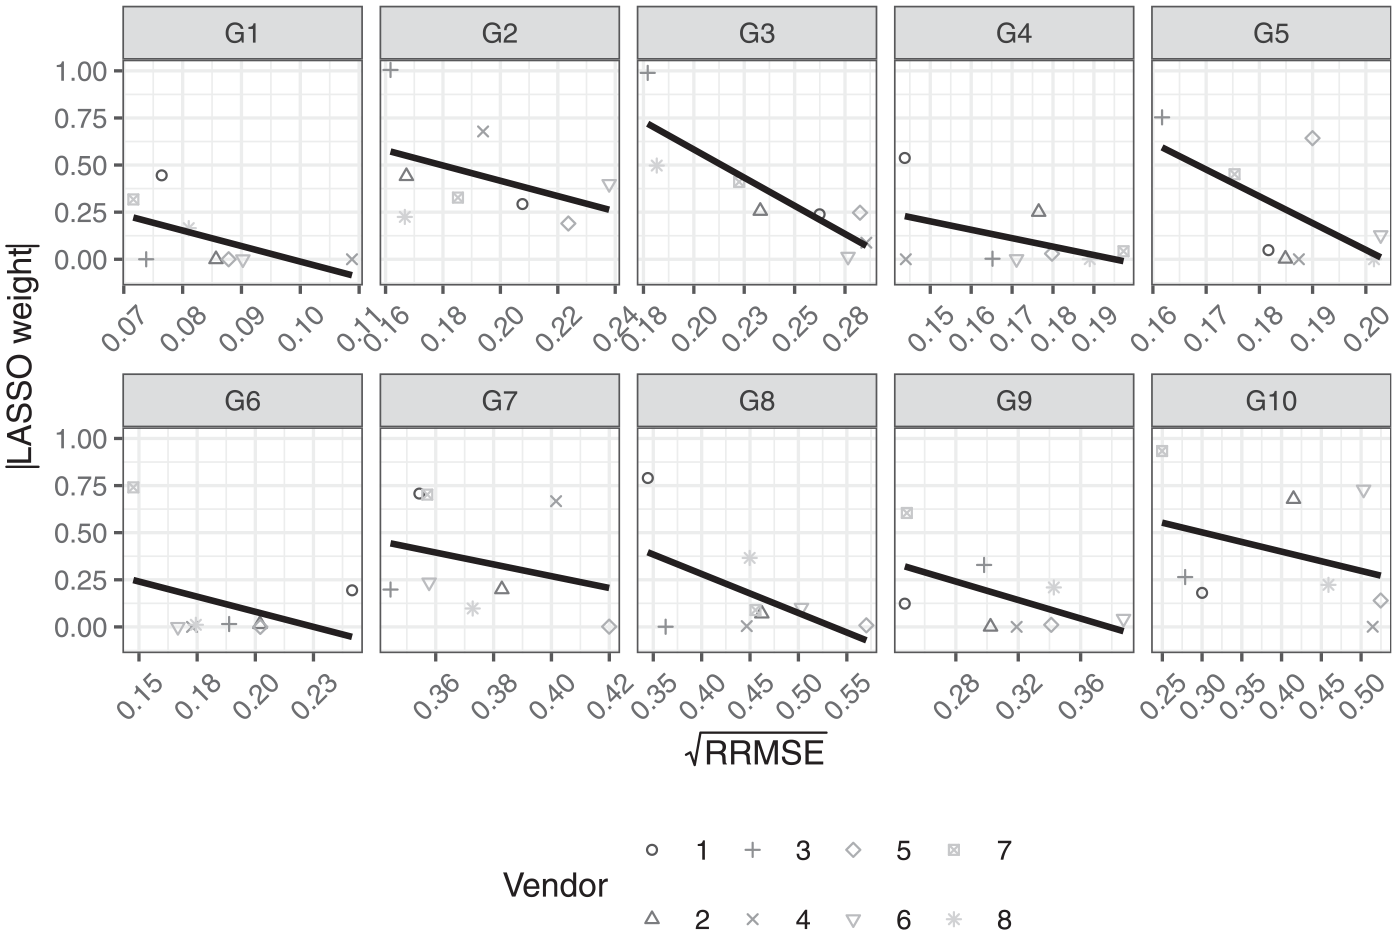
To conclude the presentation of the results, we examine the relationship between the RRMSE of the simple average
5. Discussion
This article addressed three primary research questions. First, we analyzed if non-probability samples collected from different vendors produce similar or consistent errors, and if not, is it possible to reduce worst-case estimation error in substantive survey estimates by averaging across multiple vendor samples? We showed that we were not able to control for the selection process of the non-probability samples by simply conditioning on a range of socio-demographic covariates, that are also commonly used as weighing variables in surveys.
We also showed that there is clearly a great deal of error variation from vendor to vendor, as well as from substantive model to substantive model, suggesting that relying on any single non-probability sample vendor is risky in terms of ensuring high-quality and reproducible parameter estimates.
We then addressed the second research question: How can we weight the results, obtained from the different non-probability samples, to reduce estimation errors? To this end we evaluate multiple averaging strategies for combining different non-probability samples to improve parameter estimates from substantive models. We showed that there is clearly a benefit to simply averaging estimates across the full collection of vendor samples as this reduces the maximum error (or regret), compared to using any single vendor sample. This is an important result given that it is both immediately usable by researchers, and judging by common practice, is unknown. Most researchers typically rely on only one vendor sample for their analysis and do not consider spreading their sample across multiple vendors. It also suggests that when collecting non-probability samples, it is preferable to accept a smaller sample size but obtain several different vendor’s samples, than a larger sample from a single vendor. The exact trade-off between sample size and the number of different vendors remains a subject for further research.
Finally, we demonstrated via LASSO weighting procedures that the accuracy of model estimates can be greatly improved by averaging a well-chosen subset of vendors. This is direct evidence that simply increasing the number of vendors used in the averaging procedure will not necessarily optimize estimation (despite increasing cost), and that some sample providers are more suitable than others for estimation depending on the outcome/model of interest; in fact, certain vendors did not provide any useful information during the estimation of some models and simply dropped out during the LASSO selection step (i.e., were assigned a weight of zero). In other words, some vendors produced samples that were redundant, making errors similar to those made by some other vendors. This is a very useful finding. If vendors make similar errors, then there is no advantage to commissioning samples from multiple vendors (averaging would only reduce independent sources of error, not common sources). As we found that some vendors produce samples suffering from different errors, while others result in similar errors, our study points to a potentially worthwhile subject of research: Are the errors produced by vendors consistent over time? If so, vendors could be evaluated, and researchers could then use these evaluations to more efficiently guide their selections of vendors, possibly reducing the number of vendors that would need to be commissioned.
From a practical point of view a benchmark statistic with an estimable sampling error, obtained from a probability sample, is still required. However, there are Scientific Use Files of probability samples based surveys available that can serve this role, even if their data is not measured at the same time as that of the non-probability samples. Non-probability samples are in fact often weighted by estimates obtained from probability samples.
If a researcher cannot afford a probability sample and must use non-probability sampling they should minimize their risk of error by distributing their planned sample across multiple vendors and average the point estimates obtained from each dataset, rather than contracting a single vendor sample. Further, when contracting multiple vendors, allocating a larger share of the total sample to one particular vendor (at the cost of allocating smaller sample shares to the other vendors) will usually not result in an improved RRMSE, as we do not know in advance which vendor sample will result in the lowest estimation error (i.e., cost is not a reliable indicator of quality). There would always be a risk that one’s preference for a particular vendor would harm the accuracy of the estimated model. As increasing the sample size of a non-probability sample does not automatically result in greater power (Meng 2018), preferring vendors that can provide more observations at a given cost is similarly an unviable strategy. Also, since we lack a concept to estimate sampling variances under a non-probability sampling design (within our framework) it is difficult to assess how different sample sizes of the non-probability sample would affect the standard error of estimates based on them. Thus is would also not be possible to put some preference on a particular vendor based on design effect, for example.
In conclusion, this study finds significant variability in the errors produced by different non-probability sample vendors. Not only did the errors vary across samples, but also across substantive outcomes—a vendor sample that performed very well for estimating one outcome often performed worse for other outcomes. This context-dependent performance is consistent with differing selection effects for each vendor, and is also consistent with our hypothesis of informative sampling, as stated in Subsection 2.1. Simply averaging point estimates derived from multiple vendor samples is beneficial as it will always hedge against the risk of a worst-case scenario with regard to prediction or estimation accuracy, provided we have no additional information suggesting that one vendor is likely to perform better than another. However, we showed that substantial improvements in accuracy can be achieved by selecting and averaging an optimally-chosen subset of vendors for a given model of interest. It is also clear that some vendors produce samples with redundant (common) errors, while others exhibit beneficially different errors. An alternative to averaging could be the pooling of different vendor samples for estimation, however the problem of selecting and/or weighting the different non-probability samples would remain the same. In addition, unequal sample sizes of the non-probability samples would add the additional problem of having to decide how many and which elements from each non-probability sample should be used in the estimation.
This suggests serious shortcomings with non-probability samples, as their compositions seem to differ dramatically from each other. In the absence of further methodological developments (such as indicators of vendor quality), probability samples should be preferred whenever possible.
Supplemental Material
sj-docx-1-jof-10.1177_0282423X241312775 – Supplemental material for Averaging Non-Probability Online Surveys to Avoid Maximal Estimation Error
Supplemental material, sj-docx-1-jof-10.1177_0282423X241312775 for Averaging Non-Probability Online Surveys to Avoid Maximal Estimation Error by Alexander Murray-Watters, Stefan Zins, Joseph W. Sakshaug and Carina Cornesse in Journal of Official Statistics
Footnotes
Acknowledgements
The authors gratefully acknowledge the support of the SFB 884, in particular projects A8 and Z1.
Funding
The author(s) disclosed receipt of the following financial support for the research, authorship, and/or publication of this article: This paper used data from the German Internet Panel (GIP; wave 16). At the time of data collection the GIP was funded by the German Research Foundation (Deutsche Forschungsgemeinschaft, DFG) through the Collaborative Research Center (SFB) 884 “Political Economy of Reforms” (SFB 884, Project-ID 139943784).
Supplemental Material
Supplemental material for this article is available online.
Received: June 30, 2023
Accepted: December 19, 2024
References
Supplementary Material
Please find the following supplemental material available below.
For Open Access articles published under a Creative Commons License, all supplemental material carries the same license as the article it is associated with.
For non-Open Access articles published, all supplemental material carries a non-exclusive license, and permission requests for re-use of supplemental material or any part of supplemental material shall be sent directly to the copyright owner as specified in the copyright notice associated with the article.