
Abstract
This paper proposes a methodology to obtain estimates in small domains when the target is a composite indicator. These indicators are of utmost importance for studying multidimensional phenomena, but little research has been done on how to obtain estimates of these indicators under the small area context. Composite indicators are particularly complex for this purpose since their construction requires different data sources, aggregation procedures, and weighting which makes challenging not only the estimation for small domains but also obtaining uncertainty measures. As case study of our proposal, we estimate the incidence of multidimensional poverty at the municipality level in Colombia by incorporating innovative data sources such as geospatial data. Furthermore, we provide uncertainty measures based on a parametric bootstrap algorithm.
Keywords
1. Introduction
Official statistics are a useful tool for decision-makers, as they provide information on the characteristics of a country’s population and allow them to apply and monitor public policies aimed at specific population groups. Composite indicators are commonly used to summarize complex phenomena that consider two or more dimensions. These types of indicators are implemented in different areas, for example, social science: Human Development Index (HDI; United Nations Development Programme, 2023b), Gender Development Index (United Nations Development Programme 2023a), Multidimensional Poverty Index (United Nations Development Programme 2023c), Corruption Perceptions Index (Transparency International 2023), environment: Environmental Performance Index (Wolf et al. 2022), economy: Composite of Leading Indicators (OECD 2023).
A composite indicator facilitates a joint analysis of relevant aspects, allowing for a more comprehensive understanding of complex phenomena, enables better communication of the results, and facilitates decision-making (CEPAL 2013).
Besides their advantages for public policy, the construction and use of composite indicators should be handled carefully. For example, the application of different weighting and aggregation methods could lead to misleading results, and the quality of the different data sources used for their construction should be evaluated (Freudenberg 2003).
Among the challenges in the construction of composite indicators and their applicability is the disaggregation. The demand for disaggregated information is quickly increasing, since it is essential to develop and implement strategies to improve the quality of life of the inhabitants of a country, on issues such as employment, poverty, education, and health. A recent case that properly illustrates this need are the Sustainable Development Goals, which seek to provide information disaggregated by different relevant characteristics of the population (United Nations General Assembly 2015).
Small area estimation (SAE) has been proposed as a solution to the dissaggregation problem. SAE methods have the goal of producing accurate estimates in small domains with adequate precision, by combining two or more sources of information. Most of these methodologies, usually supported by unit or area-level regression models, provide efficiency gains if the correlation between existing auxiliary information and the survey data is sufficient (Pfeffermann 2013; Pratesi 2016; Rao and Molina 2015; Tzavidis et al. 2018). However, to the best of our knowledge, no literature has been produced on obtaining quality estimates of composite indicators within the small area context. The literature related to this subject is mainly focused on dimensionality reduction for latent indicators such as economic well-being (see e.g., Moretti et al. (2020, 2021)).
Although the construction of composite indicators requires some standard steps (Joint Research Centre of the European Commission and OECD 2008), we focus only on the estimation of indicators that are already defined well as their weights. That means we do not deal with dimensionality reduction, normalization, aggregation, and weighting aspects.
Composite indicators can aggregate the information in different ways. One option is to first aggregate at the population level and then combine dimensions. An example for this is the Human Development Index, which is based on summary indicators for the country. A second option is to first aggregate across dimensions and then across individuals. This is the case of indices such as the Unmet Basic Needs index or the Multidimensional Poverty Index Alkire and Foster (2007). Here we present a proposal for a composite indicator of the latter type, which first aggregates indicators defined as dichotomous variables at the individual level.
To illustrate our proposal, we use the incidence of multidimensional poverty. The index is based on the Alkire and Foster (2007) methodology, which identifies deprivations for each relevant dimension of well-being and then aggregates them at the household level. The main difference is that the index presented here corresponds only to the incidence, which is a component of the Multidimensional Poverty Index. The incidence of multidimensional poverty that we define here is only for illustration purposes.
The components of a multidimensional poverty index are usually estimated using data from household surveys. These instruments usually collect information on many different dimensions of well-being at the household level, which is required by the Alkire and Santos (2010) method and other approaches that consider simultaneous. Surveys in Latin America have also the benefits of being frequently updated (on a yearly basis in most countries) and having nationally representative samples.
One shortcoming of household surveys is their limited ability for disaggregation for specific groups of population and geographical areas. In addition to the poverty rate at the national level, it is desirable to identify which groups of the population are more afflicted by poverty and what is the relative contribution of each particular deprivation to their poverty level, so as to provide useful information for the implementation of public policies.
Data sources such as administrative records and population censuses are better suited for attaining higher levels of disaggregation, but they face their own particular limitations. In Latin American countries, administrative records are usually not accessible at the individual level, do not have the necessary quality to produce reliable statistics, or do not provide information on different deprivations for the same individuals. On the other hand, population censuses are usually produced only every ten years and they collect information on a restricted set of variables, that do not allow the calculation of a complete multidimensional poverty index.
The objective of this paper is to provide a methodology to produce disaggregated estimations at the municipal level of the incidence of a multidimensional poverty index using small-area methods, taking Colombia as a case study. To that end, model-based estimation methods are applied to integrate data from the survey with the population census. The methodology aims to preserve the information of each deprivation indicator so that the final index (incidence of multidimensional poverty) can be decomposed by dimension. As an uncertainty measure, the mean squared error (MSE) is derived via parametric bootstrap.
The structure of the paper is as follows: the proposal to obtain small area estimates for composite indicators is explained in Section 2, as well as the procedure to obtain MSE estimates for the corresponding point estimates. We present a case study to show the implementation of our proposal in Section 3 as well as a simulation exercise to validate our proposal. Conclusions and further research are presented in Section 4.
2. Incidence of Multidimensional Poverty: A Methodology for Small Area Estimation
Unlike other problems in SAE, getting a final indicator at the domain level (e.g., a total or mean) is not useful in this case. Because of its nature, the computation of the incidence of multidimensional poverty requires information on each individual for each of the indicators. That means, the challenge is to first estimate the status of deprivation (deprived or not deprived) for each indicator across all persons in the census.
In general, the type of data required by the various composite indicators may differ. Some indicators are constructed from numerical variables, for example, life expectancy, income, or years of schooling. In this paper, we focus on presenting a proposal to obtain small area estimates for a composite indicator consisting only of dichotomous variables.
In this section, we first explain the example that we use in our case study: the incidence of multidimensional poverty. Next, we introduce small area estimation methods for binary response variables (indicators). Then, we present our proposals where more than one indicators are missing in the census. Finally, we also describe how we address the problem of finding an uncertainty measure for this scenario.
2.1. The Incidence of Multidimensional Poverty
National statistical surveys often are not suitable to provide reliable socio-demographic estimates under small sample sizes at domain levels due to high costs. SAE procedures are estimation methodologies for obtaining such highly disaggregated target information under small sample sizes. Their basic principle is to improve classical procedures by combining survey and register data through a desired model.
In this paper, we focus on composite indicators that are constructed from dichotomous variables. For this reason we selected as example the incidence of multidimensional poverty, since it is a well-known indicator (Joint Research Centre of the European Commission and OECD 2008; Moretti et al. 2020). One particularity of Alkire and Foster (2007) methodology where the Global Multidimensional Poverty Index is presented, is that each country can define its own set of indicators and dimensions based on its own necessities. Regardless of their specification, multidimensional poverty indexes share the same characteristic: indicators explaining deprivations are grouped in within dimensions. Dimensions correspond to the relevant components of well-being that are related to the notion of poverty. The measurement of each dimension is operationalized through specific indicators, selected based on the information that is available, usually in household surveys. For each indicator, a deprivation cut-off is used to determine whether a person is to be considered deprived.
Let us assume an index with

where
The indicator function
Several models could be applied to obtain estimates of the final
2.2. Small Area Estimation for Binary Variables
In many applications the variable of interest in small areas is binary, for example,
Although other methods have been proposed for binary outcomes, for example, based on M-quantile modeling (Chambers et al. 2016), in this application we follow the traditional approach based on generalized linear mixed models. Under this scenario, the
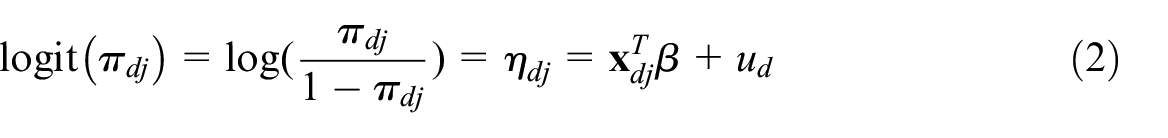
with
Since our specific problem is to find deprivations (0, 1) for several indicators, we use this unit-level Bernoulli logit mixed model as the starting point. Derivations of different algorithms to fit the unit-level logit mixed model can be found in Morales et al. (2021), namely: method of simulated moments (MSM), expectation-maximization (EM) algorithm, penalized quasi-likelihood (PQL) algorithm (González-Manteiga et al. 2007), or maximum likelihood Laplace (ML—Laplace) approximation algorithm which is described in Morales et al. (2021). For ease, we implement the latest algorithm as it is available in the R lme4 package.
The goal of obtaining quality estimates in small domains can be jeopardized when several of these domains are not in the sample or the sample size is not enough to produce reliable results. An empirical best predictor (EBP) can be defined for this purpose (Jiang 2003; Jiang and Lahiri 2001).
The EBP for quantities of interests such as probabilities, sums of probabilities, and proportions by domains can be approximated using Monte Carlo simulation (Hobza and Morales 2016). In practice, this option is usually avoided since it does not have a closed form requiring numerical approximation for its computation (Chambers et al. 2016). As a solution, the plug-in predictor of
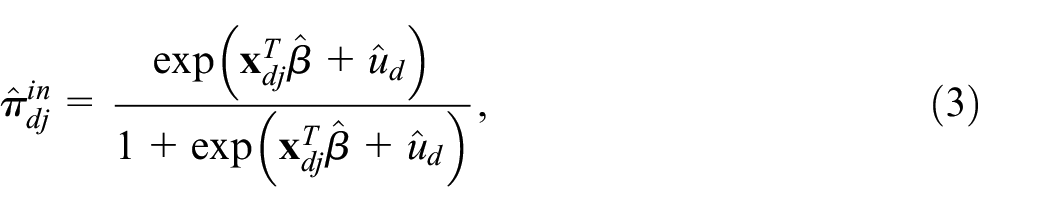
which would allow obtaining the plug-in predictor of
where
2.3. Point Estimation for the H Predictor
Let
Use the sample data to fit a unit-level Bernoulli logit mixed model for each indicator and estimate
For
For each individual in the census, predict the probability of obtaining the value 1 for the
Obtain Monte Carlo estimates
Compute the
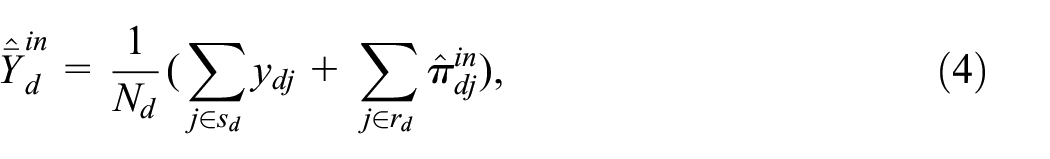
The final point estimate in each small area
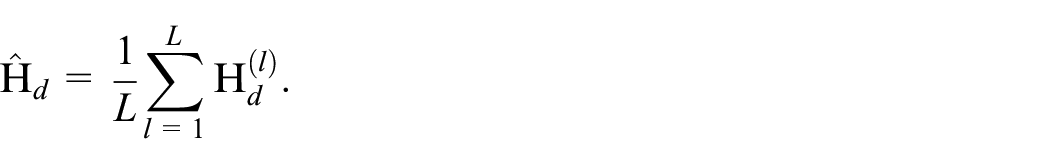
Note that under this proposal, the incidence of multidimensional poverty (H) can be estimated even if there are several missing indicators
For specific cases when only one or two indicators are missing, generating
2.4. Estimation of the MSE
The estimation of the mean squared error (MSE) as the accuracy measure when using small area estimators is a key step when estimating socio-demographic information. In case the variable of interest is binary, some approximations are available for obtaining the analytic form of the MSE. González-Manteiga et al. (2007) derived a small area robust bootstrap (SAWB) for the uncertainty estimation of an empirical predictor. Based on this bootstrap scheme, we present a modification that allows to consider that the target estimate, that is, the multidimensional poverty incidence, has several components or indicators and one or more of these indicators are estimated via SAE methods.
The steps of the proposed parametric bootstrap are as follows: For each missing indicator,
Using the already estimated
Simulate a bootstrap superpopulation for each indicator
Calculate the
Extract the bootstrap sample and obtain the

3. Case Study: Multidimensional Poverty Incidence for the Adult Population in Colombia
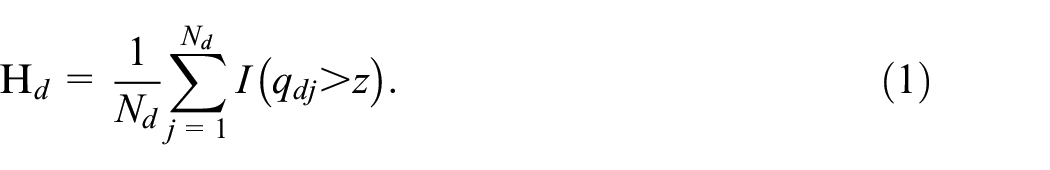
The case study presented in this paper uses an example of the incidence of a multidimensional poverty index (described in Equation (1)) across thirty-three primary administrative divisions, known as departments, and 1,122 secondary administrative divisions, known as municipalities. We use this index only for illustrative purposes. The composition of the index here presented (dimensions and indicators) is not the one defined by National Statistical Office of Colombia (in Spanish, Departamento Administrativo Nacional de Estadistica, DANE) or another international organization.
For this example, we use data from Colombia, as it has the latest available population and housing census from 2018 and a household survey from the same year. We chose these datasets for their validated reliability and stability compared to more recent data, which may be influenced by ongoing changes, such as those from the COVID-19 pandemic.
Table 1 describes the composition of the index that we use in this example. This index is based on previous research by UN-ECLAC on possible structures for a multidimensional poverty index that is comparable for Latin American countries, based on the availability of information from national household surveys (CEPAL 2014; Santos and Villatoro 2018). The index includes five dimensions (housing; water and sanitation; energy and connectivity; education; and employment and social protection) and
Composition of the Index, Availability of Indicators in the Colombian Census and Target Population.
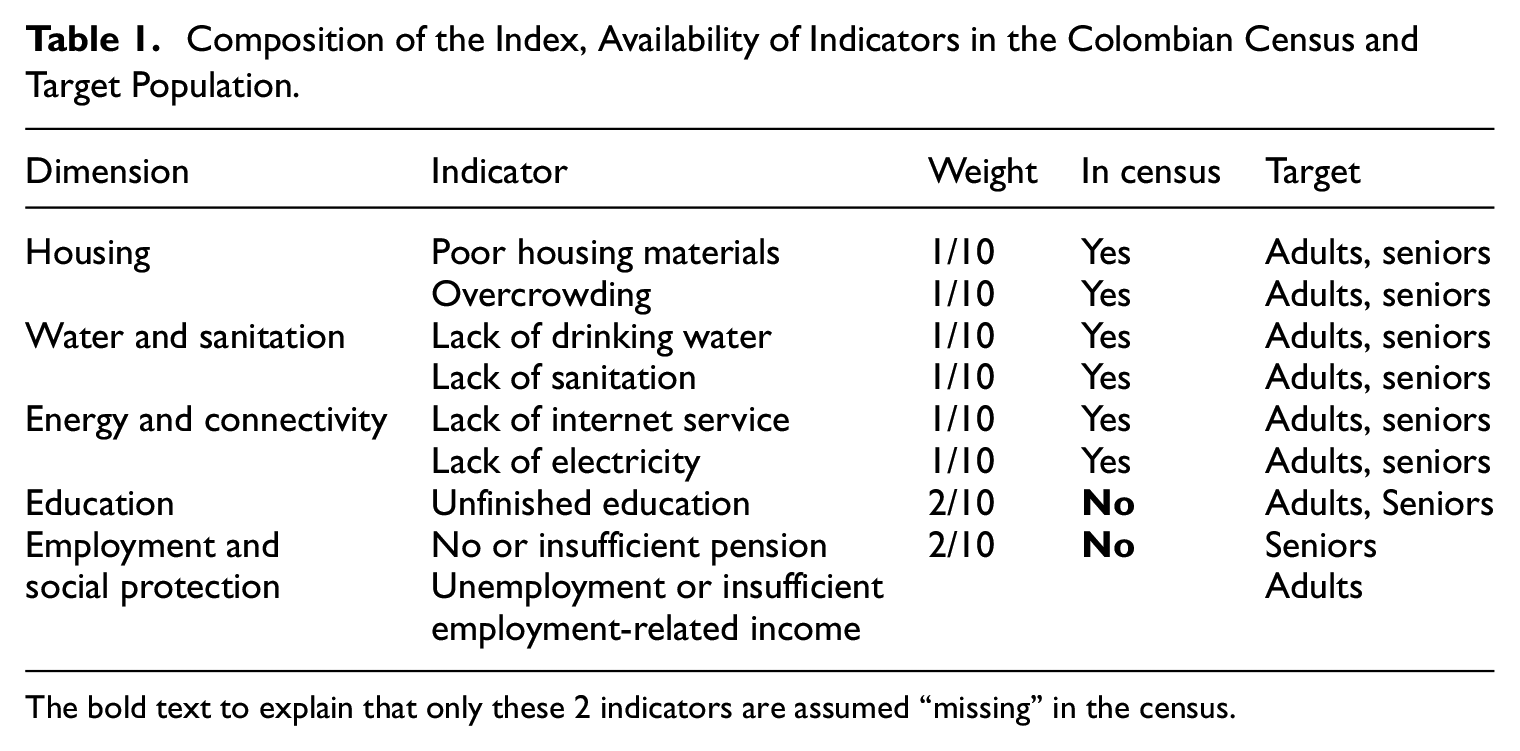
The bold text to explain that only these 2 indicators are assumed “missing” in the census.
Data available in censuses usually includes the required information for calculating this index, except in the case of the employment and social protection dimensions, which require data on individual income. For the purpose of this paper, it has been assumed that information on education is also not available in the census and thus has to be estimated through SAE methods.
We focus on the incidence of multidimensional poverty described in Equation (1). Here, we require
The index requires the information for each individual
The indicator function
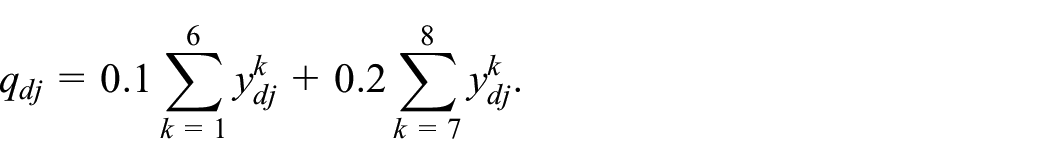
The first part of the sum includes the indicators for housing, water and sanitation, energy and connectivity dimensions. The second part, the indicators of education and employment and social protection dimensions. The latter are in fact the two missing indicators in the census and will be estimated with the methodology presented in Subsection 2.3.
Figure 1 shows the proportion of people who had deprivations in six of the eight indicators that make up H, that is, the incidence of multidimensional poverty. These maps were generated at the municipal level with information from the census. The maps of the two missing indicators were not generated since the census does not include the required information. In addition, the calculation of the H is not possible.
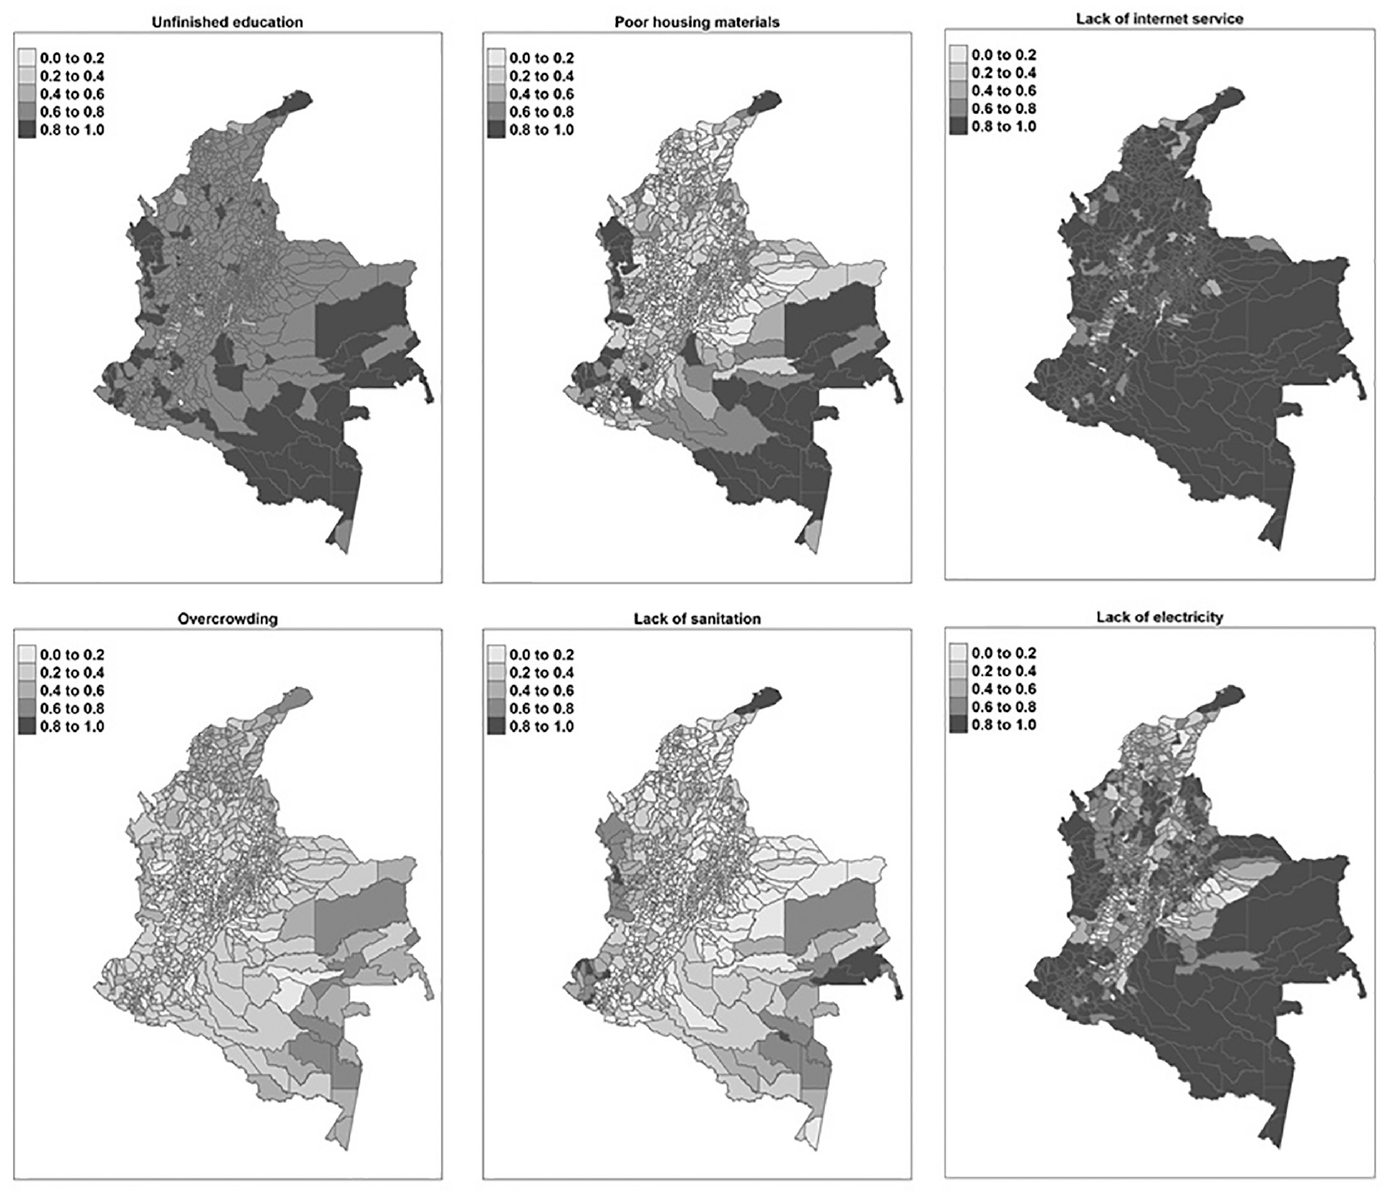
Indicators of the H available in the census at the municipal level.
3.1. Data Sources
3.1.1. Censo Nacional de Población y Vivienda (CNPV) 2018
The national population and housing census (in Spanish, Censo Nacional de Población y Vivienda, CNPV) is conducted by the DANE. Although it is planned to be every ten years, the last census was carried out three years later than planned due to administrative and economic reasons. For first time, the information was collected through electronic self-interviewing, in addition to the traditional face-to-face interview. The data collection phase took place in 2018 for ten months (DANE 2019).
The census aims at collecting demographic information on the Colombian population and its living conditions, including housing and household characteristics. This information is essential for territorial planning and decision-making in the country (DANE 2019). As aforementioned, this census has most of the single indicators that are required to compute the target index. The estimation based on the model described in Section 2 is applied for the indicators that are not available in the census. Among others, we include as predictors the available indicators belonging to the following dimensions: “housing,”“water and sanitation,” and “energy and connectivity.”
3.1.2. Gran Encuesta Integrada de Hogares (GEIH) 2018
The Great Integrated Household Survey (in Spanish, Gran Encuesta Integrada de Hogares, GEIH) is conducted annually by the DANE. It provides information on the size and structure of the labor force, as well as the sociodemographic characteristics of the population and households, in addition to housing, educational level, affiliation to social security, income, among others (DANE 2019). It is the official source of information for employment and income poverty indicators and includes the necessary variables to calculate the ECLAC multidimensional deprivation index. Administratively, Colombia is organized in 5 regions, 33 departments, and 1,122 municipalities; the GEIH provides representative information at the national level, urban and rural areas, regions, and 24 of the 33 departments. In 2018, the valid survey sample included 231,128 households and 762,753 individuals.
The version of the GEIH used in this paper comes from the Household Survey Data Bank (BADEHOG), a repository of household surveys from eighteen Latin American countries maintained by the ECLAC Statistics Division. In this repository, variables are harmonized to allow the construction of various indicators and their comparison across countries. This feature could simplify the estimation of the incidence of multidimensional poverty for the countries of the region.
3.1.3. Satellite Imagery
Geospatial data has become a powerful resource to improve quality in local-area estimations. Although big data, in general, has gained popularity for this purpose, geospatial data has two special advantages: it is easy to access and it is bias selection free (Masaki et al. 2020). Newhouse (2023) highlights the critical role and impact of integrating geospatial data with traditional surveys to enhance the accuracy and efficiency of poverty and wealth estimates at detailed spatial levels or small domains. Merfeld et al. (2024) points out that the inclusion of geospatial data could mitigate the limitations in terms of robustness of traditional surveys, such as limited sample sizes and high costs. By integrating satellite imagery, mobile phone data, and other geospatial information with traditional survey data, this approach allows for highly accurate and timely estimates of economic well-being. This integration enhances the precision and efficiency of small area estimates, specially in regions where traditional data collection methods are limited. For instance, The integration of diverse covariates could reduce mean squared errors, thereby producing more accurate and reliable estimates.
Satellite imagery as auxiliary source of information has been implemented in several small area estimation problems in topics such as well-being (Engstrom et al. 2022), population density (Deng and Wu 2013; Harvey 2002; Steinnocher et al. 2019), poverty mapping (Babenko et al. 2017; Chandra et al. 2018), and multidimensional poverty (Betti et al. 2024; Koebe et al. 2022; Pokhriyal and Jacques 2017), among others.
For this case study, we make use of the resources available in the Earth Engine Data Catalog (Gorelick et al. 2017). Among many available products, we incorporate in our model area-level information on night light intensity, urban cover fraction, and crop cover fraction.
3.1.4. Predictors
Based on the auxiliary sources: The National Population and Housing Census of Colombia 2018 and Satellite Imagery, described in Subsections 3.1.1 and 3.1.3 respectively, we listed the specific predictors used in our models. It is relevant to mention that these predictors were carefully selected based on expert opinions and statistical diagnostics.
From census:
- Poor housing materials
- Overcrowding
- Lack of drinking water
- Lack of sanitation
- Lack of internet service
- Lack of electricity
- Group of age of the head of the household
- Area (urban/rural)
- Department
- Sex of the head of the household
From Satellite Imagery:
- Intensity of nighttime lights
- Distance to cultivated areas (crops)
- Urbanization (human settlements)
3.2. Results and Evaluation
In this Section, we present the main results of applying the proposed methodology to obtain estimates of the multidimensional poverty incidence described in Subsection 2.1 in departments and municipalities of Colombia.
The distribution of sample and population sizes for the domains of interest is presented in Table 2. The census size is
Distribution of the Sample and Census Sizes Across Departments and Municipalities.
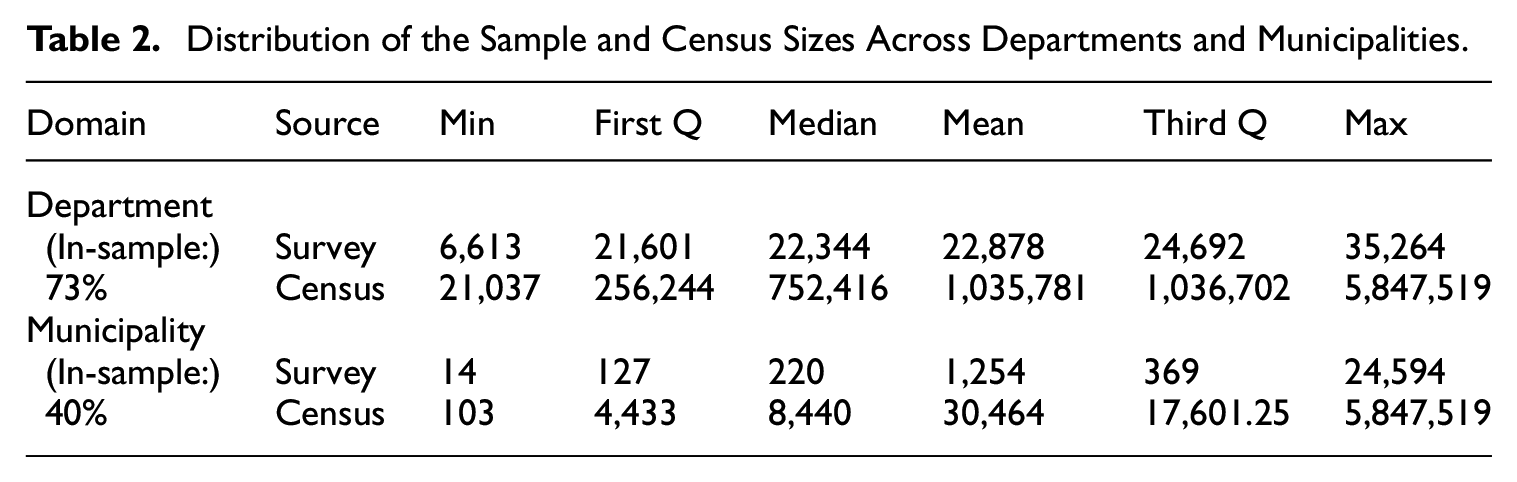
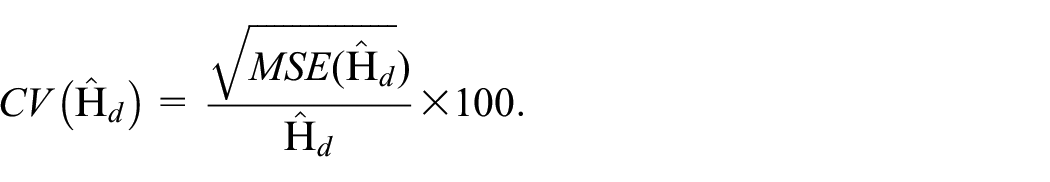
As can be seen in Table 2, although the sample size is not necessarily small for all domains, the aim is to improve the precision of this estimate, as well as to provide quality information in the domains that were not included in the sample. We analyze the accuracy of the estimates based on the coefficients of variations, defined as
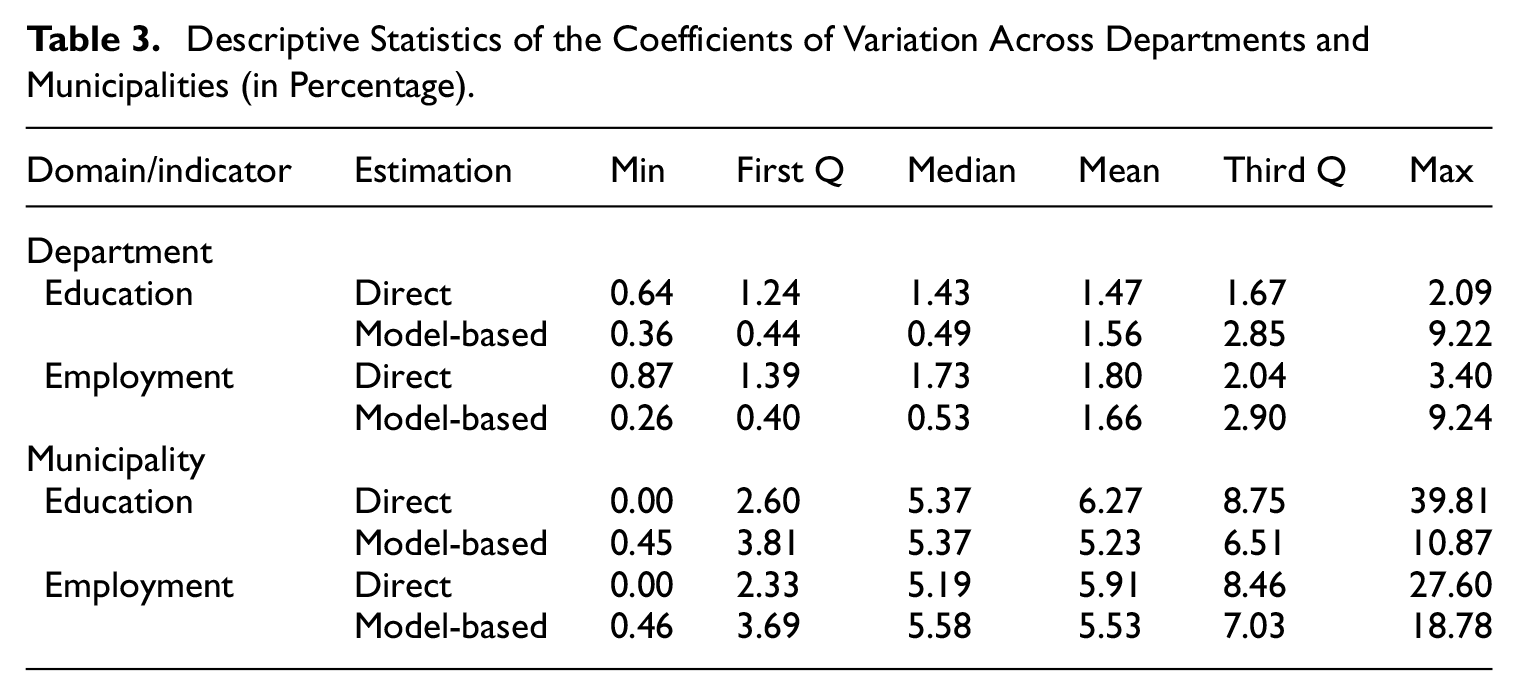
Summary statistics of the CVs from the direct and model-based estimates are presented in Table 3. Here, the CVs are also disaggregated by domain level (department and municipality), and for each missing indicator (education and employment). At the department level, the CVs are relatively small for both indicators and for direct and model-based estimates. The uncertainty provided by the out-of-sample departments can explain the higher values for the model-based estimates. The benefit of using SAE methods is most apparent in municipalities since the average CVs are similar to the direct estimates but the third quartile and the maximum value are lower than the direct estimates. This behavior is observed for both indicators, education, and employment.
Descriptive Statistics of the Coefficients of Variation Across Departments and Municipalities (in Percentage).
The stable and low CVs that the model-based estimates provide, can be clearly observed in Figure 2) for the in-sample municipalities.
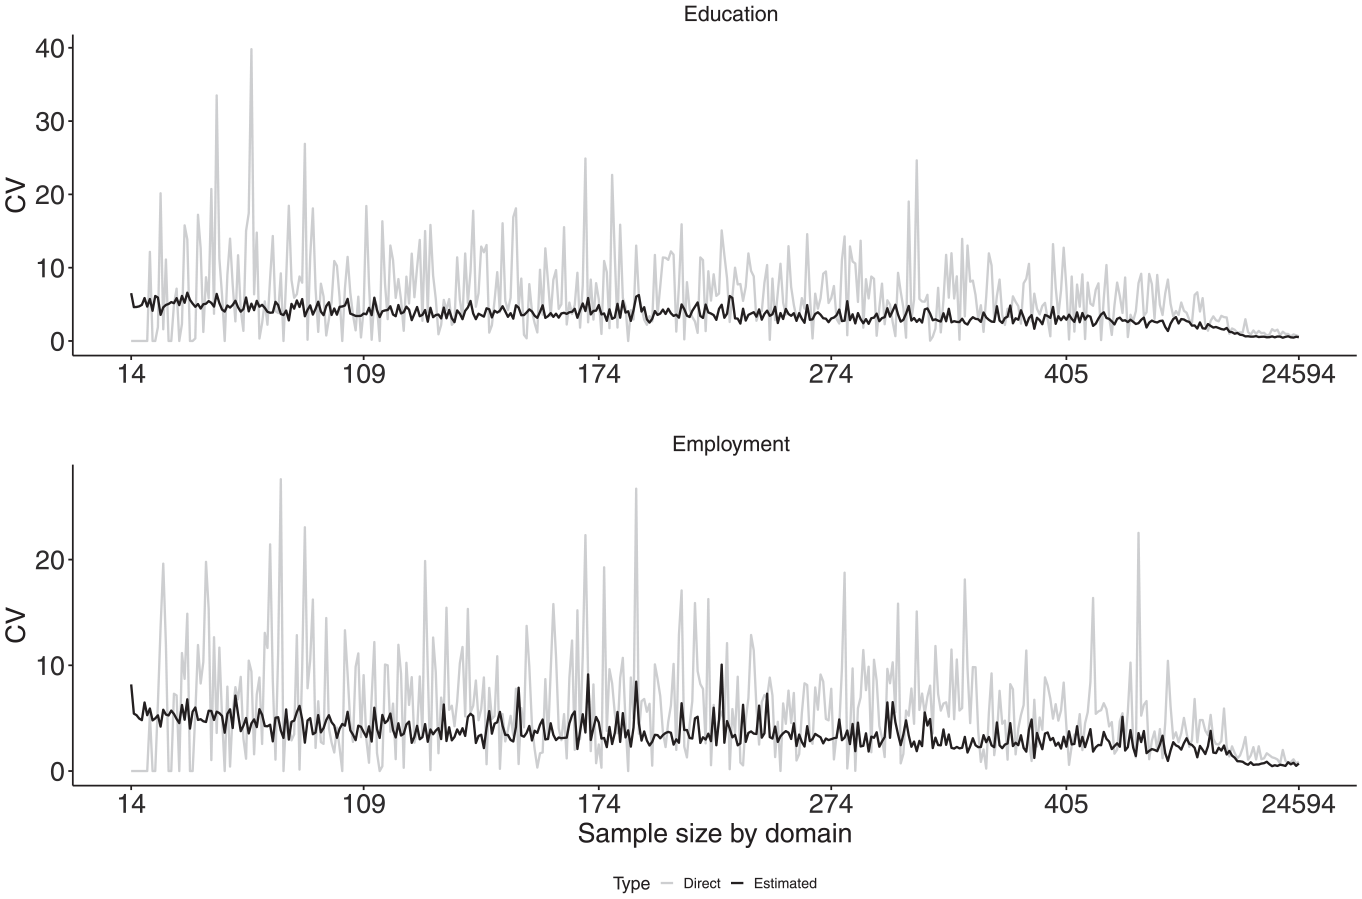
Coefficients of variation (in percentage) of the direct and model-based estimates at the department and municipality level for the indicators employment and education ordered by sample size.
Since we observed that the CVs from direct estimates are acceptable for both indicators, the main benefit of applying the small area estimation method that we propose is to obtain reliable estimates for the out-of-sample domains: 9 departments and 684 municipalities, in order to provide the proportion of the population of interest under multidimensional poverty for all domains of interested. The results are showed in Figures 3 to 5.
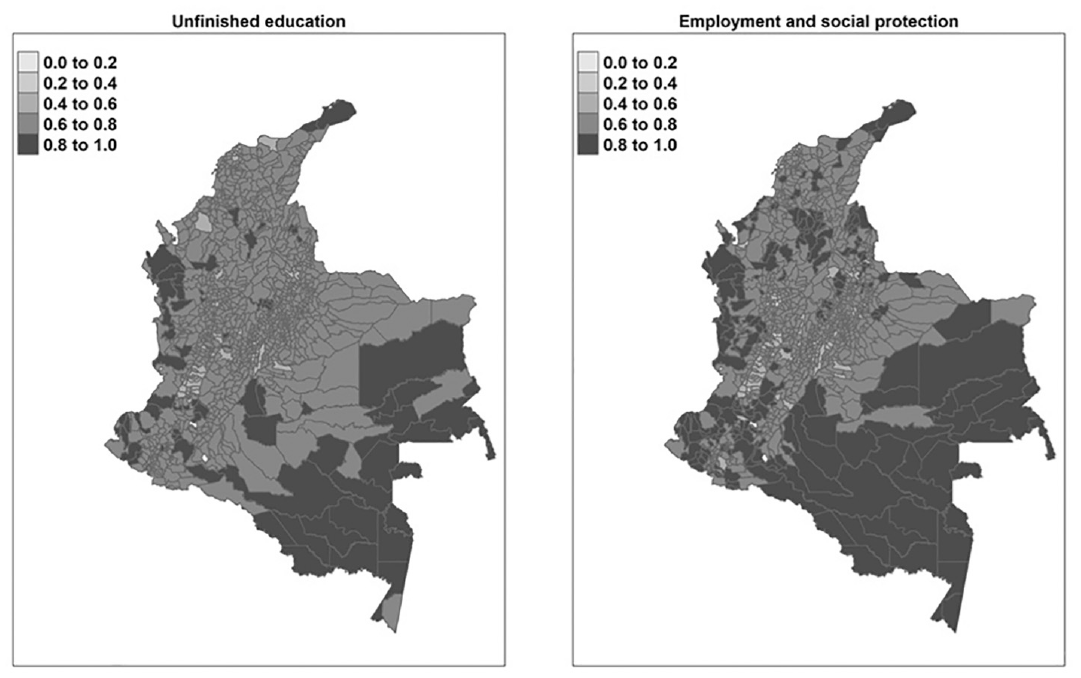
Model-based estimates for the indicators of employment and social protection and unfinished education at the municipality level.
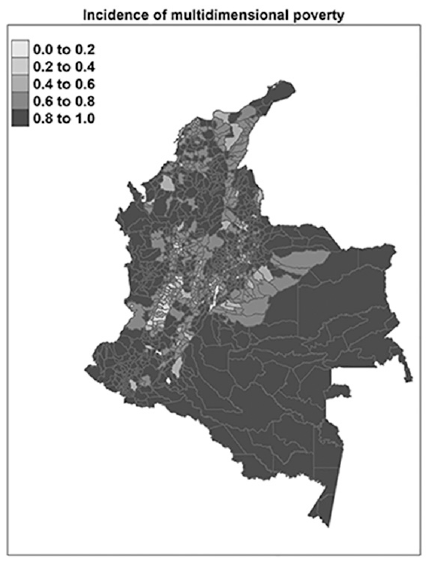
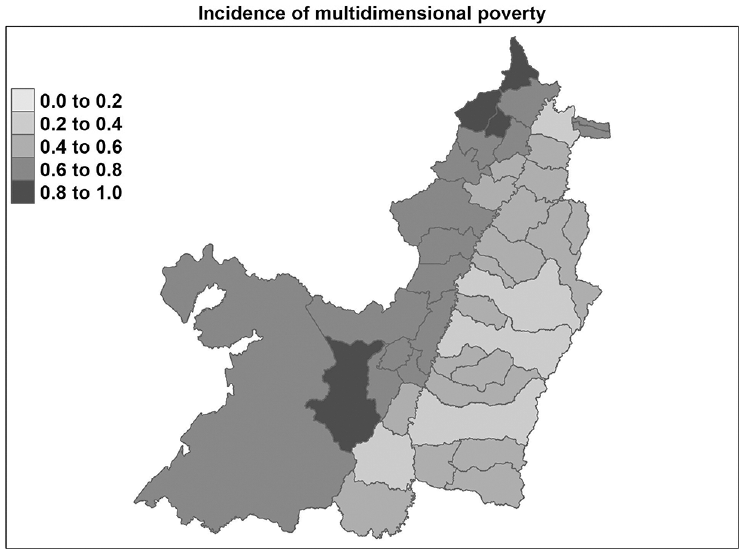
Final H at the municipality level.
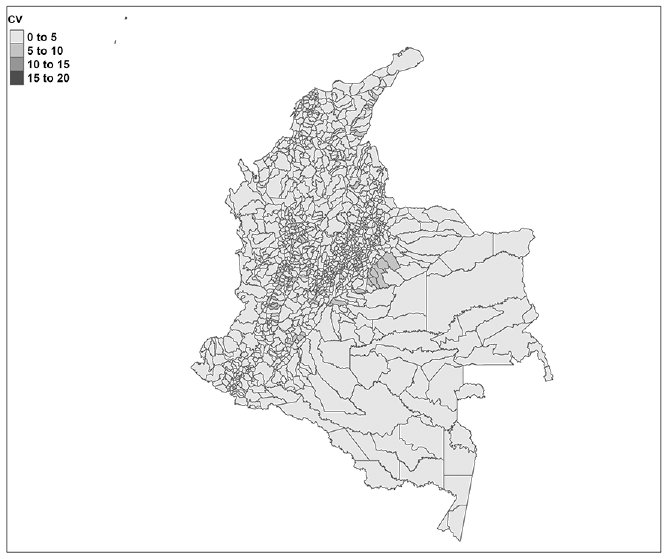
Coefficients of variation of the H at the municipality level.
Figure 3 presents the two indicators at municipality level that were not available in the census data and required the use of SAE methods to obtain these estimates.
In general, Colombia is a country with diverse regions, each with its own unique set of economic and social challenges. As shown in Figure 3, one of the regions that requires special attention is the Amazon region, which encompasses departments such as Guainía, Vaupés, and Guaviare, as well as other departments such as Chocó, Guajira, and Sucre. These departments are characterized by high levels of poverty, low levels of education and employment, and limited access to basic services such as housing, water, and sanitation. In particular, education is a critical determinant of an individual’s well-being and standard of living. Despite the recent progress made in increasing access to education in those departments, they tend to have lower enrollment rates and lower levels of educational attainment, resulting in many children not having access to quality education and facing a greater risk of poverty and exclusion from the formal economy. Employment and social protection is the second key indicator of poverty and well-being that was estimated. Even the unemployment rate in Colombia has decreased in recent years, there are still disparities in employment across the country. The departments mentioned above tend to have higher unemployment rates and a larger informal sector, resulting in many people being unable to find formal employment and facing a greater risk of poverty and exclusion from the formal economy. In some departments, such as Bogotá, there are higher levels of formal employment and educational attainment with a significant portion of the population working in the formal sector and having completed tertiary education.
With these two indicators, now it is possible to compute the final H, the result is shown in Figure 4 for municipalities of Colombia. The CVs of the final H are below 15% (Figure 5), indicating that the estimates are “acceptable” in terms of precision.
The estimates obtained with the proposed methodology allow deeper analysis from two points of view: What are the most severe deprivations and what are the most affected areas in general? We take the department Valle del Cauca as an example, which is one of the departments with the lowest levels of the H (Figure 4: middle-west of the country with an MDI of 38.5%).
Valle del Cauca has a low proportion of the adult population with deprivations in housing, overcrowding, drinking water, sanitation, and electricity (between 0% and 20%), and intermediate values (40%–60%) in internet service, education and employment, and health insurance (see Figure 6). Furthermore, when we take a look at the general H, it is possible to see that there are strong differences between municipalities in this department. Figure 7 shows that the municipalities El Águila and Dagua have high levels of of H (92% and 82% respectively), while other areas such as Cali and Tulua have relatively low values (30% and 39%). It is important to note that there are still significant disparities in poverty incidence across municipalities within the department. This underscores the need for targeted interventions to address these challenges and reduce multidimensional poverty in the department.
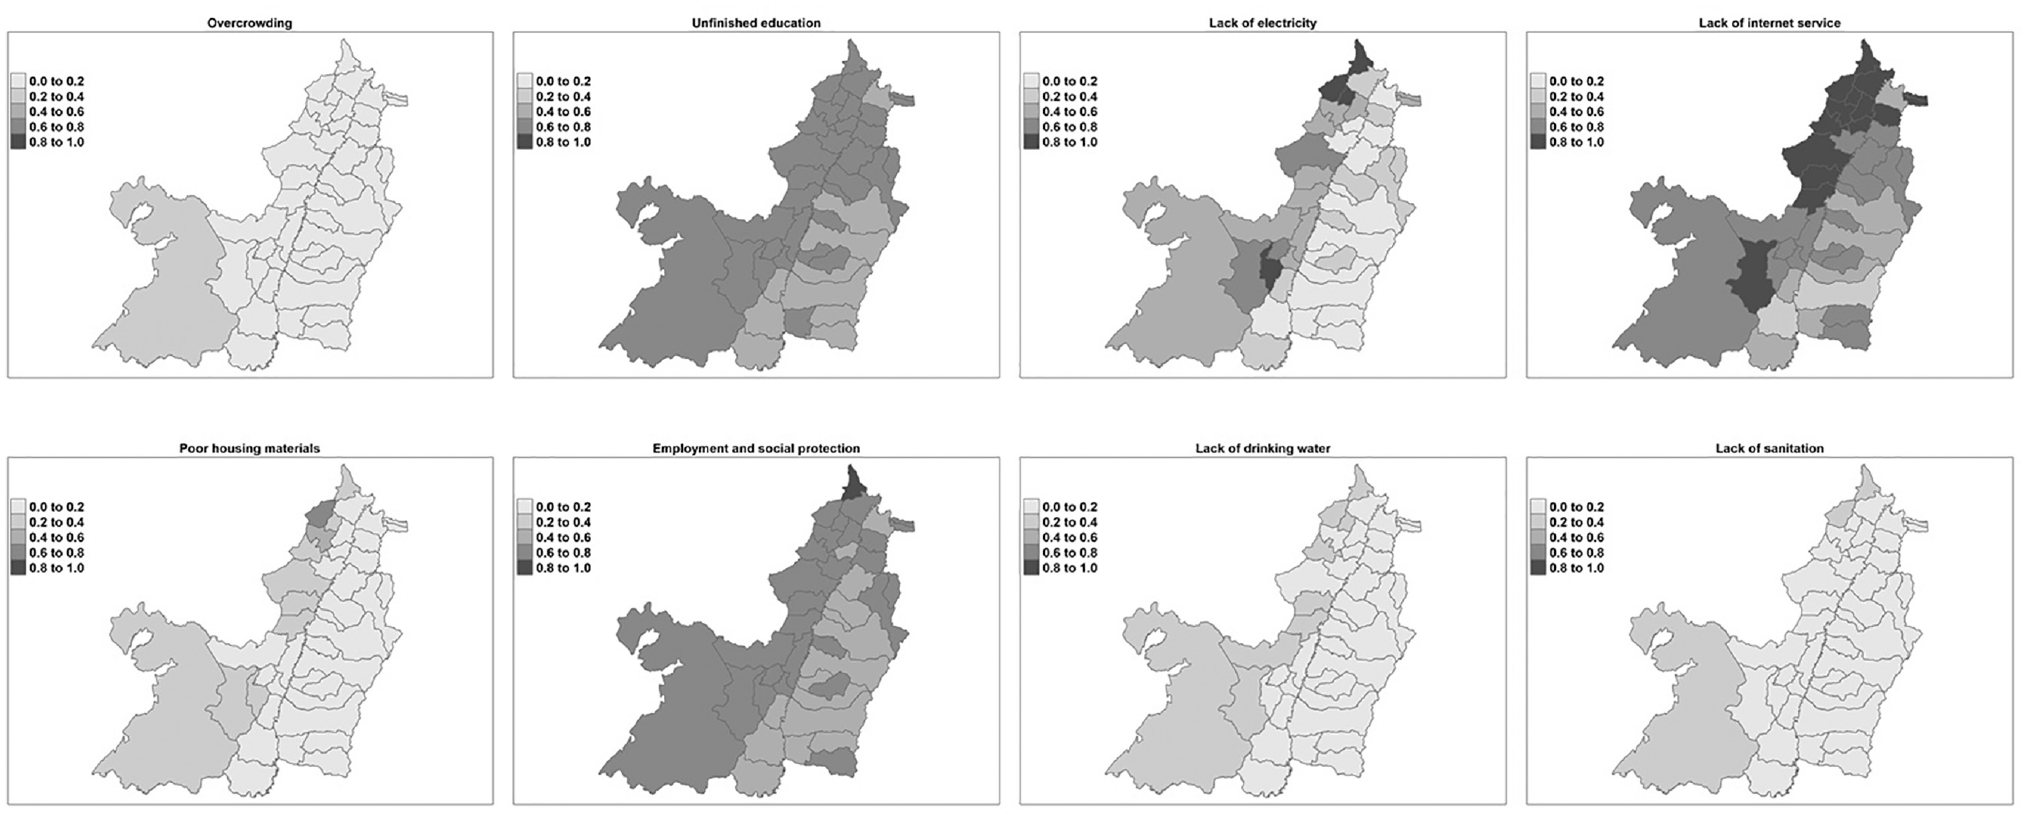
Valle del Cauca: indicator of the H at the municipality level.
Valle del Cauca: final H at the municipality level.
3.2.1. Evaluation
The evaluation of the proposed method is twofold. First, an internal comparison between the direct and the model-based estimates is presented. Second, a design-based simulation study is described to evaluate the performance of the estimator proposed in Subsection 2.2.
Direct and model-based estimates of in sample domains are compared in Figure 8. As expected, for both cases, at the department and municipality level, the point estimates produced with the proposed method are very close to the direct estimates, with a Pearson correlation of .984 and .880 respectively.
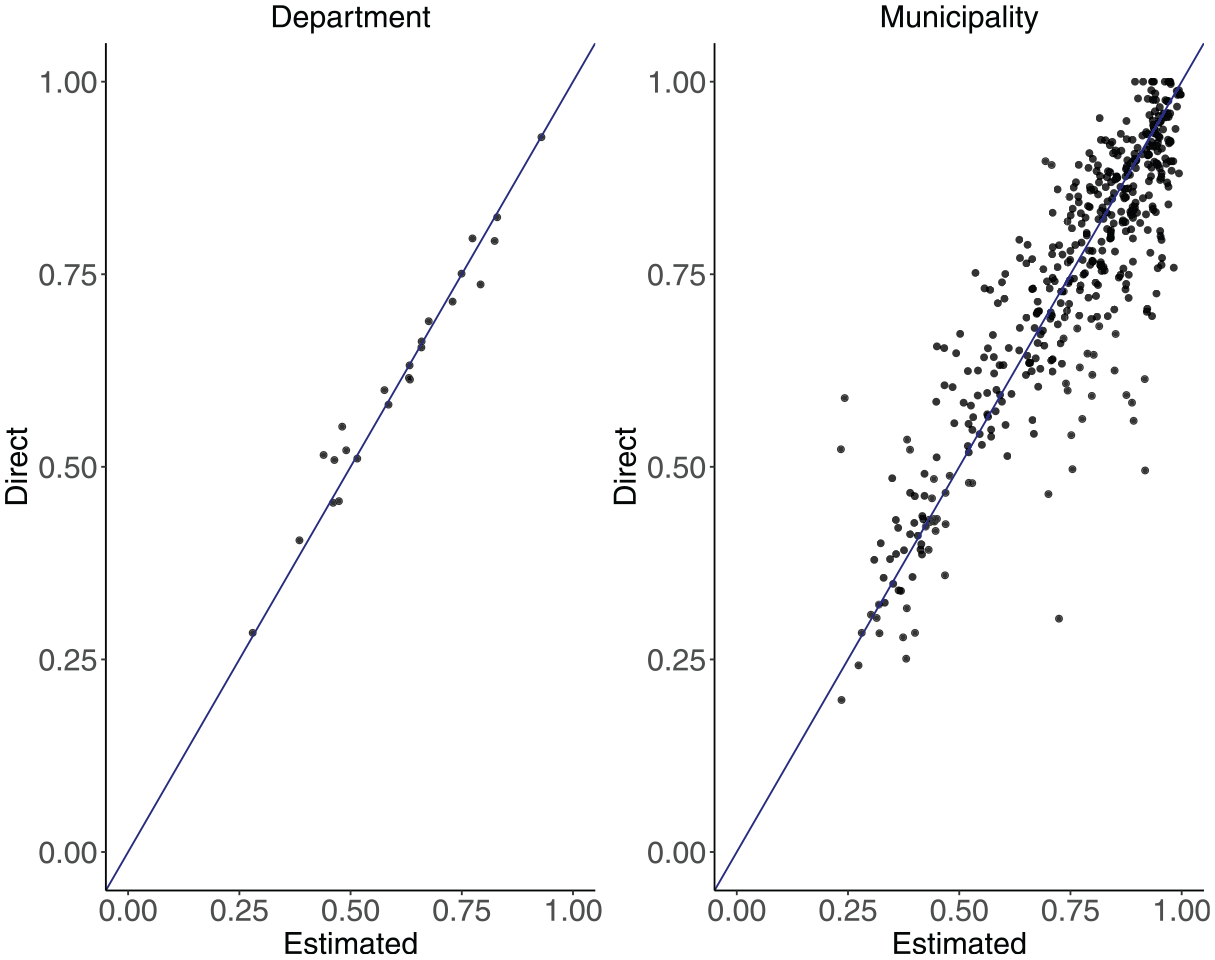
Comparison between the direct and model-based estimates of the H at department and municipality level.
The performance of the estimator proposed in Subsection 2.2 is evaluated with a design-based simulation experiment.
To make the evaluation on a realistic case, we use the National population and housing census of Colombia 2018 as a fixed population and repeated samples are taken from it under a simple random sampling design with different sample sizes: (a) 500, (b) 5,000, (c) 50,000 observations. A final scenario (d) is performed considering a complex sampling design with 550,000 observations, as in the original case study. The complex design mirrors the characteristics Great Integrated Household Survey (GEIH) of Colombia 2018 described in Subsection 3.1.
Similarly as in the application, the target indicator is the multidimensional poverty index for small domains of Colombia (i.e., departments and municipalities). There are six of eight variables already available in the population data, which will be held as fixed. Two variables will be obtained following the methodology explained in Subsection 2.1. The performance of the small area predictors is evaluated with the coefficient of variation (previously described), the bias, and the root mean squared error for each domain. The last two measures are defined as:
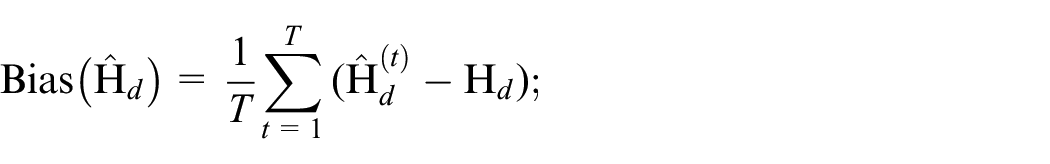

where
Figure 9 reports the distributions of the domain-specific bias, RMSE and CVs over domains for the evaluated estimator. As expected, increasing the sample size reduces the bias and increases the accuracy. This is clear for the “complex” case, which has a larger sample size than the other three scenarios.
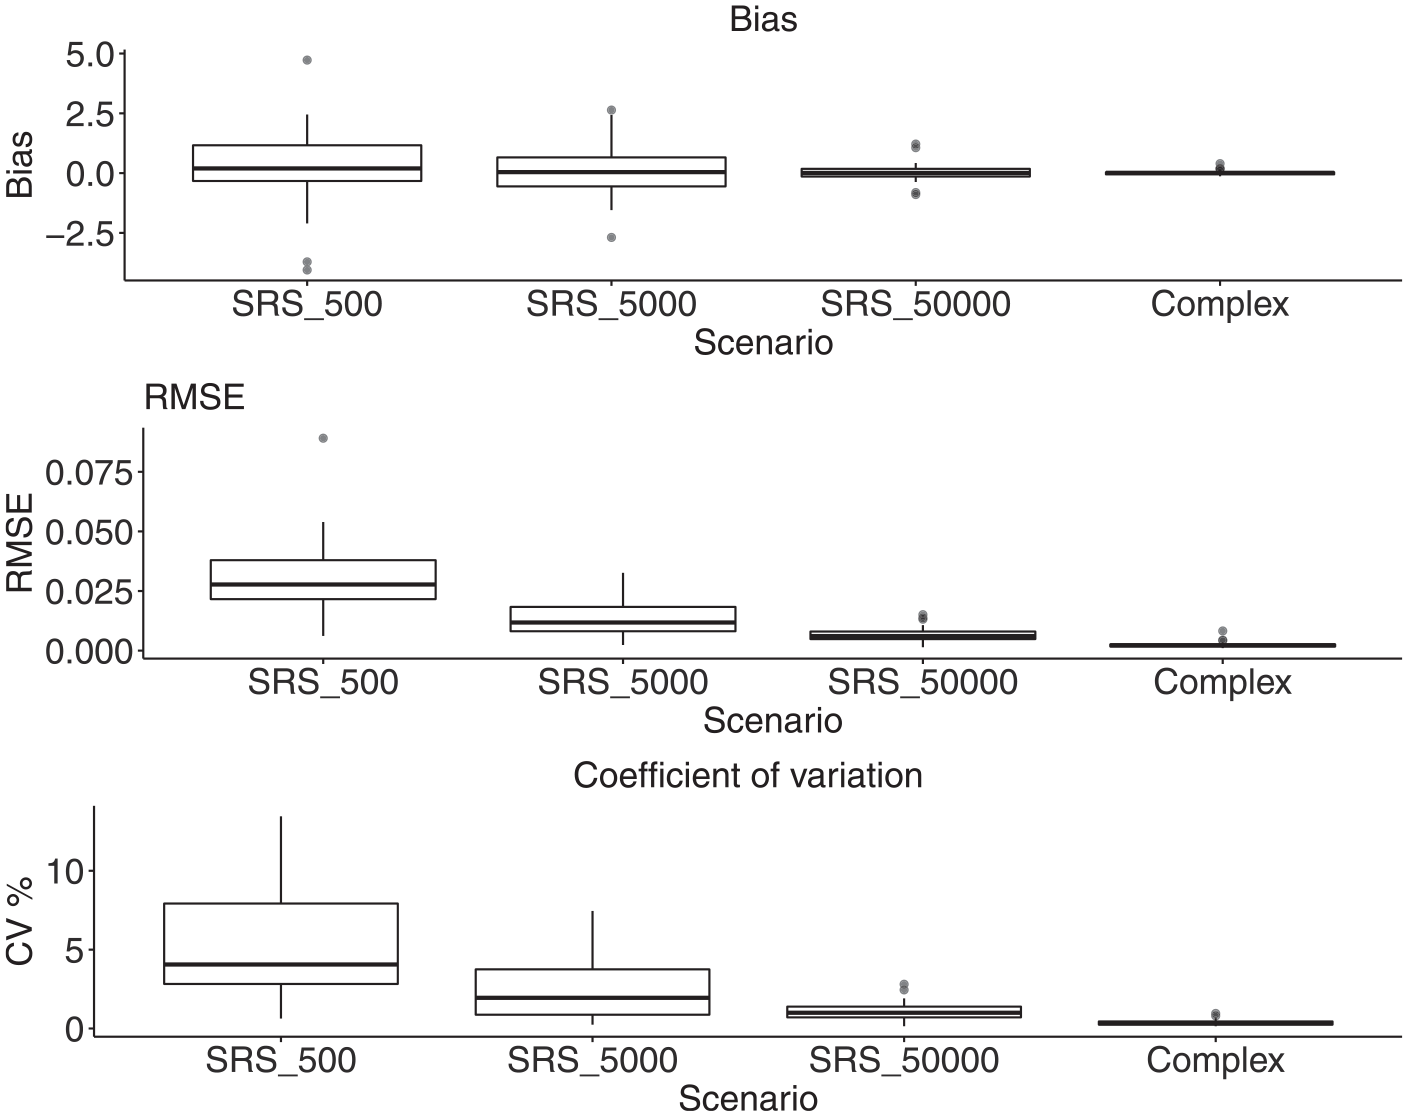
Performance measures of the area-specific point estimates for the multidimensional poverty incidence under different sample sizes and sampling designs.
4. Concluding Remarks and Further Research
Composite indicators are of great value in the study of complex phenomena and are widely used for public policies. Given the growing need for disaggregated information, there is a challenge to increase the level of disaggregation of these types of indicators. Small area estimation methods address this problem, although there is no literature for the specific case of composite indicators. This paper aims to reduce this lack of information by proposing a methodology to obtain small area estimates when the indicator of interest is composed of dichotomous variables. We exemplify our approach with the incidence of multidimensional poverty (H).
The challenge of producing small area estimates when working with composite indicators, such as the H, raises many questions that require further investigation. First, a more general approach that includes the analysis of covariance structures and dependencies among indicators and dimensions might be considered. For example, study the possibility of including correlated random effects. In this case study, exactly two indicators were estimated under the assumption that no dependencies between them (and other indicators) exist. Second, the time gap between the sources of information (e.g., census and survey data) is another strain of research. Especially, if some of the indicators are available in census data and others would be estimated using up-to-date survey data. Third, regarding the point and MSE estimation, a model-based simulation could help to validate the proposed methodology. Fourth, benchmark procedures might be further investigated for correcting possible inconsistencies between the different estimates (e.g., coming from the effects of sampling and non-sampling errors). Last, but not least, the final H, which is obtained by applying SAE methods, aims to capture the complexity of poverty along multiple dimensions of well-being, housing, water and sanitation, energy and connectivity, education, and employment and social protection. However, the intra-household inequality and inequality within the poor population need to be captured in further research. Such measures, which can capture the big picture of poverty in a country at the most required disaggregated areas have become a critical underpinning for policy-relevant applications.
Further methods are needed to obtain small area estimates when the variables that make up the composite indicators are not dichotomous. A clear example is the Human Development Index (HDI) which is composed of life expectancy, years of education, and the Gini coefficient. This paper focuses on the estimation of one component of the global MPI. Further research is required to be able to compute the complete index, considering the intensity of poverty.
Footnotes
Appendix A
Appendix B
Funding
The author(s) disclosed receipt of the following financial support for the research, authorship, and/or publication of this article: Natalia Rojas-Perilla has received the research Start-up Grant from the United Arab Emirates University (UAEU).
Received: December 2023
Accepted: October 2024