
Abstract
From the perspective of factor input in the production process, this paper puts forward the issue of accounting and capitalization of generalized data output, brings the output of data reprocessing into the scope of statistical accounting, and proposes a systematic evolution chain of data factor forms and the division method of data factor value composition and sources. Then, based on the GDP accounting platform, a three-in-one theoretical framework covering “output-investment-assets” is built for capitalization accounting of data factor, and an accounting path covering “cost → input → output → capital formation → data assets” is designed to improve and highlight the cost accounting method with “value appreciation” as the core. Taking China as an example, its data capital formation and asset size are measured by matching data-intensive industries with data professionals, and by synthesizing data from multiple sources. The rationality and self-consistency of the theoretical and methodological research is verified by the empirical results. This study can provide theoretical reference for bringing the value accounting of data factor into the basic framework of the Systems of National Accounts (SNA). Moreover, its empirical research paradigm can also provide reference for relevant countries to carry out capitalization accounting for data factor (CADF).
Keywords
1. Introduction and Literature Review
The current international authoritative accounting text System of National Accounts 2008 (2008SNA), does not mention the method of data capitalization, and data is only involved in the appraisal principle of database fixed capital formation (United Nations et al. 2008). Affected by this, the value of data factor is obviously underestimated in existing GDP (Gross Domestic Product) statistics. For this reason, more and more scholars, international organizations, and statistical departments of national or regional governments have begun to pay attention to the issue of bringing the value accounting of data factor (VADF) into SNA, and think that capitalization accounting of data factor (CADF) is a feasible path. At present, the research on CADF has not formed a system yet, related theoretical research mainly focuses on the value measurement of data assets, and the methodological research and practical progress are mostly centered on data asset accounting.
The discussion on the connotation of data assets is mainly based on the concept of fixed assets. In addition to clear economic ownership and profitability, “being used repeatedly or continuously for more than one year in the production process” is a necessary condition for most studies to define data assets (Rassier et al. 2019; Statistics Canada 2019a; Xu et al. 2022). Of course, the particularity of Data Factor (DF) itself is also the focus of connotation discussion. Some studies emphasize that data information can only become data assets when it reaches a certain scale, and there is controversy about whether data on the conventional media can be included in the category of data assets (Li 2020; Li et al. 2022). These problems lead to inconsistent classification of data and data assets. Most of the existing research classifies data assets according to the generation methods, affiliated institutions/departments (Li 2020; Rassier et al. 2019), degree of privacy (OECD 2020), business model (Nguyen and Paczos 2020), or income source and products (Ker and Mazzini 2020) of data, rather than from the perspective of national economic accounting, which is not conducive to the accurate measurement of total data output.
In addition to the influence of statistical connotation, accounting scope, and classification, clarifying the statistical attributes of DF is also the key to CADF. The treatment of personal data ownership in Cheng (2018) and Shen (2020) also provides a reference for the research on data production of household sector at the accounting level. The analysis of data timeliness in Zhang and Qiu (2022) provides the possibility for further study of data asset depreciation. Li et al. (2022) pointed out that public sector’s data assets have social benefits but not necessarily economic benefits, so people should have a broader understanding of the profitability of data assets. The above studies on statistical attributes help to clarify the scope of DF accounting and explore the source of data value. However, there are still some statistical properties that need further study. For example, due to the extremely low copying cost of electronic data, the increase of data volume lacks practical economic significance, so there is no suitable unit of measurement for VADF.
In terms of accounting methods, except that some studies advocate the compilation of satellite accounts of data assets, other studies mostly discuss the methods from the perspective of data assets accounting. Ahmad et al. (2017) summarized three main methods to measure data assets, namely market method, income method, and cost method. Among them, the cost method is relatively consistent with the existing accounting logic, and its practical application is feasible. In addition, some scholars have made theoretical research on the measurement of DF value in several special situations. For example, Ahmad et al. (2017) studied the evaluation of free services supported by data and databases, and Ahmad and Van de Ven (2018) studied the evaluation of data in the case of free services for data exchange. These research achievements provide a methodological basis for VADF, but they are neither systematic in measurement nor consistent in approach. For further data capital measurement, in particular, the traditional fixed capital measurement method faces many new challenges. Li et al. (2022) holds that since data assets have no definite expected service life, it is impossible to calculate depreciation in the traditional way or use the perpetual inventory method for capital measurement, so they suggest that revaluation accounting be used to solve the problem of value depreciation (appreciation).
In addition to theoretical research, the exploration of CADF has also drawn the attention of international organizations, scholars, and some countries (regions). At the 51st meeting of the United Nations Statistical Commission, the value of recorded data was put on the research agenda. Statistics Canada was an early adopter of experimental accounting of data investments and data assets (Statistics Canada 2019a, 2019b), and it was followed by experimental measurements by Statistics Netherlands (Bondt and Mushkudiani 2021), the Australian Bureau of Statistics (Smedes et al. 2022), and the U.S. Bureau of Economic Analysis (Calderón and Rassier 2022). The academic community has also conducted measurement studies, such as Goodridge et al. (2022) and Corrado et al. (2022). It is generally believed that CADF can be carried out from a cost perspective. Regarding the inclusion of data factor in the SNA, Li (2020) suggested that data assets should be accounted in the form of supplementary accounting before the accounting method was optimized, and thought that the supplementary accounting framework could only include the omitted sectors owning data assets. Statistics Canada (2019a, 2019b) puts forward a data asset measurement framework from the perspective of “information value chain,” defines the accounting scope of data assets from the value chain of “data-database-data science,” probes into the relevant statistical attributes of data activities, and carries out data capitalization measurement in Canada from the perspective of cost method. Gao (2021) thinks that CADF needs to be placed in the process of economic operation, from the production of data products to the participation of data in economic production. ISWGNA (2022) argues for including data in the core accounts in the latest revised version of the SNA (SNA2025) and provides a framework for reaching this goal. These suggestions and practical progress have strong reference significance for carrying out DF statistics.
However, the difficulty and workload of CADF are large, involving a large number of estimates, and will have an impact on GDP accounting and the orientation of related policies. Therefore, it is difficult for the majority of countries to reach an agreement on accounting practice. For example, the exploration of database capitalization accounting has been going on since SNA1993, but so far, most countries and regions have not established a sound methodological system of database capitalization accounting. Although the United States, Canada, Britain, Japan, Australia, and some other countries have carried out capitalization accounting of databases, self-sufficient databases have not been included in the accounting scope, and software assets and database assets have not been distinguished from each other (Xu and Chang 2020), so many links of accounting practice still need to be improved. China has not yet established a database statistical method system, but has launched the first pilot project of data production factor accounting in Shenzhen, Guangdong Province, continuing the statistical reform and development idea of “practical progress driving methodological system construction” in R&D capitalization accounting.
In a word, theoretical and practical circles have carried out a series of exploratory studies on the theories, methods, and applications related to CADF, which laid the research foundation for CADF. However, the existing research cannot effectively connect with SNA, and it is difficult to highlight the contribution of DF to the national economic operation. In this regard, this paper focuses on the following two aspects: first, it deeply studies the theoretical research on the statistics and accounting of data production factors such as the scope of CADF, statistical classification, production cost accounting and data capital accounting methods, and constructs an operable CADF framework that connects to the existing national economic accounting system; second, based on the general principles of national economic accounting, this paper analyzes the relevant contents and problems of CADF under the current SNA framework, and studies the basic contents and methods of CADF from the perspective of value appreciation, and takes China as an example for statistical measurement and test.
The main contributions of this paper are: (1) In theory, it systematically outlines the idea of incorporating DF into the SNA through capitalization. By comparison, most existing researches focus on data asset accounting to explain the underlying theoretical issues (e.g., ISWGNA 2022), with insufficient attention paid to how data outputs are formed and transformed into data assets. (2) In empirical measurement, this paper provides new ideas for measuring the expenditures on DF by selecting the range of data professionals, matching data professionals and data-intensive industries, processing listed companies’ financial index data, and extending the data sources of CADF in China.
2. The Basic Issues of CADF
2.1. Definitions of Concepts
2.1.1. Data Output
CADF involves the basic concepts of DF output, capital formation, and assets. Scientifically defining data output is an important basis for carrying out CADF. Statistics Canada (2019a, 2019b) argues that data are “observations of phenomena in digital form that have been transformed into something that can be stored, transmitted or processed and from which knowledge can be drawn.” According to the definition recommended by international organizations such as the United Nations, data is “information in digital form obtained by recording, organizing, and storing phenomena” (ISWGNA 2022). According to the general definition of output in national economic accounting, data output in this paper is defined as “goods or services with data as the core content produced through economic production, labor input and capital investment,” which can also be generally regarded as data products. The details are as follows:
First, data is the output of production. In order to get the results of digital phenomena that can be stored, transmitted, or processed, the activities of “recording,” “sorting,” and “storing” are all production activities, with the participation of human labor or the control of human activities. At this time, the scope of producers under the current SNA framework is extended to cover households, and individuals have also become the producer of data.
Second, although data can be recorded either on electronic media or on traditional media, considering that DF capitalization is mainly due to the rapid development of information and communication technology, which provides the basic conditions for large-scale storage and convenient transmission of data, this paper focuses on the data recorded and stored electronically.
Third, data is not the only type of data output. Data can also be used as a factor of production to produce new data products together with labor and other capital. Therefore, data output in the accounting sense is a broader category.
2.1.2. Data Assets
The definition of data assets in this paper is “data products which are formed through past transactions or events, controlled or owned by institutional entities, can be used repeatedly in production and are expected to bring economic benefits to institutional entities.” On this basis, the particularity of DF itself is also the focus of discussion on the connotation of data assets:
First, data must reach a certain scale before being regarded as data assets. Because the value of individual data is small and the cost of ownership confirmation is high, data output can only be converted into capital formation and then become data assets when it reaches a certain scale.
Second, the expansion of the scope of data producers also brings the data owned by the household sector into the scope of asset accounting.
Third, data on the conventional media is not included in the accounting scope of data assets, but after it is re-processed and electronically recorded or stored, it will be taken as data assets.
Fourth, in order to link up the existing fixed assets classification in SNA and avoid the overlapping of statistical coverage, the data analysis software used in the data development process is not included in the accounting scope of data assets.
Fifth, data output is a broad category, so the coverage of data assets is also relatively broad, and the output of data reprocessing or service output based on data can also become data assets.
2.1.3. DF and Capitalization of DF
The factors of production in the modern sense come from the neoclassical viewpoint of economics, which describes the inputs used in product production to obtain economic benefits, including any resources needed for production and its environmental conditions. Compared with ordinary products, factors of production realize value through transactions (including internal transactions or use within the institution), and at the same time, they will be further put into the production process, making their potential production capacity become real production capacity. Specifically speaking, DF refers to the production input assembly with “data” as the core content, including the output of production links such as processing, storage, analysis, and application of “data.”
DF alone is often difficult to play a role in production. It is usually combined with other factors, and acts on the production process by improving the efficiency of factor allocation and optimizing internal management processes, which makes it difficult to calculate the value of DF separately in the output form. However, the current data market transactions are still facing many institutional and practical constraints, resulting in a small scale of data transactions, insufficient market circulation, and mainly internal use within the institution. Therefore, the DF participating in the production process at this stage is mainly “self-produced and self-used.” In the case of insufficient market transactions, it is in line with the basic principles of national economic accounting to measure the value of DF from the perspective of cost. Output data can be obtained through the “adjustment” of DF expenditure, and the transformation to the formation of fixed capital can be realized. Therefore, CADF is actually derived from the problem of data output accounting in SNA, which is centered on gross domestic product (GDP) and related to investment and assets. Through capitalization, DF expenditure is transformed into data output and data assets, and then it is included in the scope of production and asset accounting, which is taken as the accounting path to measure the value of DF at the macro level, so as to describe the contribution of DF to economic growth.
2.2. Value Composition of DF
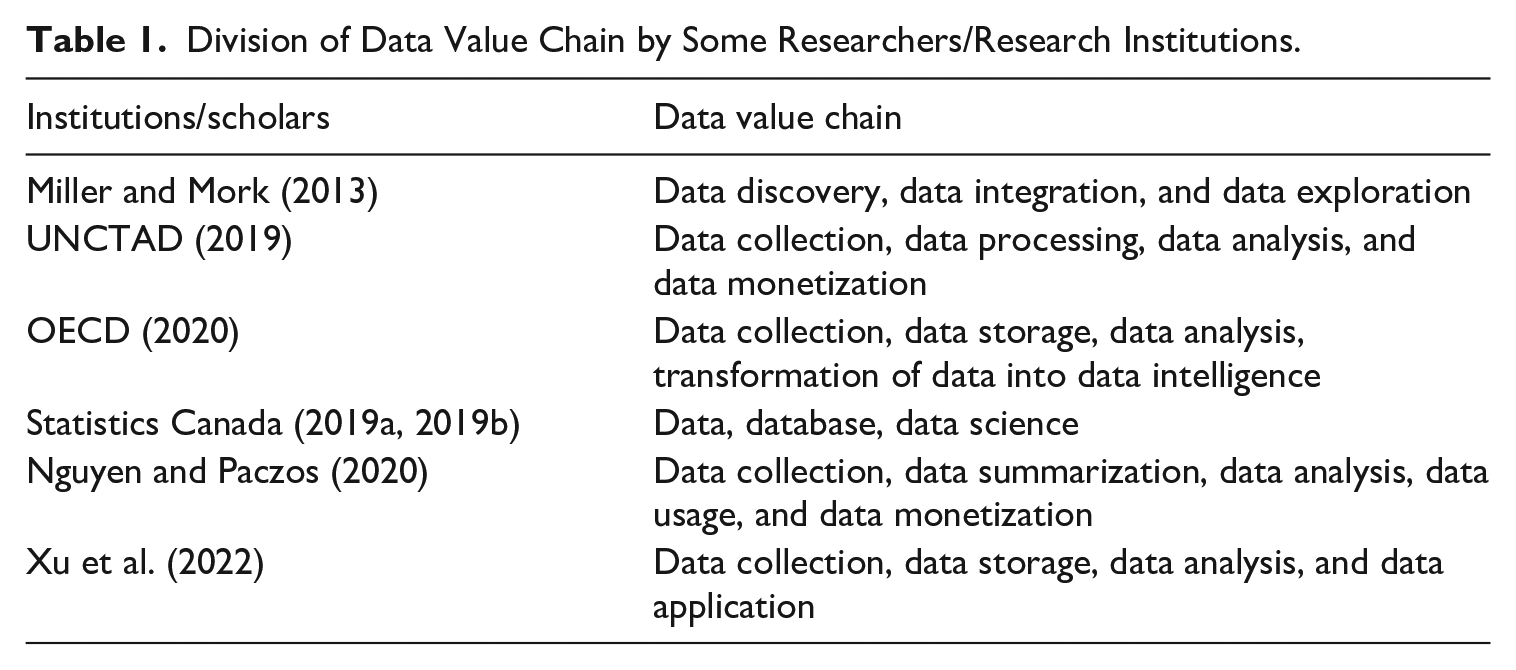
The value of DF comes from the value of knowledge (information) contained in it, but its real role in the production process requires a process of output form transformation, and there is also a value-added chain between different output forms. The concept of data value chain was first put forward by two researchers at the Noblis Institute, an American science and technology think tank. They believe that the data value chain is a framework composed of the whole data management activities from data acquisition to decision-making, where various stakeholders provide support, assistance, and related technologies (Miller and Mork 2013). Although there have been differences in the classification of specific processes since then, the relevant research essentially emphasizes the value-added chain of data, that is, the process from data acquisition, data processing, data exploration to data application (see Table 1).
Division of Data Value Chain by Some Researchers/Research Institutions.
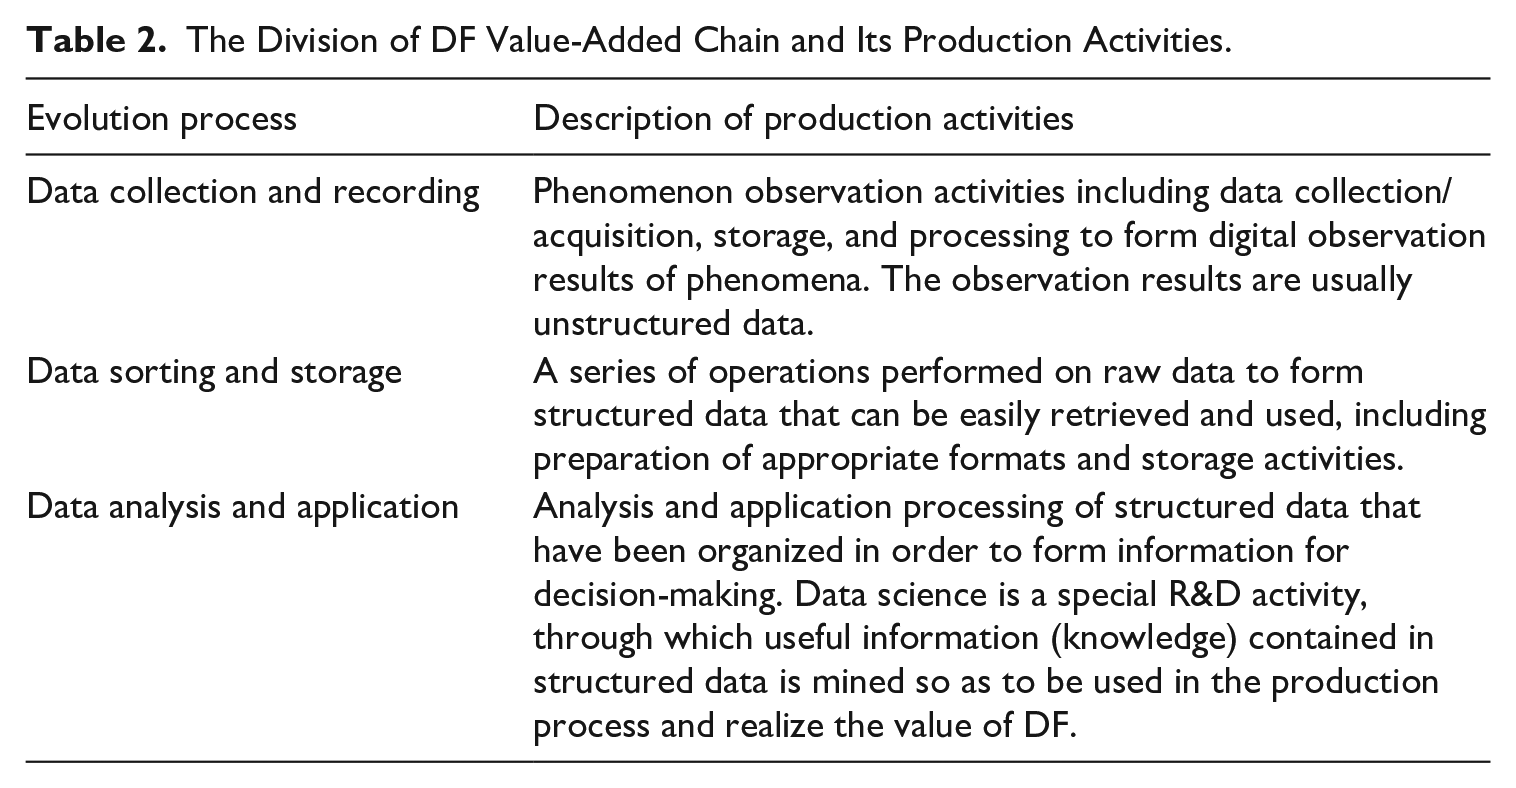
Because the core of DF’s participation in the production process lies in its “knowledge” or “information,” the essence of data value chain is the production process of information (knowledge). Similarly, as a kind of value reserve of data assets, knowledge plays a role in production. The reprocessing or reorganization of data is itself a process in which knowledge is constantly discovered and extracted, that is, a value-added link. In order to better describe the value-added process in data-related production activities, this paper divides the data value chain into three processes: data collection and recording; data sorting and storage; data analysis and application. Their corresponding production activities are shown in Table 2.
The Division of DF Value-Added Chain and Its Production Activities.
Generally speaking, collected and recorded data are difficult to use directly because of information redundancy and irregularity, so it is necessary to form a structured data output based on data sorting and storing activities to make the data more regular, more applicable and convenient to store, retrieve, and use. On this basis, according to different application scenarios and analysis activities, the knowledge (information) contained in DF can be effectively integrated with other production factors and play a role in the production process. That is, the last step of DF’s participation in social production is completed through the value-added link of data analysis and application. The value composition of DF and its basic mechanism are shown in Figure 1:
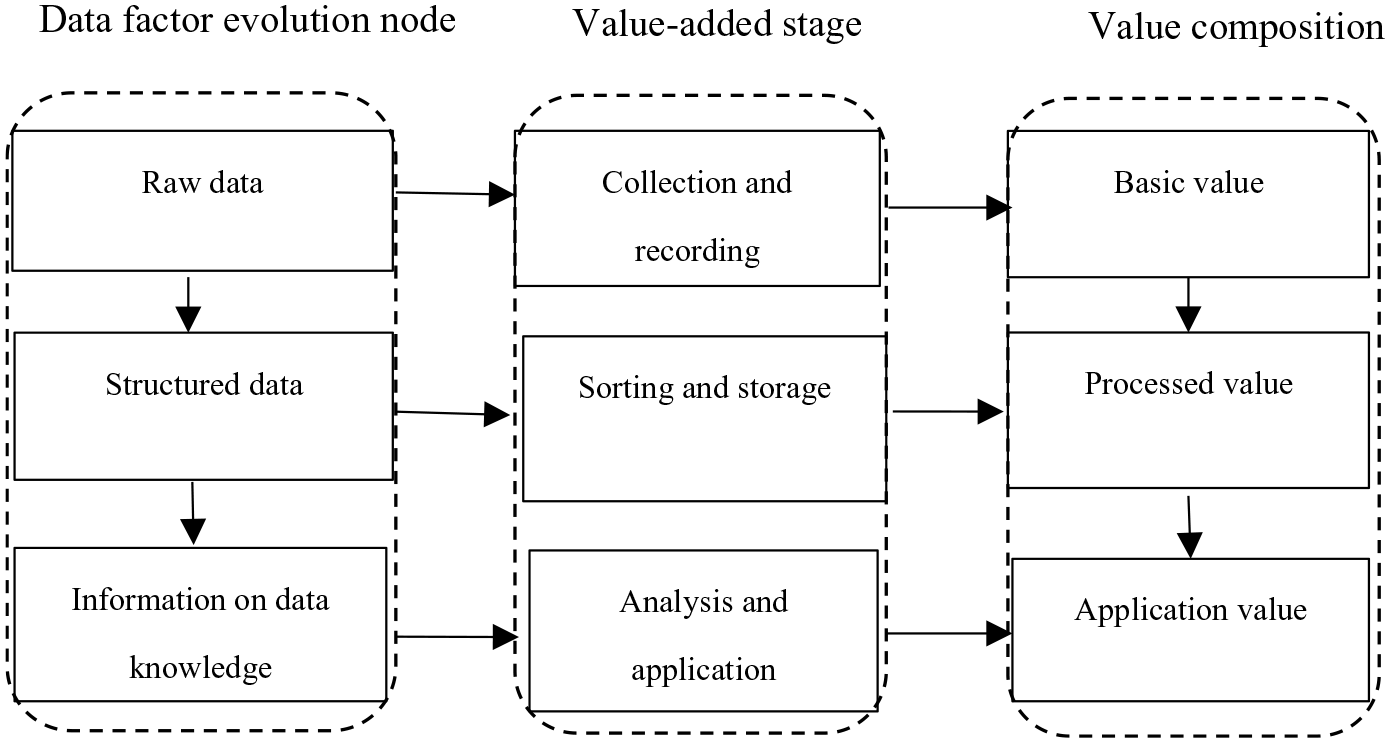
Value composition of DF and its basic mechanism.
2.3. Classification of DF-Related Output and Assets
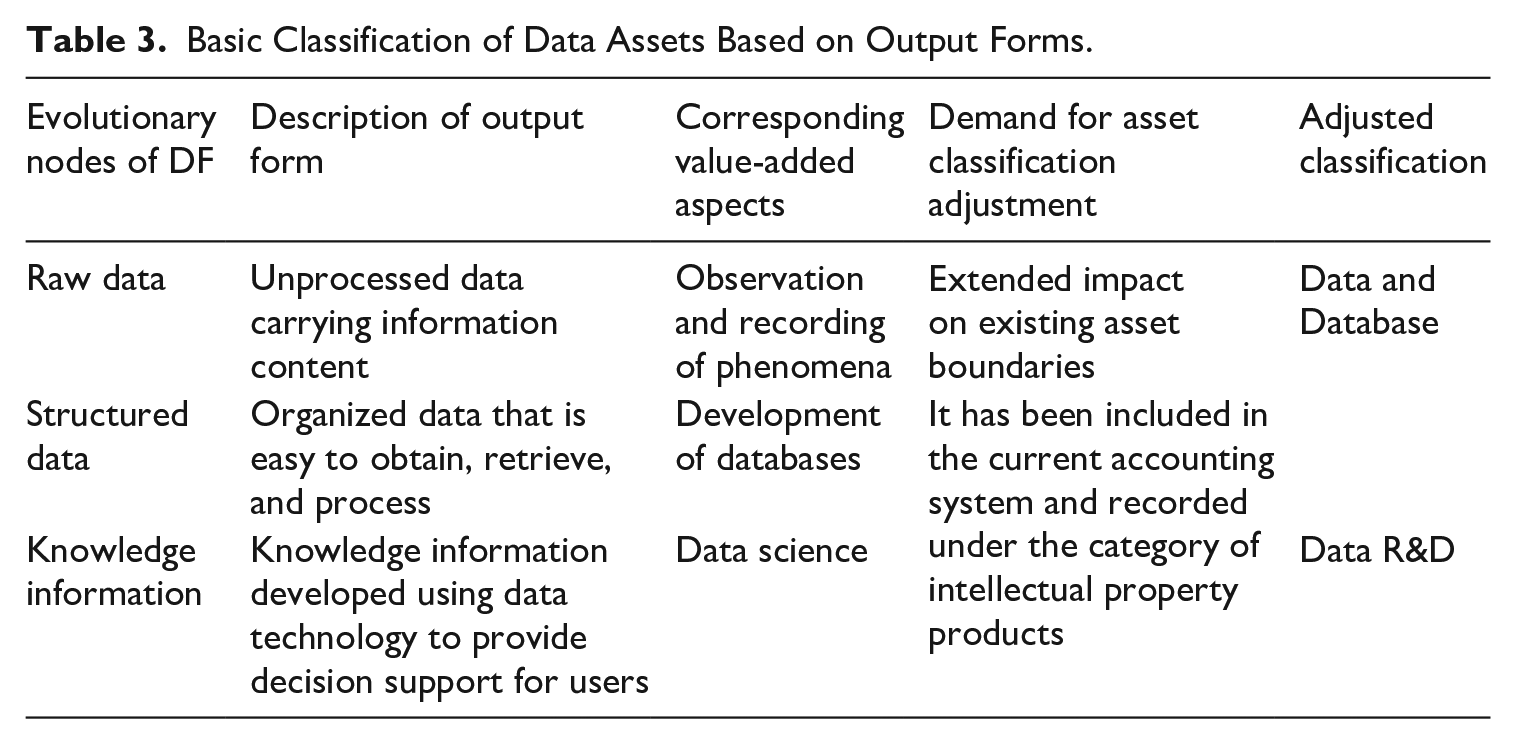
Based on the evolution nodes and value-added stages of DF, this paper takes data-related production activities as the basis for statistical classification, and classifies data-related outputs of “collection and recording activities,” “sorting and storing activities,” and “analysis and application activities” respectively. Among them, data is the output of collecting and recording activities, database is the output of sorting and storing activities, and data science is the output of analysis and application activities.
As can be seen from Table 3, the output forms of data-related production activities can be summarized into three segments, namely “unorganized data carrying information,” “organized data that can be efficiently accessed and used,” and “knowledge information developed using data technology to provide decision support for users.” As can be seen from the DF value composition and value-added process in Figure 1, the three segments of outputs described above are “progressive” at the value level, and constitute the process of value appreciation. Structured data contains the value of the raw data, while the knowledge information includes the value of the structured data. Because of this, it is more challenging to classify assets from the perspective of primary output forms alone, and it is necessary to look for a breakthrough in asset classification from other perspectives. Production activity splitting based on the value-added perspective offers the possibility of realizing such a breakthrough. The value-added components corresponding to the value-added stage are shown in Table 3, including observation and recording of phenomena, database development, and data science. The three are independent of each other and do not cross-cover each other, which facilitates the independent development of output and capital formation accounting corresponding to the three value-added segments. At the same time, the sum of the three can be used to measure the contribution of the DF to production.
Basic Classification of Data Assets Based on Output Forms.
Under the framework of 2008SNA, both database and R&D are classified items of fixed assets, which are listed under the category of intellectual property products. However, since data collection and recording activities are not included in the scope of production accounting, the existing asset classification does not contain unorganized data carrying information. Therefore, from the perspective of SNA asset accounting boundary expansion, it is necessary to consider including unprocessed data classification. In terms of specific asset classification, databases are still listed under the category of intellectual property products, while under the category of R&D a separate data R&D subcategory is needed to record the output capitalization results of DF analysis and application activities. For unadjusted data, a new asset classification is needed, and it can still belong to the classification of intellectual property products. The main reason is that knowledge products can be the results of investigation, and investigation can produce knowledge or use the knowledge to gain benefits in production. This is not only consistent with the connotation of data, but also consistent with the fact that the “basic value” in DF value composition plays a role in production.
Moving from raw data to structured data is the process of organizing and processing unruly and messy raw data. After this stage of production activities, the structured data formed is usually visible in the form of a database. On this basis, in terms of specific records of asset classification items, the first thing is to clarify the differences from and connections with data assets and intellectual property products, especially their differences from and connections with R&D and software. According to the 2008SNA, R&D expenditure mainly refers to the expenses incurred for “increasing knowledge reserves and utilizing the knowledge reserve to develop new applications and systematically engage in creative work.” Comparing it with the data output and data assets defined in this paper, firstly, although it meets the statistical attributes of an intellectual property product, data R&D falls within the scope of R&D asset accounting and is different from R&D. Data R&D can be recorded as a separate new item under “research and development”; secondly, the purpose of database development is to process and store raw data, and the investment in development constitutes the value-added component of the data. Therefore, the original item “databases” can be retained under “intellectual property products”; thirdly, under the existing SNA framework (SNA2008), data are not included in production accounting and are not subject to asset accounting. Therefore, the capitalization of data requires the creation of a new item “data” under “intellectual property products.” This treatment takes into account the effectiveness of asset classification recording adjustment and the robustness of the current accounting framework.
For the above-mentioned asset classification from the perspective of output form, further division can be made from the perspectives of industry characteristics, source nature, and producer (owner) (Figure 2). On the one hand, bringing data production factors into the accounting system is comprehensive and systematic work, which is helpful to production accounting and output and asset statistics according to the division of national economic industries. On this basis, according to the intensity of data-related production activities, further dividing the data core industry and the integration industry can provide support for the realization of the value-added accounting of the data industry with “value-added method + measurement method.” On the other hand, cross-classification according to the nature of sources and producers is the key to exploring the mechanism and impact of CADF. Among them, the database and data R&D have been incorporated into the current accounting framework. Therefore, the focus of cross-classification lies in the subdivision of data production activities, which is also the most basic content to deal with the impact of DF capitalization on production and asset boundaries.
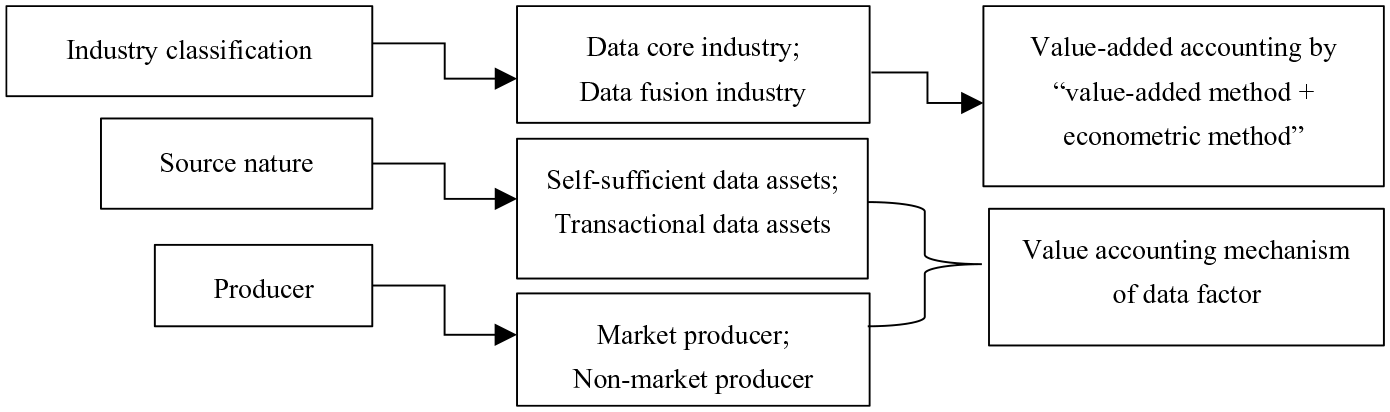
Extended classification of data assets by industry, source nature, and producer.
2.4. The Object and Scope of CADF
CADF takes the data output that can form fixed capital as the research object. Whether it is a specialized data product or a derivative product of other production activities, or the data output of each link of the data value chain, any data can be included in the scope of CADF as long as it involves the participation of human activities, can bring economic or social benefits and can lead to wealth accumulation.
First, the data output that forms fixed capital is mainly data, database, and data R&D, and the ultimate goal of CADF is to obtain the capital formation amount and capital stock of the three. It is clear that database belongs to a category of fixed assets in SNA2008, and data R&D, as a type of R&D activities, is also classified as fixed assets. The production of database and its value accounting, data science activities and its value accounting have all been clearly capitalized. Therefore, the discussion on CADF principle mostly focuses on the production activities of data and the capitalization of its output.
Second, the accounting object does not include software and non-data R&D. The main reasons are: first, software investment and assets have been incorporated into the current accounting system and become separate asset categories; second, the accounting scope of data science and R&D overlaps. In the current SNA, the expenditures for creating new theories, new technologies, new methods, new products, and new services are all included in the accounting scope of R&D, and the part of R&D aimed at mining the application value of data is not listed separately.
Third, the purpose of CADF is to measure the contribution value of DF in the production process. Based on the accounting of data capital formation and data assets, attention needs to be paid to the influence of data capital formation on GDP accounting and accumulated account changes brought about by the inclusion of data assets in the classification of fixed assets.
3. The Mechanism of CADF
For the capitalization of DF, the key to clarify the accounting mechanism is how to bring DF into SNA, which mainly involves four aspects: accounting logic, content, principle, and influence. The current SNA takes production accounting as the center and GDP accounting as the core. The emphasis on DF stems from its increasingly significant role in production. It is very important to consider how the inclusion of DF—the most important accounting indicator for measuring macro output—in the accounting system will affect GDP. On the GDP accounting platform, key accounting nodes such as output, investment, and assets, as well as the relationship between the nodes, provide a framework for CADF.
3.1. Accounting Logic
SNA is a systematic value accounting system centering on production statistics and covering the distribution and use of output. Carrying out VADF and bringing it into SNA also requires effective accounting of existing production and use (see Figure 3).
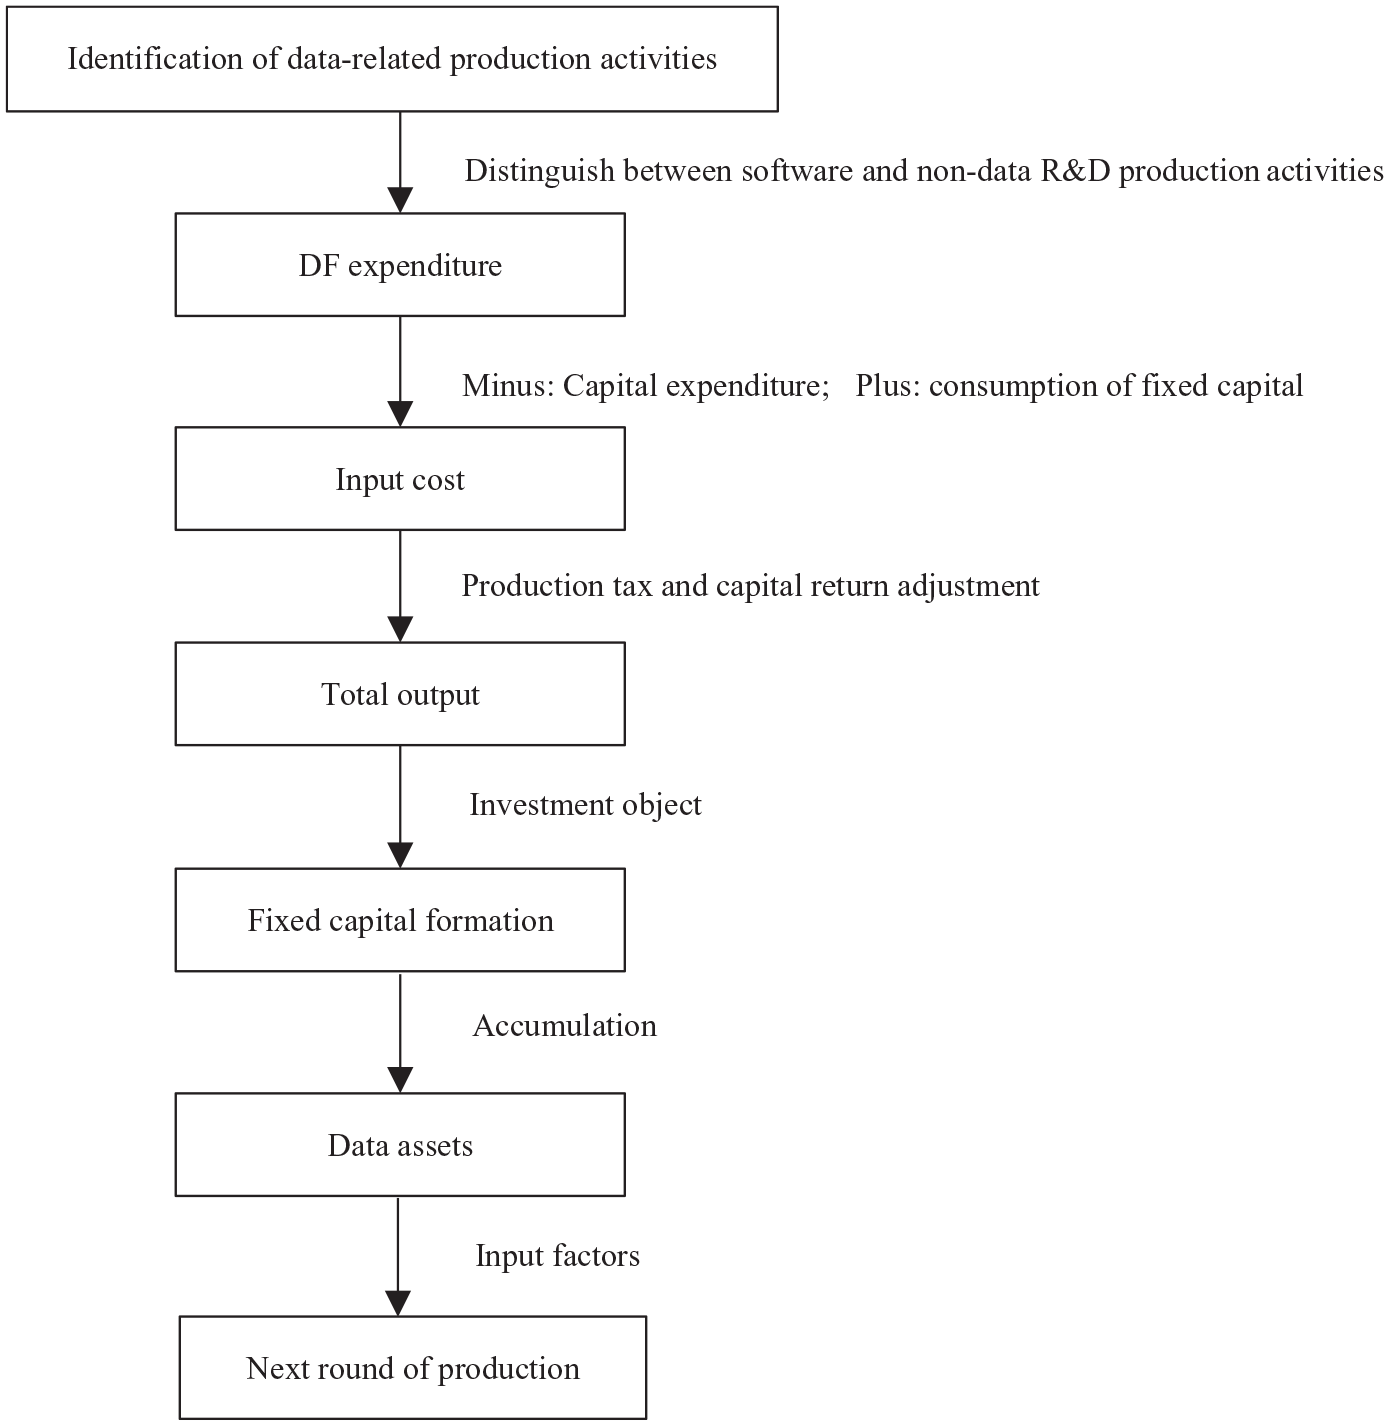
Schematic diagram of CADF principle.
The first is the identification of data production activities. In addition to the basic definitions of institutional control, input and output, and social production, which are emphasized by economic production activities in general, the identification of data production activities is particularly prominent. The forms of output are data, database, data R&D production activities, and value-added activities such as data collection, sorting, storage, and analysis related to the above production activities.
Second, different from the traditional accounting of goods and services, the main body of data production activities has been further extended to the household sector, which has had a huge impact on the current accounting system. Although households have legal ownership of their own data, household data production is mostly an auxiliary activity, and data is often collected and exchanged by enterprises through “free online services,” or collected by government departments for public management purposes in accordance with the law. In addition, the value of individual household data is small but the overall value of aggregated data is large. Therefore, the measurement of the value of such data production is replaced by the collection cost of enterprises (governments).
The third is data output accounting and its capitalized conversion. Through the combination and utilization of various production factors, the data production process transforms various inputs into outputs with new use value, and provides various products for consumption and production. Consumption is to meet the needs of people’s lives, and no longer participates in the next round of production activities, while the formation of capital for production increases data assets through accumulation.
The fourth is the accounting of the use of data assets. Through the accumulation of data capital, the data assets held by various institutions will increase, and the next round of production activities will be carried out on an expanded scale.
3.2. Accounting Content
Judging from the logic of CADF, under the premise of effectively docking the current SNA framework, measuring the contribution of DF to production mainly involves two aspects:
The first is data output accounting and capitalization. In addition to the need to divest capital formation for databases and data R&D that are already included in the accounting system, it is necessary to separate the capital formation, identify data production activities according to the reality of the expansion of production activities, and explore its output accounting and capitalization treatment. On this basis, the accumulation of data capital formation and the accounting of data assets are studied. Seen from the specific accounting content, how to calculate the data output? How big is it? How much of the data output can be converted into data capital formation? By what path is it converted? What is the scale of data assets formed by the accumulation of data capital? These are questions that must be answered in the study of accounting content. Therefore, under the basic framework of SNA, establishing an accounting relationship centered on data production that integrates output, investment, and assets is the focus of accounting content research.
Second, the impact of CADF is mainly the expansion of data asset boundary, which is reflected in the GDP accounting by the production method, income method, and expenditure method.
3.3. Accounting Principle
Corresponding to the accounting content, CADF principle aims to clarify the problems of data output, data capital formation, and data assets accounting on the GDP accounting platform, as well as the impact of CADF. The scope of DF is relatively broad. The data output in production activities is the core content, the part of output converted into capital formation is the object of capitalization accounting, and the data output has many forms along with the extension of the value chain. The accounting research from the perspective of value appreciation can better solve the circulation problem in data production and provide convenience for VADF to be included in SNA accounting framework. The basic principle of capitalization accounting is shown in Figure 3.
3.3.1. Output Accounting
The output of data production activities is the basis for measuring the formation of data capital. 2008SNA believes that when there is an observable market price, the output should be estimated according to the market value:

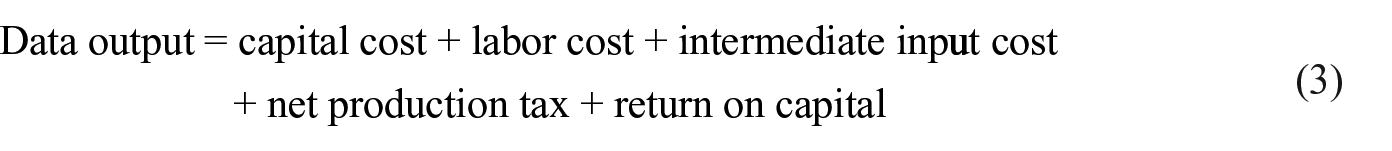
When there is no observable market price, the suggestion of 2008SNA is that the output be estimated according to the total cost method. For a long time, data production activities have not been included in the accounting system, and market transactions are mainly for internal use, resulting in the lack of market transaction prices for value accounting. However, considering that DF expenditure in production activities exists objectively, it can be used as the basic data for total cost accounting of data activities. According to the generalized production process, the production cost mainly includes input factor cost and intermediate consumption cost:

Wherein, the cost of labor factors can be measured by the remuneration of workers, which refers to the expenses paid to the relevant personnel in data production activities. The cost of capital factor refers to the fixed assets consumed in data production activities. The intermediate consumption expenditure mainly refers to all kinds of raw materials, service fees, and other expenses consumed in production activities. If it is produced by market producers, it will also involve production taxes and subsidies, and return on capital:
3.3.2. Capital Formation and Capital Stock Accounting
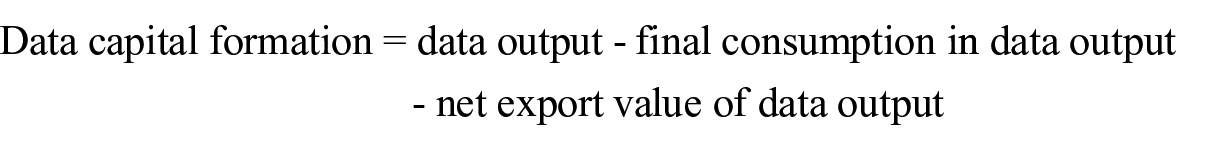
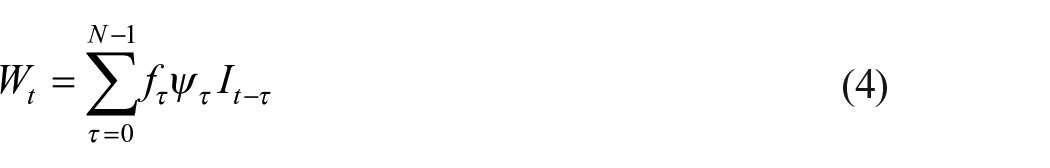
On the basis of converting DF expenditure into data output, data assets are formed by treating the use of data output as the formation of fixed capital and accumulating such formation stage by stage. That is to say, data investment buys data output, and these products are accumulated through investment and added to the stock of data assets held at the beginning of maturity, and the final data assets are part of fixed assets in a broader sense. In the capitalization accounting of data output, the final use of output is mainly in three areas: consumption, capital formation, and export. Therefore, the calculation of data capital formation can be expressed as:
According to the perpetual inventory method, the stock of capital as wealth can be calculated by weighting the amount of capital formation over the years through the retirement model and the service age-value model. The formula is:
Wherein,
For the convenience of description, unless otherwise specified, the “service age-value” model is referred to as “value model.” Similarly, the “service age-efficiency” model is called “efficiency model” for short.
3.3.3. The Impact of DF Capitalization on GDP Accounting
According to the basic classification of data assets, the database and data R&D have been incorporated into the current accounting framework, and the research on accounting impact has been mature. Therefore, this paper focuses on the impact of data activities on the output and asset boundary expansion caused by the inclusion of data activities in production accounting. Its capitalization will directly affect intermediate consumption, depreciation of fixed assets, total capital formation, etc., and will have an impact on GDP accounting by production method, income method, and expenditure method. Specifically, data collection and recording activities are auxiliary production activities under the current accounting framework, aiming at improving production efficiency and better serving other production activities. Therefore, they are not accounted for separately, and their production activities are not identified. Capitalization accounting requires separating them from total production activities and dividing the original total production activities into two parts: data production and other production.
(1) In the “value added” based GDP accounting, for production activities other than DF-related collection and recording activities, the total output has not changed, and the intermediate consumption is equal to the intermediate consumption of the total production activities minus the remaining part of the intermediate consumption of data production activities. On the whole, after capitalization accounting, the total output and added value have increased, and the increased part is equal to the output of data production activities, while the intermediate consumption has not changed.
(2) In the income based GDP accounting, the newly added value is equal to the output of data. The change of accounting method will not bring new income to workers, and it is not necessary to pay more taxes. Therefore, the remuneration of workers and the net production tax have not changed. However, in addition to the original fixed assets, data assets are also used in production, and this part also needs depreciation, so the depreciation of fixed assets has increased, and the increase is equal to the depreciation of data assets. According to the income-based accounting formula, the operating surplus has also changed, and the amount of change is equal to the increase in added value minus the increase in depreciation of fixed assets.
(3) In the expenditure based GDP accounting, because the data output is recognized as an asset, the total amount of capital formation increases. Because it belongs to auxiliary production activities, and the assets formed by the output are mostly self-produced and self-used, the output of other production activities is not increased, so the final consumption expenditure and net export have not changed. According to the formula of expenditure method, the change in GDP is equal to the change in total capital formation, and the amount of change is equal to data output.
4. Choice of Methodological Path
4.1. Accounting Problems Faced Under Existing Methodological System and Basic Statistical Conditions
4.1.1. It is Difficult to Identify Production Activities Due to Fuzzy and Overlapping Production Boundaries
Firstly, the observation of phenomena, that is, the data collection process, is often integrated with other production activities, which makes it difficult to identify the production of data. Secondly, in most cases, there is a fuzzy statistical boundary between the database and its supporting software. How to identify the boundary is the key to identifying data processing activities and measuring structured data outputs and database development outputs. Thirdly, there are still the problems of difficult determination of accounting scope and blurred boundary to distinguish between data R&D and other R&D activities, which is the difficulty in identifying data analysis activities and measuring the output of data R&D.
4.1.2. Lack of Basic Statistics Used to Measure the Value of DF
There are few market transactions in data-related output, and the future value is uncertain, so neither the market method nor the income method has real application conditions. Even if the measurement is based on cost, it faces the lack of production activity expenditure data of some types of data output. This makes it difficult to measure the expenditure, output, and capital formation of DF.
4.1.3. The Applicability of Traditional Capital Measurement Methods Due to the Special Attributes of Data Assets
The foothold of CADF is to measure the formation of data capital, and then measure the stock of data capital used in the production process. However, except databases, data R&D, and other output forms that typically have the attributes of fixed assets, raw data representing the basic value of DF have problems such as unclear ownership definition, inconsistent output unit of measurement, uncertain service life of assets, and difficult depreciation treatment, which make it difficult to carry out further capital measurement, and also put forward new requirements for the traditional fixed capital accounting method (OECD 2009).
4.2. The Choice of Basic Accounting Methods
Data-related output can be “self-produced and self-used” by institution/departments or sold (purchased) in the market, in which the latter measures value based on market transaction prices, while the former mainly needs to estimate the costs of production activities related to data. However, considering the current statistical basis, the fact that DF participates in production activities and the current situation of DF market, this paper holds that the basic method of CADF should be based on the cost method. The main reasons are as follows:
(1) The existing data output is mainly for internal use. Xu et al. (2022) found that not all data-driven business models or application scenarios involve market transactions of data. In more cases, the data processed and accumulated by enterprises or institutions are often not directly sold, but used internally.
(2) Official statistics are limited by the lack of attention to data-related production activities in the accounting framework, and there is still a lack of relatively complete transaction data. Therefore, the market accounting method of multiplying the trading volume by the transaction price in the traditional sense lacks a supporting foundation. In theory, the income method mainly depends on the discount of future income, but the accounting based on this method is not feasible because the data-related output is significantly affected by technological changes, and its future income changes are uncertain and its value is difficult to determine.
(3) Both database capitalization accounting that has been included in the accounting system and data R&D that has been included in R&D accounting adopt cost-based accounting. From the perspective of consistency of CADF method, it also supports the use of cost method for data output and capital formation accounting, which is in line with the relevant accounting recommendations of SNA.
4.3. CADF Method That Distinguishes Output Types
Based on the research results of Statistics Canada (2019a, 2019b), this paper explores the application of cost method in accounting from the perspective of occupational classification.
4.3.1. Observation and Recording of Phenomena
When identifying the types of activities involved in generating raw data and making a statistical summary of their production costs, the value of data can be measured by the labor cost, capital cost, and comprehensive cost plus invested in its production. Then, to identify related production activities, the first thing is to determine the occupation type related to data production, that is, the occupation related to the digitization process of phenomenon observation results. Furthermore, the share of working time that workers in these occupational types spend on data production needs to be determined, so as to accurately measure the labor input in data production. On this basis, through a typical investigation of data production process, we can grasp the composition of production cost, determine the ratio of capital input to labor input and the comprehensive addition coefficient, which can be used as the basis for estimating the formation of data capital.
4.3.2. Databases Development
The suggestion of 2008SNA is that measurement be made from the perspective of cost, including the cost of preparing data in an appropriate format for the database, the labor cost, capital cost, and intermediate consumption cost of developing the database. But in most cases, the statistical boundary between the database and its supporting software is fuzzy, and how to distinguish them is the key to effective measurement of database investment. Like the measurement of data capital formation, the scope of database professionals should be defined through the accurate selection of occupational classification.
We can eliminate the categories of employees involving such keywords as software, information system, and computer programs, and only keep the professional types related to database development and data management, and determine the time share of employees’ labor input into database development, and then determine the labor input cost, capital input cost, and comprehensive make-up coefficient through statistical investigation.
4.3.3. Data R&D
Data R&D is a typical type of R&D activities. 2008SNA has formally included the latter in the R&D capitalization accounting. Similarly, for R&D output with market transaction, the value of R&D output can be measured by market transaction price. However, in view of the fact that R&D activities mostly occur in institutions and lack of necessary market prices, the method proposed by 2008SNA is also based on cost accounting. Thanks to the relatively complete science and technology statistics, capitalization accounting from the perspective of R&D expenditure is mature in both methodological system and statistical practice. However, it is still difficult to separate data R&D from the current R&D capitalization accounting due to the problem of fuzzy boundary and the difficulty in determining the accounting scope.
The corresponding solution is still to select the corresponding occupational category engaged in data science activities, and realize the identification of production activities and the accounting of output and capital formation by summarizing the labor cost, capital cost, and intermediate consumption cost invested in production.
4.4. Accounting Treatment Corresponding to the Special Attributes of Data Assets
Data assets are the accumulative form of DF’s participation in the production process, and further confirmation of its economic ownership, profitability and durability is the basis for and key to improving the theoretical system of CADF.
4.4.1. Economic Ownership from a Value-Added Perspective
For the above output types, from the perspective of value appreciation, the economic ownership of database and data R&D is relatively clear, that is, the creator of the value-added part has the corresponding control right and disposal right. Data also meets the ownership attributes from a value-added perspective, but because of the complicated legal ownership of data, different types of data have different focuses on ownership confirmation.
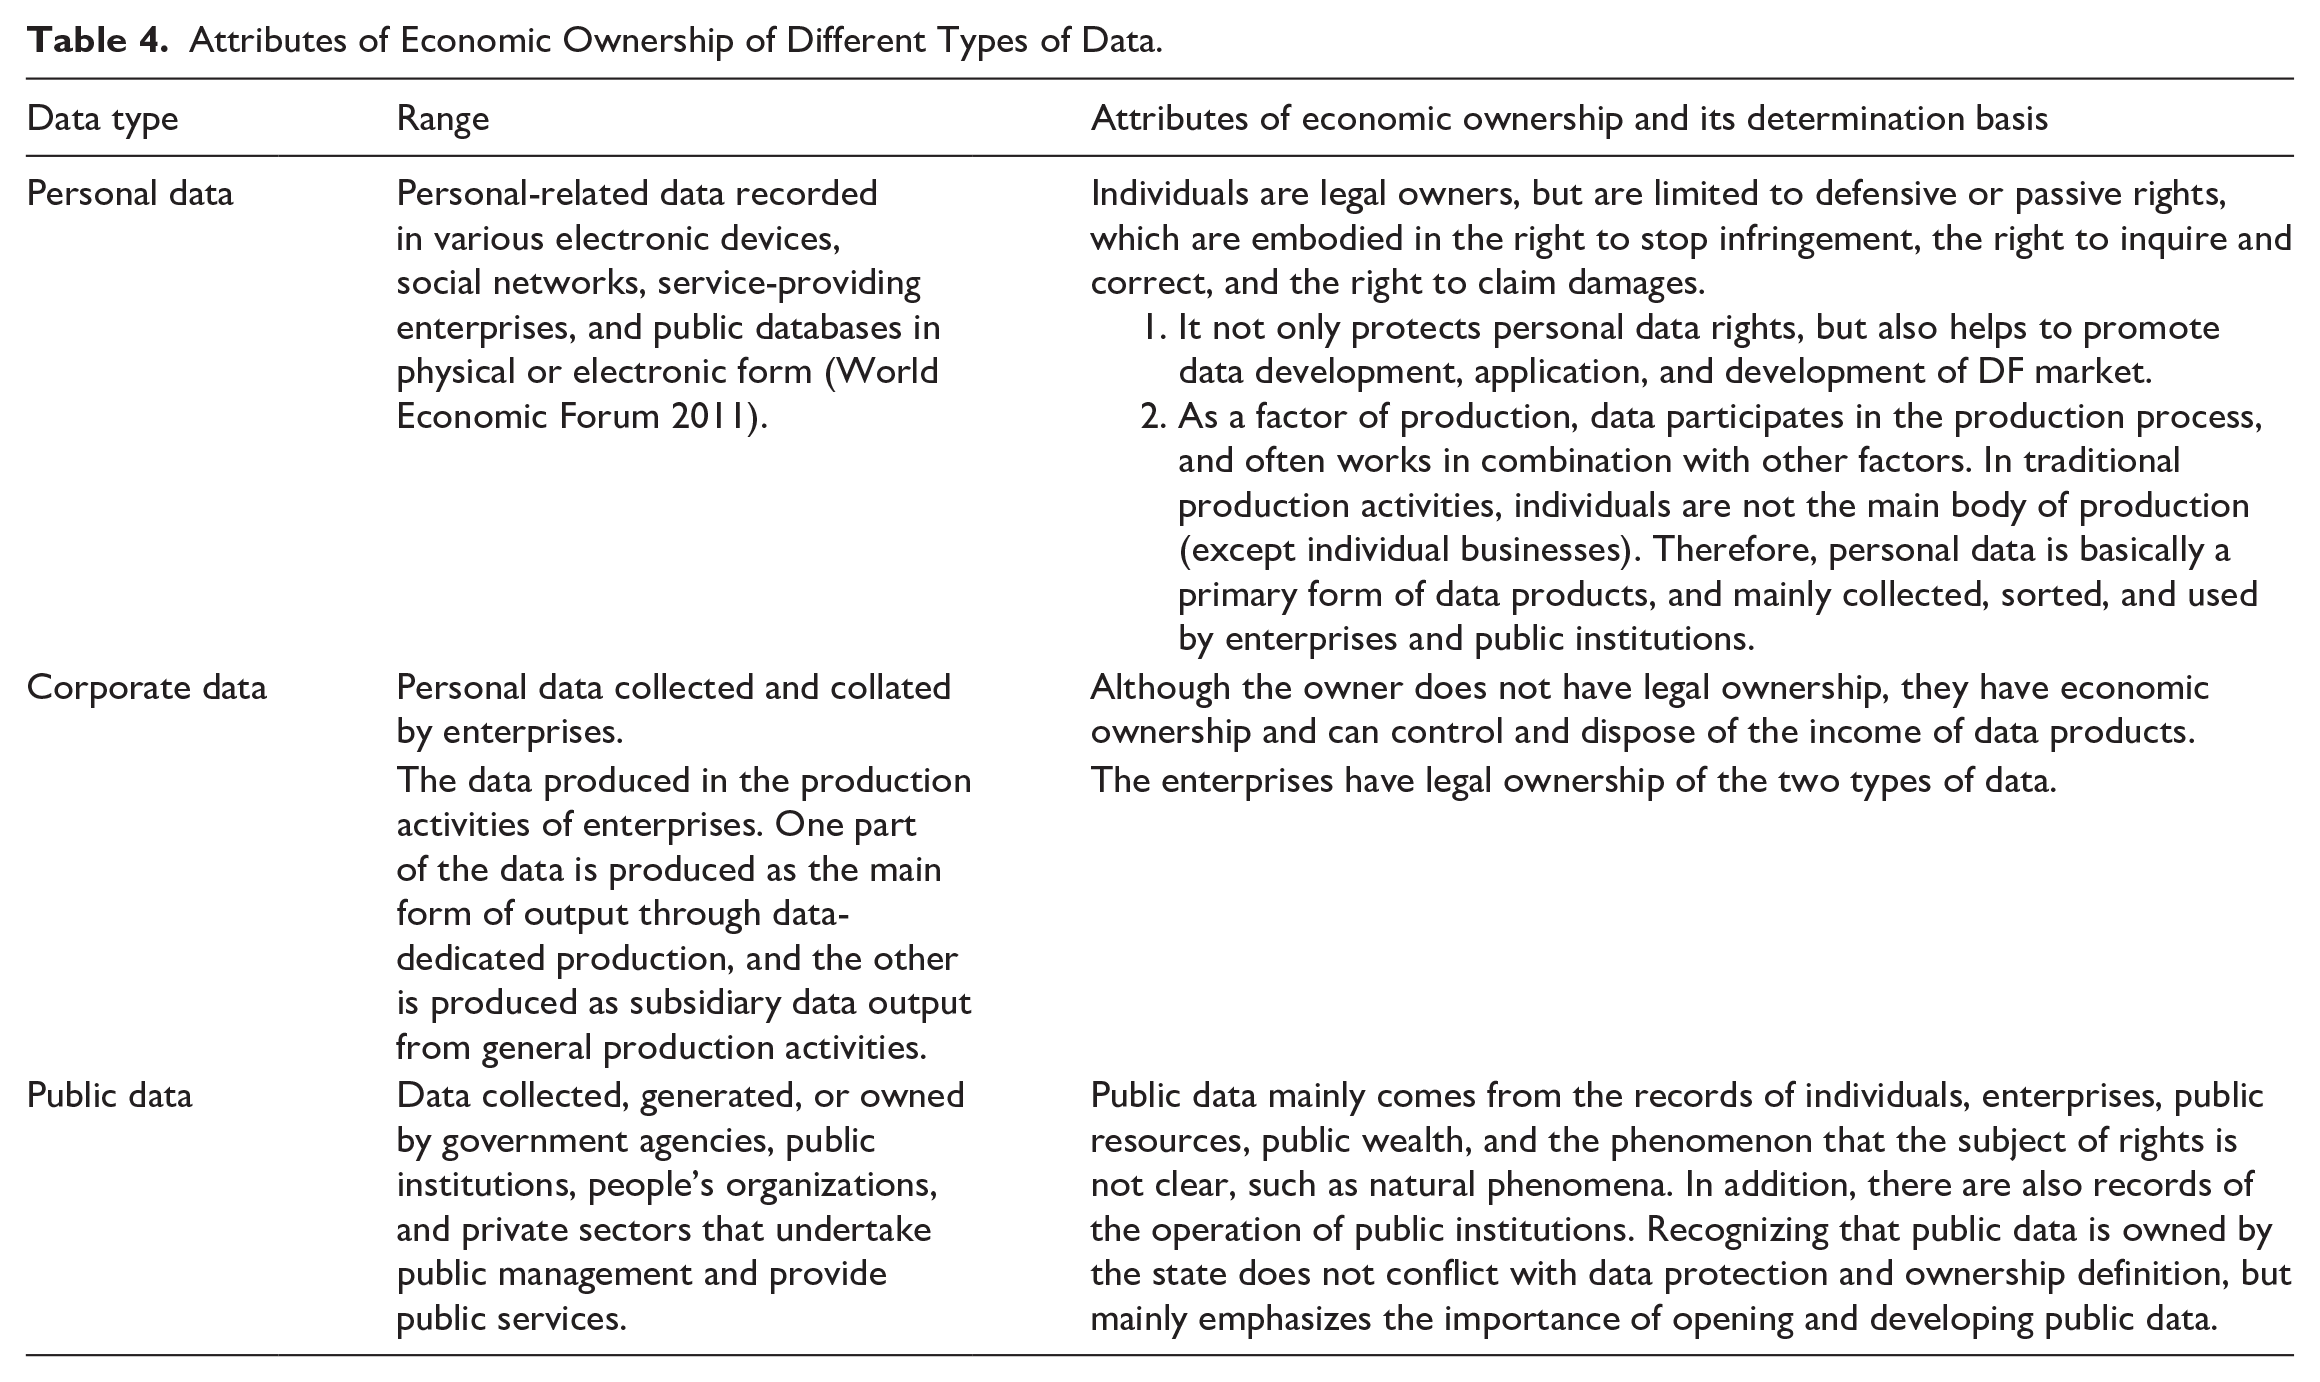
According to the explanation of the object of data property right in Article 127 of the Civil Code of People’s Republic of China, “the purpose of giving property right protection to data is not to protect the data itself, but to enable the obligee to enjoy the control over the information carried on it by affirming the rights of the data.” According to who produces data, this paper divides data into three types: personal data, corporate data, and public data. Table 4 shows the scope of each type of data and the attributes of its economic ownership.
Attributes of Economic Ownership of Different Types of Data.
4.4.2. Generalized Profitability
For data assets involved in market transactions, it is consistent with the return mechanism of other fixed assets, that is, including the creation part of assets in operating surplus and net production tax, which shows direct monetization value. However, for self-produced and self-used data products, it is typically a “non-monetary transaction” mode, which is mainly used to assist production activities. During the use of data products, by improving the efficiency of factor allocation and optimizing the management decision-making process, cost reduction and efficiency improvement can be achieved, product and service quality can be improved, or social benefits can be created (Ahmad and van de Ven 2018). Therefore, in addition to bringing economic benefits, the determination of the profitability of data assets should also be based on whether it has social efficiency or whether it can improve efficiency. Xu et al. (2022) and Li et al.(2022) have emphasized this point.
4.4.3. Timeliness and Effectiveness Treatment
It is a general requirement of asset durability that the service life is more than one year and it can be used repeatedly. However, for data assets, the rapid development of communication and information technology makes it more convenient for large-scale storage, transmission, and retrieval of data. Repeated use of data will not cause physical loss like other fixed assets, but its durability will be typically affected by timeliness, mainly in specific application scenarios, and the information contained in data corresponds to the timeliness and effectiveness of the production process.
5. Statistical Measurement: Taking China as an Example
5.1. Data Selection and Processing
5.1.1. Selection of Data-Intensive Industries
Due to the lack of data on the occupations and wages in the data industry corresponding to the Chinese Occupational Classification Dictionary, this paper attempts to carry out alternative measurements at the industry level. According to the results of a survey on data factor expenditures in Shenzhen (one of the famous and developed cities in China), information transmission software and information technology services, manufacturing, finance, wholesale and retail trade, and scientific research and technology services were included in the data intensive industries by matching with digital occupations. Given that the current demographic statistics on China’s subdivided occupations are mainly data related to the population census and economic census, this paper takes the breakdown data from the Sixth and Seventh Population Census, and the Third and Fourth Economic Census as the benchmark. Based on matching industry and occupation classifications (Table 5), on the one hand, the data from the economic census are used to estimate the weight of the relevant industry subcategory in the major category, and to construct the split coefficients for the annual size of people employed in the sub-industry; on the other hand, the size of economic and financial personnel in the population census is used to estimate the size of relevant data professionals. In addition, considering that the official statistical sector is very important in data production, this paper also selects official statisticians as data professionals. Based on the matched broad categories of industries, sub-industry wages for each year are used as the base indicator for measuring labor input.
Data-Intensive Industries That Match with Data Professionals.
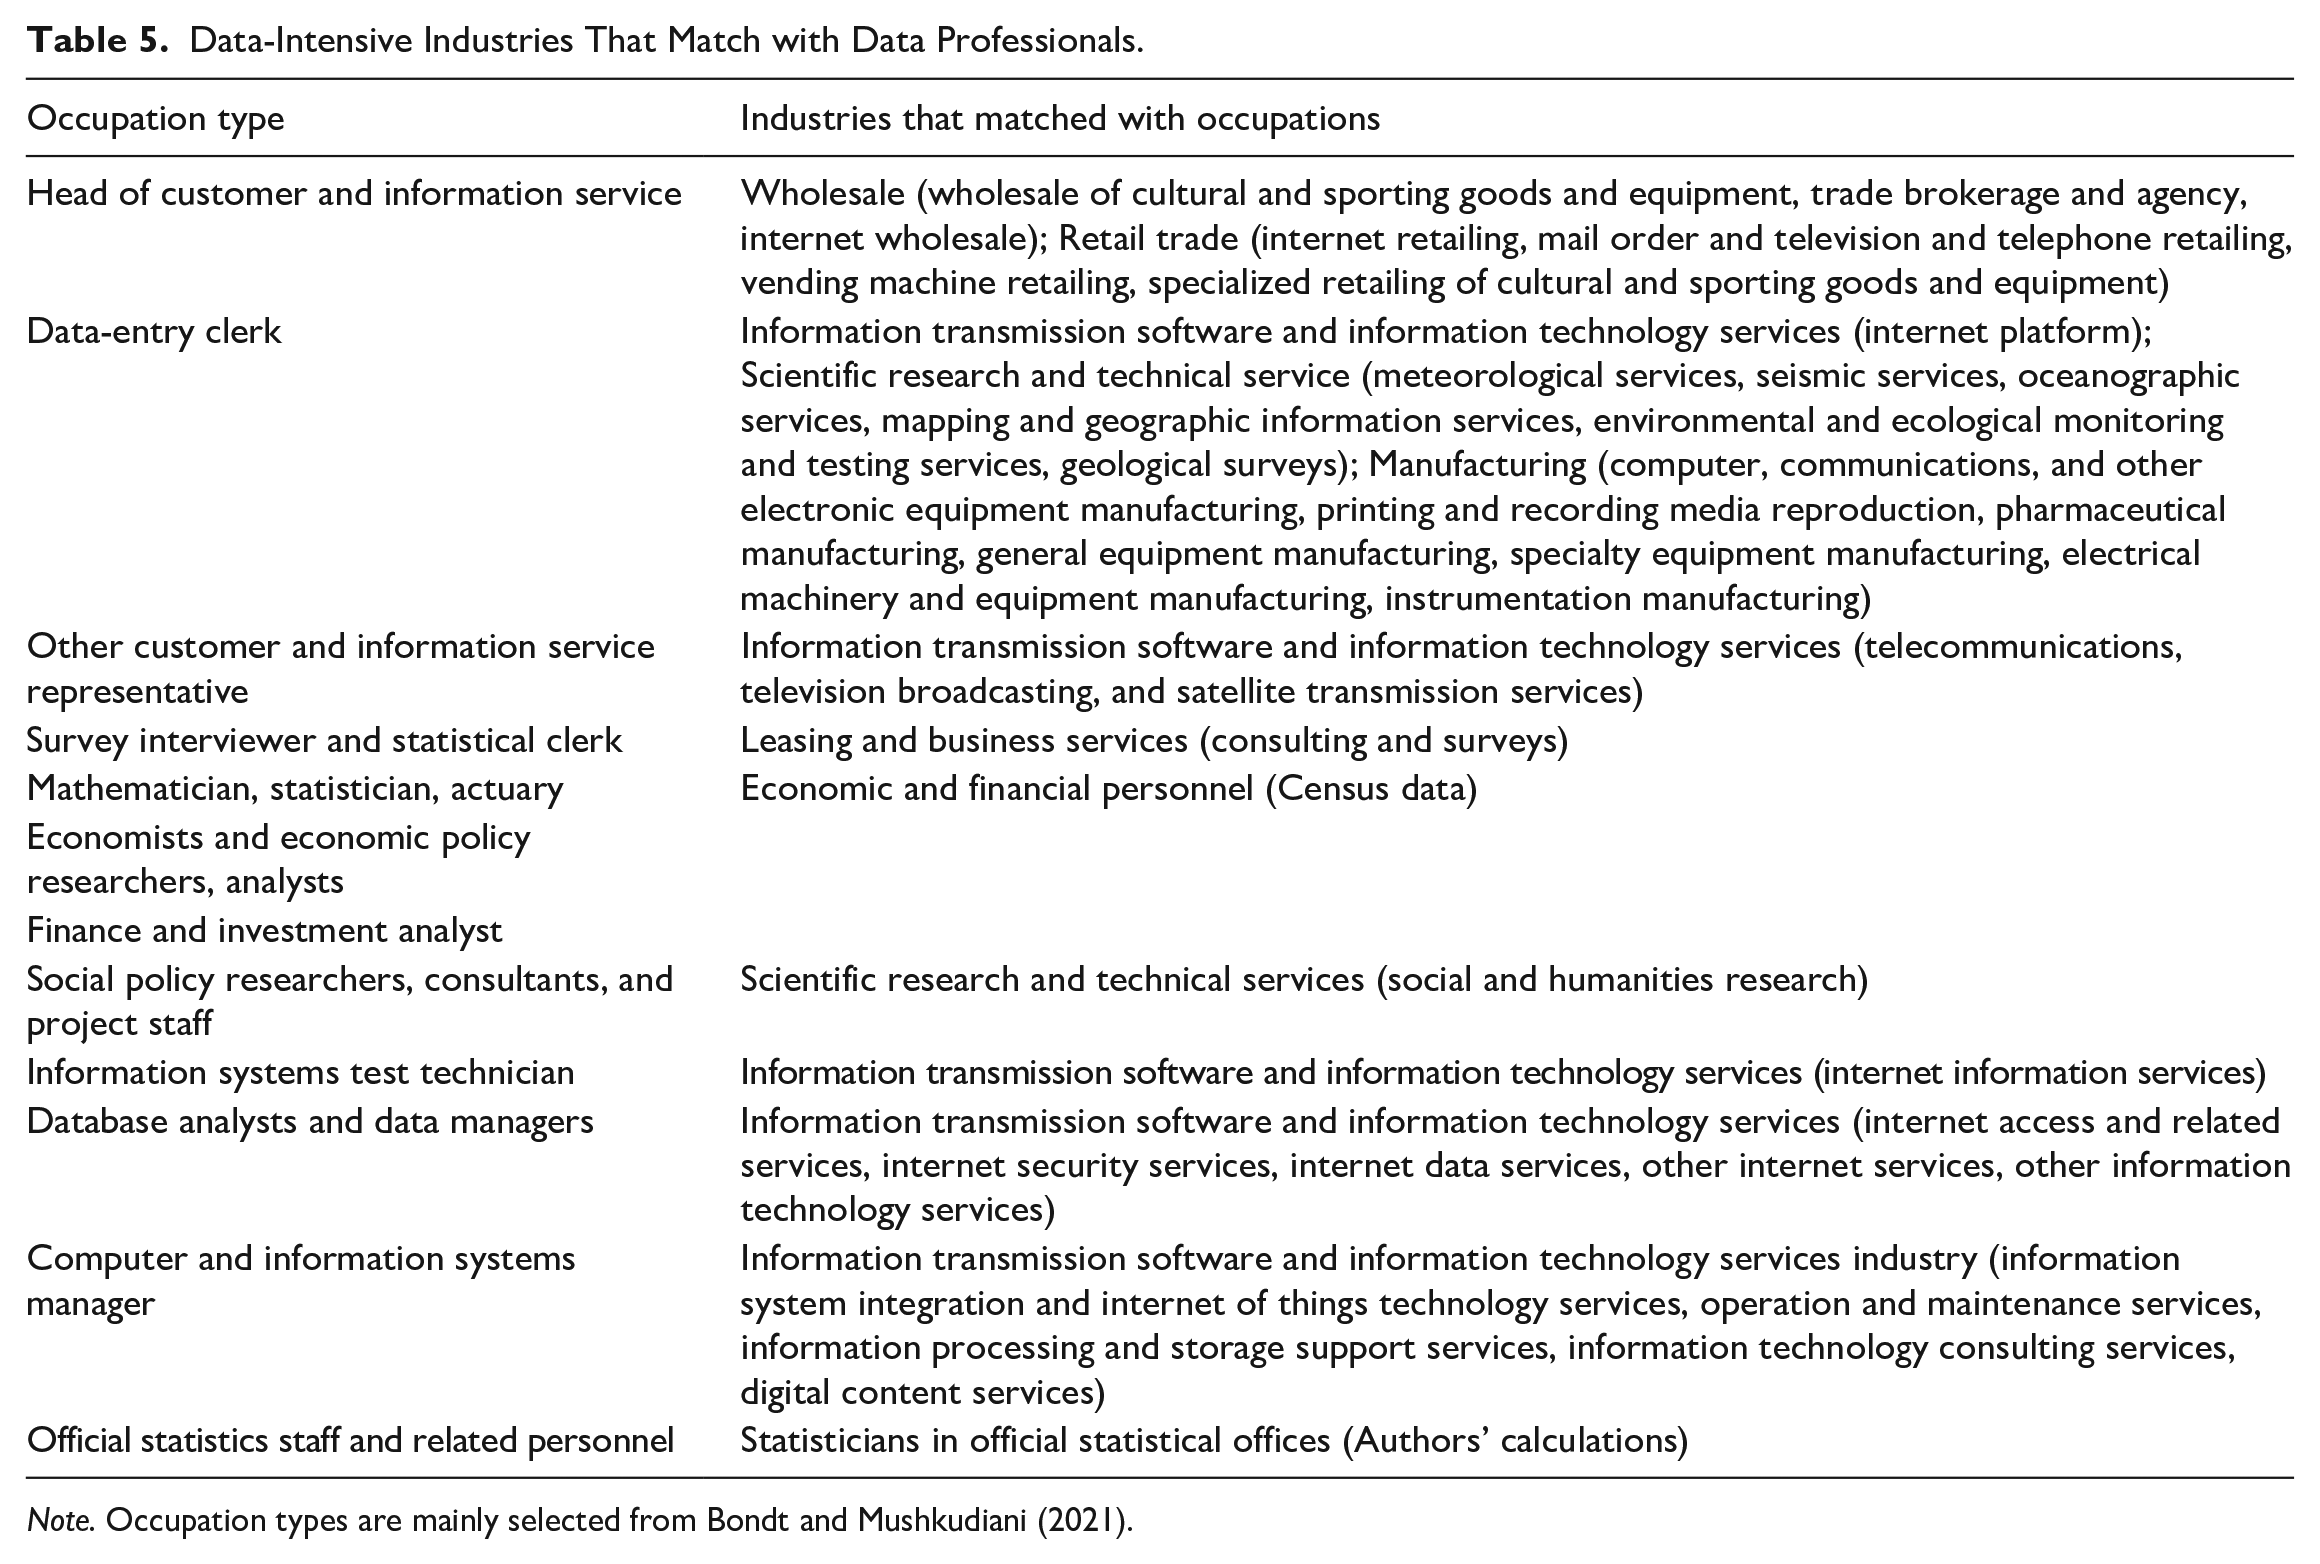
Note. Occupation types are mainly selected from Bondt and Mushkudiani (2021).
5.1.2. Setting the Proportion of Labor Time
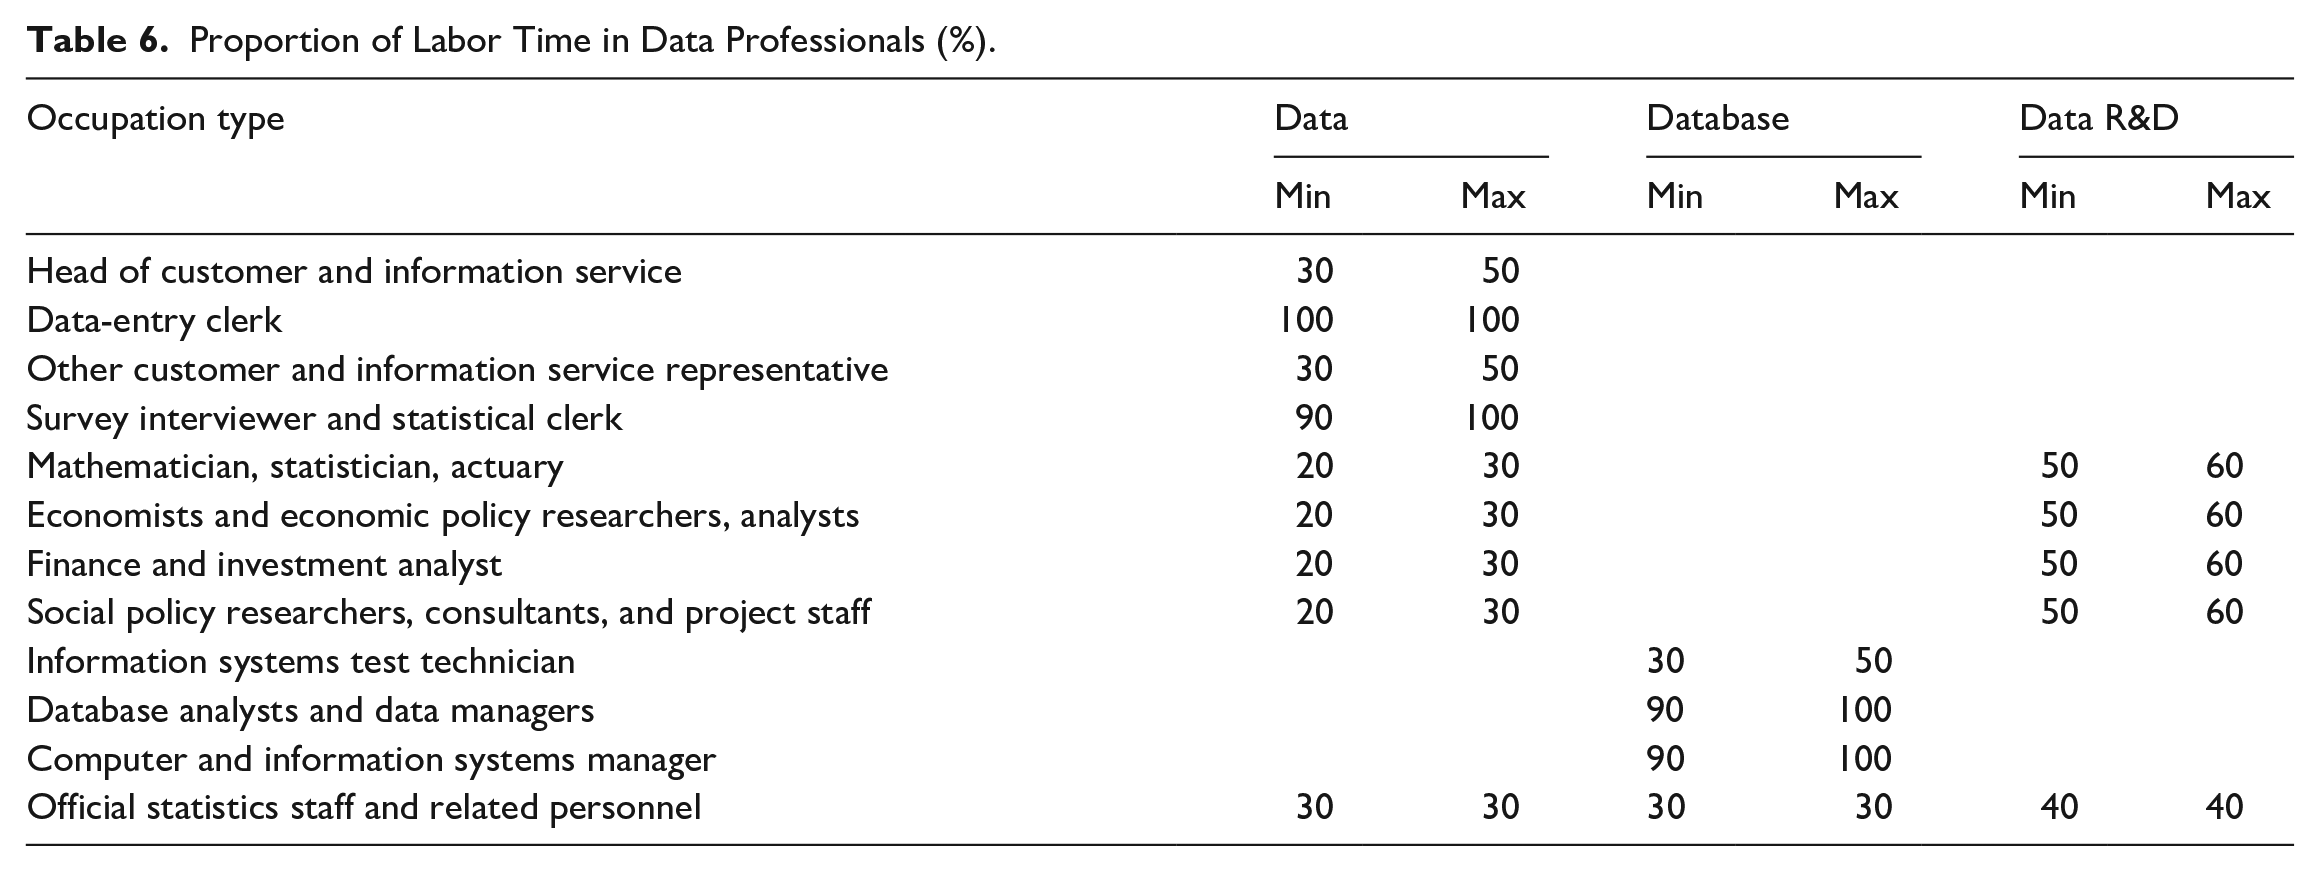
Following the experiences from Statistics Canada and Statistics Netherlands (Bondt and Mushkudiani 2021), this paper matches the relevant data-intensive industries in China with the data professionals in Canada and Netherlands, and uses the data on the proportion of labor time for data professionals to calculate data production in China (Table 6).
Proportion of Labor Time in Data Professionals (%).
5.1.3. Specific Measurement Treatments
The sizes of employees in data-intensive industries are mainly estimated from matching and projecting using data from the Economic Census except for economic and financial personnel. In particular, this paper uses the proportion of data professionals in specific industries from the Fourth Economic Census (2018) and the number of urban employment personnel in different industries in the China Statistical Yearbook for the relevant years, to estimate the size of data professionals from 2019 to 2022. Similarly, the sizes of data professionals from 2010 to 2013 are extrapolated by using data from the Third Economic Census (2014). The sizes of data professionals for 2014 to 2017 are extrapolated by using data from the Third Economic Census (2014) and the Fourth Economic Census (2018). Due to the lack of specific data, 50% of employment in the selected manufacturing industries are set to be data professionals. The labor input for data production can be measured based on the percentage of data labor time in each industry and the corresponding wage level.
5.1.4. Measurement of Capital-Labor Ratios and Comprehensive Cost-Plus Coefficients
Based on the estimation of labor input in the process of data production, this paper mainly uses the financial indicators of listed companies to measure capital input by measuring the proportional relationship between capital input and labor input. According to the industry classification catalog of China Securities Regulatory Commission in 2012, the data of listed companies in information and communication technology service industry are selected, and the average proportion of capital and labor input in each year is calculated by using the data of “cash paid for purchasing and constructing fixed assets, intangible assets and other long-term assets” and “cash paid to employees and for employees” in the capital flow statement. At the same time, according to the data of total operating income and total operating expenditure of sample companies, the average proportion of total cost plus in each year is calculated (Table 7). Relevant data are all from the China Stock Market & Accounting Research Database, and the sample companies with missing data are eliminated.
Capital-Labor Ratios and Comprehensive Cost-Plus Coefficient.
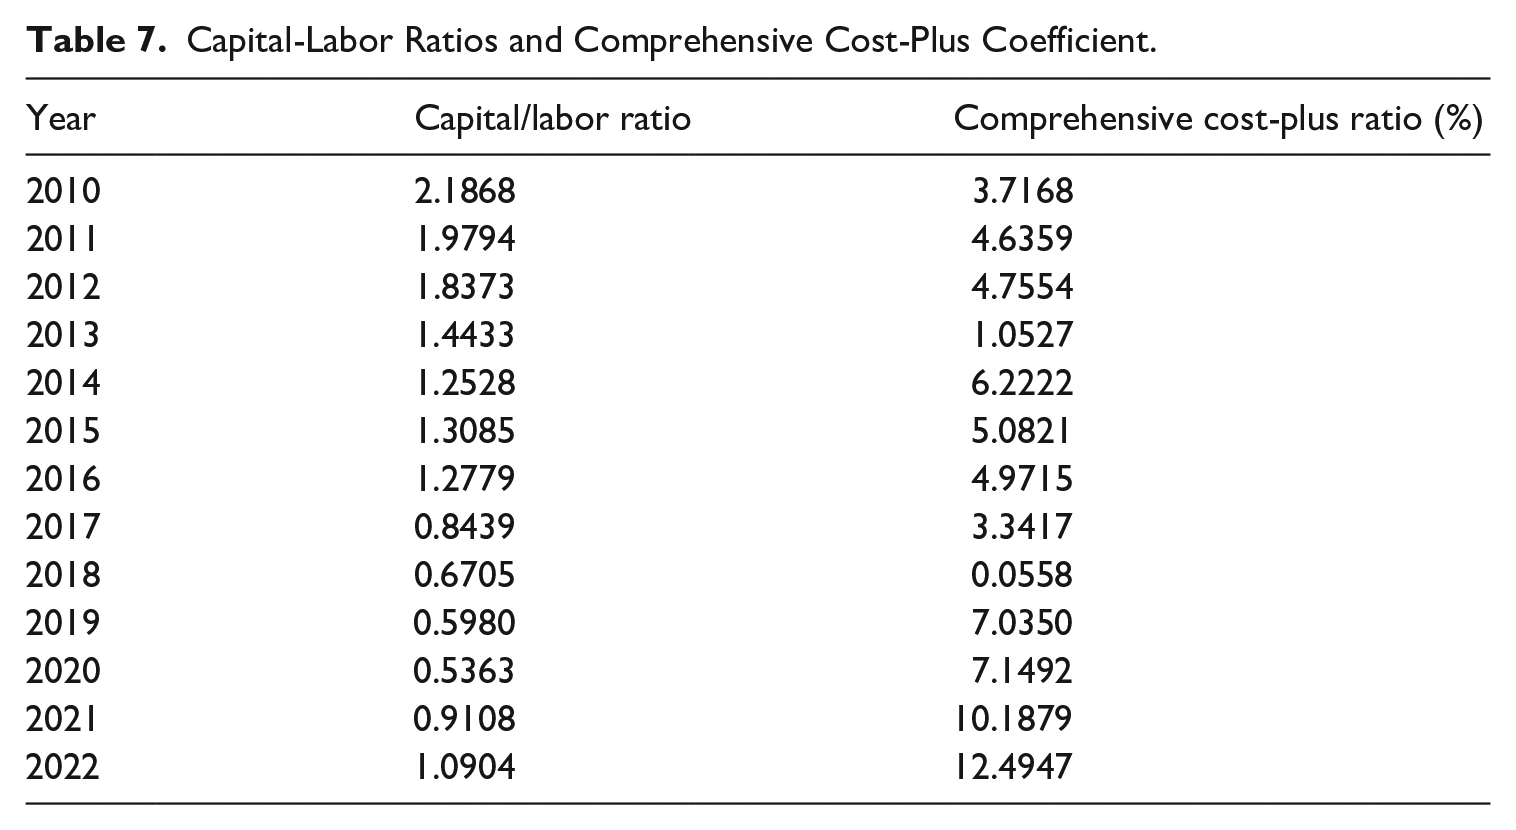
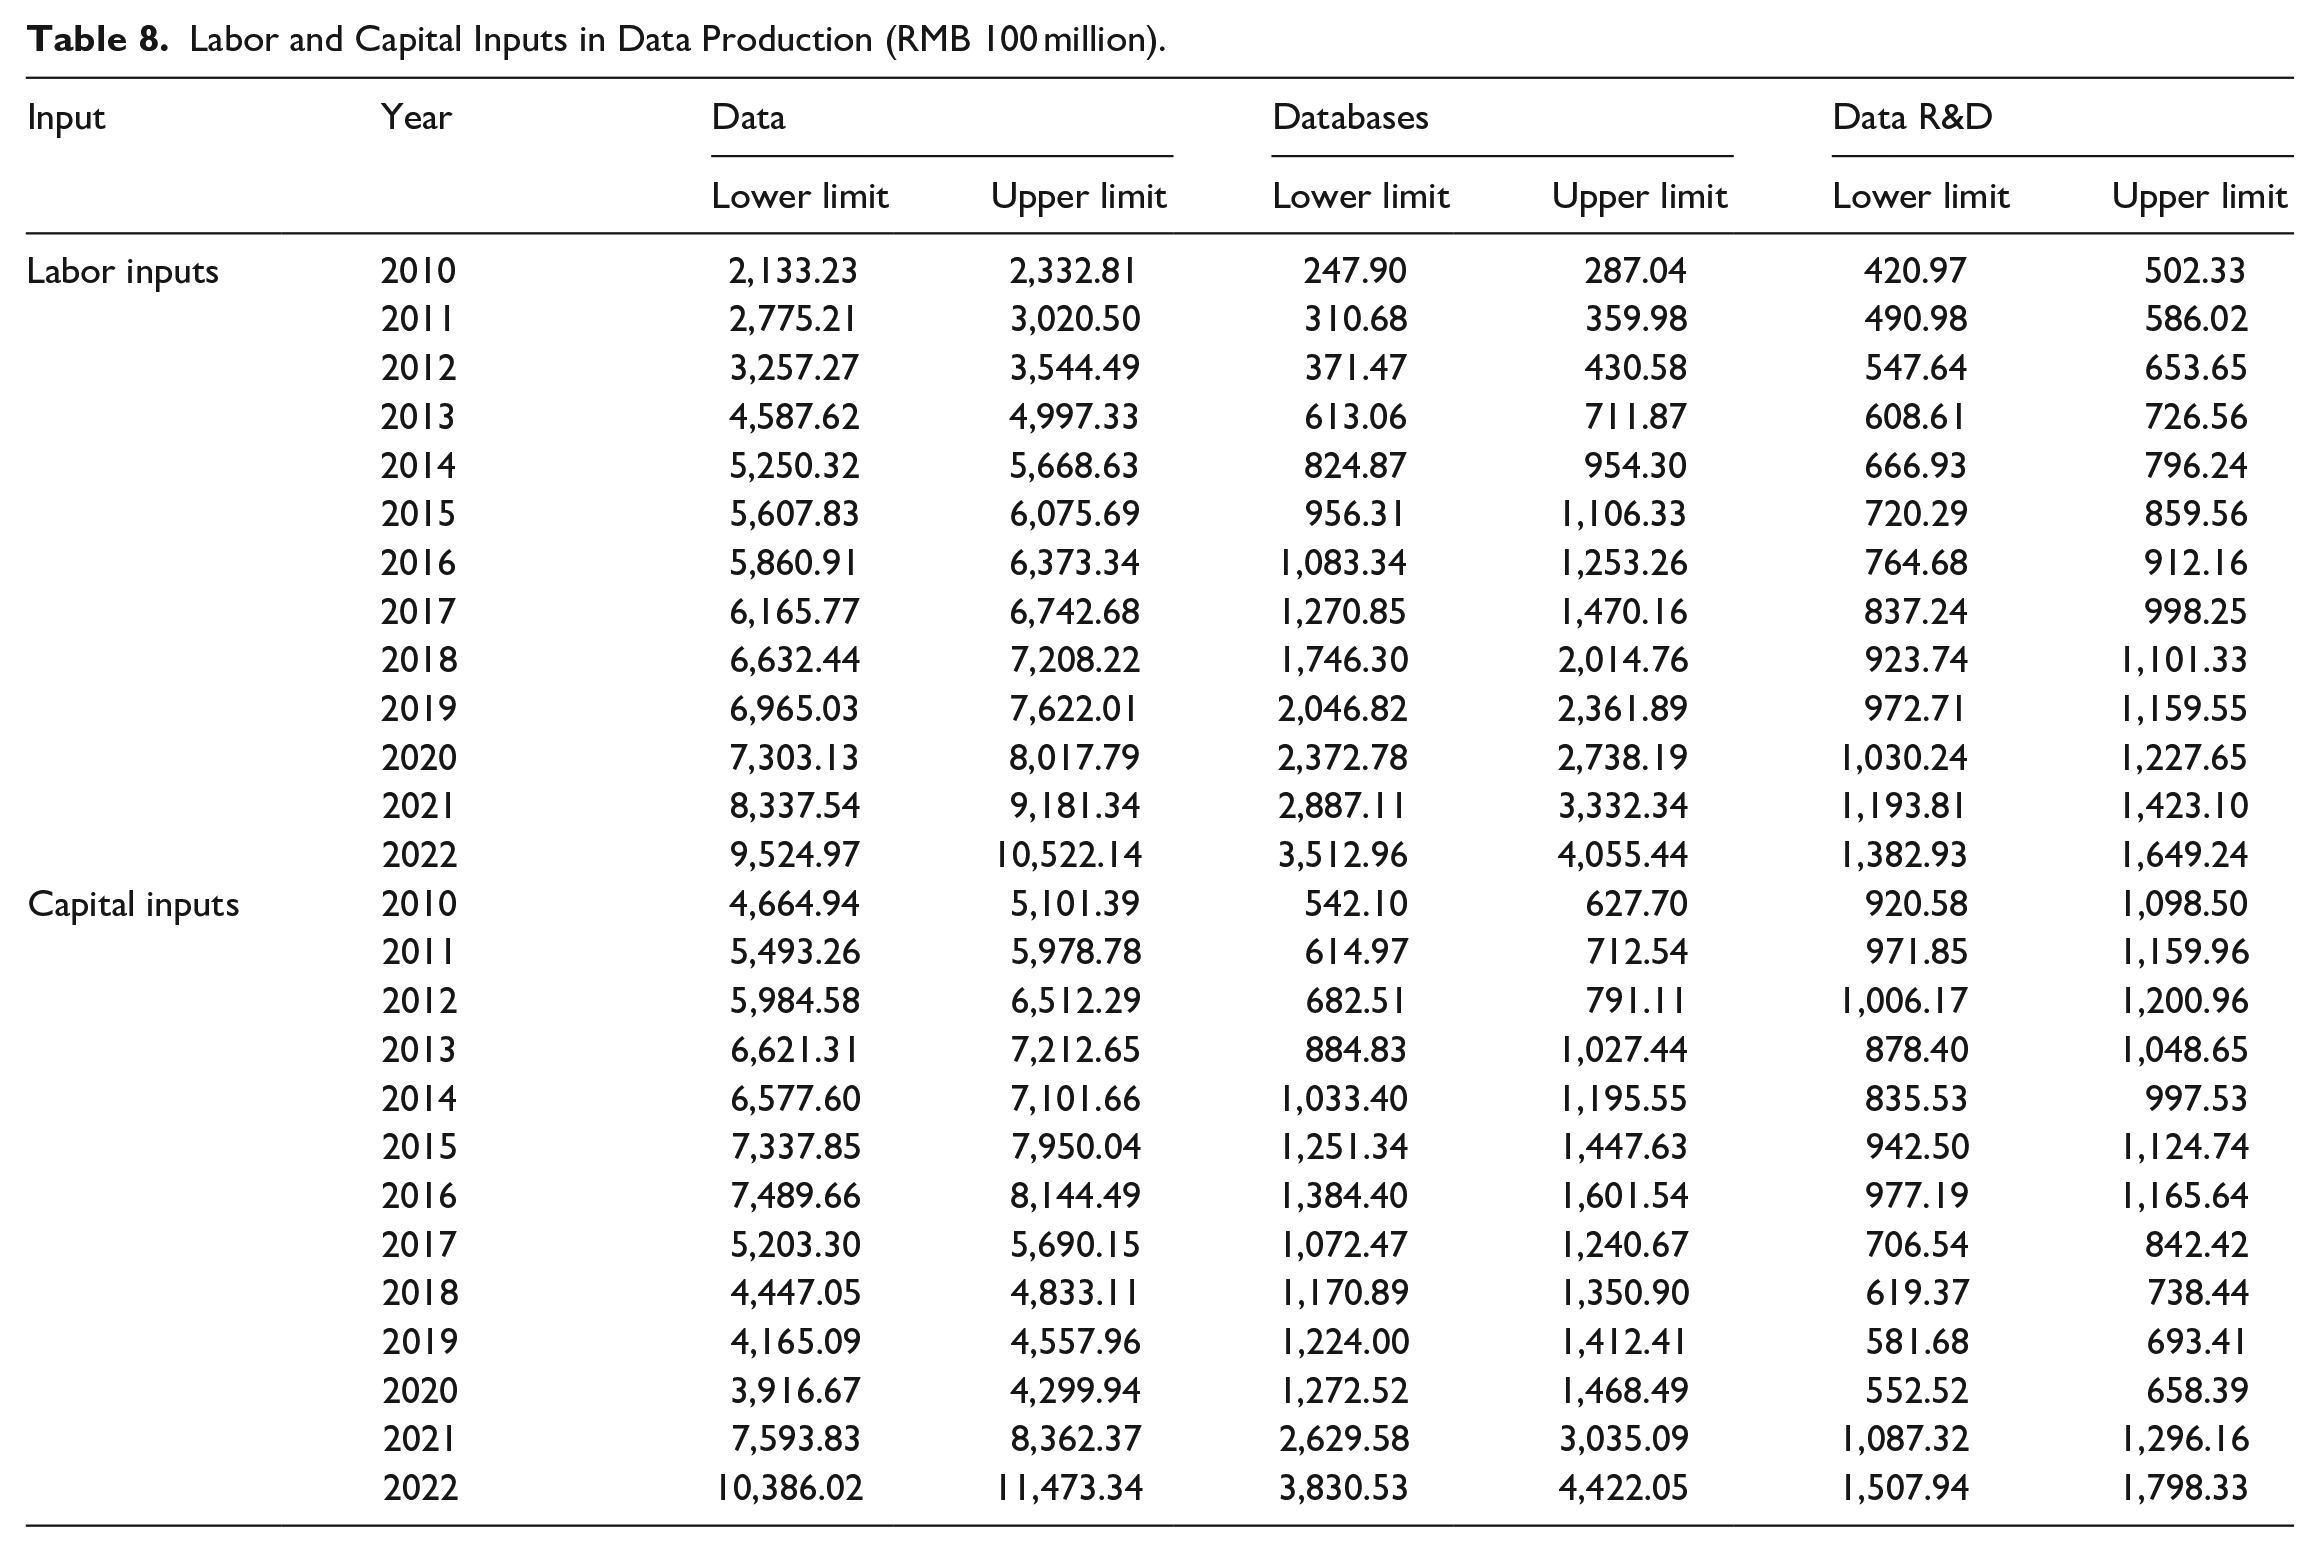
In view of the fact that the capitalization accounting of database has not been brought into the statistical practice in China at this stage, and it is difficult to measure the investment in data science alone, we will not exclude the investment in data R&D from the R&D investment. This paper holds that, except for professional data investigation companies, database development institutions, and data service companies, most data products and data science activities are the accompanying links of production. Although specialized data production activities overlap with other production activities in terms of expenditure, from the perspective of value creation, the same expenditure also creates new data value, and the relevant DF value is not included in the current accounting framework. Therefore, cost-based asset value accounting is not duplicated with the traditional fixed asset accounting. The results of labor and capital inputs in data production are shown in Table 8.
Labor and Capital Inputs in Data Production (RMB 100 million).
5.2. Measurement and Testing of Data Capital Formation
5.2.1. Measurement Results of Data Capital Formation
Table 9 is the measurement results of the scale of data capital formation in China. In 2020, the scale of data capital formation was RMB 1.76 to 1.97 trillion, accounting for 1.74% to 1.95% of GDP. On the one hand, the average “capital/labor” ratio calculated in this paper is 1.0061, and the average total cost plus ratio is 4.76%. In comparison, the other costs set by Statistics Canada account for 50% of the total salary, and the related cost plus ratio is 3%. Comparatively speaking, the proportion of capital investment in data asset production in China is higher than that in Canada, and the cost-to-output ratio is also higher than that in Canada. On the other hand, according to the calculation results at the corresponding time point, the related data investment in Canada in 2018 was CA$ 29.455 to 40.025 billion (current-year price). According to a comparison of the data converted at the exchange rate in 2018 (CAD/CNY = 5.1030), Data investment in Canada was significantly lower than that in China.
Data Capital Formation in China Based on the Cost Method (Current-Year Price) (RMB 100 million, %).
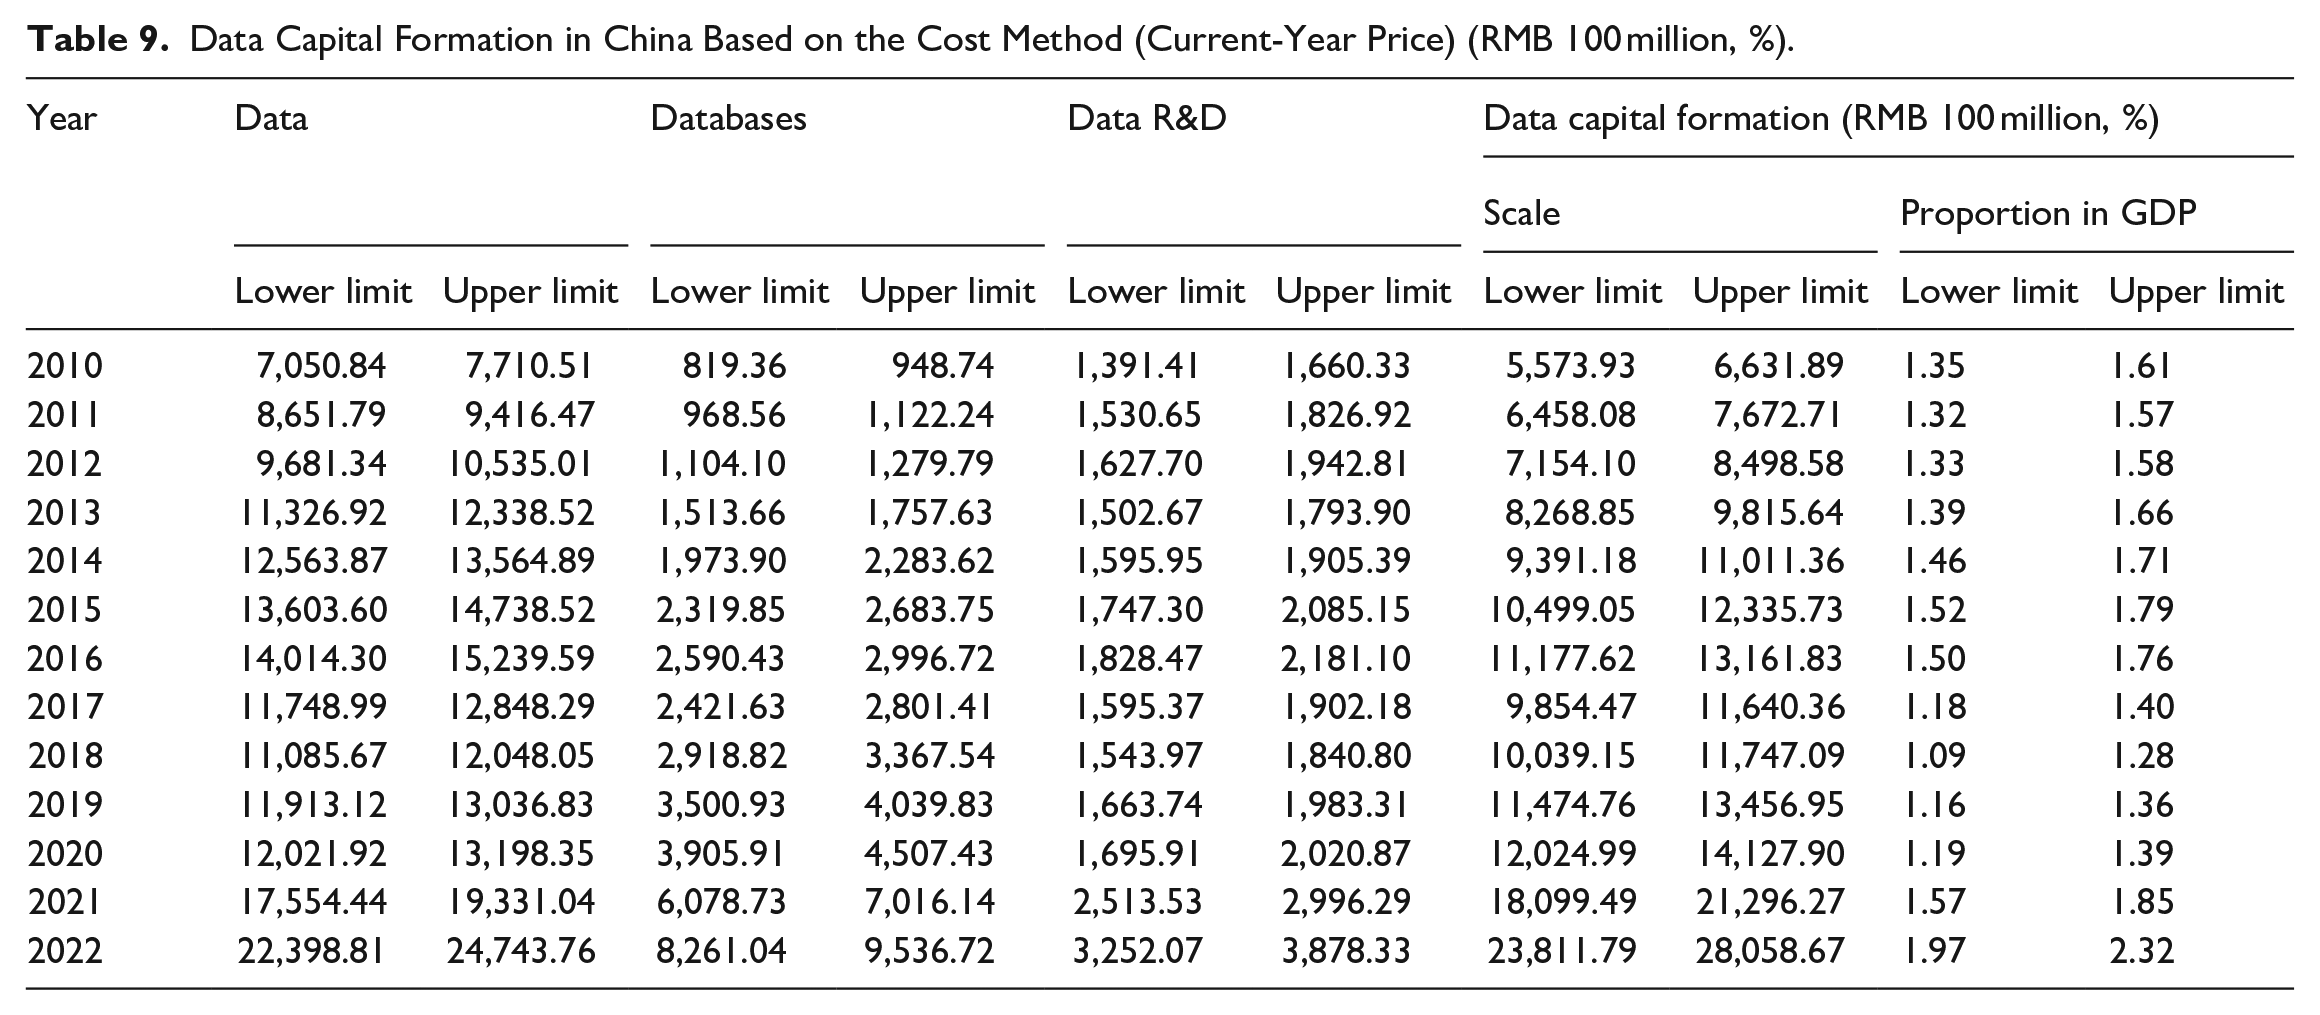
In view of the availability of data, this paper estimates the calculation results for 2021 to 2022. Affected by change in the value of capital/labor ratio and the proportion of total make-up, the calculation results of data capital formation in 2021 to 2022 achieved great growth, showing a high growth trend of DF investment. Especially in the context of COVID-19, the “home economy” such as online shopping and online entertainment rose rapidly and new business forms such as telecommuting and online education emerged one after another. The role of AI technology began to play in role mainly in collecting information and supporting resumption of work and production. Traditional industries actively explored Internet transformation and jointly promoted the rise of ICT-related industries. As can also be seen from the results in Table 9, the proportion of data capital formation in GDP increased significantly in 2021 to 2022.
5.2.2. Reliability Test of Measurement Results
According to the pilot survey of data asset statistics carried out in Shenzhen in recent years, the reliability of the above empirical calculation results is tested from the aspects of data asset scale ratio and enterprise concentration.
Firstly, according to the results of the pilot survey in Shenzhen (Liu 2023), taking Nanshan District as an example, the proportion of DF expenditure in GDP exceeded 4.6% in 2020. The paper finds that proportion of data capital formation in GDP in China is lower than that in Nanshan District. The main reason is that there are a large number of listed companies, Internet companies, and information technology service providers in Nanshan District, Shenzhen, with a large number of data practitioners. Since it is one of the main areas with intensive DF in China, the proportion of data capital formation in GDP is higher than the national average.
Secondly, according to the pilot survey in Shenzhen, more than 98.5% of DF expenditure in Nanshan District occurred in the top 10% of enterprises, and the data expenditure was mainly for self-use. It can be seen that the empirical calculation based on the cost method is reasonable and reliable.
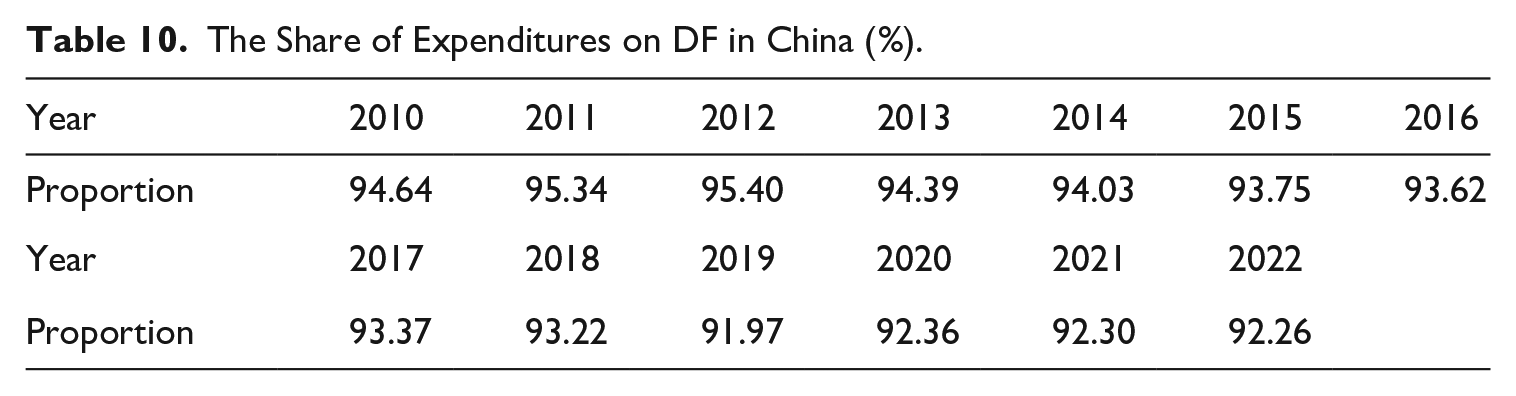
Thirdly, according to the DF expenditure survey in Shenzhen in 2021, about 93.2% of DF expenditure mainly occurred in information transmission, software and information technology services, manufacturing, finance, wholesale and retail enterprises, and mainly in information transmission, software and information technology services. According to the measurement in this paper, the percentage of DF expenditures of the above industries included in the measurement each year is close to the results of the survey in Shenzhen by excluding public officials engaged in statistical work (Table 10), which further verifies the overall reliability of the data capital service calculation in this paper. In addition, the Shenzhen survey also shows that the ratio of DF expenditures to operating revenues in the manufacturing sector is about 1.08%, while the DF expenditures of the manufacturing sector in 2021 (adjusted by the comprehensive markup) measured in this paper is 0.976% of operating revenues in the same year. The two ratios are very close.
The Share of Expenditures on DF in China (%).
5.3. Calculation of Capital Stock
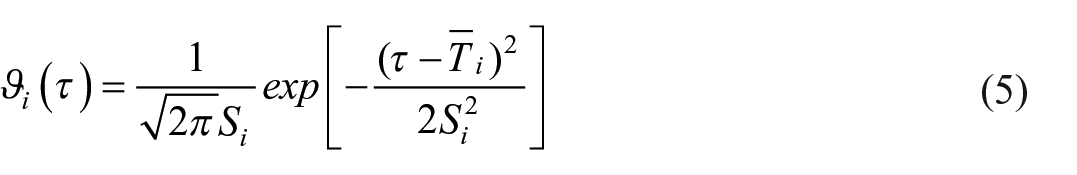
Formula (5) is used to calculate the data capital stock here, and the key factors are dealt with as follows:
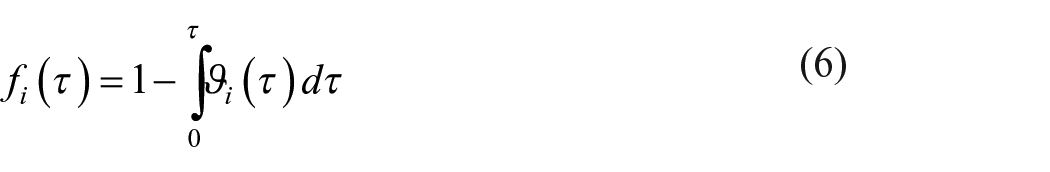
5.3.1. Retirement Model
The normal bell model is chosen here, which is one of the most commonly used models in theoretical research and statistical practice. If the retirement model of capital goods is represented by
Wherein,
5.3.2. Value Model
The geometric value model is chosen here, which is characterized by assuming that the efficiency of capital goods declines at a constant rate δ.

Where in,
5.3.3. Investment Flow Treatment
The fixed assets investment price index is used to treat
5.3.4. Calculation of Initial Capital Stock
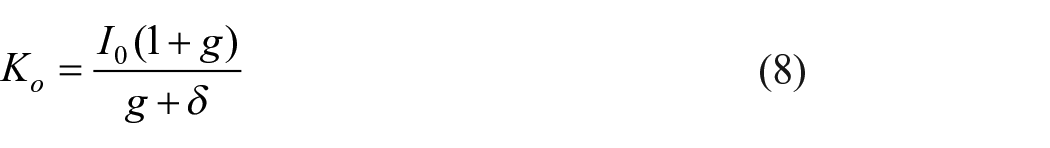
Formula (9) is the basic calculation principle. Wherein,
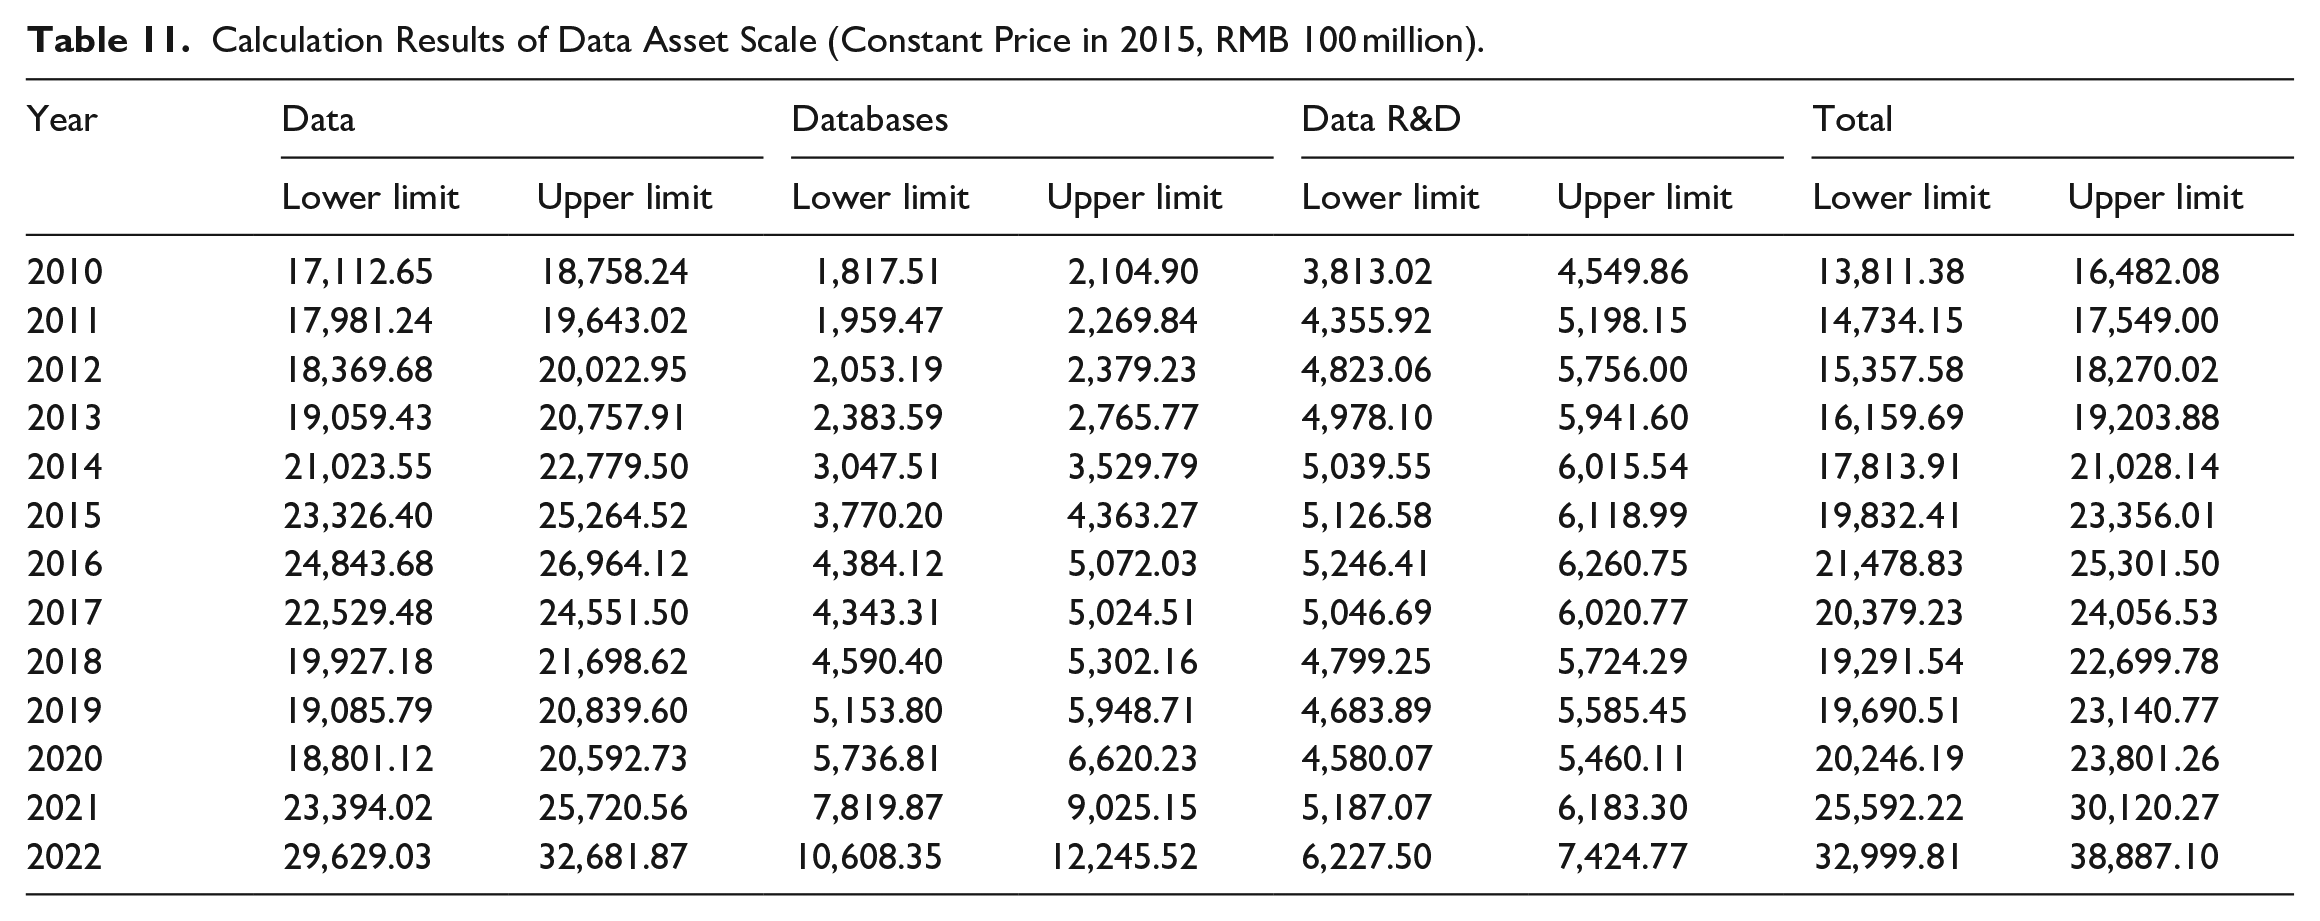
The results of data capital stock as wealth calculated based on perpetual inventory method are listed in Table 11. In 2020, China’s data capital stock as wealth was RMB 2.91 to 3.27 trillion, accounting for 3.20% to 3.59% of the GDP in 2020 (constant price in 2015). Compared with Canada, according to the calculation results at the corresponding time point, the relevant data capital stock in Canada in 2018 was US$ 157.067 to 217.659 billion (current-year price). According to the exchange rate of that year, Canada’s data capital stock as wealth was significantly lower than China’s in the same period. Compared with the results of prior research, this paper’s calculation results of data assets in 2019 are lower than those of Xu and Zhao (2020), which directly used Canada’s capital cost ratio and comprehensive make-up ratio, and did not take China’s actual situation into full consideration. Extrapolating the calculation results to 2022, it is obvious that the data capital stock also increased significantly. In 2022, the scale of capital stock as wealth reached RMB 4.65 to 5.24 trillion, equivalent to 4.57% to 5.15% of GDP in that year (constant price in 2015).
Calculation Results of Data Asset Scale (Constant Price in 2015, RMB 100 million).
6. Revelatory Conclusions
The key to measure the value of DF from the perspective of macro-accounting is to clarify the theoretical mechanism of accounting and the methodological path of accounting. Focusing on the capitalization accounting of DF, this paper expounds the basic theory of VADF from the aspects of concept definition, statistical classification, DF value source, accounting object and scope, and designs an accounting path that covers “cost → input → output → capital formation → data assets,” and improve the cost method centered on “value appreciation.” This paper also carries out the empirical measurement of China’s data capital and data asset scale from the perspective of matching the classification of data-intensive industries and data professionals, which verifies the rationality and self-consistency of the theoretical and methodological research in it. This paper’s research and exploration can provide theoretical reference for VADF to be included in the basic framework of SNA. The empirical research paradigm adopted can also provide reference for relevant countries in development of CADF.
Footnotes
Funding
The author(s) disclosed receipt of the following financial support for the research, authorship, and/or publication of this article: This work was supported by the National Social Science Foundation of China (No. 23BTJ009).
Received: July 2023
Accepted: March 2024