
Abstract
The first key use of a nation’s Census is to count its resident population. A Census will have counting errors, often referred to as over-coverage and under-coverage. So it is common practice in many countries to conduct an independent count of its residents, a so-called coverage survey, and estimate or adjust for these counting errors within the capture-recapture framework. In recent times, many censuses and coverage surveys have faced challenges in counting the population efficiently and effectively due to rising costs, declining response rates, and respondent burden. This has led to a shift toward exploring the role that administrative registers could play in counting the population within the capture-recapture framework. Administrative registers are relatively inexpensive and can have high coverage of a nation’s population. This paper explores methods to overcome common problems with the use of administrative registers within this framework, including linking errors and scoping the register to only capture residents. These methods are empirically assessed in the context of the Australian population.
1. Introduction
1.1. Background
The first key use of a nation’s population Census, and one that we focus on here, is to count its resident population. However, the count of Census responses is not equal to the count of residents (or in-scope individuals), according to the definition adopted by the Census. For instance, someone who is not present in the country on census night might be counted or a resident present in the country might not be counted. Over-coverage error in the count occurs if an out-of-scope individual is counted, that is, erroneous enumeration, or if an in-scope individual is counted more than once (e.g., two Census forms may be submitted for the same person). Under-coverage occurs if an in-scope individual is not counted (e.g., non-response).
It is common practice in many countries to conduct an independent count of residents, a so-called coverage survey, and estimate or adjust the census under-count within the capture-recapture framework. (A separate sample survey of the census returns may be deployed to deal with the erroneous enumeration error.) In the original development of capture-recapture methods in application to wildlife population measurement, animals were captured, marked, and recaptured resulting in two incomplete lists of the population: one list is used to estimate the capture rate of the other list and the estimate of the population count is equal to the count of a list divided by its estimated capture rate.
Estimation of the unknown population size relies on a set of intertwined assumptions so that a failure of any one can invalidate the others leading to biased estimates (International Working Group for Disease Monitoring and Forecasting 1995; Zhang 2019a). These assumptions are:
no change in the population between captures (i.e., the population is closed, or there is no in- or out-migration)
individuals can be matched from capture to recapture (without error)
homogeneity of capture or recapture (i.e., on each sampling occasion all individuals have the same capture probability)
independence between the capture and recapture processes.
While it was recognized from the earliest papers (e.g., Sekar and Deming 1949) that, in applications to human populations, the failure of the distributional assumptions about the capture-recapture events leads to incorrect population estimates, it was not until later that it was termed “correlation bias”. They also noted that this bias can be as a result of two types of dependence
List dependence: the act of being included in the first list makes an individual more or less likely to be included in the second list, that is, inclusion in the first sample has a causal effect on inclusion in the second sample. This is sometimes referred to as causal dependence (Wolter 1986).
Heterogeneity: even if the two lists are independent, the lists may become dependent if the capture probabilities are not the same (i.e., not homogenous, or are heterogenous) amongst individuals. This is sometimes referred to as apparent (or autonomous) dependence (e.g., Coull and Agresti 1999; Wolter 1986).
In official statistics, capture-recapture methods are commonly referred to as Multi-System Estimation (MuSE). In census applications there are often only two captures or lists (Dual System Estimation, DSE), namely the Census and coverage survey. For country specific studies, see for example, Thomas (2008) for the USA, Brown et al. (2011) for the UK, Chipperfield et al. (2017) for Australia, Statistics Canada (2019), and Statistics New Zealand (2019, 2020). Use of three (Triple System Estimation, or TSE) or more lists to some degree allows relaxation of the list dependence assumption. See Nirel and Glickman (2009) for an overview and see Zaslavsky and Wolfgang (1993), Darroch et al. (1993), Baffour (2009), Baffour et al. (2013) and Griffin (2014) and Fienberg (1972), for more specific details about the population estimation.
In recent times, censuses have faced challenges in counting the population efficiently and effectively, due to its cost, declining response rates, respondent burden, and its ability to correctly measure complex living arrangements. This has led to a shift toward reliance on administrative registers: by 2010 there was a clear shift toward register-based censuses in countries such as Switzerland, Netherlands, Belgium, and Slovenia (Skinner 2018). For other countries, engaged in their respective census transformation programs, this led to considering the possibility of replacing the traditional coverage survey or Census with administrative registers. For example, the Central Bureau of Statistics of Israel conducted a Register Survey for its current round of population census (see also Bernardini et al. 2022; Zhang 2022), Office for National Statistics (2013, 2017) and ISTAT discuss replacing a Census with administrative registers. Natural disasters (e.g., Covid-2019) have led to the delay of censuses in many nations. In contrast, other countries (e.g., Scandanavian) have long-standing practices of register-based censuses and so are not under the same contemporary pressures.
In the context of official statistical agencies using registers (Zhang 2019a, 2022) for MuSE, two preconditions are critical:
lists contain no erroneous enumeration or duplicates,
no errors occur in the linkage of the lists
These errors are far from trivial in official statistics if one lacks a centralized population register and its unique person identification number (such as the case in the Nordic countries) which can be used to link all the lists. These are discussed in more detail in the context of this present study below.
Though not our perspective here, the on-going development of completely register-based population size estimation methods should also be mentioned. Statistics New Zealand (2021) counts the number of administrative records that have a level of activity that is consistent with a resident, though it is experimental at this stage. Statistics Estonia (Tiit and Maasing 2016) and Central Statistical Bureau of Latvia (2019) derive residency scores for an Extended Population Register. Van der Heijden et al. (2022) use four registers to estimate the Māori population in New Zealand. Central Statistical Office of Ireland (Dunne and Zhang 2023) develop a system of population estimates compiled on administrative data only.
1.2. Outline of Study
In the context of Australia, since 1971, the resident population has been estimated by a DSE, using the Post-Enumeration Survey (PES) and the Australian Census of Population and Housing. Much has changed in the data landscape in recent years, most notably the creation of Australia’s “Person Linkage Spine,” or “Spine,” that is the union of three administrative registers from 2006 to present: Medicare (Services Australia), Centrelink (Department of Social Services), and Personal Income Tax (Australian Taxation Office).
This study assesses the role that the Spine could play, within the MuSE framework, to estimate the resident population over the next five to ten years. This assessment is complicated by the fact that the MuSE preconditions mentioned above are not easily satisfied. Erroneous enumeration arises since there is no error-free indicator on the Spine that a record belongs to a resident, however defined.
There are also two problems with linkage at the time of writing this paper:
i. lack of Spine-PES linkage,
ii. false negative of Census-Spine linkage (i.e., missing Census-Spine matches).
Another important issue in our study is when a subpopulation classification variable for Indigenous status is not observed for all records on the Spine. Instead a predicted status is used in MuSEs.
We develop alternative DSE and TSE, where Spine erroneous enumeration is dealt with by trimming (Dunne and Zhang 2023; Zhang and Dunne 2017), and we handle the linkage problems by False-Negative adjustments in estimation. Notice that, while the details differ, Statistics New Zealand (2019) applied a DSE in the presence of similar problems of Spine over-coverage and false-negative Census-Spine linkages, which was an inspiration to our work. We refer to the methods developed and implemented in this paper as a practical approach to MuSE, in the presence of erroneous enumeration and linkage error, noting that there have been some recent developments in the modeling approach to deal with erroneous enumeration and undercounting jointly; see for example, Di Cecco et al. (2018), Zhang (2015, 2019b), and Ballerini (2021). The practical approach to MuSE developed in this paper may be relevant, wherever the investigation is complicated by the failure of preconditions.
The rest of the paper is organized as follows. In Section 2 we set out the basics of MuSE and, in particular, the notations for DSE and TSE, where the preconditions are assumed to be satisfied. In Section 3, we detail the methods for dealing with the Spine erroneous enumeration and linkage problems, as well as the estimation of subpopulation. A case study applying these methods in combination with the Australian Census and PES in 2016 is presented in Section 4. Some final remarks and future research topics are given in Section 5.
2. Basics of MuSE, DSE, and TSE
We consider a closed population with (unknown)
The target parameter of MuSEs is
Under this framework, the goodness of fit of alternative models can be formally tested, although a good fit does not guarantee the validity of a given model. Typically in MuSE, the best model is taken to be the one with the fewest possible parameters that allows for some dependency amongst the lists. This model is then used to predict the missing cell count, and subsequently estimate the population size. Note that the motivation for selecting the most parsimonious model is to reduce the variance of the estimator of
Below we describe some necessary details of the DSE and TSE for this study.
2.1. DSE
Here there are two incomplete lists of units that cover to the target population. For argument’s sake call one the S-list and the other the C-list. Let
Two-List Counts,
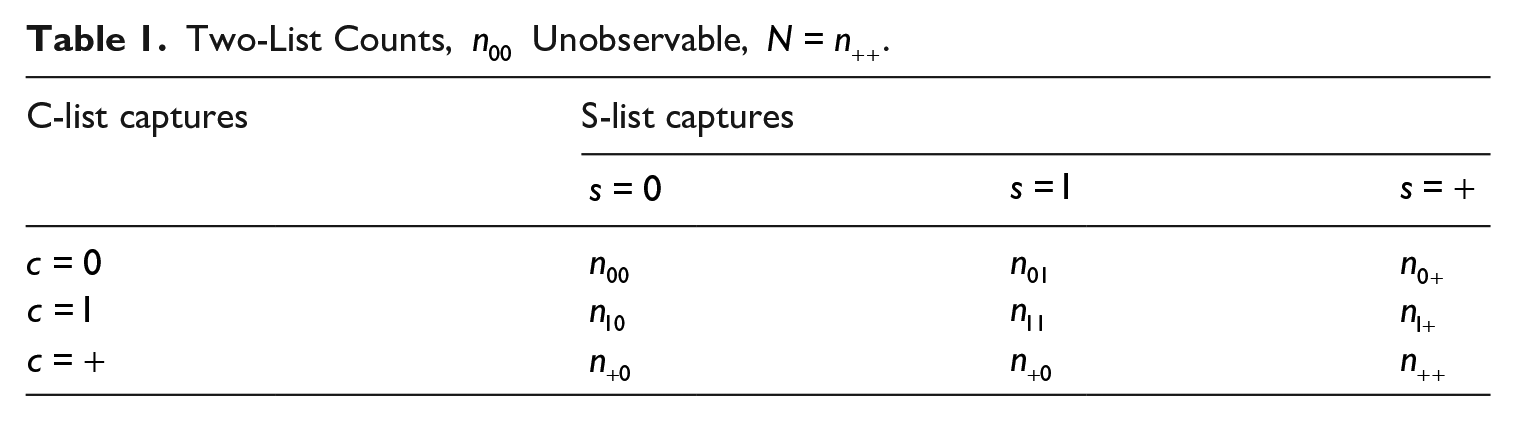
Now, provided the first precondition holds, the population can be regarded as closed since each record on a list belongs to one and only one unit in the target population. That is, there are no units on a list that are outside the target population. Provided the second precondition holds, the count

If we let µ
CS
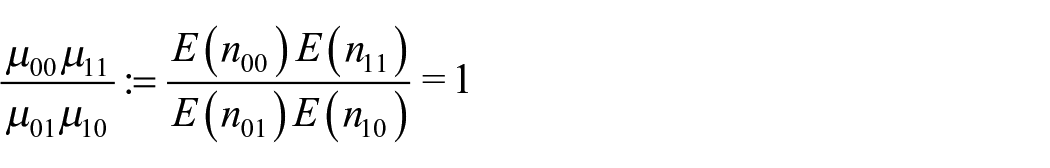
and an mestimator of µ00 is µ
As noted by Zhang (2019a), the same

such that

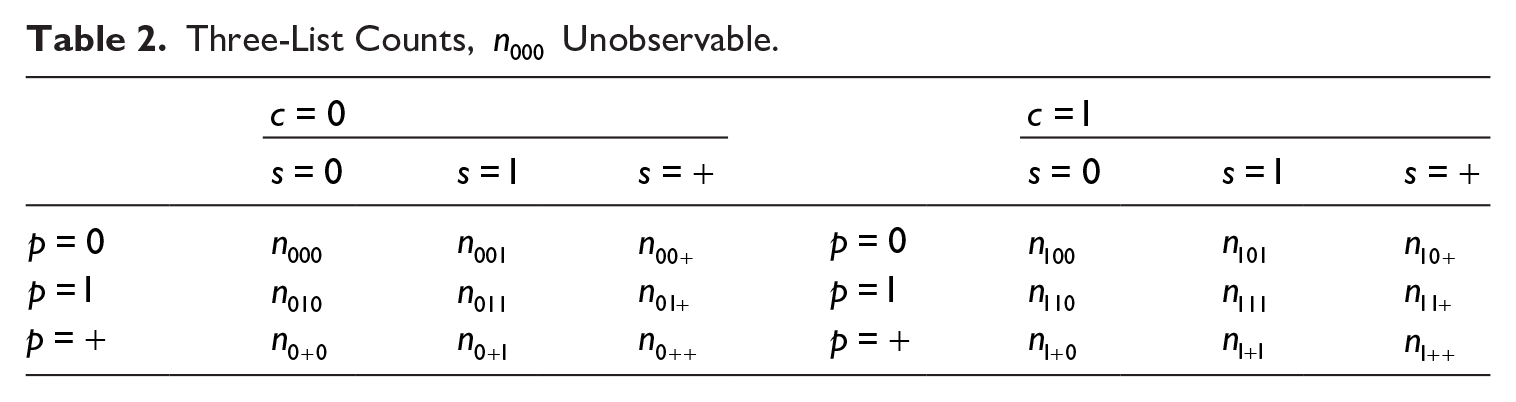
2.2. TSE
Now we bring in a third list, called the P-list. Let
Three-List Counts,
Let

where
When we have an incomplete 2 × 2 × 2 contingency table, with m000 for the unobserved (“missing”) cell, the saturated model is not identifiable in that we have eight parameters but seven observable cell counts. The implication of considering only hierarchical models, is that the highest order interaction, the three-way term

Given
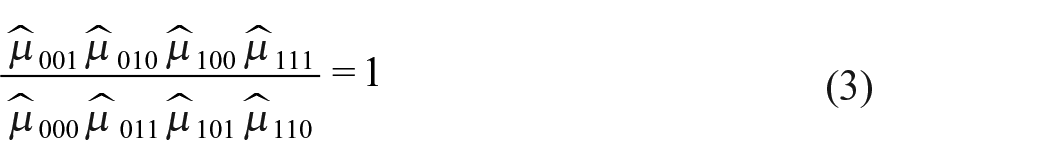
where
Moreover, it now becomes possible to define various unsaturated hierarchical models by setting some of the rest
3. Methods
For this study MuSE preconditions involving the Spine are initially unsatisfied. Below we describe how to deal with this, as well as the models for the TSE without the Spine-PES linkage.
3.1. Trimming the Spine
The PES and Census collect information on whether a person is a resident, so as to exclude nonresidents from official resident counts. However, the Spine does not have residency status for all the records and so will include nonresidents. For example, a person may have emigrated from Australia a year before Census but, for various administrative reasons, their migration record was not linked to the Spine to reflect this. An easy way to trim the erroneous records on the Spine is to apply common sense rules (e.g., must have had at least two signs of administrative activity in the last six months). We apply a more refined scoring approach described below.
Let
As
We scale
Having prepared the scores

where
Notice that by using a model estimated from the Spine-Census linkage, as described above, one is introducing a dependence between the trimmed Spine and the Census via the model parameters. That is, for any target population unit, its inclusion indicators in the two lists will no longer be exactly independent, assuming they were independent without trimming. However, by and large this dependence can be ignored since the trimming induced covariance of the two indicators is of the order
We shall refer to the trimmed version of the Spine as SpineSure when describing the estimates to be evaluated in Section 4. Whereas, the term Spine is used in the rest of this Section for simplicity, where by stipulation all the lists are free of erroneous enumeration, such as when next describing the models for three-list capture-recapture data.
3.2. TSE Models Without Spine-PES Linkage
Let
Given the Census-Spine linkage and the Census-PES linkage, but not the linkage between Spine and PES, the counts
Cross-Classified Counts Without Spine-PES Linkage, All Counts in Parentheses Are Unobserved.
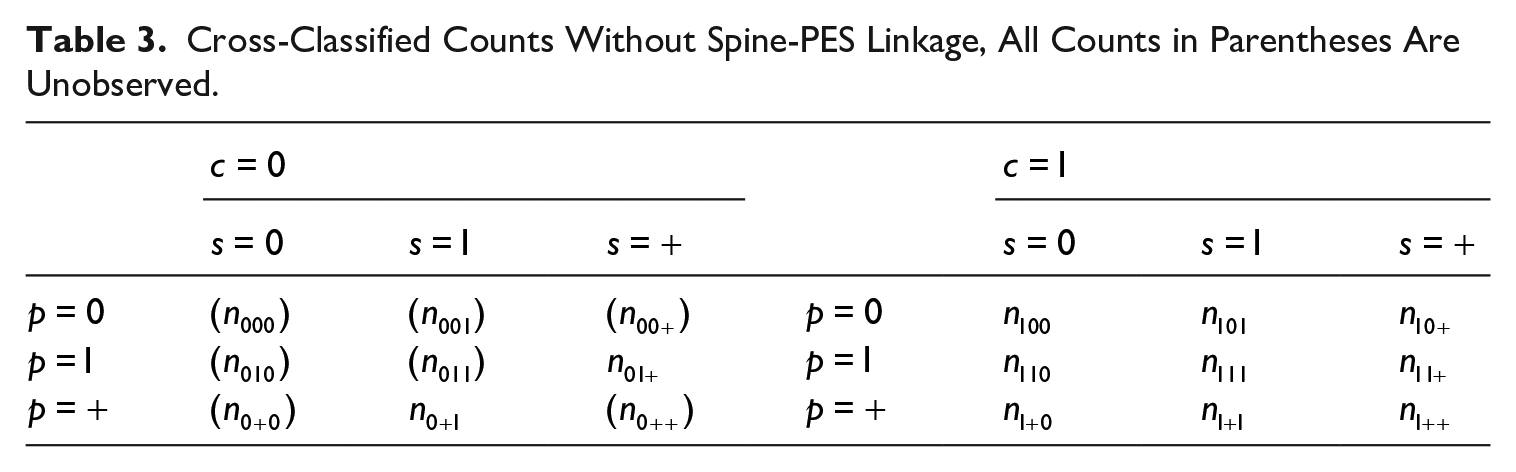
Let
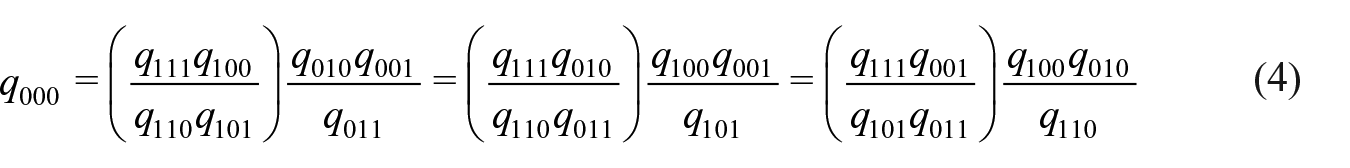
Note that each term in the parentheses above corresponds to an odds ratio conditional on

Now that this basic model cannot be identified given the linkage problem (i), we shall consider the models given by any of the independence assumptions below:

Notice that any of these is a stronger assumption than the corresponding constant-odds-ratio assumption, such that the equation (4) still holds under any of them. Once the missing cell counts
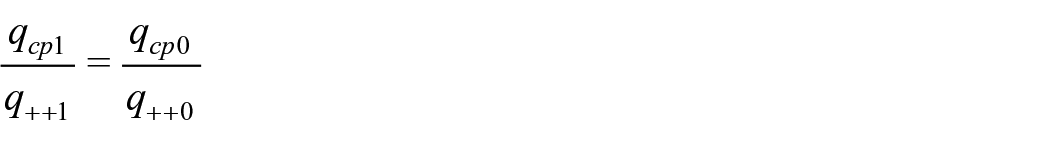
Model
Under this model, we have
as well as
Either of them yields an estimator of

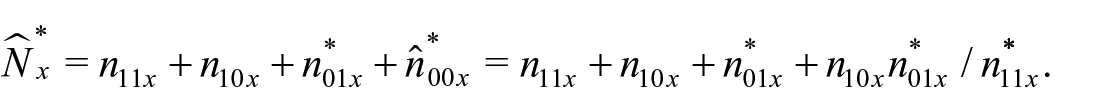
given which we obtain
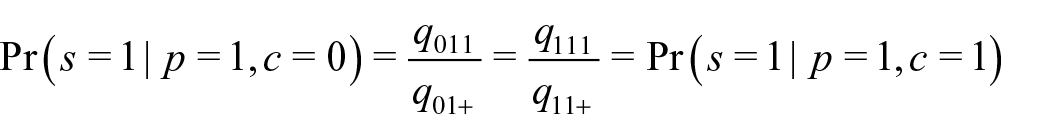
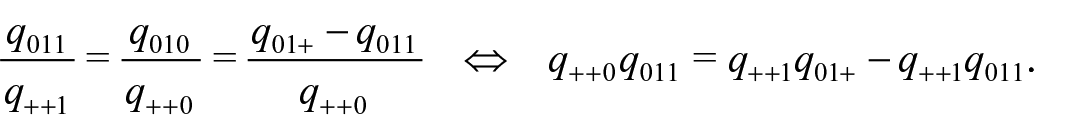
Model
This model allows the Census and Spine captures to be correlated, which is an added value compared to the Census-PES DSE otherwise. We have
such that
as well as
Thus, we obtain
An estimator of

given which we obtain
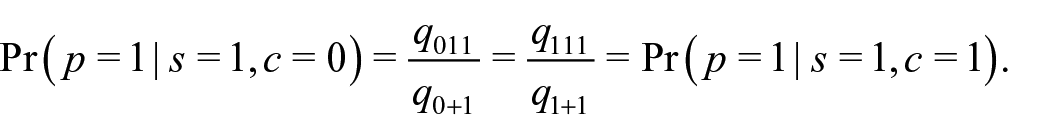
Model
Under this model, we have
such that
Moreover, we have equation (4) since
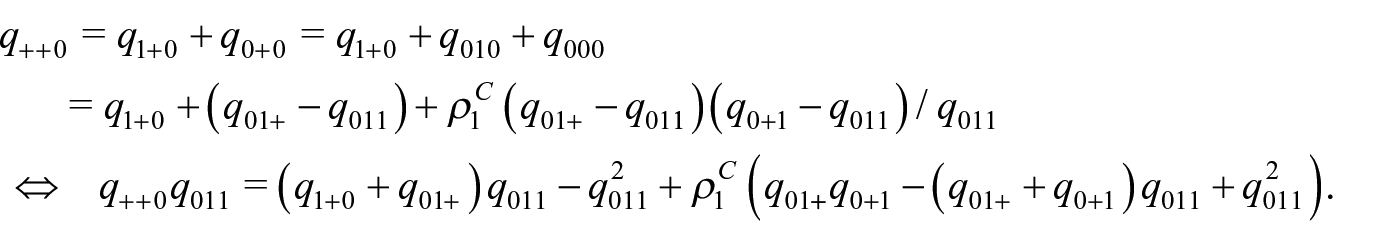
Thus, we obtain

where
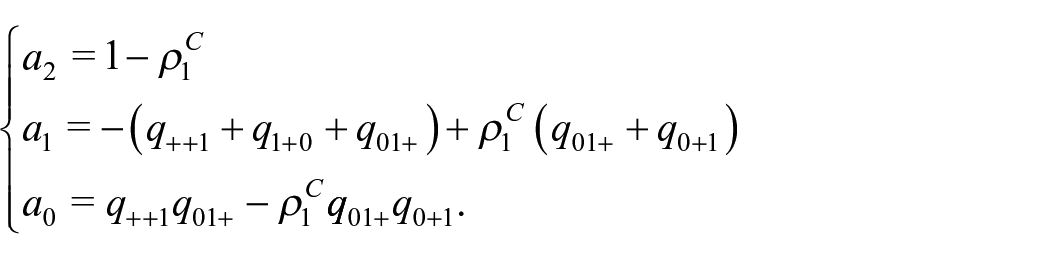
An estimator of
Goodness-of-fit.
Given each possible model above, one can check the goodness-of-fit against the corresponding assumption. For instance, given the model

for

where some of the estimates are observed directly. One can obtain the Pearson or Kullback-Leibler divergence measure to choose between model specifications. Similarly for the other two models. However, model selection cannot be entirely based on the principle of parsimony, although it is justified to disregard those models that fit badly to the observed data.
Finally, given the missing cell counts caused by the lack of complete three-way linkage, it is unclear to us whether any standard software packages for fitting log-linear models can be used to calculate the non-standard estimates discussed above or if the associated variance estimation procedure can account for the missing information purple (a referee mentioned the R-package CAT for the “Analysis and Imputation of Categorical-Variable Datasets with Missing Values”). In any case the estimators can easily be computed by writing one’s own code. For an estimator that has a closed form, the Delta method for variance estimation is quite straightforward. Otherwise, or generally, bootstrap under the estimated multinomial distribution would seem most convenient in practice.
3.3. Adjusting for False Negative of Census-Spine Linkage
The linkage problem (ii) is such that about 5% of Census records were False Negatives (FN) in its linkage to the Spine. Here we discuss how this was estimates and handled in MuSE.
Let

with respect to the linkage error distribution. That is, the false-negative probability, conditional on
Regarding the model, equation (5), we notice that it is reasonable to assume all the native born persons
Let

where
3.4. Subpopulation Size Estimation
Let
Now, suppose
Moreover, the idea extends to the TSE, where
In our study,
4. Case Study: Australian Population 2016
4.1. Set-Up
The Australian Census counts people who are present on Census night, are referred to as the Present Population. For our purpose the 2016 Census counted 21.2 million residents, defined by Census as a person who lives or intends to live in Australia for at least six months. Shortly after the 2016 Census, the PES counted 110,000 people who were present. The PES was linked to the Census in a high-quality clerical and automatic process which is assumed to be without error. ABS strives to maintain independence of Census and PES counting processes so as to justify the independence assumption. The official estimate of the Present Population size is 23.6 million using an Instrumental Variable Regression estimator (Chipperfield et al. 2017). To this is added an administrative count of 0.6 million Residents Temporarily Overseas (RTO) to get the Final Census Night Resident Population (24.2 million). RTOs are defined by a “12/16 month rule.” For a person to have immigrated or emigrated, they must have stayed in, or were absent from, Australia for a period of twelve out of sixteen months. After further minor demographic adjustments and smoothing to reduce sample errors at fine levels we arrive at the Official Estimated Resident Population (ERP).
For the purpose of this study, the Spine includes about 33 million administrative records for people who were “ever resident” in Australia from 2006 to 2020, including people who have died and who have temporarily or permanently left Australia. After trimming the Spine (Subsection 3.1), there are 14.5 million records on SpineSure.
Now that conceptually the Census and PES do not enumerate the RTOs, we did not remove the RTOs from SpineSure, in order to see whether MuSE involving SpineSure can potentially target the ERP directly. For example, holding the Census as fixed despite its non-coverage of the RTOs, the Census-SpineSure DSE is unbiased for the Resident Population provided SpineSure has a constant capture probability of the Resident Population, across RTOs and non-RTOs. Although the RTOs can appear on SpineSure, the probability is likely to be lower than that for the non-RTOs, given that trimming (Subsection 3.1) is based on an estimated probability of being counted in the Census. Also, on average the more recent immigrants are likely to have a somewhat lower probability to appear on SpineSure due to having less time to interact with government services.
Regarding the FN adjustment using the method of Subsection 3.3, the Census-SpineSure linkage is estimated to have about 5% FN errors overall, which vary significantly across the different states (e.g., up to 30% in Northern Territory) or other breakdowns of the population.
The results to be presented include:
Official estimate, or simply ERP in what follows;
DSE based on Census and PES, or simply Census-PES DSE;
Census-SpineSure DSE similarly, with FN adjustment as in Subsection 3.3;
PES-SpineLink DSE, where SpineLink contains the SpineSure records that are linked to the Census, and the links between PES and SpineLink are identified given the links between PES and Census. No adjustment for FN is required;
TSE under the model
The following details are worth noting. First, the RTOs will be added to the Census-PES and PES-SpineLink DSE, in order to make the presented estimates comparable (i.e., include RTOs). Second, all MuSEs stratify by state, age, and Indigenous status, where we use predicted Indigenous status (Subsection 3.4) for SpineSure. Predicted status is used for illustrative purposes here—all official estimates based on administrative status would require extensive consultation with Aboriginal and Torres Strait Islander peoples as the ABS places high importance on reporting statistics by Indigenous status in a culturally sensitive manner.
Third, if a person is counted by multiple lists and there is inconsistency in lists’ post-strata, then post-strata is assigned according to the PES, Census, and Spine (in that order of preference). For example, if a person’s PES state and Census state are different, the person would be assigned to a strata based on the PES state. Finally, although the PES sampling design weights are not accessible for the purpose of this project, we know they depend on state and whether an area is expected to contain a high proportion of Aboriginal and Torres Strait Islander Peoples. Hence, we proceed with the PES source under the working assumption that its sampling design is ignorable when state and Indigenous Status are used in post-stratification.
Fourthly, we do not explore here in detail the stability of MuSEs with respect to the cut-off applied when trimming the Spine, although this has been exercised for the equivalent 2021 versions of the Census, Spine, and PES. For example, in 2021 the trimmed Spine had 17.3 million Spine records (instead of the 14.5 million in 2016), and changing the cut-off to allow 8% more Spine records (17.3–18.7 million) only resulted in an increase of 0.4% in the Census-Spine DSE. This suggests that the MUSEs are stable around the chosen cut-off threshold for trimming.
4.2. National and State Estimates
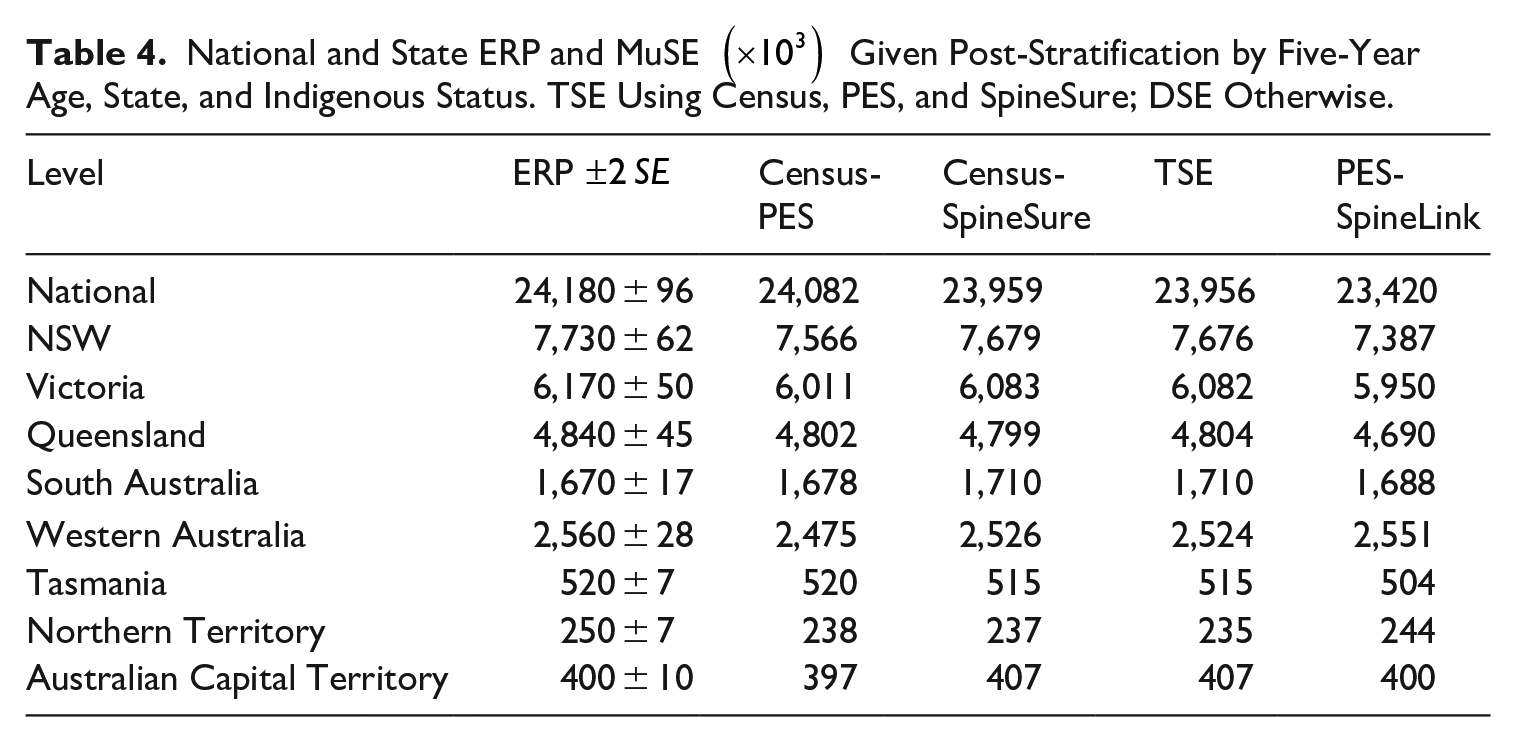
Table 4 gives the different estimates at the National and State levels, in comparison with the Official ERP and its associated standard error (SE). Now that the ERP and the Census-PES DSE are based on the same sources, the difference between them quantifies the combined impact of methods, including demographic adjustments, smoothing, and the tailored estimator (Chipperfield et al. 2017). Whereas the differences among the various DSEs and the TSE reflect chiefly the effect of different sources.
National and State ERP and MuSE
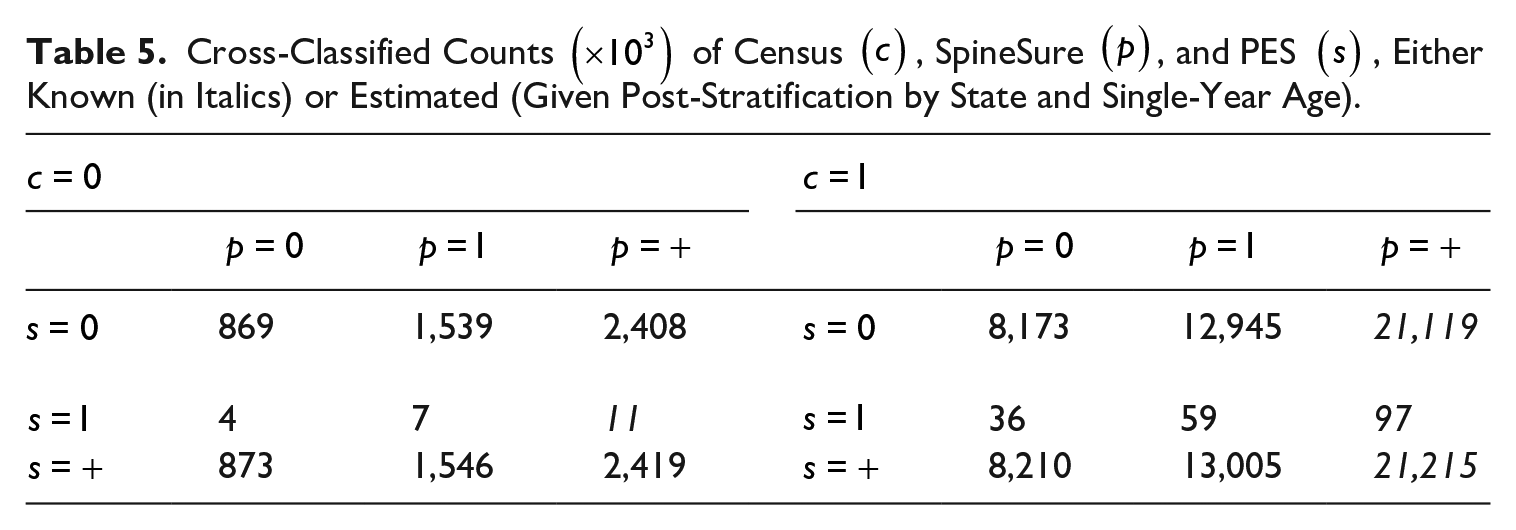
First, it can be seen that the TSE and the Census-SpineSure DSE are very close to each other. The main reason is that the PES is a much smaller list and contains little extra information in this setting. To illustrate, Table 5 gives the national cross-classified counts in the TSE setting, where about 0.869 million people are missed from all three lists and only four thousand people were captured by the PES but missed by both the Census and SpineSure. Notice that post-stratification is only by state and single-year age for Table 5, and the estimated total population size
Cross-Classified Counts
Next, from Table 4, the PES-SpineLink DSE is noticeably lower (and significantly different) than the other two DSEs nationally as well as in the three largest states. We shall return to the main reason for this later, but concentrate on the other two DSEs here, which are reasonably aligned with each other. Comparing the differences between the DSEs by Census-SpineSure and Census-PES to the Standard Error (SE) of latter, we note that the national estimate and four of the eight state estimates are marginally outside the 95% confidence interval. Of those four outside the confidence interval, three of the Census-SpineSure DSE estimates are closer to the ERP than Census-PES DSE.
Notice that we do not present any variance estimates for the MuSEs above, due to the complexity caused by false negative linkages, inconsistent stratification variables in different lists and the complex design of the PES. An appropriate treatment of all these effects for variance estimation is beyond this paper. However, while we do not present them here, the standard errors of the Census-SpineSure DSE or TSE when ignoring the above mentioned complexities are over ten times smaller than those of the ERP, because the Spine is much larger than the PES sample (which largely determines the variance of ERP). Thus, more accurate variance estimation is unlikely to change the main conclusions we draw from scoping the alternative MuSEs.
The fact that nationally the Census-SpineSure DSE is lower than the Census-PES DSE (and the ERP) suggests that the erroneous enumeration problem of the Spine can be largely removed by trimming. Although the FN adjustment we applied might not fully account for the heterogenous FN probability, we can be quite confident about the total of FN links, such that the main cause for the difference in these two national estimates is likely due to the treatment of RTOs. Whereas the RTOs are added to the Census-PES DSEs to yield the estimates presented here, no such direct addition of RTOs is performed for the Census-SpineSure DSE. However, as mentioned before, SpineSure is likely to have a lower capture probability among certain groups of individuals, such as the RTOs and the recent immigrants. It is possible SpineSure nearly fails to cover certain Residential Population groups below the post-stratum level, for which adding the RTOs outside SpineSure would be the only viable adjustment.
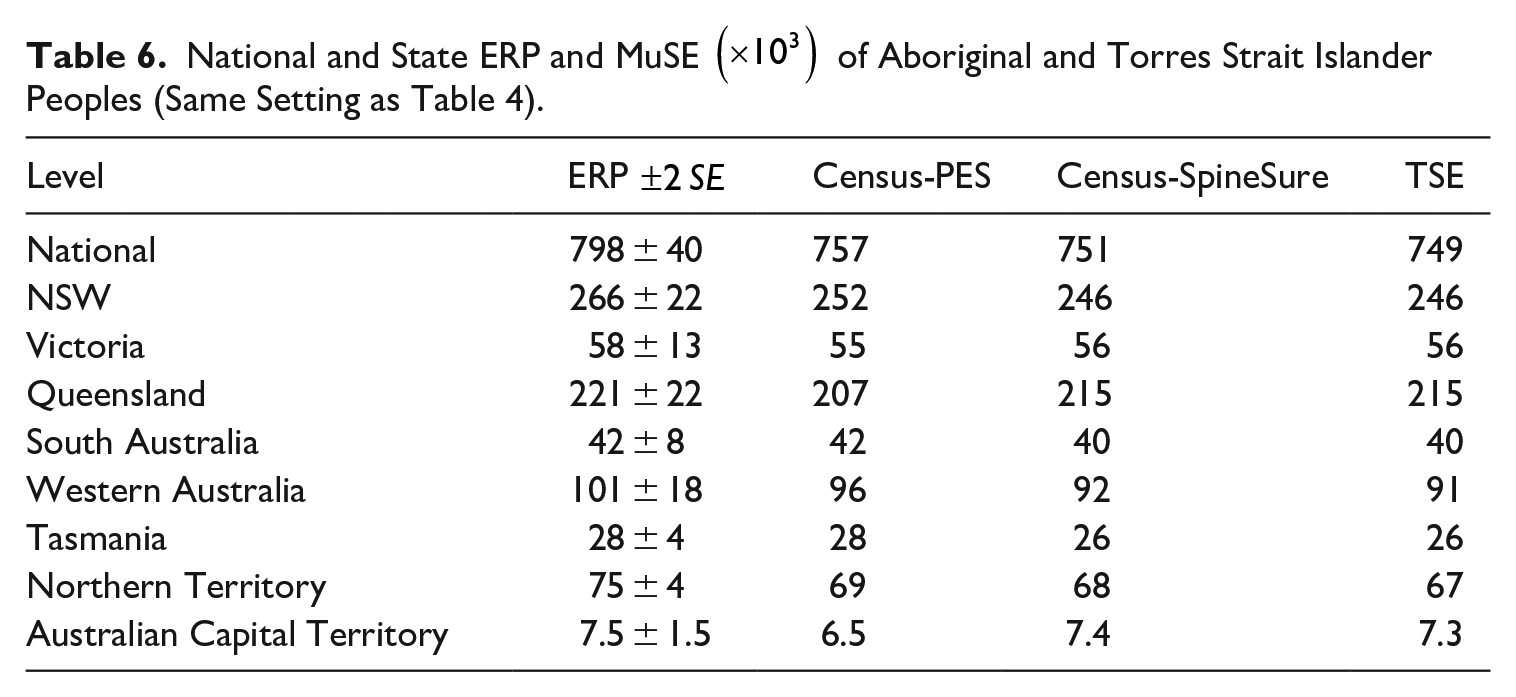
Finally, Table 6 shows the estimates for the Aboriginal and Torres Strait Islanders population by state and at the national level, except for the PES-SpineLink DSE. The differences between the Census-SpineSure and Census-PES DSEs are well within the 95% confidence intervals derived from the ERP. In terms of absolute values, the two DSEs agree better with each other than in Table 4 although, relatively speaking, the DSEs differ more to the ERP here than in Table 4, which is not unexpected given the observed level of inconsistency between a person’s PES and Census’ Indigenous status, which the ERP accounts for but the DSEs here do not. Nevertheless, it is seen that using the predicted Indigenous status on SpineSure in cases where it is missing from the PES and Census does not create major problems for estimates at these levels.
National and State ERP and MuSE
4.3. State and Age Distributions
We now consider some more disaggregated results. First, by age group, Figure 1 shows MuSEs against the 95% confidence interval derived from the ERP. We note that
The Census-PES DSE tracks the ERP equally well in all the age groups. The Census-SpineSure DSE also performs about equally well in all the age groups, perhaps with the exception of twenty to thirty-five-year-olds, possibly because SpineSure “over-trims” twenty to thirty-five-year-old RTOs, as mentioned before. There is little difference between the Census-SpineSure DSE and the TSE, except in the two oldest age groups, where the PES enumeration is relatively too small to support the three-way cross-classification.
The PES-SpineLink DSE is biased downward as noted before. Though not presented here this downward bias disappears at the national level if state is removed from post-stratification. This suggests that disagreement between state on Spine and that observed in PES may be the most important cause for the bias.
Next, Figure 2 gives the state by age-group breakdowns of the Census-SpineSure DSE. All the DSEs are within (or just outside) the 95% confidence interval derived from the ERP, except in NT where many fall outside the confidence intervals. The main reason is likely to be inadequate adjustment of heterogenous false negatives, the probability of which in NT is estimated to be among the highest across the country.
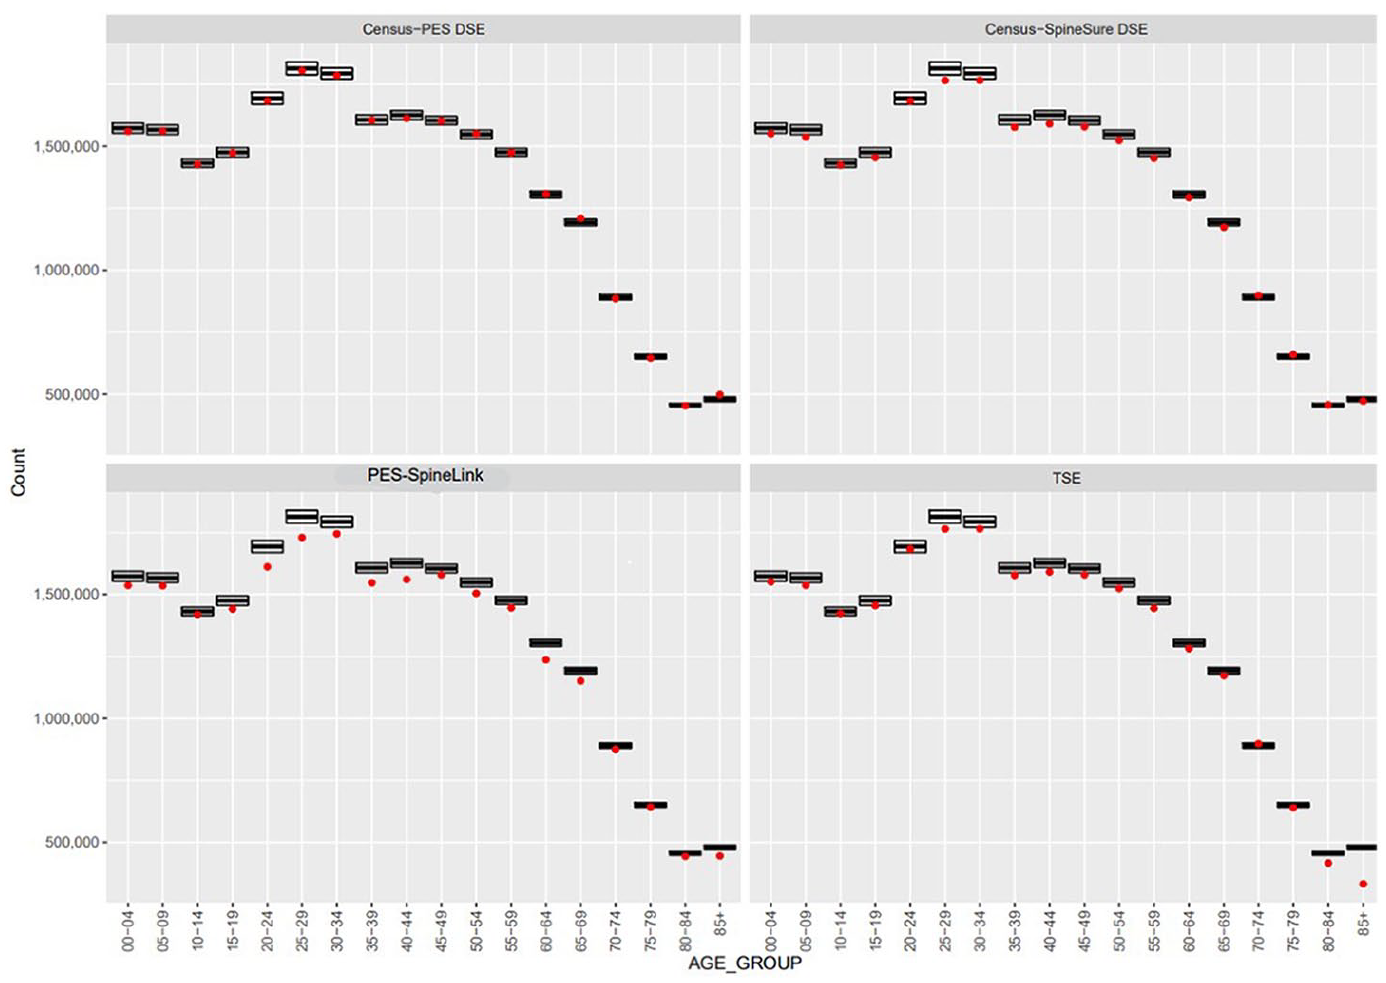
By age group, MuSE against 95% confidence interval derived from ERP.
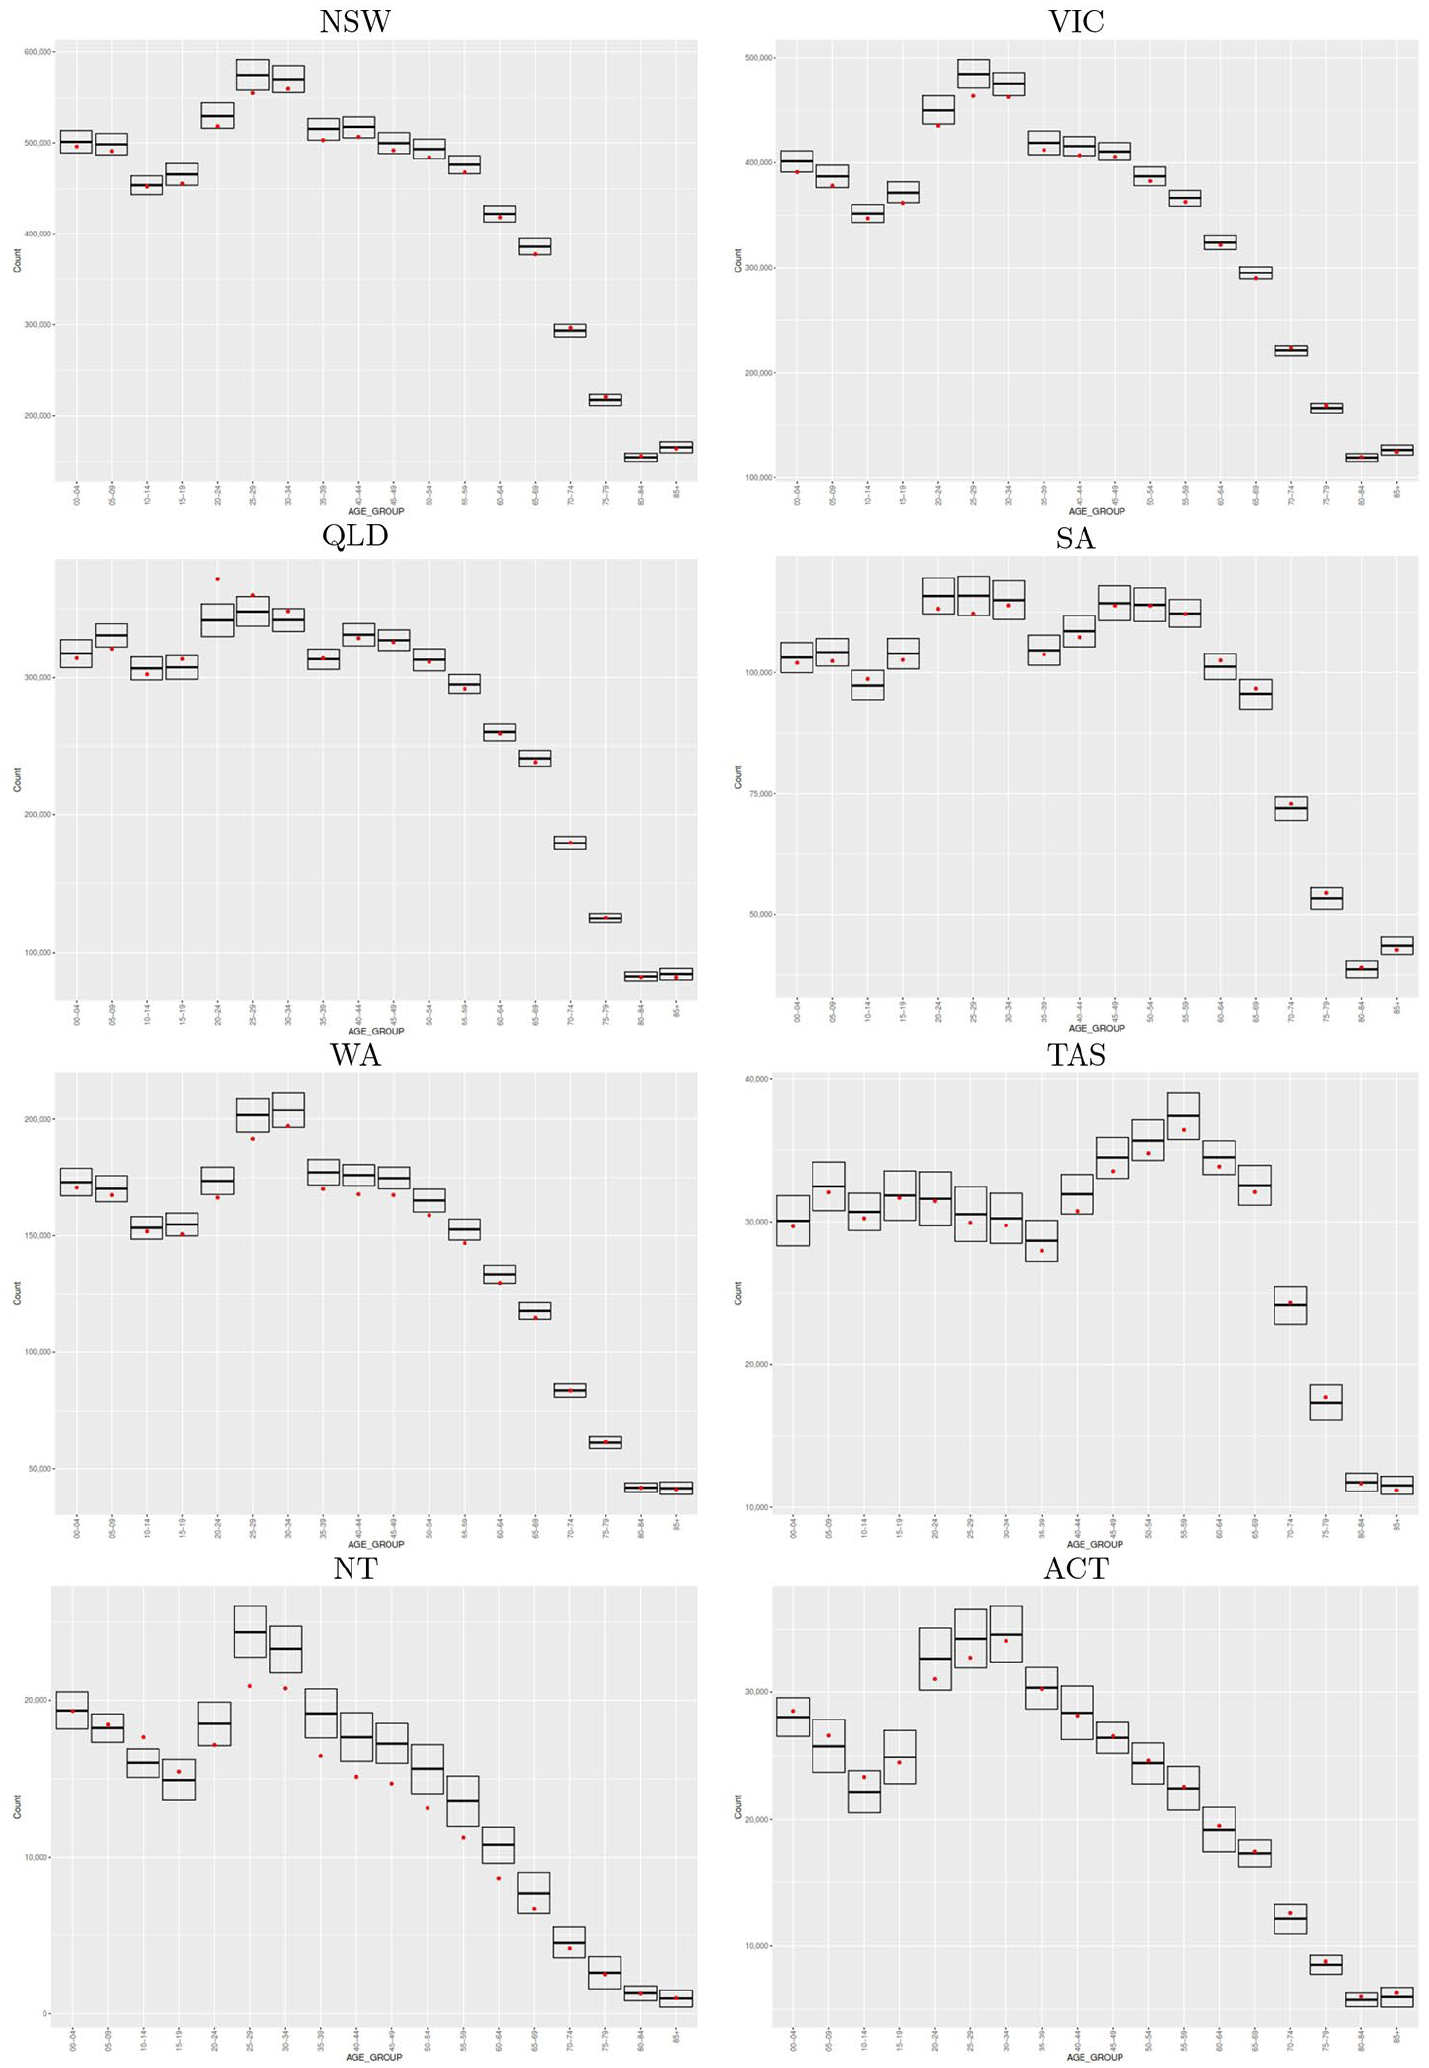
Census-SpineSure DSE against 95% confidence interval derived from ERP.
Finally, Figure 3 shows that the Census-SpineSure DSE of the Aboriginal and Torres Strait Islanders population is smooth and tracks the ERP well. The official ERP for the Aboriginal and Torres Strait Islanders Population is smoothed to reduce volatility due to the small PES sample size. In any case, using the predicted Indigenous status on SpineSure in cases where it is missing otherwise does not seem to be a major statistical cause of concern at such disaggregated levels either.
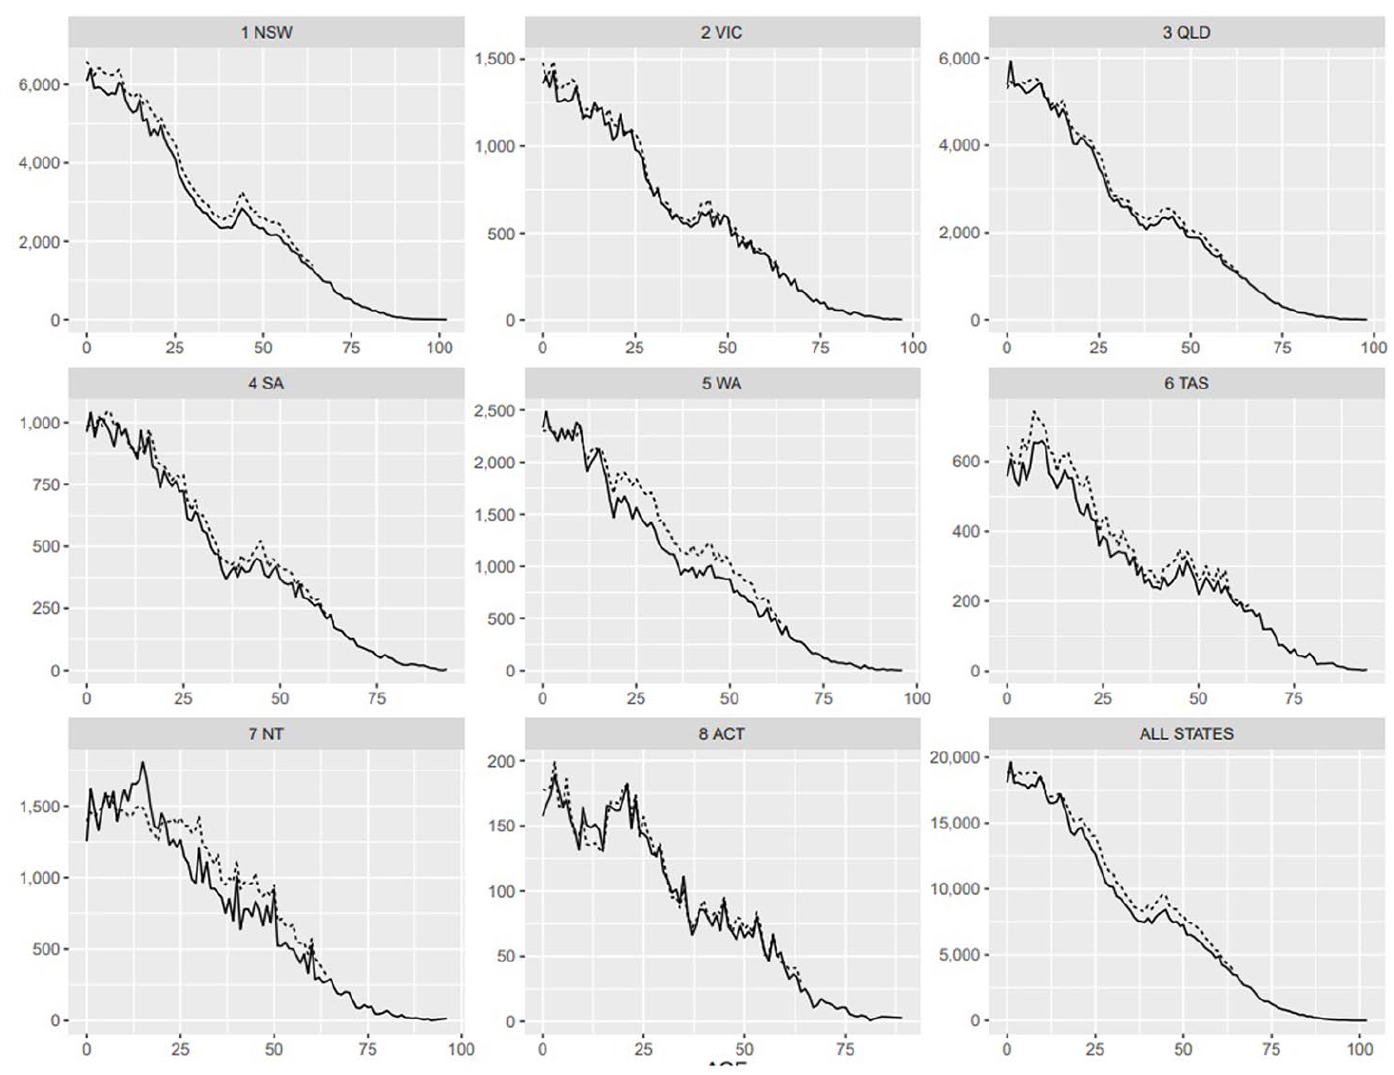
Census-SpineSure DSE and ERP of Aboriginal and Torres Strait Islanders population.
5. Final Remarks
Historically, many nations have used a population census as a basis to count their resident population and used a coverage survey to correct for census counting errors. Currently, many of them are planning to reduce reliance or phase out census collections given pressures to reduce costs and response burden. This paper presents findings of a study conducted by the Australian Bureau of Statistics into the role that administrative data, here the so-called Spine, could play to count residents in the presence or absence of a Census or PES. This study was conducted within the Multi-System Estimation framework.
Despite the lack of preconditions, our approach enables us to study the Census-Spine DSE that simulates population estimates without a coverage survey. The Census-Spine DSE achieves comparable estimates to the Census-PES DSE. Even though further research is required, this evidence may be useful in considering future directions for ABS Census transformation.
Footnotes
Authors’ Note
Views expressed in this paper are those of the author(s) and do not necessarily represent those of the Australian Bureau of Statistics. Where quoted or used, they should be attributed clearly to the author.
Funding
The author(s) declared that they received no financial support for the research, authorship, and/or publication of this article.