
Abstract
The declaration of the COVID pandemic in March 2020 was immediately followed by news media accounts of “panic buying.” However, this term is problematic because it implicitly assumes that people engage in indiscriminate consumer product purchases that are motivated solely by extreme fear. Contrary to the implicit assumptions of “panic buying,” this study's examination of consumer product purchases by 435 households found that respondents drew clear distinctions among four activities (observed shortages, own consumption changes, own stockpiling, and others’ stockpiling) related to six consumer product categories (fresh produce, fresh meat, nonperishable food, cleaning supplies, sanitary supplies, and nonprescription medications). The results show that own stockpiling has moderately positive correlations with own consumption changes and is as strongly related to optimism and anger as to fear. Own stockpiling also has positive correlations with perceptions of others’ stockpiling, reliance on informal information sources, and observed shortages. Unexpectedly, own stockpiling has positive correlations with positive disaster stereotypes rather than negative disaster stereotypes, and is unrelated to expected pandemic duration, authoritative information sources, demographic characteristics, and routine stockpiling. The results suggest that the term “panic buying” should be replaced by “crisis stockpiling,” which avoids unnecessary erroneous inferences about the motivation for that behavior.
Introduction
The declaration of the COVID pandemic in March 2020 was immediately accompanied by news media accounts of “panic buying.” Indeed, Arafat et al. (2020) found 214 articles on sharply increased purchases of consumer goods during the first two months of the COVID pandemic (mid-March through mid-May 2020), 87 of them in the U.S. news media alone. The majority of these articles discussed causes (82%) and consequences (80%), images of empty shelves (67%), public relations (65%), and expert opinion (56%). This news media coverage of increased consumer purchases is consistent with the findings of research on retailer sales data; Baker et al. (2020) reported a noticeable increase in U.S. consumer spending in all categories in early March, followed by a decline in all categories except food services and groceries in late March. This pattern was especially pronounced in shelter-in-place states, where minimizing the number of trips to grocery stores would decrease COVID-19 exposure. Lehberger, Kleih and Sparke (2021) reported that German purchases of nonperishable foods increased in the second week of March by 26–208%, with fresh fruits and vegetables increasing by smaller amount. Weersink, von Massow and McDougall (2020) reported that Canada's overall grocery sales were 46% higher during the week of 14 March, 2020, compared to the same week in 2019; milk sales increased 31%, butter sales increased 76%, and fresh poultry sales increased 50%. Hall et al. (2021b) reported that New Zealand grocery/liquor purchases increased after the first COVID case was reported, spiked between announcement and implementation of the NZ lockdown, declined below their 2019 levels when the lockdown was implemented, and recovered to their 2019 levels when essential services (including groceries) were allowed to remain open.
Labels for the increase in consumer purchases
There is no single label that has been adopted by all researchers to account for these spikes in consumer purchases, but “panic buying” is by far the most common. However, this term is problematic because it assumes, without evidence, that the purchase of consumer products has a single motivation—extreme fear. In the context of evacuation transportation analyses, Haghani et al. (2019, 5) noted that the term panic denotes “extreme emotions, groundless fear, uncontrolled flight behavior, impatience, the quick transmission of excessive fear (i.e., emotional contagion), or the disappearance of normal social bonds.” This characterization of panic is consistent with decades of sociological research, but that research has challenged the widespread belief of mass panic and contagious irrational response in disasters (Fritz and Marks 1954; Quarantelli 1954, 2001; Drabek 1986; Clarke and Chess 2008; see Nogami 2020 for a recent summary). The contrast between news media accounts and pseudoscientific commentary, on the one hand, and carefully conducted scientific research, on the other hand, can be seen in studies by Cantril (1940) and Rosengren, Arvidsson and Sturesson (1978) that debunked news media reports of widespread panic. Instead of panic and ruthless competition for survival, researchers have documented that emergencies typically create a shared social identity that generates mutual social support even when none of those involved shared group membership before the emergency occurred—see Drury's (2018) review.
An alternative label to “panic buying” is disaster stockpiling, which Pan et al. (2020, 2352) defined as “an unconventional inventory accumulation activity designed to minimize loss or a perceived threat of loss.” This conception is similar to Hall et al. (2021a) identification of increased purchasing as stockpiling a large quantity of possessions for future use (see also Wang and Na 2020). These authors noted that the COVID demand spikes were comparable to “Black Friday” and Christmas, occasions during which purchasing spikes are not characterized as “panic buying.” Similarly, Kassas and Nayga (2021, 2) recognized the pejorative nature of the term “panic buying” by stating “[t]o avoid issues with stigma associated with views and/or behavior related to ‘panic buying’, questions surrounding the outcome variables were framed using the term stocking up in order to encourage truthful responses” (emphasis added).
Although the term “disaster stockpiling” is preferable to “panic buying,” it is also somewhat problematic because it fails to distinguish between stockpiling in anticipation of an imminent threat, such as an approaching hurricane that is likely to strike within days or hours (Kulemeka 2010; Meyer et al. 2014; Larson and Shin 2018; Beatty, Shimshack and Volpe 2019) and stockpiling in anticipation of a temporally remote threat, such as an earthquake whose occurrence can only be defined as a probability of happening within a period of years (e.g., Lindell and Perry 2000; Peers et al. 2021). The former can be characterized as crisis stockpiling whereas the latter can be labeled routine stockpiling. A common element to the concepts of “panic buying” and crisis stockpiling is that purchasing behavior is driven by expectations of shortages of essential consumer products. The critical difference between the two concepts is that “panic buying” is assumed to be driven by overwhelming contagious fear that induces the majority of the population to irrationally purchase excessive quantities of products that may be tangentially or wholly irrelevant to their needs (Arafat et al. 2020; Loxton et al. 2020; Chua et al. 2021; Leung et al. 2021; Naeem 2021).
Crisis stockpiling in anticipation of hurricanes
Crisis stockpiling has been reported in anticipation of shortages caused by hurricane impacts, but Kulemeka (2010) concluded that panic, hoarding, and other anti-social behaviors did not characterize the stockpiling that took place shortly before impact. Instead, most shoppers were organized, willing to assist others, and focused on specific needs. Those who delayed purchasing until a hurricane was near landfall cited uncertainty due to conflicting information from forecasters and a lack of personal resources as reasons for waiting until the last minute to stockpile supplies. The latter was related to concern about buying supplies that would be wasted if the storm did not strike. Other sources have also reported that crisis stockpiling is targeted to specific products. Specifically, Elmore (2017) reported that, as Hurricane Irma approached, West Palm Beach experienced a 57% decrease in overall consumer spending, with an 85% decrease in restaurant spending. However, there was an increase of 66% in building supplies (e.g., for temporary storm shutters), 63% at gas stations, and 41% at supermarkets. Similarly, Beatty, Shimshack and Volpe (2019) found that an imminent hurricane landfall was associated with increased purchases of bottled water, batteries, and flashlights—especially in coastal areas with a higher proportion of wealthy White residents. This is consistent with data from Meyer et al. (2014) who reported that, when faced with an approaching hurricane, coastal residents reported low levels of worry but were increasingly likely to purchase supplies such as food, bottled water, and batteries (from 70% at 48 h before landfall to 89% at 6 h before landfall). However, not all purchases are utilitarian; Larson and Shin (2018) concluded that fear experienced before a hurricane causes both utilitarian (76%) and hedonic (24%) purchases. Utilitarian purchases (e.g., flashlights and batteries) are used to perform useful functions whereas hedonic products (e.g., ice cream and chocolates) are purchased solely to elicit enjoyment (Holbrook and Hirschman 1982).
Limitations of crisis stockpiling studies
One limitation of previous crisis stockpiling studies is that there has been little or no research on the degree to which stockpiling is influenced by consumers’ observations of changes in retailers’ supplies of a wide range of consumer products, their increased consumption of those products, and their perceptions of other people's stockpiling. However, people's own stockpiling can be explained by the Protective Action Decision Model (PADM—Lindell and Perry 1992, 2004, 2012; Lindell 2018), which summarizes decades of disaster research. These studies have found that people respond to environmental cues, social cues, and social warnings by forming perceptions of a threat and drawing upon beliefs about protective actions and social stakeholders to formulate strategies for information seeking and protective action. In turn, implementation of these strategies is affected by people's personal characteristics, as well as situational facilitators and impediments. Successful confirmation of a major threat leads to protective action, whereas lesser threats elicit monitoring strategies that return people to a search for additional environmental cues, social cues, and social warnings. In the context of COVID crisis stockpiling, the environmental cues could be observations of empty shelves and the social cues could be observations of people with overflowing shopping carts. Social warnings are messages from authorities, news media, and peers that either explicitly identify the threat of consumer product shortages or indirectly create consumer product shortages by recommending that people minimize their number of shopping trips.
It follows from the PADM that there will be individual differences in people's interpretations of potential consumer product shortages; although most will view the situation as a threat, a few might see it as an opportunity to stockpile and later profit by reselling at an inflated price (Cabral and Xu 2021). Those who interpret a shortage as a threat will assess it in terms of four dimensions—the likelihood that a shortage will occur (certainty), have a major impact on them (severity), happen soon (immediacy), and last for a long time (duration). In the case of COVID-related consumer product shortages, there appears to be an additional dimension, globality (Abramson, Seligman and Teasdale 1978) that, unlike perceptions of other product shortages such as the 1979 gasoline crisis that was limited to a single product (Trent and Pollard 1983), involves an expectation of shortages of many different consumer products.
Most applications of the PADM have focused on what Folkman (2020; Lazarus and Folkman 1984) calls the problem-focused coping strategies that are used to manage a threat. By contrast, emotion-focused coping strategies are used to manage the personal distress that caused by the threat. Thus, in response to COVID-related consumer product shortages, people might engage in problem-focused coping strategies such as purchasing sufficient quantities of consumer products to last for their expected duration of the shortage. Alternatively, consumers might engage in adaptive emotion-focused coping strategies such as seeking social support or maladaptive strategies such as impulsively purchasing hedonic (rather than utilitarian) products. Accordingly, the distinction between people's problem- and emotion-focused coping strategies can be defined by the categories and quantities of the products they purchase. It is important to note that emotion-focused coping is not necessarily irrational, let alone panicky, even though it might be based on implausible assumptions. As an extreme example, it would be rational, even though most observers would consider it unreasonable, for people to fill shopping carts with bundles of toilet paper if they expect a shortage that will last for an entire year.
Consumers’ perceptions of others’ stockpiling can be explained by the better-than-average effect (BTAE—Zell et al. 2020) and the third-person effect (3PE—Davison 1983; see Eisend 2017, for a recent review). The BTAE is “the tendency for people to perceive their abilities, attributes, and personality traits as superior compared with their average peer” (Zell et al. 2020, 118), whereas the 3PE is defined by two components—people's belief that they are less influenced than others by communications from social sources and that people act on such perceptions (Davison 1983). The BTAE and 3PE both imply that people thought they were less likely to act irrationally, and thus were more discriminating in their purchases, than the average person in terms of the quantities and range of consumer products they purchased in the early stages of the COVID pandemic.
Although not addressed in the disaster literature, the BTAE and 3PE are consistent with widespread beliefs about other people's negative disaster responses such as panic flight, incapacitating shock, and looting (Drabek 1986; Fischer 2008). That is, the BTAE implies that people think they are less likely than average to engage in negative disaster responses such as “panic buying.” Similarly, the 3PE implies that people believe others are more influenced by personal observations and media accounts of shortages and are thus more inclined to stockpile as much, and as soon, as possible.
Another limitation of previous crisis stockpiling studies is that few of them assessed the correlation of stockpiling with fear (although see Bentall et al. 2021) or the possibility that people could have been influenced by other affective responses such as optimism and anger (Lindell et al. 2016; Wei and Lindell 2017). Finally, those crisis stockpiling studies did not examine the influence of information from sources such as authorities, news media, and peers (Drabek 1986; Wray et al. 2008).
Research questions and research hypotheses
Existing research provides weak support, at best, for the proposition that “panic buying” causes consumers to be so emotionally overwhelmed by observations of shortages that they indiscriminately stockpile large quantities of a wide range of consumer products that exceed their immediate consumption needs. For example, Hori and Iwamoto (2014) concluded that Japanese consumers’ stockpiling immediately after the 2011 Tohoku earthquake was consistent across 24 categories of consumer products. However, the predictability of purchases of any given item from all 23 other items was actually quite low (.08 ≤ pseudo-R2 ≤ .15) and only 50 of 552 coefficients (=9%) were greater than r = .10. Similarly, Bentall et al. (2021) reported consistent increases in purchases of consumer products across nine items, but those increases were quite small. By contrast, O’Connell, De Paula and Smith (2021) reported that UK purchases during the first months of the COVID pandemic tended to be concentrated in 30 of 138 product categories, with increased purchases initially focusing on nonperishable foods, cleaning supplies, nonprescription medications, and sanitary supplies (e.g., toilet paper). These inconsistent findings lead to the following research question.
RQ1a: Did people discriminate in terms of the quantity of different product categories in their reports of their own stockpiling, their own consumption changes, and observed shortages?
The BTAE and the 3PE both imply that people think that they are more rational, and thus more discriminating, than average. However, it is unclear if this would be found in terms of the quantities and range of product categories that they purchased.
RQ1b: Did people believe that other consumers were stockpiling to a greater extent and in a wider range of categories than they were?
Past research on disasters has found that emergency preparedness actions such as routine stockpiling of food and water are related to risk perception for earthquakes (Lindell and Perry 2000; Spittal et al. 2006) and floods (Lindell and Hwang 2008; Poussin, Botzen and Aerts 2014; Cvetković et al. 2018). In the case of COVID, the PADM predicts that people's observations of essential consumer product shortages in stores (i.e., environmental cues) would produce perceptions that there is a high likelihood (certainty) that they will be unable to purchase those essential products (severity) in the near future (immediacy) and perhaps for an extended period of time (duration), so they should increase their own stockpiles. Moreover, the PADM predicts that people's observations of many people carrying multiple grocery bags (i.e., social cues) would cause their perceptions of others’ stockpiling to motivate their own stockpiling. Similarly, a need for people to increase their own consumption of essential consumer products such as cleaning supplies would increase their own stockpiling of those products.
RH1a: Own stockpiling will be positively related to personal observation of shortages, own consumption changes, and perceptions of others’ stockpiling.
The term “panic buying” presumes that consumer purchases are determined solely by fear and dread (Slovic 1987; Terpstra 2011), but affective states can be characterized by multiple typologies (e.g., Russell 1980; Ekman and Cordaro 2011; Barrett et al. 2019) and assessed using a variety of measures (e.g., Nowlis 1965; Watson, Clark and Tellegen 1988). Accordingly, recent research on environmental hazards has also identified anger and optimism as predictors of emergency preparedness measures that include routine stockpiling of food and water (e.g., Wei and Lindell 2017). In order to determine which, if any, of these three affective states is most clearly associated with stockpiling perceptions and behaviors, it is necessary to assess their discriminant and predictive validity (Campbell and Fiske 1959; Nunnally and Bernstein 1994). That is, are there significant differences between the mean ratings for these three affective states, are the correlations among those ratings sufficiently low, and are their correlations with stockpiling sufficiently high?
RH1b: Own stockpiling will be positively related to affective responses.
Disaster researchers have long documented widespread misconceptions about people's behavior in disasters. Specifically, people overestimate the prevalence of negative behaviors such as incapacitating shock, panic flight, and looting (Drabek 1986; Fischer 2008). These misconceptions have been labeled “disaster myths,” but the term “myth” is problematic because it presumes that these beliefs are unsupported by empirical evidence. In fact, there is empirical evidence that behaviors such as disaster syndrome, panic flight, and looting do occur but they are much rarer than is commonly believed. A more accurate term is “disaster stereotypes” because a stereotype is “a cognitive representation of a social group that is stored in memory” (Ottati, Edwards and Krumdick 2005, 727).
Also concerning is the fact that people fail to recognize the prevalence of prosocial behaviors (Drury 2018). These include voluntary contributions of time, effort, supplies, and money. Such misconceptions have long been recognized in the US (Lindell and Perry 1992; Fischer 2008) and have also been documented in other countries (Nogami and Yoshida 2014). Although there appears to be no research specifically on this topic, a plausible implication of the “panic buying” label is that own stockpiling would be positively correlated with negative disaster stereotypes about others’ irrationality and antisocial behavior. Conversely, this logic implies that own stockpiling would be negatively correlated with positive disaster stereotypes such as prosocial behaviors (e.g., contributions of time, effort, supplies, and money) associated with the “therapeutic” (Fritz 1961) or “altruistic” (Barton 1969; Kaniasty and Norris 1995 ) community. As is the case with the affective responses, it is important to assess the discriminant and predictive validity of these two categories of disaster stereotypes.
RH1c: Own stockpiling will be positively related to negative disaster stereotypes and negatively related to positive disaster stereotypes.
Nogami and Yoshida (2014) reported that news media and Internet websites were much more likely to be identified as disaster information sources than peers and social media although they were not necessarily considered to be more credible. However, DeYoung et al. (2016) reported that electronic media were preferred to peers because they were trusted. Further conflicting results were reported by Sadri, Ukkusuri and Gladwin (2017), who found that people relied more on the Internet (48%) than on social media (25%) or radio and TV (11%). Other research on a variety of environmental hazards has found that there are significant differences in perceived expertise, trustworthiness, and protection responsibility that would lead to differences in reliance on different stakeholders such as government agencies and elected officials at federal, state, and local levels; technical experts; news media; employers; and peers (Lindell and Perry 1992, Chapter 6; Lindell and Whitney 2000; Arlikatti, Lindell and Prater 2007; Liu, Fraustino and Jin 2016). In a particularly relevant example, Wei et al. (2018) found that physicians and public health personnel were considered to be higher in expertise, trustworthiness, and protection responsibility for seasonal influenza than local elected officials, news media, and peers. Given these conflicting results, it is important to assess the discriminant and predictive validity of these different types of information sources.
RQ2: Will own stockpiling have stronger positive relations with reliance on authoritative information sources than with informal information sources?
It seems logical that own stockpiling during the COVID crisis will be correlated with routine stockpiling for other types of emergencies because stockpiling nonperishable foods, for example, is just as appropriate for COVID-related shortages as for disaster-caused shortages. However, it is unclear if the correlation would be positive, because those who engage in routine stockpiling would be more psychologically disposed to engage in crisis stockpiling, or negative because those who have already engaged in routine stockpiling would have less need to engage in crisis stockpiling. Moreover, there is some evidence that crisis stockpiling is correlated with income and White ethnicity (Beatty, Shimshack and Volpe 2019), but it is unclear if it is correlated with other demographic characteristics such as gender, marital status, ethnicity, age, homeownership, education, income, or income loss.
RQ3: Is own stockpiling positively related to expected pandemic duration, routine stockpiling, and demographic characteristics?
Some authors have reported that disaster victims experience anger and blame others for their misfortune—wrongly (Singer 1982) or rightly (Gaillard, Liamzon and Villanueva 2007). One obvious scapegoat for any experienced product shortages would be other consumers’ stockpiling (Drabek and Quarantelli 1967; Olson 2000).
RH2: Perceptions of other consumers’ stockpiling will be positively correlated with personal observations of shortages.
Method
Sample
Following approval by the University of Washington IRB, survey packets were mailed to a random sample of 750 addresses in each of the Portland (Multnomah, Washington, Clackamas, and Columbia counties) and Seattle (King, Pierce, and Snohomish counties) metropolitan areas during the Fall of 2020. The packets contained a cover letter describing the study's objectives and the respondent's rights to decline participation, the questionnaire, and a stamped return envelope. Following the Dillman, Smyth and Christian (2014) procedure, each address received as many as four contacts at approximately two-week intervals, with full survey packets in the first, third, and fourth mailings and a reminder post card in the second mailing. There were 435 valid responses which, after eliminating 99 undeliverable addresses, yielded an 31.0% response rate. Compared to regional averages, the respondents in these samples are older and have higher incomes and education (see Table 1), which is typical for recent environmental hazards surveys conducted by mail (Brody et al. 2016; Lindell et al. 2017; Peers et al. 2021).
Demographic characteristics of the samples and the two metropolitan areas.
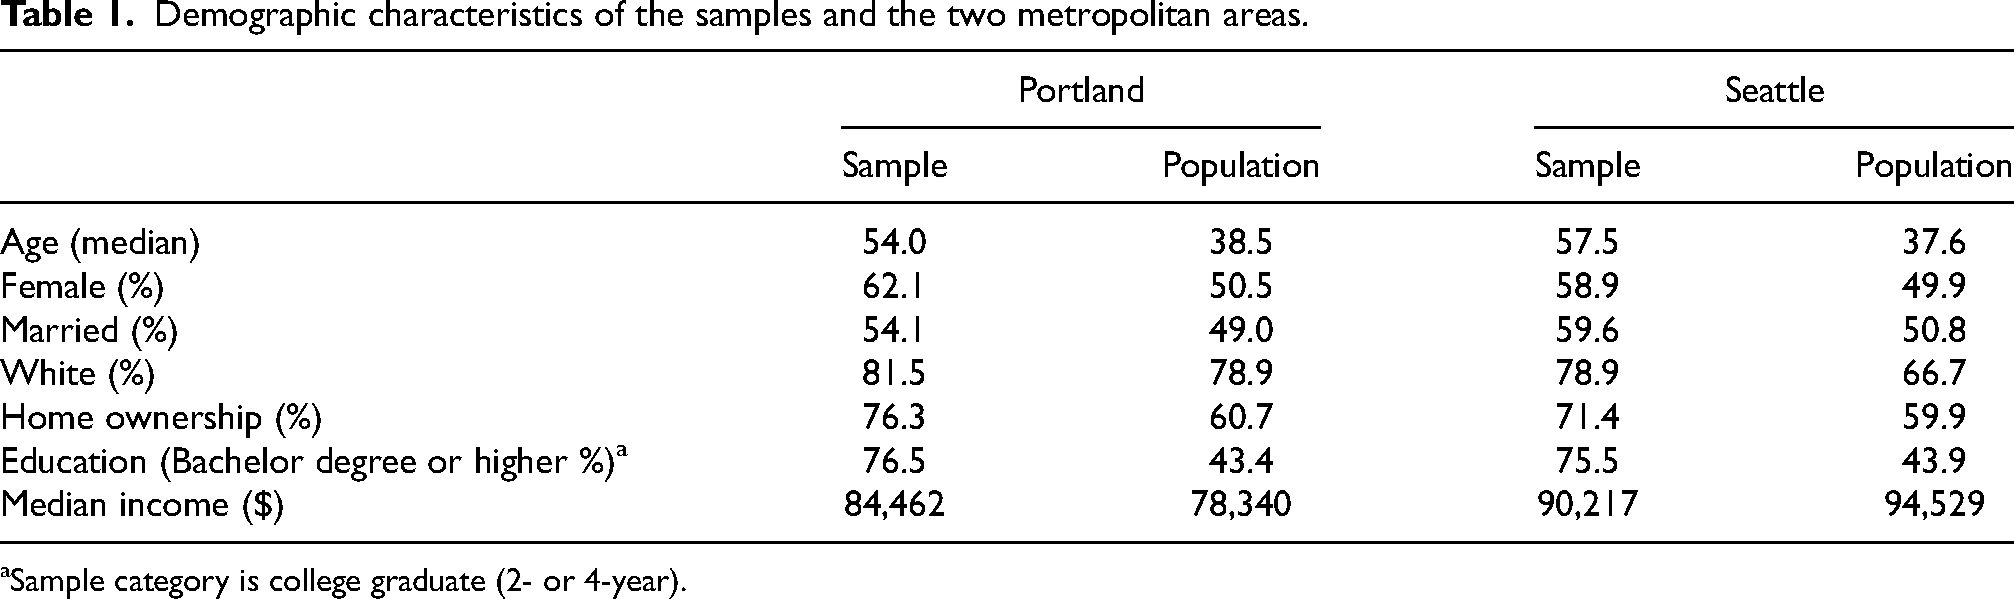
Sample category is college graduate (2- or 4-year).
Measures
Respondents were asked to rate the extent (Used much less = 1 to Used much more = 5) to which, during the first month of the COVID crisis (March), they changed their consumption or use of six categories of consumer products—(a) fresh fruits and vegetables, (b) fresh meat and poultry, (c) nonperishable food (dehydrated or canned food), (d) cleaning supplies (e.g., bleach, rubbing alcohol), (e) sanitary supplies (e.g., facial tissues, toilet paper), and (f) nonprescription medications (e.g., decongestants). In addition, respondents were asked to rate the extent (Not at all = 1 to Very great extent = 5) to which they encountered reduced supplies in their grocery store and pharmacy of these six categories of consumer products. Using the same rating scale, they were also asked about the extent to which they increased their own stockpiles at home of the six categories of consumer products and the extent to which they thought the average household increased their stockpiles of the six categories of consumer products. Comparison of the latter two sets of ratings corresponds to the indirect method of assessing the BTAE (Zell et al. 2020). Affective responses were measured by asking respondents to report, on the five-point scale, the extent to which the possibility of getting sick from the coronavirus made them feel (a) optimistic, (b) energetic, (c) alert, (d) depressed, (e) nervous, (f) fearful, (g) angry, (h) annoyed, or (i) irritated. The first three items formed the optimism scale (α = .66), the second three items formed the fear scale (α = .81), and the last three items formed the anger scale (α = .88). Disaster stereotypes were assessed by asking respondents to report, on the five-point scale, the extent to which they thought that the COVID crisis caused people to (a) cope with the situation in a way that protects themselves and their families, (b) contribute time or money to help friends, relatives, and neighbors, (c) contribute time or money to help strangers, (d) be so shocked and confused that they cannot cope with the situation, (e) be so afraid that they do things that actually endanger themselves, (f) do things that disregard the health and safety of other people, and (g) deliberately take advantage of other people financially. The first three items formed the positive stereotypes scale (α = .75), whereas the remaining three items formed the negative stereotypes scale (α = .73).
Reliance on information sources was assessed by asking respondents to use the five-point rating scale to report the extent to which they were currently relying on each of the following sources for information about the coronavirus and protective actions from it—(a) public health officials, (b) local government elected officials, (c) state government elected officials, (d) news media reporters (TV, radio, newspapers), (e) national government elected officials, (f) social media sources (e.g., Twitter, Facebook, mobile news), and (g) friends, relatives, neighbors and coworkers. After factor analysis, the first four items were aggregated into the authoritative sources scale (α = .77), whereas the last three items formed the informal sources scale (α = .50). Expected pandemic duration was measured by asking respondents to indicate how many months they thought COVID crisis would disrupt their daily life (0, 3, 6, 9, 12, 15, 18, 21, 24, or more) and routine stockpiling was assessed by averaging the number of the following items respondents in their homes before the COVID crisis began—(a) a working portable radio with spare batteries or hand crank, (b) at least 4 gallons of water per person in plastic containers, (c) a two-week supply of nonperishable food, (d) at least a one-week supply of prescription medicines, and (e) a flashlight with extra batteries. These items formed a scale with α = .60 Finally respondents’ demographic characteristics were assessed by asking them to report their age, sex, marital status, ethnicity, homeownership, education (some high school, high school graduate/GED, some college/vocational school, college graduate [2 or 4-year], graduate school), income (<$25,000, $25,000–49,999, $50,000–74,999, $75,000–99,999, >$100,000), and the percent of their usual monthly income that their household earned in the previous month (0–100 in increments of 10).
Analyses
RQ1a and RQ1b were tested by a multivariate analysis of variance (MANOVA) on the ratings of the four activities (observed shortages, own consumption changes, own stockpiling, and others’ stockpiling) on the six consumer product categories (fresh produce, fresh meat, nonperishable food, cleaning supplies, sanitary supplies, and nonprescription medications). The overall MANOVA test was followed by paired t-tests of the differences between specific variables. RH1a–RH1c, RQ2, RQ3, and RH2 were tested by correlation analyses followed by a regression analysis to identify the best prediction equation for own stockpiling.
In the analyses that follow, there are over 300 statistical tests, so the experiment-wise error rate is a concern. Specifically, the expected number of false positive tests is FP = α × n, where FP is the number of false positive test results, α is the Type I error rate, and n is the number of statistical tests. If α = .05 and n = 300, then FP = 15. To avoid this large number of false positives, Benjamini and Hochberg (1995; see also Glickman, Rao and Schultz 2014) recommend that researchers 1) specify a false discovery rate (d) for the entire study, 2) sort the pi significance values for the individual tests in ascending order 1 ≤ i ≤ n, and 3) classify each pi ≤ d × i/n as statistically significant. Consequently, the present study used p < .01, although most of the differences described below were significant at p < .001.
Results
With respect to RQ1a (Did people discriminate in terms of the quantity of different product categories in their reports of observed shortages, their own consumption changes, and their own stockpiling?), the MANOVA yielded significant effects for the four activities, six consumer product categories, and the interaction between activities and product categories. Specifically, the test results are Wilks’ Λ = 0.30 (F3, 370 = 291.19, p < .001, partial η2 = 0.70) for the four activities, Wilks’ Λ = 0.22 (F5, 368 = 265.60, p < .001, partial η2 = 0.78) for the six consumer product categories, and Wilks’ Λ = 0.32 (F15, 358 = 50.80, p < .001, partial η2 = 0.68) for the interaction of activities and product categories. Figure 1 shows that the respondents’ reports of observed shortages of cleaning supplies and sanitary supplies are significantly greater than those of the other consumer products. There is a significant but small difference between cleaning supplies and sanitary supplies (t417 = 4.03, p < .001, Cohen's d = 0.20, 3% of the response scale), but the mean for cleaning supplies is substantially different from that of nonperishable food (t415 = 20.58, p < .001, Cohen's d = 1.01, 33% of the response scale) and the mean for sanitary supplies is substantially different from that of nonprescription medicines (t409 = 24.21, p < .001, Cohen's d = 1.20, 16% of the response scale).
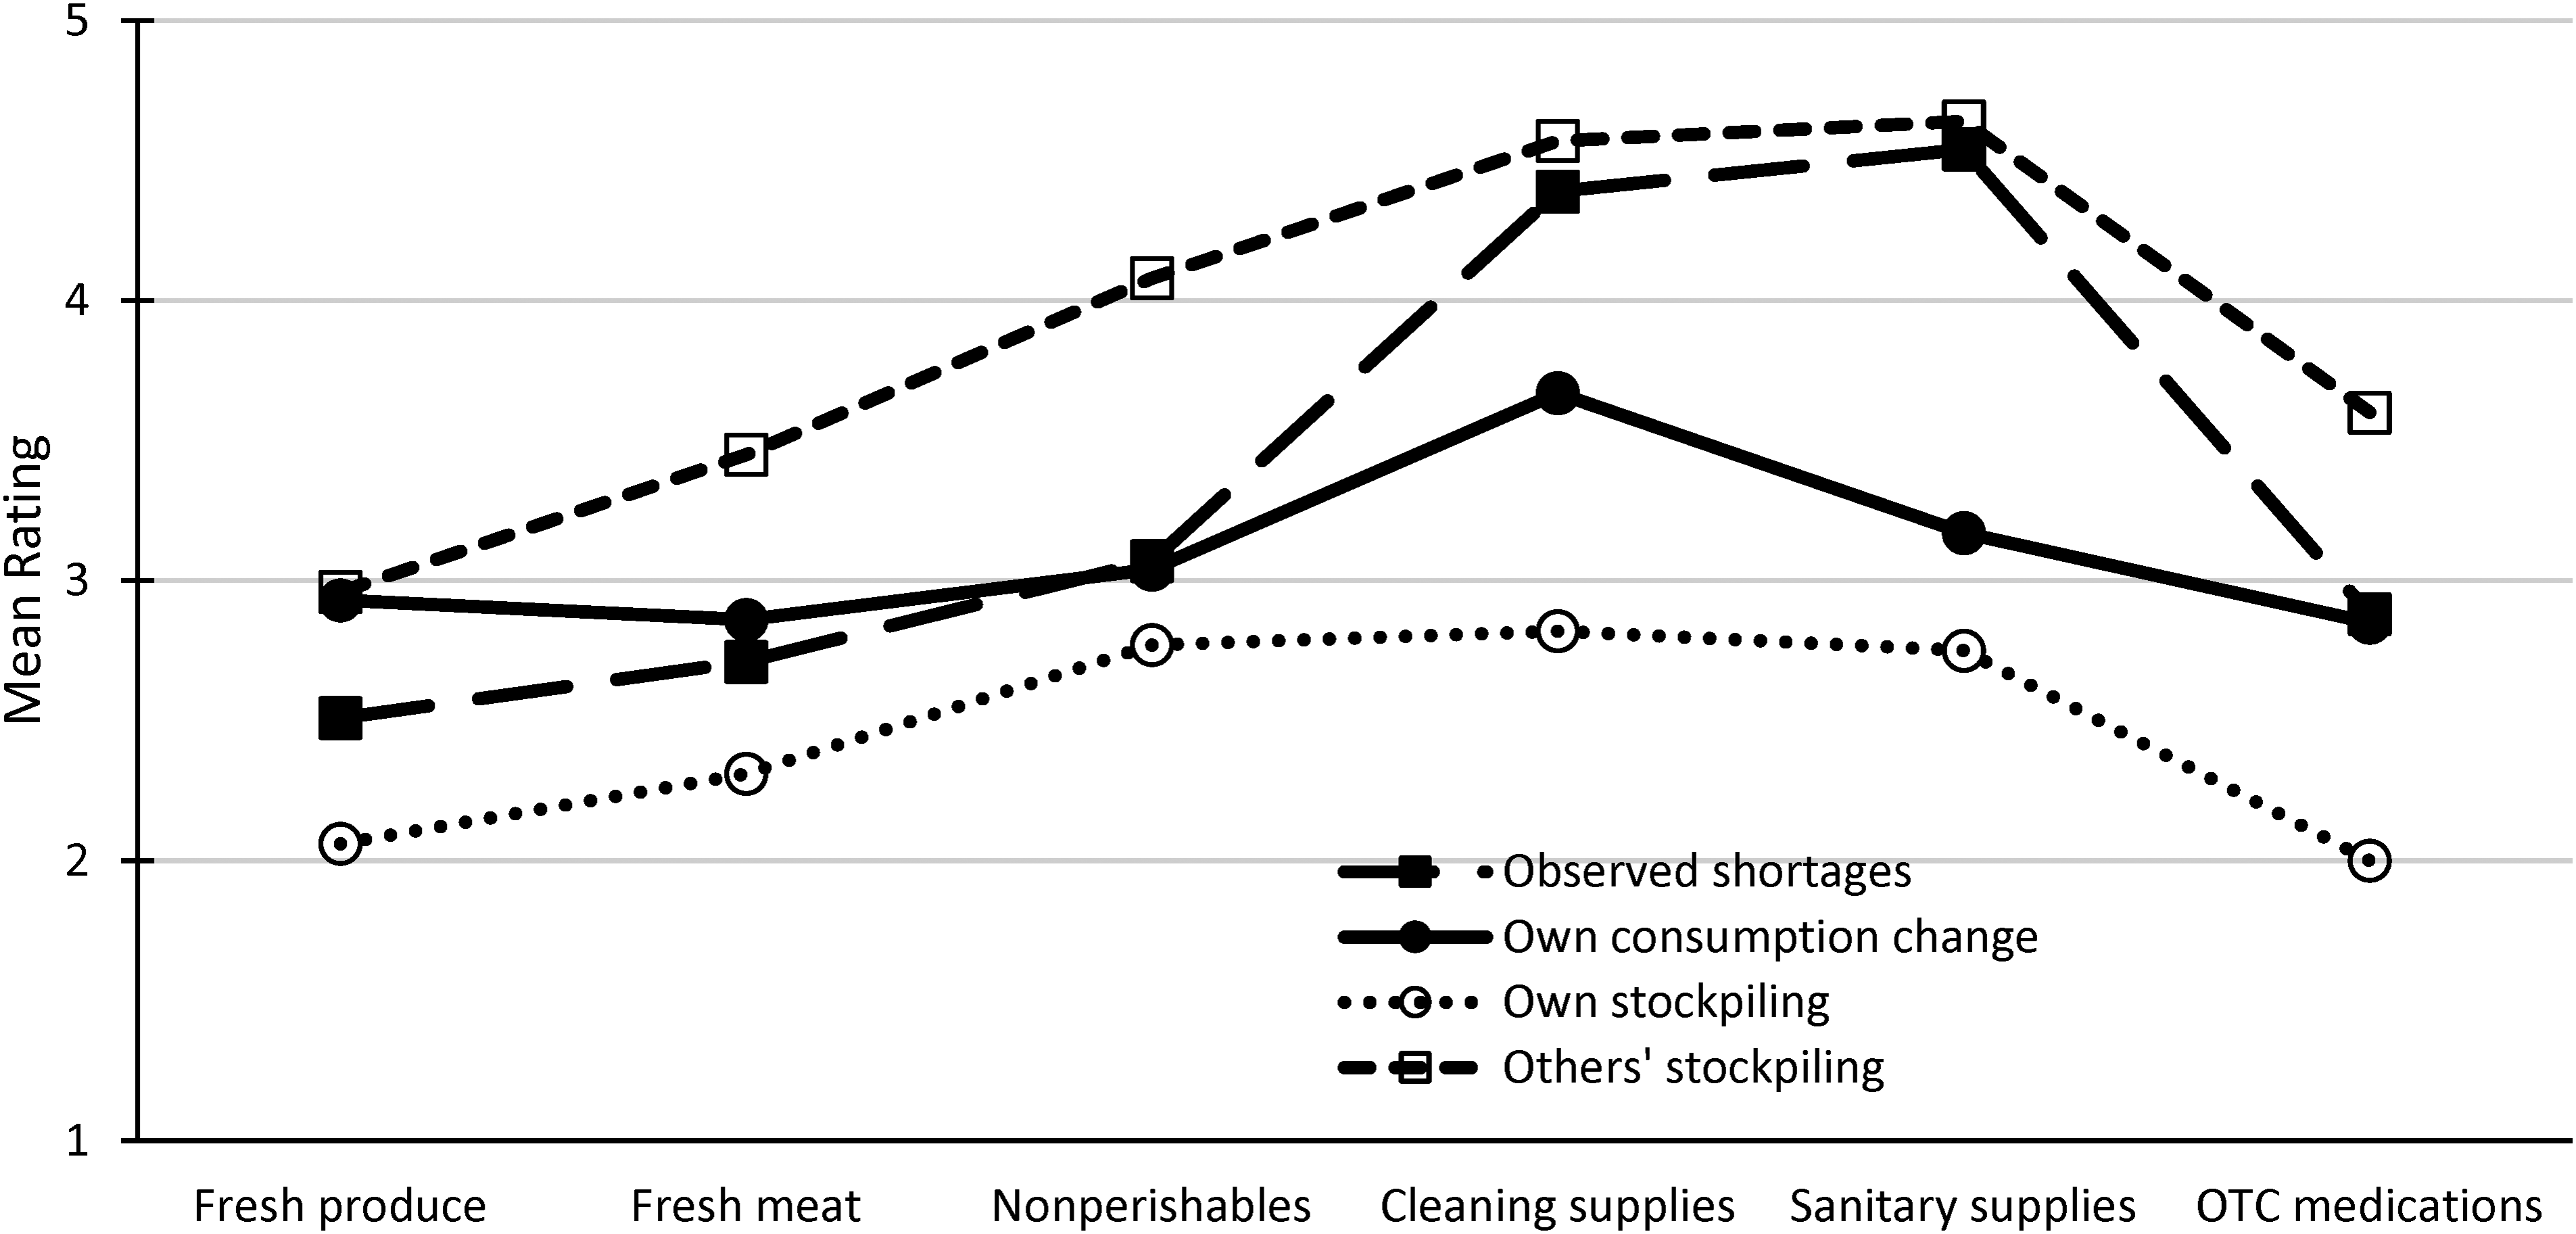
Patterns of observed shortages, own consumption changes, own stockpiling, and perceived others’ stockpiling.
In addition, Table 2 shows that the mean rating for own consumption changes across product categories is M = 3.09, which is only slightly higher than the midpoint of the rating scale (3), indicating that there was only a very slight increase in overall consumption (t428 = 3.91, p < .001, Cohen's d = 0.19, 2% of the response scale). More specific analyses show that this increase is largely attributable to increased use of cleaning supplies (M = 3.67 vs. 3.00, t421 = 14.61, p < .001, d = 0.95, 17% of the response scale) and, to a lesser extent, sanitary supplies (M = 3.17 vs. 3.00, t421 = 4.30, p < .001, d = 0.82, 4% of the response scale), but not nonperishable foods (M = 3.04 vs. 3.00, t419 = 1.07, p > .29, d = 0.05, 1% of the response scale) or the other consumer products.
Means (M), standard deviations (SD), internal consistency reliability (α), and intercorrelations (rij) among variables.
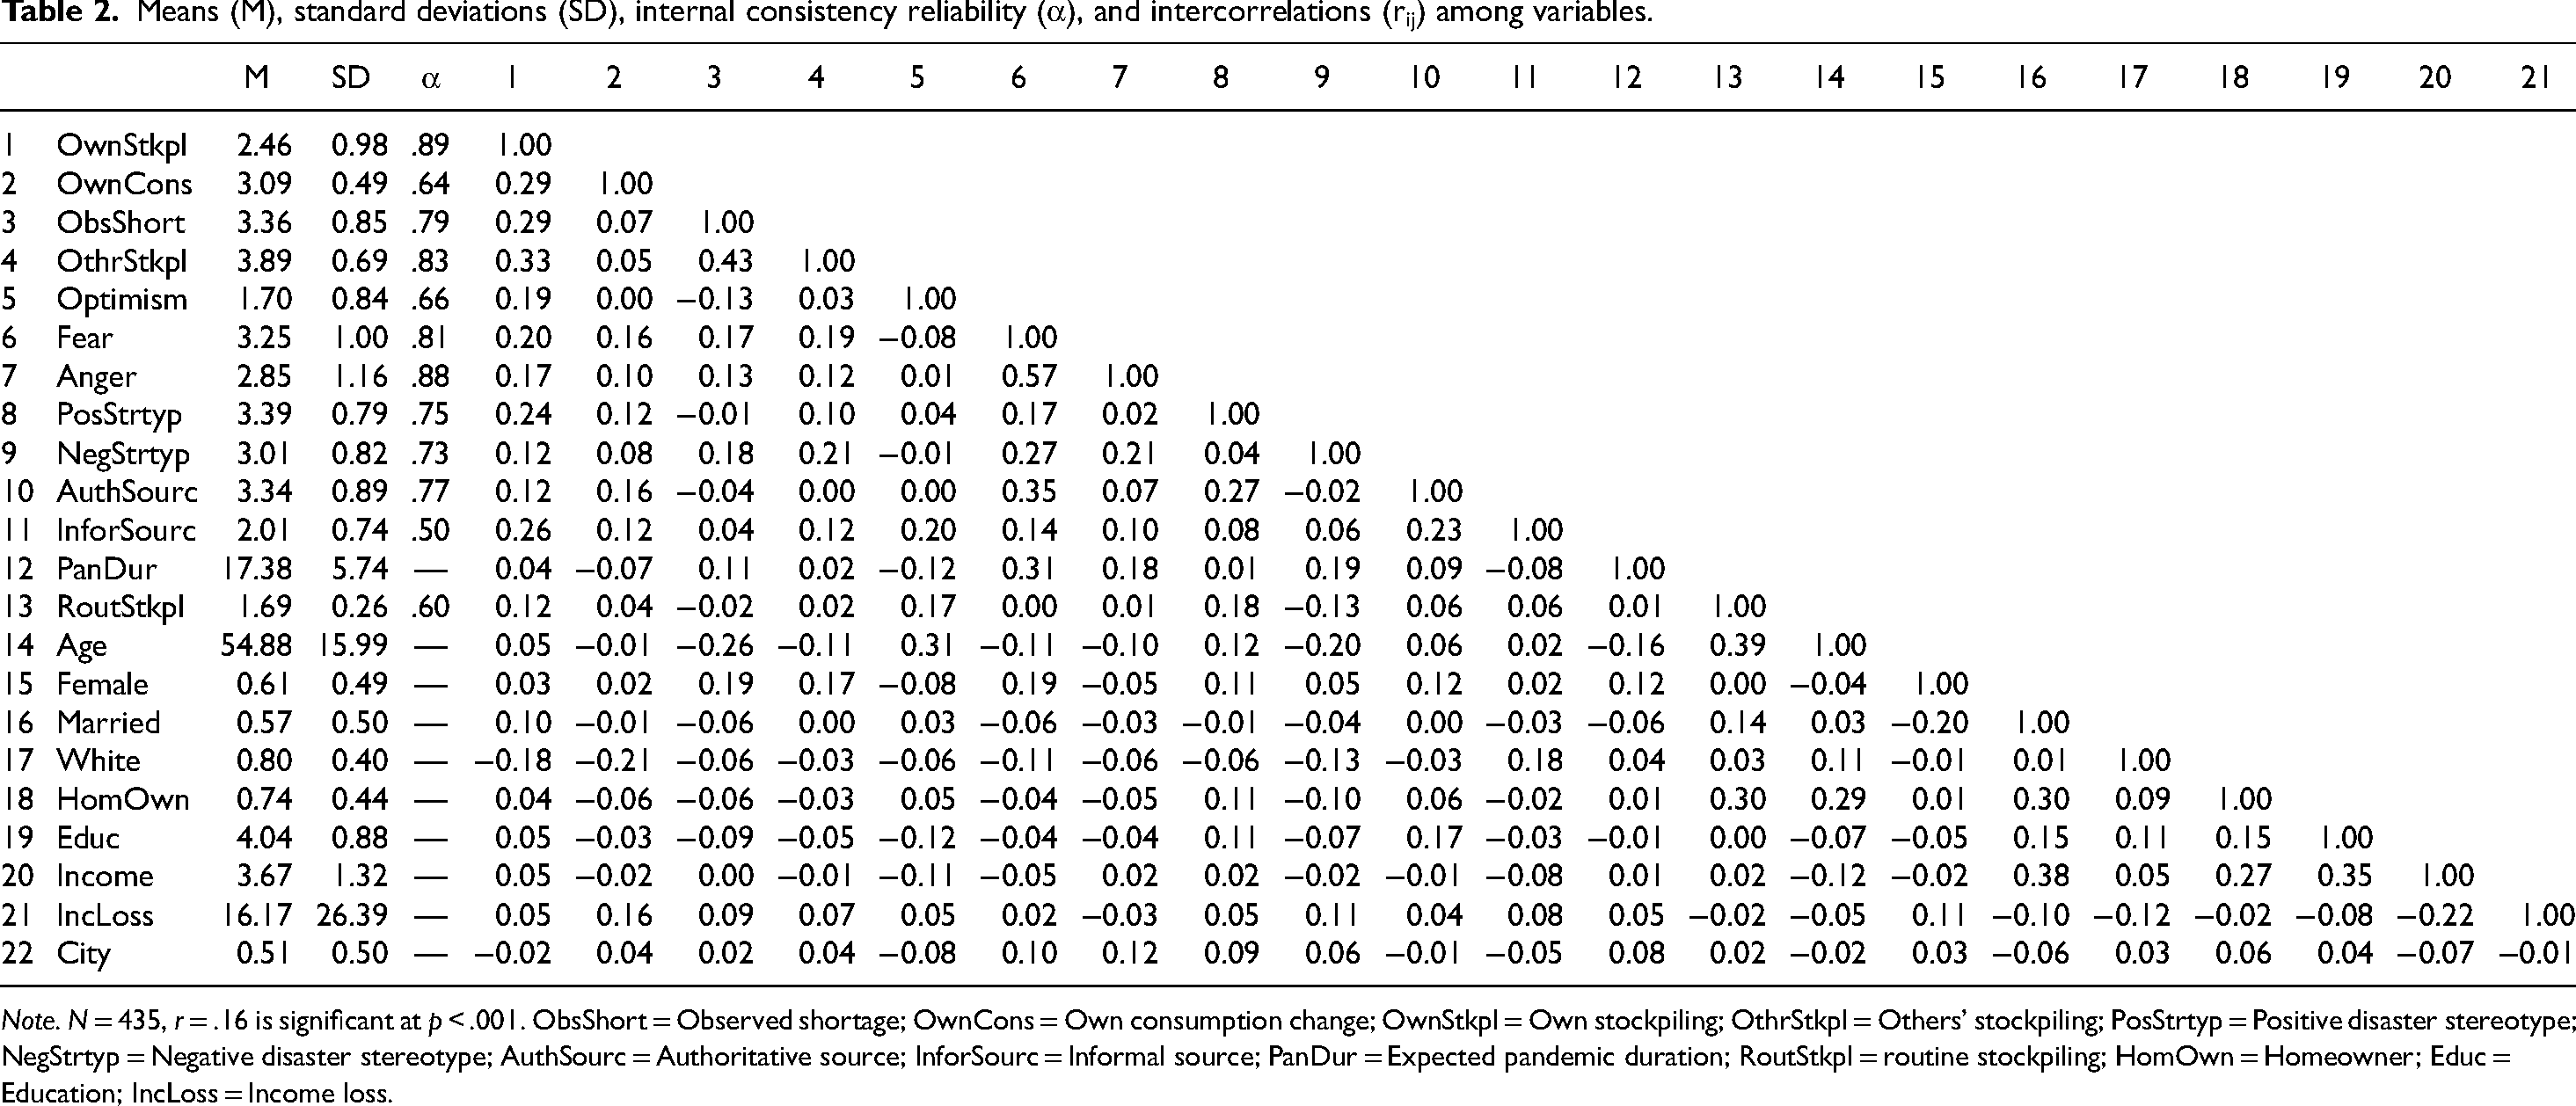
Note. N = 435, r = .16 is significant at p < .001. ObsShort = Observed shortage; OwnCons = Own consumption change; OwnStkpl = Own stockpiling; OthrStkpl = Others’ stockpiling; PosStrtyp = Positive disaster stereotype; NegStrtyp = Negative disaster stereotype; AuthSourc = Authoritative source; InforSourc = Informal source; PanDur = Expected pandemic duration; RoutStkpl = routine stockpiling; HomOwn = Homeowner; Educ = Education; IncLoss = Income loss.
Figure 1 also shows significant increases in own stockpiling for nonperishable foods, cleaning supplies, and sanitary supplies compared to the other consumer products. Specifically, own stockpiling is significantly higher (t415 = 8.11, p < .001, d = 1.15, 11% of the response scale) for nonperishable foods (M = 2.77) than for fresh meat (M = 2.31) and is significantly higher (t417 = 13.28, p < .001, d = 1.16, 19% of the response scale) for sanitary supplies (M = 2.75) than for nonprescription medications (M = 2.00). However, the differences in cleaning supplies from nonperishable foods and sanitary supplies are not statistically significant (t416 = 1.14, p > .26, d = 0.06, 2% of the response scale and t420 = 1.42, p > .16, d = 0.07, 2% of the response scale, respectively).
The analysis for RQ1b (Did people believe that other consumers were stockpiling to a greater extent and in a wider range of categories than they were?) revealed that respondents thought others’ stockpiling (M = 3.89) was significantly greater than their own stockpiling (M = 2.46)—t428 = 28.84, p < .001, Cohen's d = 1.00, 36% of the response scale (Figure 1 and Table 2). Although there were statistically significant differences for all six consumer products, the statistically significant interaction in the MANOVA results indicates that these differences were greater for some products than others. Specifically, the differences between own stockpiling and others’ stockpiling were much greater for sanitary products (d = 1.89, 47.3% of the response scale), cleaning products (d = 1.74, 43.8% of the response scale), and nonprescription medications (d = 1.44, 40.0% of the response scale) than any of the other three products (0.80 < d < 1.44, 22.5–32.8% of the response scale).
In the analysis of RH1a (Own stockpiling will be positively related to personal observation of shortages, own consumption changes, and perceptions of others’ stockpiling.) Table 2 shows that own stockpiling is only marginally correlated with observed shortages (r = . 17), but is moderately related to own consumption changes (r = .29) and perceptions of others’ stockpiling (r = .33).
Moreover, the analysis of RH1b (Own stockpiling will be positively related to affective responses.) indicates that own stockpiling is marginally related to affective responses (optimism r = .19, fear r = .20, anger r = .17). The similarity in these correlations is surprising because there are significant differences in the mean ratings of these affective states (Wilk's Λ = 0.44, F2, 422 = 272.13, p < .001; 39% of response scale). Table 2 indicates respondents had moderate levels of fear (M = 3.25) and minimal levels of optimism (M = 1.70), with anger (M = 2.85) closer to fear (t426 = 7.82, p < .001, d = 1.01, 10% of the response scale) than to optimism (t423 = 16.52, p < .001, d = 1.44, 29% of the response scale). Despite the significant differences between the mean ratings of fear and anger, the two affective states are very strongly correlated (r = .57).
The analysis of RH1c (Own stockpiling will be positively related to negative disaster stereotypes and negatively related to positive disaster stereotypes.) shows that own stockpiling is significantly related to positive disaster stereotypes (r = .24), but not negative disaster stereotypes (r = .12), and the two types of stereotypes were not significantly correlated (r = .04). The differences in the correlations with own stockpiling is somewhat surprising because Table 2 indicates a somewhat stronger belief in positive (M = 3.39) than negative (M = 3.01) disaster stereotypes (t421 = 7.04, p < .001, d = 1.12; 10% of response scale).
Analyses for RQ2 (Will own stockpiling have stronger positive relations with reliance on authoritative information sources than with informal information sources?) indicate that own stockpiling is significantly related to reliance on informal sources (r = .26) but not authoritative sources (r = .12), even though the two types of sources are significantly correlated (r = .23). There are significant differences among sources (Wilk's Λ = 0.23, t6, 411 = 223.79, p < .001, 61% of the response scale), with respondents relying significantly more on authoritative sources such as public health officials (M = 4.17) than on informal sources such as social media (M = 1.74). In addition, ratings for the authoritative sources are strongly correlated (average correlation,
The analysis of RQ3 (Is own stockpiling related to expected pandemic duration, routine stockpiling, and demographic characteristics?) shows that own stockpiling is unrelated to expected pandemic duration (r = .04) and routine stockpiling (r = .12). However, it is negatively related to White ethnicity (r = −.18) but not any of the other demographic characteristics (−.02 ≤ r ≤ .10).
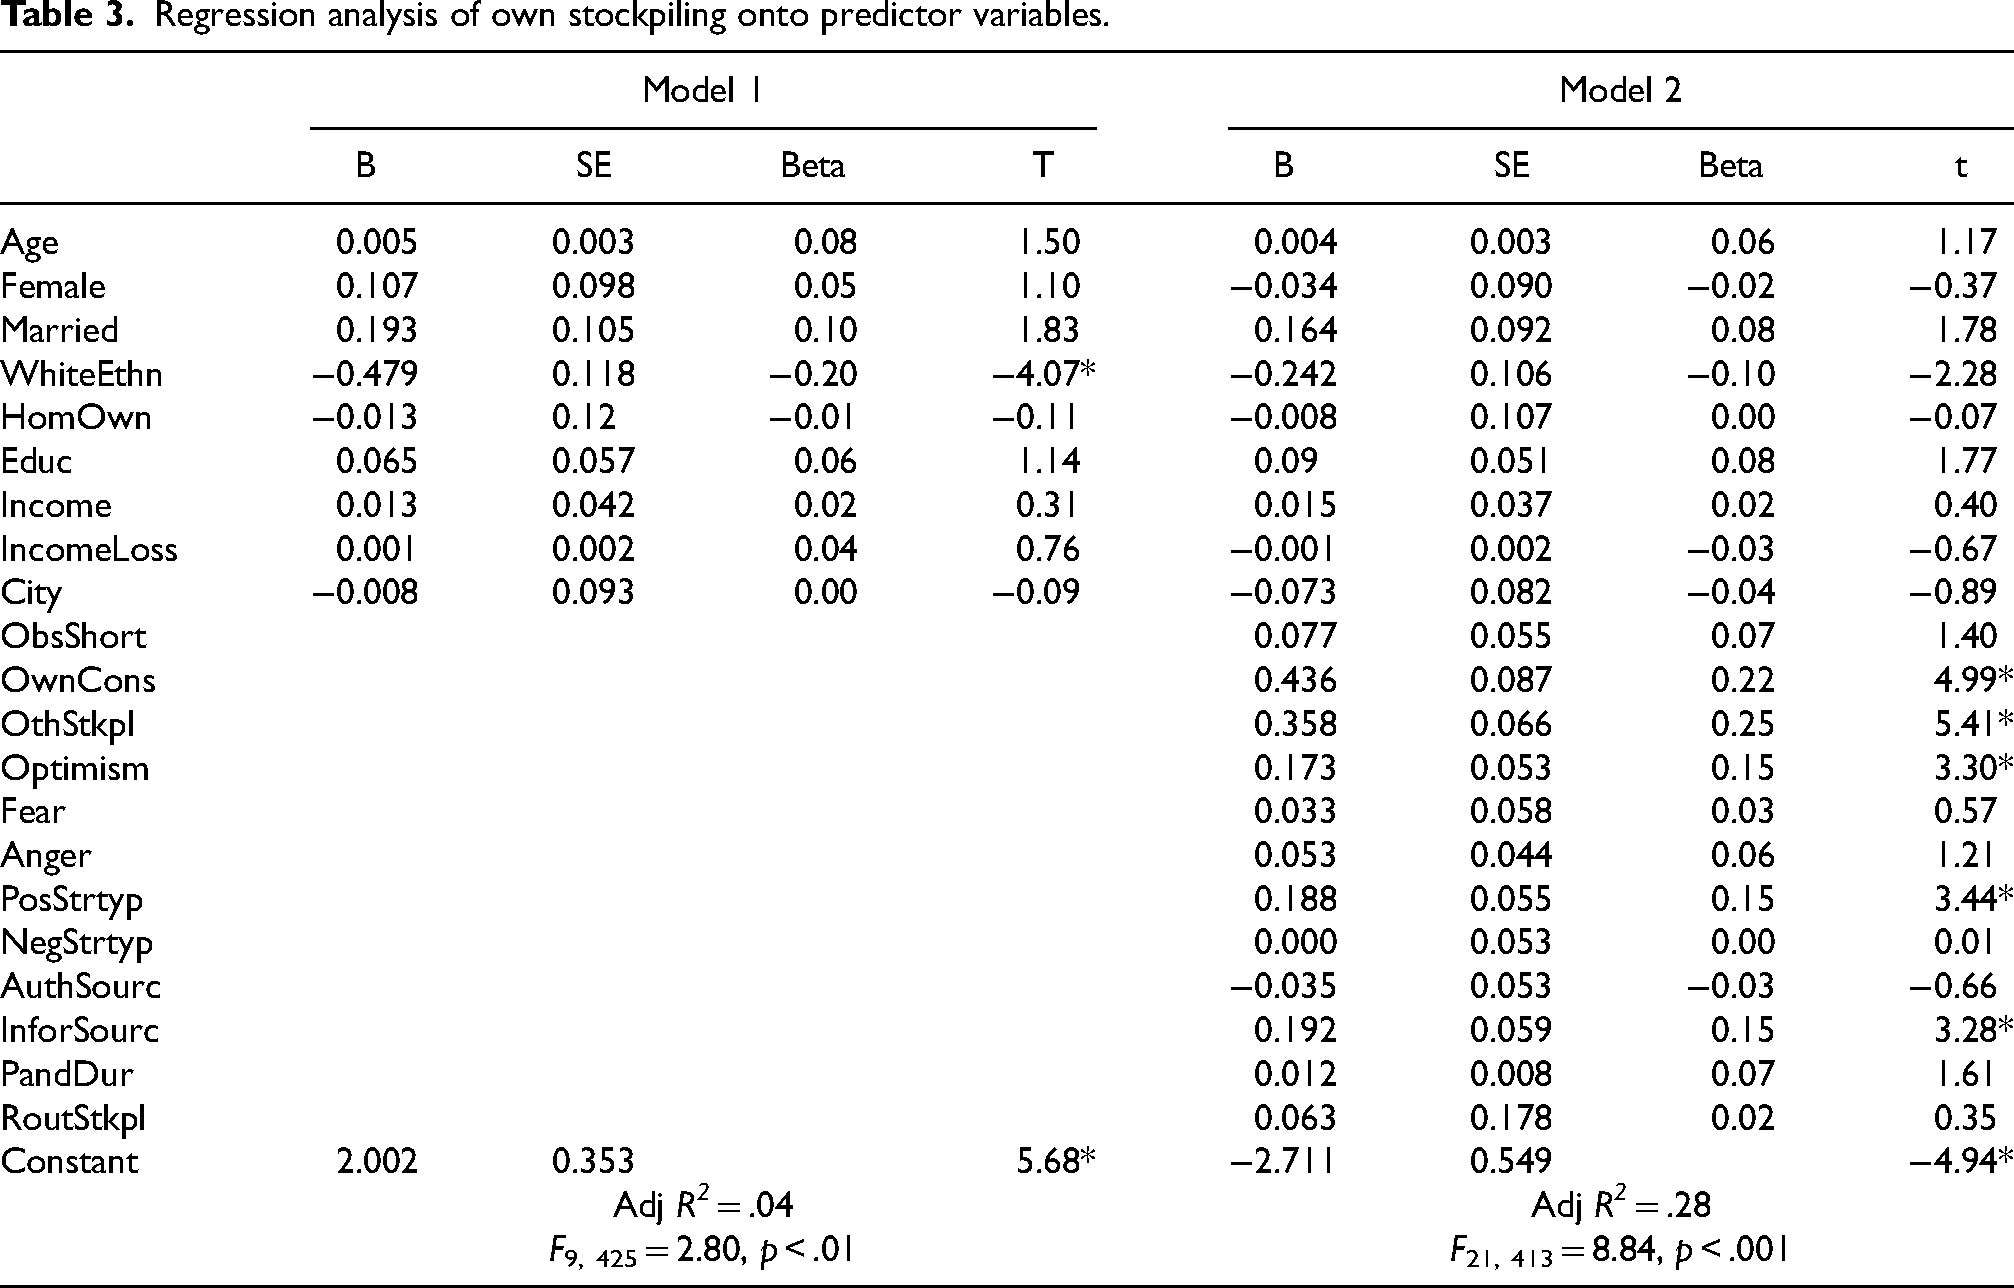
The results of the correlation analyses in RH1a–RH1c, RQ2, and RQ3 provide a preliminary basis for conclusions about the bivariate relationships of own stockpiling with its possible antecedents, but the regression analyses in Table 3 provide a multivariate analysis that simultaneously controls for the effects of all predictor variables. Model 1, which shows the results from regressing own stockpiling onto the demographic variables alone reveals that White ethnicity is the only significant predictor (Adj R2 = .04; F9, 425 = 2.80, p < .01). However, this effect of ethnicity disappears in Model 2, which also regresses own stockpiling onto psychological and behavioral variables (Adj R2 = .28; F21, 413 = 8.84, p < .001). Model 2 shows that others’ stockpiling (β = .25) is the strongest predictor, followed by own consumption changes (β = .22), optimism (β = .15), positive disaster stereotypes (β = .15), and informal information sources (β = .15).
Regression analysis of own stockpiling onto predictor variables.
Finally, the analysis of RH2 (Perceptions of other consumers’ stockpiling will be positively correlated with personal observations of shortages.) shows that perceptions of others’ stockpiling are strongly related to observed shortages (r = .43).
In addition to addressing the RHs and RQs, Table 2 also reveals a very consistent but unexpected pattern, which is that fear is significantly correlated with anger (r = .57), reliance on authoritative sources (r = .35), expected pandemic duration (r = .31), and negative disaster stereotypes (r = .27). Moreover, fear has smaller but still statistically significant correlations with female gender (r = .19), others’ stockpiling (r = .19), observed shortages (r = .17), positive disaster stereotypes (r = .17), and own consumption changes (r = .16). In addition, there is a positive correlation of positive disaster stereotypes with authoritative information sources (r = .29).
Discussion
Research questions and research hypotheses
The analyses of RQ1a (Did people discriminate in terms of the quantity of different product categories in their reports of observed shortages, their own consumption changes, and their own stockpiling?) show that the respondents had a differentiated view of consumer product shortages. Their consumption changes were limited principally to cleaning products, sanitary products, and nonperishable foods. The increased use of cleaning products and sanitary products follows from the CDC's early concern about COVID transmission by fomites—surfaces on which the virus is deposited and later transmitted by touching the eyes, nose, or mouth. The purchase of larger than normal supplies of nonperishable foods is consistent with a desire to minimize COVID exposure by reducing the number of trips to crowded indoor locations, again in compliance with CDC recommendations. As is the case with their own consumption changes, the respondents differentiated among the six categories of consumer products in their own stockpiling, with stocks of cleaning products, sanitary products, and nonperishable foods being increased moderately, but significantly, more than fresh produce, fresh meat, or nonprescription medications. These results are consistent with those of O’Connell et al. (2021) but seem to differ from the conclusions in Bentall et al. (2021) and Hori and Iwamoto (2014). However, the Bentall et al. (2021) conclusion was based upon the consumer goods categories being defined by a single factor, which means that they were highly correlated (
The respondents strongly differentiated among the six categories of consumer products in their reports of observed shortages, indicating much more severe shortages for cleaning products and sanitary products than fresh produce, fresh meat, nonperishable foods, and nonprescription medications. Respondents’ differentiation among product categories in their own stockpiling, and the finding that the pattern of own stockpiling generally followed that of increased consumption of cleaning products and sanitary supplies, is inconsistent with the widespread characterization of COVID stockpiling as “panic buying” because the latter would imply that people were purchasing indiscriminately. In addition, it appears that observations of retail shortages served as an environmental cue for own stockpiling because Figure 1 shows that cleaning products and sanitary supplies also were reported to be the consumer products that had the greatest extent of observed shortages. One could call this “herding” behavior (Kassas and Nayga 2021; Leung et al. 2021), but that term clearly implies that own stockpiling was mindless social conformity rather than a reasoned response to a salient environmental cue. By contrast, the finding that own stockpiling followed the same pattern as own consumption changes suggest that the respondents’ increased use of cleaning and sanitary supplies, possibly coupled with a decrease in the frequency of shopping trips, is an extremely reasonable explanation for the increase in their own stockpiling during the early months of the COVID pandemic.
The analyses of RQ1b (Did people believe that other consumers were stockpiling to a greater extent and in a wider range of categories than they were?) show that the respondents’ perceptions of others’ stockpiling also strongly differentiated among the six categories of consumer products in a pattern that approximately paralleled that of their own stockpiling, but was much greater in magnitude for cleaning supplies and sanitary supplies than for the other four consumer products categories. These differences are consistent with the BTAE (Zell et al. 2020). That is, the respondents considered themselves to be better than average in their ability to refrain from excessive stockpiling. These differences are also consistent with the 3PE, which suggests that the respondents thought other people were more influenced by shortages observed in the stores or reported in the news media.
The analyses of RH1a (Own stockpiling will be positively related to personal observation of shortages, own consumption changes, and perceptions of others’ stockpiling.) show that own stockpiling is only weakly correlated with observed shortages (r = .17), which has a nonsignificant regression coefficient (β = .07) when other variables are controlled. These results also contradict the characterization of retail shortages as the sole result of “herd behavior” in which people reflexively conform to others’ behavior (e.g., Kassas and Nayga 2021; Leung et al. 2021). Instead, own stockpiling is related to both own consumption changes (r = .29, β = .22) and perceptions others’ stockpiling (r = .33, β = .25). The effect of own consumption is easy to explain; an increased rate of cleaning product use would logically require an increased stockpile even if there were no concerns about shortages of these products. For example, someone who normally uses 250 ml of chlorine bleach per week, but increased that to 500 ml per week during the pandemic, might quite rationally increase their normal stock from 500 ml to 1 L to establish a two-week supply. The effect of perceptions of others’ stockpiling is somewhat more ambiguous. One explanation is that perceptions of others’ stockpiling induced a sense of competition for scarce products that increased the respondents’ own stockpiling. The alternative explanation is one of reverse causality—the respondents assumed that, if they were stockpiling, others were too. Unfortunately, this study's cross-sectional design precludes a determination of which one of these two explanations is correct or if, perhaps, both (or neither) are correct. In any event, the finding that own stockpiling is just as strongly related to own consumption as to perceptions of others’ consumption suggests that panicked competition for scarce resources is not the only explanation for crisis stockpiling.
The analyses of RH1b (Own stockpiling will be positively related to affective responses) show that own stockpiling has equally strong correlations with fear (r = .20), optimism (r = .19), and anger (r = .17). However, the regression analysis reveals that only optimism (β = .25) has a significant regression coefficient. Nonetheless, the results for affective responses are somewhat ambiguous because the zero-order correlations of own stockpiling with optimism, fear, and anger are so similar—especially because fear and anger are highly correlated (r = .57). Although it is not reasonable to conclude that any of the three affective responses are more important than the other two in predicting own stockpiling, it is reasonable to conclude that none of these affective responses is as important as own consumption changes and perceptions of others’ stockpiling. In summary, these analyses provide little or no support for the premise that “panic buying” is determined solely by fear, especially because respondents rated themselves as having only moderate (M = 3.25) rather than extreme (i.e., M ∼ 5.0) levels of fear, as would be expected from the “panic buying” label. It is unsurprising that they had low levels of optimism (M = 1.70), a result that does not conflict with the “panic buying” label. However, it is noteworthy that their levels of anger were almost as high (M = 2.85) as their levels of fear, which is consistent with research reporting that many disaster victims blame others for their misfortune (Singer 1982; Gaillard, Liamzon and Villanueva 2007).
The analyses of RH1c (Own stockpiling will be positively related to negative disaster stereotypes and negatively related to positive disaster stereotypes.) show that own stockpiling is more strongly related to positive disaster stereotypes (r = .24, β = .15) than negative disaster stereotypes (r = .12, β = .00), a result that is quite surprising because one would assume that negative disaster stereotypes would activate beliefs about the need to compete for scarce resources and, thus, increase own stockpiling. By contrast, the items in the positive disaster stereotypes scale refer to self-reliance and prosocial behavior associated with the therapeutic/altruistic community (Fritz 1961; Drury 2018). This suggests that own stockpiling is more strongly determined by a desire to help family and friends than to protect themselves from others.
It is also surprising that belief in positive disaster stereotypes (M = 3.39 is slightly higher than belief in negative disaster stereotypes (M = 3.01) because previous research has reported widespread belief in negative disaster stereotypes (Nogami 2018). However, most of this research has focused on the prevalence of negative stereotypes without also examining positive stereotypes (Nogami 2020). The present results suggest that future research should continue to examine people's beliefs about the extent to which disaster victims engage in positive coping activities that protect themselves and their families; contribute time or money to help friends, relatives, and neighbors; and contribute time or money to help strangers (Fritz 1961; Drury 2018).
The analyses of RQ2 (Will own stockpiling have stronger positive relations with reliance on authoritative information sources than with informal information sources?) show that own stockpiling is more strongly related to informal information sources (r = .26, β = .15) than authoritative information sources (r = .12, β = −.03). These results are somewhat surprising because Table 2 shows that the respondents reported relying much more on authoritative sources (M = 3.34) than on informal sources (M = 2.01). These two clusters of sources differ from Drabek's (1986) typology of authorities, news media, and peers because the present study grouped most of the authorities with the news media and grouped national elected officials (normally considered one of the authorities) with peers and social media. This deviation from Drabek's (1986) typology is probably due to these respondents thinking of President Trump as the exemplar of “national elected officials” and his opposition to masking, coupled with his endorsement of COVID remedies that lack scientific support. This suggests that he was perceived to lack the expertise and trustworthiness that are associated with technical experts (public health officials) and the local and state elected officials in these two metropolitan areas who followed the recommendations of public health authorities.
More generally, these data are consistent with the Lindell, Lu and Prater (2005) finding that coastal residents paid more attention to local and national news media than to the Internet and peers as Hurricane Lili approached. By contrast, Steelman et al. (2015) found that news media and peers were the most common information sources in five large wildfires, authorities were moderately common, and social media were the least common. Moreover, Nogami and Yoshida (2014) reported that news media and Internet websites were much more likely to be named as disaster information sources than peers and social media although they were not necessarily considered to be more credible. Nonetheless, social media can be major sources of accurate information as well as misinformation and disinformation (Simon, Goldberg and Adini 2015; Luna and Pennock 2018). The COVID survey data in the present study are more consistent with the Wei et al. (2018) finding that physicians and public health personnel are considered to have the greatest expertise, trustworthiness, and protection responsibility for seasonal influenza. However, the Wei et al. data showed a much greater difference between physicians and public health personnel, on the one hand, and local elected officials and news media on the other hand. Moreover, there were minimal differences between local elected officials and news media on the one hand, and Internet and peers, on the other hand. The differences in the findings from these studies indicate that researchers should continue to investigate differences in the perceptions of information sources as a function of different types of hazards.
The analyses of RQ3 (Is own stockpiling related to expected pandemic duration, routine stockpiling, and demographic characteristics?) show that expected pandemic duration has a nonsignificant correlation (r = .04) and a nonsignificant regression coefficient (β = .07) with own stockpiling, which is somewhat surprising because one would expect that those who expected longer durations would engage in greater levels of stockpiling. A plausible explanation is that respondents drew a distinction between the duration of the COVID crisis and the duration of consumer product shortages. If they thought any consumer product shortages would be resolved before they ran out of essential products, there would be no need to stockpile. Since this explanation is speculative, future research on crisis stockpiling should test it.
In addition, own stockpiling for the COVID crisis is unrelated to routine stockpiling for other types of emergencies (r = .12, β = .02). That is, there is no evidence for either a positive or a negative effect of routine stockpiling for other emergencies on crisis stockpiling for possible COVID-caused shortages. One possible explanation is that COVID stockpiling focused on cleaning and sanitary supplies, which are largely irrelevant to preparedness for earthquakes—a major hazard for the Seattle and Portland areas. Moreover, contrary to Beatty, Shimshack and Volpe (2019), own stockpiling is weakly correlated with White ethnicity (r = −.18) with the opposite sign that Beatty, Shimshack and Volpe (2019) reported. In addition, it has a regression coefficient (β = −.10) that is nonsignificant when controlling for psychological and behavioral variables. Moreover, own stockpiling is unrelated to income (r = .05, β = .02), as well as the other demographic characteristics. These results are consistent with the conclusions drawn in reviews by Baker (1991), Huang, Lindell and Prater (2016), Lindell and Perry (2000), and Lindell (2013) that demographic variables have small and inconsistent effects on hazard-related behaviors—perhaps because they have indirect effects that are mediated by psychological variables.
The analyses of RH2 (Perceptions of others’ stockpiling will be positively related to people's personal observations of shortages.) show that there is a significant correlation between these variables (r = .43). Given the cross-sectional nature of these data, it is not possible to determine conclusively if the respondents thought that (a) observed shortages caused others to stockpile, (b) other people's stockpiling caused observed shortages, or (c) there was a reciprocal interaction between these two effects. However, the significantly higher ratings on others’ stockpiling than on observed shortages for the other four product categories (fresh produce, fresh meat, nonperishable food, and nonprescription medicines) suggests that the respondents thought other people were stockpiling to a greater extent than was caused by their observations of retail shortages. Moreover, the data suggest that people did, indeed, blame other consumers for this problem. This is logical because searching for someone to blame is a common reaction to disaster impacts (Drabek and Quarantelli 1967; Singer 1982; Olson 2000; Gaillard, Liamzon and Villanueva 2007) and other consumers are an obvious scapegoats for any observed product shortages. It is interesting to note, however, that some observers have called attention to wholesalers’ and retailers’ failure to anticipate the increased demand and expedite increased supplies of products through their supply chains (Banker 2021).
Study limitations
One obvious study limitation is the 31% response rate, which is far less than the 100% response rate that would guarantee sample representativeness. However, it is consistent with contemporary mail survey response rates, which have declined substantially over the last 50 years (Kohut et al. 2012; Kreuter 2013). More specifically, Table 1 shows that there are only modest differences between the demographic characteristics of the samples compared to the metropolitan areas from which they were drawn. Moreover, these differences are unlikely to be problematic because there are only small and inconsistent relationships of demographic characteristics with preparedness (Lindell and Perry 2000; Lindell 2013), and response (Baker 1991; Huang, Lindell and Prater 2016) to environmental hazards. Moreover, this conclusion is consistent with that of other analysts, who have concluded that low response rates do not appear to bias central tendency estimates such as means and proportions (Curtin, Presser and Singer 2000; Keeter et al. 2000). Consequently, it is unlikely that bias in these sample demographic characteristics has a significant influence on any conclusions drawn from the tests of means in RQ1a-RQ1b. In addition, response rate appears to be less of an issue than adequate variation on the independent and dependent variables in obtaining accurate estimates of correlation coefficients (Lindell and Perry 2000). Thus, the sample's lack of complete demographic representativeness is unlikely to affect the correlation and regression results in RH1a–RH1c, RQ2, and RQ3.
A second limitation is that the sample is limited to two metropolitan areas in the Pacific Northwest. This raises the question of whether the results can be generalized to other areas of the United States or other countries—especially since many aspects of COVID response have become intensely politicized. However, there is no obvious reason why the later politicization of mask-wearing and immunization would extend to the early crisis stockpiling, given that mask-wearing and immunization became issues months after the peak of crisis stockpiling. In any event, the study results show that there are at least two metropolitan areas in which the “panic buying” label can be rejected.
Another potential limitation is that the analyses rely on the accuracy of respondents’ self-reports of their past consumption and stockpiling, as well as their recall of their observations of product shortages and their beliefs about others’ stockpiling. Retrospective self-reports may be less of a problem than they appear because a number of studies have documented the accuracy of self-reports of disaster responses as much as 18 months after an event (for a summary, see Lindell et al. 2016). However, Wu (2020) found that self-reports of affective responses at 7- and 14-month intervals were less similar than self-reports of behavioral responses.
Finally, the results might seem to be limited by the fact that the questionnaire only asked about utilitarian products but not about hedonic products. One might argue that the case for rational, problem-focused coping requires data showing that people engaged in no emotion-focused coping, as indicated by an avoidance of hedonic product purchases (Holbrook and Hirschman 1982). Although that study design would be even more informative, it does not negate the present study's finding of substantial evidence for problem-focused coping that demonstrates the “panic buying” label substantially understates the rationality of people's crisis stockpiling.
Conclusions
Although many articles have referred to “panic buying,” there has been a pervasive failure to provide empirical evidence in support of what can more neutrally be called crisis stockpiling. In its most extreme definition, “panic buying” implies that people purchased random assortments of products, which Figure 1 shows is clearly not the case. Instead, respondents reported only modest increases in their stockpiles of consumer products that focused more directly on relevant utilitarian products. Moreover, although respondents reported significantly higher levels of fear than optimism and anger, the level of fear was only slightly above the scale midpoint (M = 3.25 on a 5-point scale). Further, the correlations of own stockpiling with fear were no higher than the corresponding correlations with anger and optimism. Thus, the data from this survey indicate that “panic buying” is not a reasonable label for the amount of households’ crisis stockpiling that occurred.
The data from this study also suggest that, since own stockpiling is significantly correlated with increases in own consumption, it will be important in future pandemics for manufacturers of cleaning and sanitary products to increase shipments to retailers to avoid stockouts and excessive stockpiling. In addition, manufacturers should let consumers know that they are increasing production to overcome any stockouts as soon as possible and, ideally, provide forecasts of the date that they will be able to meet increased demand. In addition, local officials should seek to foster consumers’ positive disaster stereotypes, especially by using informal channels such as social media. If these issues are successfully addressed, it will be possible to avoid seeing people unnecessarily transferring excessive stocks of consumer goods from stores’ publicly accessible shelves to people's privately accessible pantries.
Footnotes
Data availability statement
The data are available from the author upon reasonable request.
Declaration of conflicting interests
The author declared no potential conflicts of interest with respect to the research, authorship, and/or publication of this article.
Funding
The author disclosed receipt of the following financial support for the research, authorship, and/or publication of this article: This work was supported by the US National Science Foundation, (grant number CMMI-2029817).
Author Biography
Appendix A: Summary of Measures
Activities—changed consumption or use, encountered reduced supplies, increased own stockpiles at home, average household increased their stockpiles (Not at all = 1 to Very great extent = 5).
Consumer products—fresh fruits and vegetables, fresh meat and poultry, nonperishable food (dehydrated or canned food), cleaning supplies (e.g., bleach, rubbing alcohol), sanitary supplies (e.g., facial tissues, toilet paper), and nonprescription medications (e.g., decongestants).
Affective responses—Optimism (α = .66): optimistic, energetic, alert; Fear (α = .81): depressed, nervous, fearful; Anger (α = .88): angry, annoyed, or irritated. (Not at all = 1 to Very great extent = 5).
Disaster stereotypes—Positive (α = .75): cope with the situation in a way that protects themselves and their families; contribute time or money to help friends, relatives, and neighbors; contribute time or money to help strangers; Negative (α = .73) be so shocked and confused that they cannot cope with the situation; be so afraid that they do things that actually endanger themselves; do things that disregard the health and safety of other people, deliberately take advantage of other people financially (Not at all = 1 to Very great extent = 5).
Reliance on information sources—Authoritative sources (α = .77): public health officials, local government elected officials, state government elected officials, news media reporters (TV, radio, newspapers); Informal sources (α = .50): national government elected officials, social media sources (e.g., Twitter, Facebook, mobile news), and friends, relatives, neighbors and coworkers.
Expected pandemic duration—how many months the COVID crisis would disrupt their daily life (0, 3, 6, 9, 12, 15, 18, 21, 24 or more).
Routine stockpiling (α = .60)—a working portable radio with spare batteries or hand crank, at least 4 gallons of water per person in plastic containers, a two-week supply of nonperishable food, at least a one-week supply of prescription medicines, and a flashlight with extra batteries (No = 0, Yes = 1).
Demographic characteristics—age, sex, marital status (married = 1, other = 0), ethnicity (white = 1, other = 0), homeownership, education (some high school, high school graduate/GED, some college/vocational school, college graduate (2- or 4-year), graduate school), income (<$25,000, $25,000–49,999, $50,000–74,999, $75,000–99,999, >$100,000), percent of usual monthly income earned in the previous month (0–100 in increments of 10).