
Abstract
Local government capacity is an essential precondition to government service delivery. However, previous research has indicated that rural governments frequently face capacity deficits relative to their urban and metropolitan counterparts. A dominant explanation for the relative lack of rural local government capacity is the difference in financial resources. However, this explains the difference between small and large governments, rather than considering other rural identifying characteristics. Using data from the 2019 Municipal Indicators Survey conducted by Georgia's Department of Community Affairs, this study investigates the nuanced relationship between rurality and local government capacities within the State of Georgia. Rather than relying on census-derived measures of rurality, a broad conceptualization of rurality is employed with diverse operationalization, including measures for various rural aspects including urban isolation (i.e., geographic distance from the nearest urban city or county), isolation from connective transit infrastructure, population levels as well as population density, and local government density (i.e., the number of nearby local governments). Findings reveal that greater urban and governmental isolation are negatively associated with response and anticipatory capacity, even when controlling for local government revenues and population. These results highlight the limitations of categorical U.S. federal measures in rural research, underscoring the importance of capturing within-rural variation to better understand urban-rural divides.
Introduction
The concept of organizational capacity has long been central to both public administration scholarship and practice, yet its definition remains contested. In the context of local government, is generally defined as a “government's ability to develop, direct, and control its resources to support the discharge of its policy and program responsibilities” (Donahue et al., 2000, p. 381) or, more simply, a government's “ability to achieve its aims” (Berman & Wang, 2000, p. 410). This makes capacity a critical precondition of government performance (Hou et al., 2003, p. 296). As a result, concerns about local government capacity were a foundational aspect of the creation of public administration as a field (Addams, 1905). As the field evolved, there were attempts to improve the conceptualization and measurement of local government capacity (Brown, 1980; Gargan, 1981). The emergence of the international New Public Management (NPM) movement and other subsequent reform efforts concerned with improving real and perceived shortcomings in government performance have made local government capacity a salient topic for practitioners and researchers alike in recent decades (Christensen & Gazley, 2008; Donahue et al., 2000). However, capacity-focused local government research has too frequently concentrated on metropolitan and urban areas while neglecting rural regions (Hall, 2022). With a frequent focus on metropolitan capacity, there has been limited attention to how rurality is conceptualized and what it means for understanding local government capacity. Limited rural local government capacity may hinder effective policy implementation, impacting rural community well-being and development.
This article examines which specific indicators of rurality are associated with multi-dimensional capacity deficits among local governments in the U.S. State of Georgia. Previously, when rural administration research has been pursued, “researchers often examine ruralness in the shallows, as when ruralness becomes the binary opposite of urbanness in a dummy variable in multivariate modeling” (Gabehart, 2023, p. 484). However, even with this combination of “shallow” research and a general lack of rural local government capacity research, scholars have identified “an underlying theme across the literature [which] is the challenge of limited capacity among rural governments” (Helpap, 2019, p. 8).
In rural areas, there is a growing need for a better understanding of and addressing the challenges of limited local government capacity. Troubling rural trends continue to grow and emerge as rural areas continue to lag behind their urban and metropolitan counterparts on many key indicators. Rural areas are increasingly falling behind in access to post-secondary education, healthcare, broadband, and social services (Marre, 2020). Additionally, since 1980, nonmetropolitan areas in the United States have lost population, whereas metropolitan areas have seen their collective population grow by over 100 million people (Lichter & Johnson, 2023). Broader economic and environmental factors also pose problems for the long-term health of many rural communities. In these challenging circumstances, citizens and community groups often seek to utilize rural local governance networks to develop problem-solving capacity (Vasstrøm & Normann, 2019).
Rural local governments often struggle to engage in large-scale problem-solving or pursue comprehensive policy solutions effectively. Without adequate inputs (e.g., volunteer administrative staff and revenue), it is often more difficult for local rural governments than urban governments to perform routine and required functions (Honadle, 1981 and 2001; Dougherty et al., 1999; Lobao and Kelly, 2019). Despite this rural deficit in inputs, addressing the difficult policy problems in rural areas should not solely focus on organizational input levels, as these are distinct from capacity. “[D]efining capacity as a set of discrete inputs misses the organizational dynamics of how these inputs are melded together to create operational capacity” (Ansell et al., 2021, p. 25). Meaning, defining capacity simply as inputs ignores the management of those inputs, which is critical for achieving policy goals and program responsibilities.
Following the framework of Ansell et al. (2021), I do not focus on predictors of organizational inputs; rather, I evaluate multidimensional capacity deficits and consider capacity as an ensemble of four dimensions. Since there is clear prior evidence that rural areas have limited or lower levels of capacity (Lobao & Kelly, 2019), this multidimensional approach allows for insight into where capacity is being lost in rural areas.
While local government finances and staffing can explain some rural-urban differences in local government capacity, exclusively focusing on these dimensions of rurality often overlooks two critical factors in capacity development: the external environment and the role of infrastructure (Christensen and Gazley 2008). These two factors are particularly salient in rural areas which are frequently characterized by their isolation from primary transit routes, other connective infrastructure, urban cores, and tend to have low levels of density both in terms of population and neighboring local governments (i.e., the number of local governments that are proximate to a given local government, see Figure 1 and Table 3) (Lackey et al., 2002; Mohr et al., 2010; Nelson et al., 2021). For this paper, I suggest that rurality deserves a broad conceptualization and contingent measurement strategy. To this end, it is necessary to consider which dimensions of rurality are most relevant to the research question of interest. Considering the relationship between rurality and organizational capacity, I define rurality as a function of 1) low population levels and population density, 2) isolation from urban cores and arterial transit infrastructure, and 3) low levels of local government density. As a result, I test whether geographic distance to primary road infrastructure, urban cores, and local government density are associated with deficits in local government capacity across two dimensions of organizational capacity. I examine this relationship while controlling for traditional rurality measures related to population and fiscal differences. This approach extends the resource-based view of rural local governments beyond traditional concerns with population and budget size to a more expansive view of resources to include rural-specific external, environmental, and infrastructure-related components.
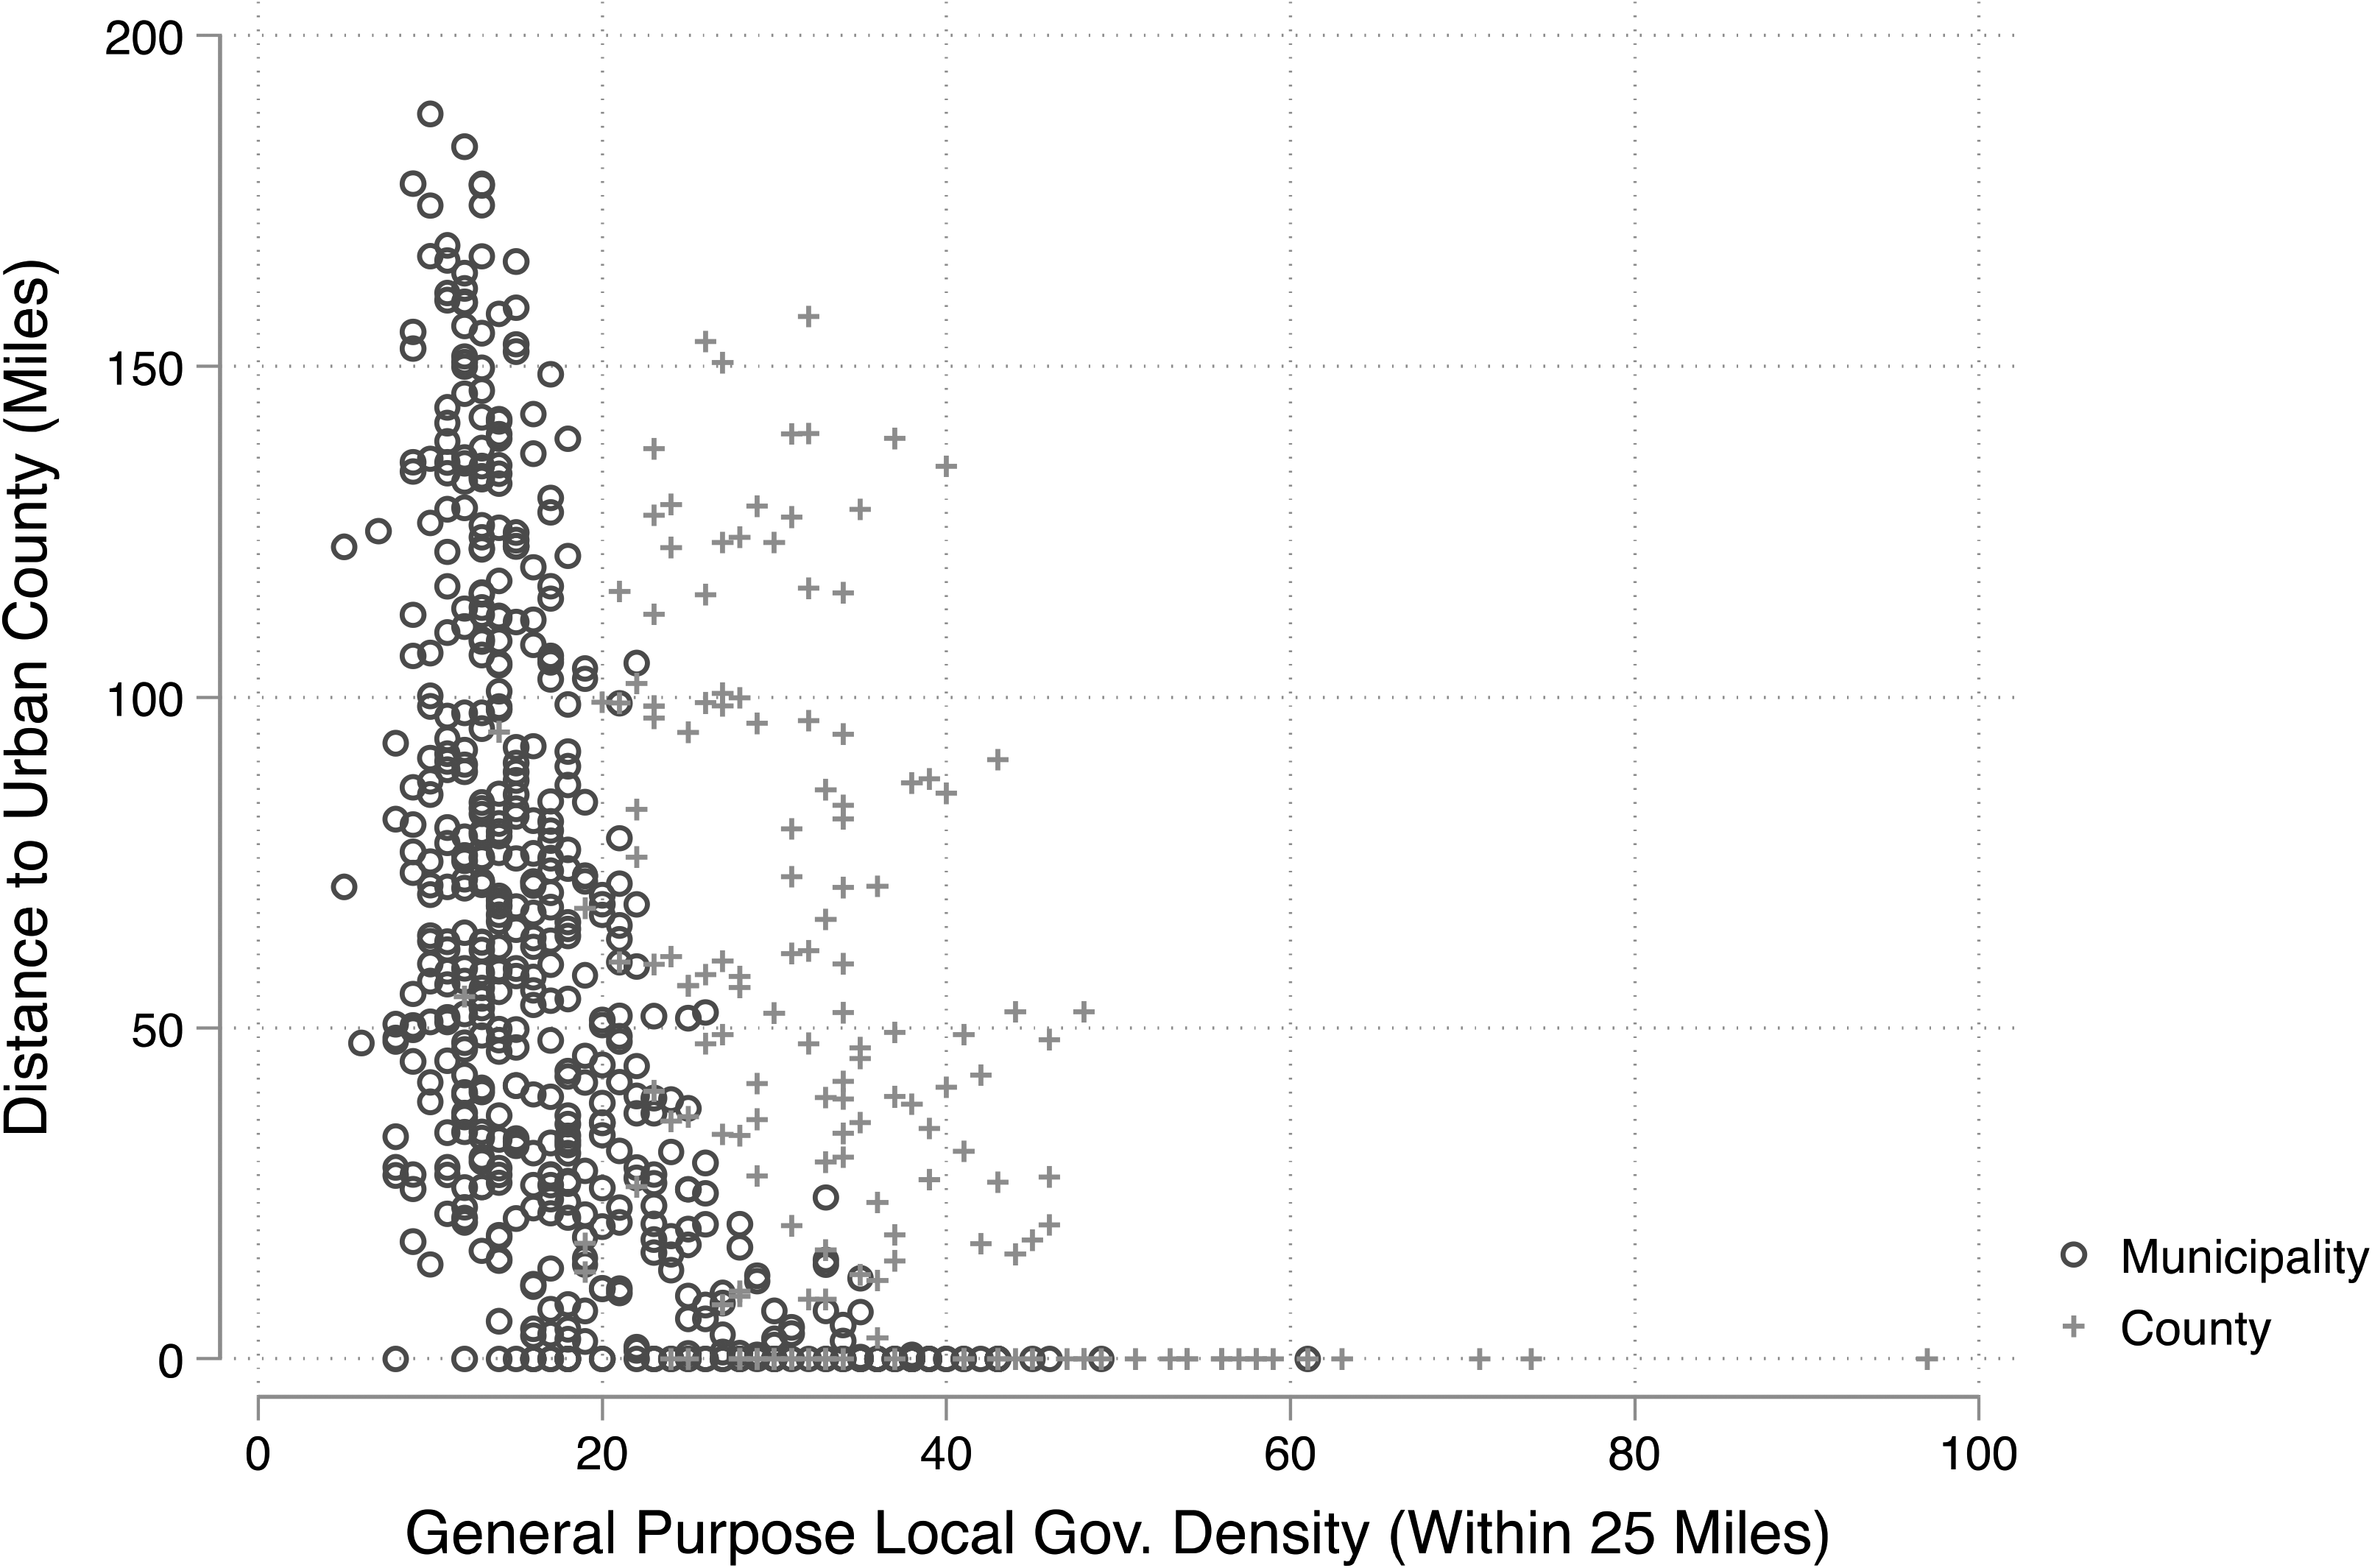
Scatter Plot of the Local Government Density of Georgia Counties and Municipalities.
The findings show that external, environmental, and infrastructure-related indicators of rurality are significantly and negatively associated with multiple dimensions of capacity. Specifically, for response and anticipatory capacity, geographic isolation (i.e., miles from a designated urban county with a population of 200,000 or more) from urban cores was consistently important even when controlling for more traditional measures of rurality based on population and financial resources, which were significant across every dimension of capacity. These population-related and local government finance findings are consistent with previous empirical evidence, which shows that rural capacity deficits in rural areas are at least partially due to lower population and having fewer financial resources and organizational inputs (Dougherty et al., 1999). However, a novel contribution to the literature is revealed through the identification of distinct measures of geographic isolation and local government density as additional factors influencing capacity deficits among local governments. The findings suggest that a lack of local government density limits rural governments’ access to some of the necessary external resources to develop and build capacity (Christensen & Gazley, 2008). Collectively, the results emphasize the intricate and multifaceted nature of rurality and its intricate connection with capacity deficits, offering valuable insights for future rural administration and capacity deficit research.
This research seeks to fill gaps in the literature on rural local government capacity by exploring which specific measures of rurality are significantly associated with capacity deficits, and by identifying what types of capacity are being lost. This article begins with a discussion of the organizational capacity literature as it relates to rural local governments and then provides a theoretical foundation for hypotheses that suggest that various dimensions of rurality are associated with different types of capacity deficits in rural local governments. After explaining the research methodology and presenting the findings from the empirical analysis, this article concludes with implications for rural local governments and directions for the future study of rural governance in public administration.
Organizational Capacity
Local governments are tasked with the delivery of several public services that directly impact the lives of those who live in rural areas. These services range from issuing building permits to providing police and fire services. The essential nature of these services makes the performance of rural local government highly visible and of central importance to voters, local officials, and scholars. However, service delivery, or policy implementation, cannot occur until a government first develops the capacity to “accomplish its work” (Hale & Slaton, 2008, p. 840). This means that capacity is a precondition and “central tenet” of government service delivery (Koerner & Johnston, 2022; McCrea, 2020).
Organizational capacity is a multidimensional resource-based theory (Andrews et al., 2016; Christensen & Gazley, 2008). Resources are broadly defined and can consist of both tangible (e.g., finances, equipment, and staff) and intangible resources (e.g., expertise, experience, reputation, knowledge, etc.) (Lee & Whitford, 2013). These resources can generally be sorted into at least four dimensions of organizational capacity. This means that capacity is partially a function of 1) human resources and leadership, 2) organizational infrastructure, 3) financial management, and 4) characteristics of the external environment. These resources act as inputs into the organizational production process (Honadle, 1981). However, organizational capacity is more than the sum of an organization's inputs.
Organizational capacity is not static; it can be strengthened or weakened depending on how resources are managed. While numerous management competencies may influence capacity, only a few have been explicitly studied in a rural governance context. Research has identified strategic planning (McGuire et al., 1994), regional collaboration (Dabson, 2019), council-manager relationship management (Brown, 1980), and resource acquisition (Helpap, 2019) as beneficial to the practice of rural administration. These management skills play an important role in shaping the effectiveness of rural administration, enabling local governments to navigate challenges and optimize service delivery. Among rural local governments, capacity-focused research has traditionally focused on promoting capacity-building (McGuire et al., 1994), investigating rural governments’ capacity for engaging in various alternative forms of service delivery (Mohr et al., 2010; Warner & Hefetz, 2003), and extreme outcomes such as municipal dissolution as a result of acute financial stress or a total lack of local government capacity (Zhang & Holzer, 2020). More recently, there has been an emerging focus on capacity deficits both in the broader public administration literature and in regard to rural local government capacity deficits (Ansell et al., 2021; Lobao & Kelly, 2019). This analysis continues the recent focus on rural capacity deficits.
Unfortunately, the effects of capacity deficits are not revealed until it is most needed. For example, the COVID-19 pandemic made plain the “decades-long corrosion of federal, state, and local government administrative capacities” (Deslatte, 2020, p. 489), which resulted from decades of chronic underinvestment in public health agencies. Capacity deficits in U.S. public health agencies became evident when they lacked tangible resources, such as healthcare supplies, and intangible resources, such as social capital, necessary to effectively communicate pandemic-related information to diverse audiences. This lack of resources, coupled with inexperienced and ill-prepared management, left the public unable to avoid disparate racial, socioeconomic, and partisan health outcomes during the pandemic (Hegland et al., 2022; Magesh et al., 2021). Following such catastrophic events, the prevention of similar future failures often comes into focus.
Deciding what forms of capacity are most important to protect can be a difficult task for local government administrators. To aid in this decision-making task, Ansell et al. (2021) identify four critical forms of capacity: 1) response capacity, 2) anticipatory capacity, 3) monitoring capacity, and 4) learning capacity. They suggest that losses or deficits among these dimensions of capacities may have a negative “multiplier effect” or steep nonlinear effect on other organizational capacities (Ansell et al., 2021, p. 27). In essence, ignoring or neglecting one of these dimensions of capacity can force an organization to pull resources (e.g., personnel or finances) from other departments or other agencies to compensate for a prior lack of capacity development. In turn, this can damage service delivery capacity in other areas. For example, response capacities are defined by Ansell et al. (2021) as the ability “to act rapidly in response to events and situations” (p. 27). Among rural local governments, this can mean everything from responding to routine emergencies such as 911 calls to addressing the spread of misinformation to assisting with crisis emergencies such as natural disaster recovery. For example, during the COVID-19 pandemic, to better respond to the effects of the virus, many local governments allocated fewer staff and resources to non-mission-critical programs such as those focused on sustainability (Krause, Hawkins and Park, 2023). Anticipation capacity entails preparing for future events, demands, and needs. For rural communities, this can be as general as long-term strategic planning (McGuire et al., 1994) or as specific as having written plans to replace capital-intensive equipment and infrastructure. Due to limitations with the data utilized in this analysis, I only focus on these two dimensions of organizational capacity, specifically response and anticipatory capacity.
This multidimensional conceptualization of public organizational capacity provides a helpful framework for evaluating the most salient dimensions of capacity loss in rural local governments. Rather than restrict capacity to being the function of input-related measures, the Ansell et al. (2021) framework suggests that any response and anticipatory capacity would be especially deleterious to rural local governments. As a result, the analysis in this article focuses on the relationship between rurality and both specific dimensions of organizational capacity. This is important because it is already known that rural local governments have less or more limited capacity than their urban or metropolitan counterparts, at least in the aggregate, especially in regard to input-resource-related measures of capacity that focus on financial resources and staff (Lobao & Kelly, 2019). However, what remains unclear is whether these generalized capacity deficits have negatively affected the critical capacity dimensions identified by Ansell et al. (2021). In other words, rural-urban capacity deficits exist; what remains unclear is which forms of capacity are most adversely affected. Understanding the relationship between rurality and multidimensional capacity requires a discussion of what is meant by the term “rural.”
Rurality
In public administration, rurality is often defined in negative terms—that is, by what it is not. The terms “nonmetropolitan” and “rural” are frequently used interchangeably, with nonmetropolitan status commonly serving as a proxy for rurality (Lobao & Kelly, 2019; McGuire et al., 1994; Mohr et al., 2010). In this approach, rural areas are those that the U.S. Census Bureau and other government agencies classify as outside metropolitan boundaries, typically distant from urban centers (generally cities of 50,000 or more) and characterized by low population size and density. While definitions of rurality remain underdeveloped, metropolitan areas are more clearly articulated in the public administration literature: they are centered around urban cores or large cities, densely populated, and feature overlapping and fragmented local government systems, both horizontally and vertically, particularly in the U.S. federalist context (Parks & Oakerson, 2000). In contrast, federal definitions of rurality emphasize geographic isolation from urban influence and sparse populations, though the operationalization of these criteria varies across agencies. Rural areas also tend to have significantly lower local government density compared to metropolitan regions.
Based on these factors, U.S. agencies often classify counties as either metropolitan or nonmetropolitan, with one common example being the Metropolitan Statistical Area (MSA) designation used by the Office of Management and Budget (OMB). While this binary system is widely used and convenient, it obscures substantial variation within rural areas. For example, a moderately sized city near a metropolitan area may be treated the same as a remote, sparsely populated town, despite clear differences in capacity and context. To differentiate urban and rural, but also capture within-rural variation, improved measurement strategies are necessary. However, before rural measurement can be discussed, a more comprehensive treatment of the conceptualization of rurality is necessary.
For decades, public administration has dealt with “definitional issues with respect to identifying the essential characteristics of rural public administration” (Seroka, 1989, p. 432). However, public administration is not alone in this regard. Other fields, including sociology, political science, public health, sociology, and interdisciplinary journals dedicated to rural studies have struggled with how to best define and measure rurality within their own fields (Bennett et al., 2019; Hart et al., 2005; Lichter & Brown, 2011; Nelson et al., 2021; Nemerever & Rogers, 2021). Systematic reviews (Nelson et al., 2021) and appeals to government-derived classification systems (Bennett et al., 2019; Hart et al., 2005) provide a number of often conflicting definitions to the questions of what rurality means and how it should be measured.
One common solution within the United States is to rely on U.S. Federal methodologies or metrics. However, such measures have the potential to limit the external validity of rural public administration research findings and serve as a barrier to the formation of a cohesive international rural public administration research program. Each country has the right to define rurality however it sees fit. This results in a situation where census-based categorizations can result in situations where what is rural in one country may not be rural in another country. Scholars in public administration and in other fields have suggested a number of definitions that range from rurality being a socially constructed “category of thought” (Gabehart, 2023) to a complex multidimensional concept whose measurement requires various geographic information system (GIS) elements. For example, some measures factor in whether a community has a movie theatre, as well as other quantitative characteristics (Nelson & Nguyen, 2023). It is unlikely that a consensus will soon be reached with respect to the conceptualization and measurement of rurality. Rurality has no clear definition because it encompasses so many potentially relevant dimensions (Nelson et al., 2021). Even if there were a government measure with a transparent methodology and high enough internal validity to warrant exporting to another country, one pursuing this course of action would quickly encounter the modifiable areal unit problem (MAUP) (Fotheringham & Wong, 1991). Wong (2004) describes the MAUP in the following way: the boundaries of geographical units are demarcated artificially, so when data are gathered according to different boundary definitions, different sets of data are generated.
The MAUP is especially problematic for census-based measures because of the geographies that underpin these measures. These census-based geographies do not always easily lend themselves to international comparison. For example, within the United States, what constitutes a census block, urban city or urban cluster measures, and nonmetropolitan and metropolitan area definitions are somewhat arbitrary and tend to shift from decennial census to decennial census (Lichter & Johnson, 2023). If there is a change within a country over time as to what constitutes a geographic boundary, census-based measures of rurality are based on these geographic boundaries; then this not only poses problems for longitudinal analysis but also makes it difficult to apply these boundaries to other countries or contexts (Lichter & Johnson, 2023).
Even within the United States, ordinal measures that provide more insight into within-rural variation, such as rural-urban community area codes (RUCA) or rural-urban continuum codes (RUCC), do not adapt easily to diverse types of local governments, including municipalities, special districts, and school districts. The smallest geographies of these measures are counties for RUCC and census tracts for RUCA. However, these geographies do not easily map onto local governments that may occupy portions of several counties or allow for simple census tract aggregation, since jurisdictions frequently do not map cleanly onto census tracts. More importantly, these diverse measures also often conflict with one another (Hart et al., 2005). Even if a well-developed, census-based rurality measure exists with a transparent methodology that can be applied to other countries, relying on one country's classification may imply that its rurality concept and measurement are superior to those of others. As a result, relying on census-geography-based measures of rurality often complicates rather than clarifies the challenge of defining and measuring rurality. Still, these federal metrics provide valuable insights, particularly since, in many cases, they determine government funding eligibility. Ultimately, however, these federal metrics do not resolve how rurality should be defined or operationalized within the field of public administration.
For this paper, I suggest that rurality deserves a much broader conceptualization paired with a contingent measurement strategy. To this end, it is necessary to consider which dimensions of rurality are most relevant to the research question of interest. Considering the relationship between rurality and organizational capacity, I define rurality as a function of (1) low population levels and density, (2) isolation from urban cores and major transit infrastructure, and (3) low local government density. This definition partially follows from prior conceptualizations of rurality in public administration (Dougherty et al., 1999) and in other fields (Nelson et al., 2021; Nemerever & Rogers, 2021) that focus on population and geographic isolation as defining characteristics of rurality. I further include local government density as a negatively defined dimension of rurality. If metropolitan areas are characterized by their dense governmental fragmentation (Parks & Oakerson, 1989), then one dimension of rurality should be a lack of this density. Following this conceptualization of rurality, I propose a multifaceted measurement of rurality. I operationalize governmental density as the number of municipalities and counties with borders within 25 miles of any point around the boundary of a municipality or county. Figure 1 and Table 1 indicate that within the analytic sample examined, there are statistically significant differences in the number of proximate (i.e., within 25 miles) general-purpose local governments between metropolitan and nonmetropolitan counties and municipalities.
Summary Statistics of Local Government Density in Georgia.
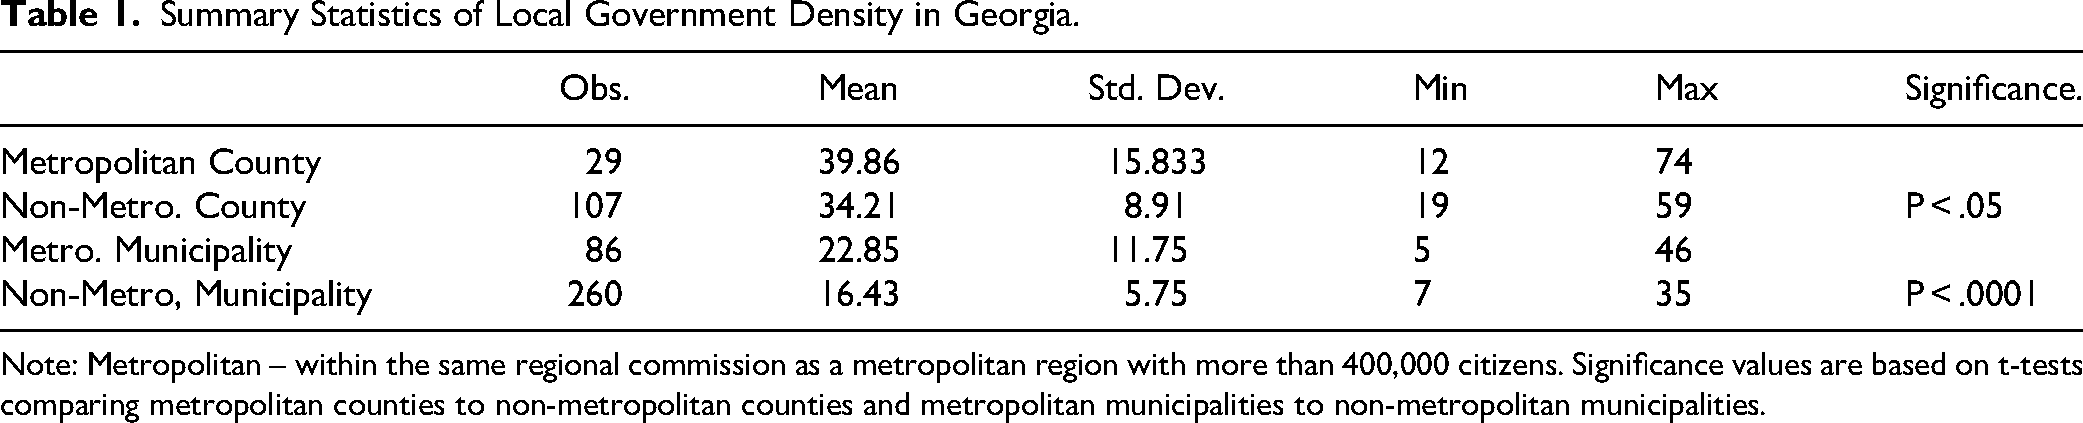
Note: Metropolitan – within the same regional commission as a metropolitan region with more than 400,000 citizens. Significance values are based on t-tests comparing metropolitan counties to non-metropolitan counties and metropolitan municipalities to non-metropolitan municipalities.
(Table 1).
Instead of proposing a new composite measure of rurality, I examine the relationship between three distinct dimensions of rurality (i.e., local government density, distance to an urban core, and distance to arterial infrastructure) and organizational capacity. This suggests that the spatial boundaries assigned to nonmetropolitan areas may not fully capture the concept of rurality. Instead, the most important aspects of rurality to organizational capacity are jurisdictional population levels, population density, distance to urban areas, as well as separation from key transit infrastructure (Nelson et al., 2021, p. 354). By controlling for or developing a specific hypothesis for each of these traditional elements of rurality (i.e., population and geographic isolation) as well as a public administration-specific dimension (i.e., local government density), the intended goal is to test for significant associations between specific aspects of rurality and various dimensions of capacity deficits (e.g., is the distance from an urban core associated with lower response capacity). While this study focuses on geographic dimensions of rurality, future research should more deeply explore the role of rural identity, political culture, and historical traditions in shaping governance practices. Understanding how these cultural factors interact with structural capacity constraints could provide a more holistic view of the challenges and opportunities facing rural governments. In the following section, I develop three testable hypotheses regarding the relationship between various dimensions of rurality and organizational capacity deficits.
There is one salient rural indicator that is not examined in this manuscript. Rural cultural traditions and identities likely shape governance in rural areas, influencing public attitudes toward local government and possibly administrative capacity. Past research has noted, many rural communities emphasize localism and self-reliance, attitudes that persist despite increasing national and global influences (Cramer, 2016). These cultural factors can affect the degree to which local governments are able to implement policies, interact with residents, and manage external constraints. However, this study does not explicitly incorporate rural culture into its conceptualization due to two primary reasons. First, data availability presents a significant challenge, as measuring cultural attitudes and traditions in a systematic and generalizable manner remains difficult, particularly at the local government level (see Nelson et al., 2021). Second, while rural culture can be very important in administrative decision-making, it is also highly variable, making its potential effects heterogeneous. For example, within the U.S. State of Georgia, the sample frame for the subsequent analysis, previous research indicates differences in collectivist attitudes depending on whether the rural resident lives inside or outside of Appalachia (Treadway, 2014). Therefore, while this study does not explicitly incorporate rural culture, the findings may still be influenced by underlying cultural factors, such as local attitudes toward governance or self-reliance. Second, research question alignment led to a focus on which rurality-associated measures are associated with capacity deficits, namely, how geographic isolation and low levels of population density shape governance capacity outcomes. While rural cultures likely play a role in local government capacity, it does so in ways that are likely less homogeneous than geographic isolation or low density, which together are the focus of this analysis. Measurement, variability, and data availability concerns related to rural identity or rural culture often led researchers to rely on readily available U.S. federal measures of rurality, which are primarily based on U.S. federally derived geographies and data from the U.S. Census Bureau.
Hypotheses
Why might varying degrees of rurality explain differential levels in local government capacity? As previously defined, rurality consists of at least three dimensions that may influence organizational capacity. First, by definition, rural areas have smaller populations than their urban counterparts. Not all small local governments are rural, but no high-population governments qualify as urban. In the United States, municipalities generally need to have more than 50,000 in population to qualify as urban, and urban counties need more than 200,000 in population to receive an urban classification (see Section 102(a)(6) of the Housing and Community Development Act (HCDA) of 1974, as amended). While these specific thresholds are somewhat arbitrary and based on various United States Federal metrics and U.S. policy-related classification systems, they do serve to provide a useful illustration of how population serves as an important element of the urban-rural continuum. Both total population and population density are frequently used to operationalize rurality (Nelson et al., 2021). Having lower population levels inherently limits the size of the residential tax base, which can result in fewer capacity-related financial inputs (Dougherty et al., 1999). Lower population levels can also make it difficult to achieve economies of scale, which would make the self-production of public services more cost-effective (Abbott & Cohen, 2009). This lack of economies of scale further strains available resources and the inputs available to develop local government capacity. I make no hypothesis for the effect of rural population on local government capacity, because there is already empirical evidence for the association between population and capacity (Lobao & Kelly, 2019). Instead, I control for the anticipated positive relationship between population and capacity, as well as financial resources and capacity.
Second, rural areas are in part defined by their geographic isolation from urban cores and infrastructure (Nemerever & Rogers, 2021). This geographic isolation has the potential to reduce a local government's access to the external resources necessary to develop organizational capacity. External resources include relationships, information, and collaboration (Christensen & Gazley, 2008). By being geographically separated from relatively resource-rich urban areas, rural areas may have fewer shared venues where information can pass between rural and urban local government officials. Evidence from examinations of rural local governments in Tennessee suggests that isolation can be a major impediment to collaboration and the flow of information (Lackey et al., 2002). Since face-to-face interaction among government actors is especially important to the development of norms of trust and reciprocity necessary to share information and collaborate (Axelrod, 2006), geographic separation may also impose transaction costs related to the travel required to build the foundational relationship necessary to collaborate and share information (North, 1990).
Rural local governments typically operate in areas with lower local government density, defined here as the number of general-purpose local governments within a 25-mile radius, and, by definition, are farther from urban cores. As a result, they are more likely to face deficits in response capacity due to limited access to regional support or resource-rich partners. Response capacity is the ability to act rapidly in response to events in situations (Ansell et al., 2021). Most commonly and visibly, for local governments, this involves responding to calls for emergency assistance. In order to better respond to routine (e.g., heart attack) and crisis (e.g., tornado) emergencies, governments need external resources, specifically formalized collaborative arrangements and the ability to access information networks that keep practitioners up to date on best practices and the latest innovations in emergency response. Emergency mutual aid, agreeing to help when requested, and automatic aid, responding to all calls of other local governments, agreements that bolster response capacity require formalized collaborative arrangements. Distance from transportation infrastructure, such as primary interstate highways, inhibits, through imposing additional financial, the development of the inter-governmental relationships necessary to arrive at these collaborative arrangements in rural areas and causes rural local officials to incur additional transaction costs that are not incurred by metropolitan local governments since travel costs and time are minimized. As evidenced by the COVID-19 pandemic, during an emergency response, accurate information needs to flow quickly to local governments to improve response abilities (Deslatte, 2020). Distance from urban cores, where innovations often begin (Bokányi et al., 2022). Rural governments, operating in a more isolated environment or with fewer institutional partners, may be less engaged in these rapid-response networks, which can slow the diffusion of new information to rural areas. As a result of the geographic isolation and the added transactional and financial costs of collaboration and information-seeking faced by rural local governments, I propose the following two hypotheses:
When local governments are sparsely distributed, they may have fewer opportunities to access external resources typically derived from collaboration and resource sharing. While proximity to urban cores may allow for more rapid diffusion of innovation (Bokányi et al., 2022), having a higher density of local government neighbors may allow for collaborative access to regional economies of scale as well as allow for collaborative troubleshooting of shared rural-specific issues. Low density seems to limit access to external resources necessary for capacity development by reducing potential collaborative and information-sharing partners (Warner & Hefetz, 2003). Without these external resources gained through interactions with neighboring governments, anticipation capacity is the most likely to be negatively affected by rural isolation.
Anticipation capacity requires the systematic collection of information and subsequent analysis of that information to draw inferences about future needs and demands. Low local government density can reduce local interdependence, or the extent to which local government units interact with one another across jurisdictional boundaries, which in turn can reduce opportunities for intergovernmental and interpersonal interactions (Lackey et al., 2002). This rural isolation can lead to information silos where rural local governments focus on immediate concerns rather than proactively engaging in intergovernmental discussions of potential future threats, innovations in service delivery, and difficulties with collecting and monitoring local government information (Wolf-Fordham, 2020). Without this exchange of ideas and information, rural areas’ capacity can be lost and leaving those served by rural local governments vulnerable to wholly unanticipated or undetected shocks. This was the case with COVID-19 when rural public health agencies failed to anticipate the specific rural dimensions and difficulties of responding to a rapidly spreading virus. As a result, the initial COVID-19-related health outcomes were worse in rural areas than in metropolitan areas (Mueller et al., 2021). Since low local government density has the potential to reduce the flow of information between neighboring governments and thus limit external resources necessary for capacity development, I propose the following hypothesis:
Methods
Data
To test these hypotheses, I use data from the 2019 County and Municipal Government Management Indicators Survey, which was conducted by the State of Georgia's Department of Community Affairs. This survey asks counties and municipalities in Georgia to provide information on whether they provide certain public services, in some cases the service delivery mechanism of a given service, financial management practices, public safety information, as well as e-government utilization. Of Georgia's 159 counties, 153 responded to this survey for a response rate among counties of 96.2 percent. Among Georgia municipalities, 438 out of 530 responded for a response rate of 82.6 percent among municipalities. The cumulative response rate is 84.5 percent. Due to missingness on some key variables, this analysis has an analytic sample of 482, with 136 counties and 346 municipalities.
Despite some missing observations, the analytic sample remains representative of local governments (i.e., counties and municipalities) in the State of Georgia. This is evidenced by the findings in Table 3, where simple T-tests reveal that differences in population, age, and income between the analytic sample and sample frame are not statistically significant. Using data exclusively from the State of Georgia holds the state-level factors that may influence urban-rural capacities constant and allows for a descriptive exploratory case-study research design. For example, other states may have differing levels of regional intergovernmental organizations (RIGOs) support for rural local government (Rickabaugh, 2021). RIGOs’ role in developing rural capacity is important and worthy of additional research (Dabson, 2019). However, this article holds state-level support for RIGOs in Georgia constant in order to examine whether various indicators of rurality are associated with two specific dimensions of local government capacity. While this research design limits the external validity of the results, the single-state case study approach is designed to provide empirical insights into the conceptualization and measurement of rurality as well as the capacity deficits of rurality, which can inform future research and provide insights for Georgia-based local government practitioners. Finally, the year 2019 was chosen because it represents a moment in time when economic conditions in the United States were historically strong, COVID-19 had not yet arrived, and the local government response rates were relatively high for this year. This provides a representative sample that was relatively undisturbed by exogenous shocks such as the Great Recession, 9/11, or COVID-19.
Variables
Summary statistics are presented in both Table 2 and Table 3. These tables include the operationalized measures of capacity, the dependent variables, and rurality, the key independent variables, as well as controls for financial resources, community characteristics, and local government type. The first six variables listed in the summary statistics in Table 2 are the dependent variables and are designed to measure two of the four critical dimensions of capacity deficits as described by Ansell et al. (2021). The remaining variables in Table 2 are right-hand side variables. Table 2 provides statistical evidence that the analytic sample is broadly representative of municipalities and counties in the State of Georgia.
Summary Statistics.
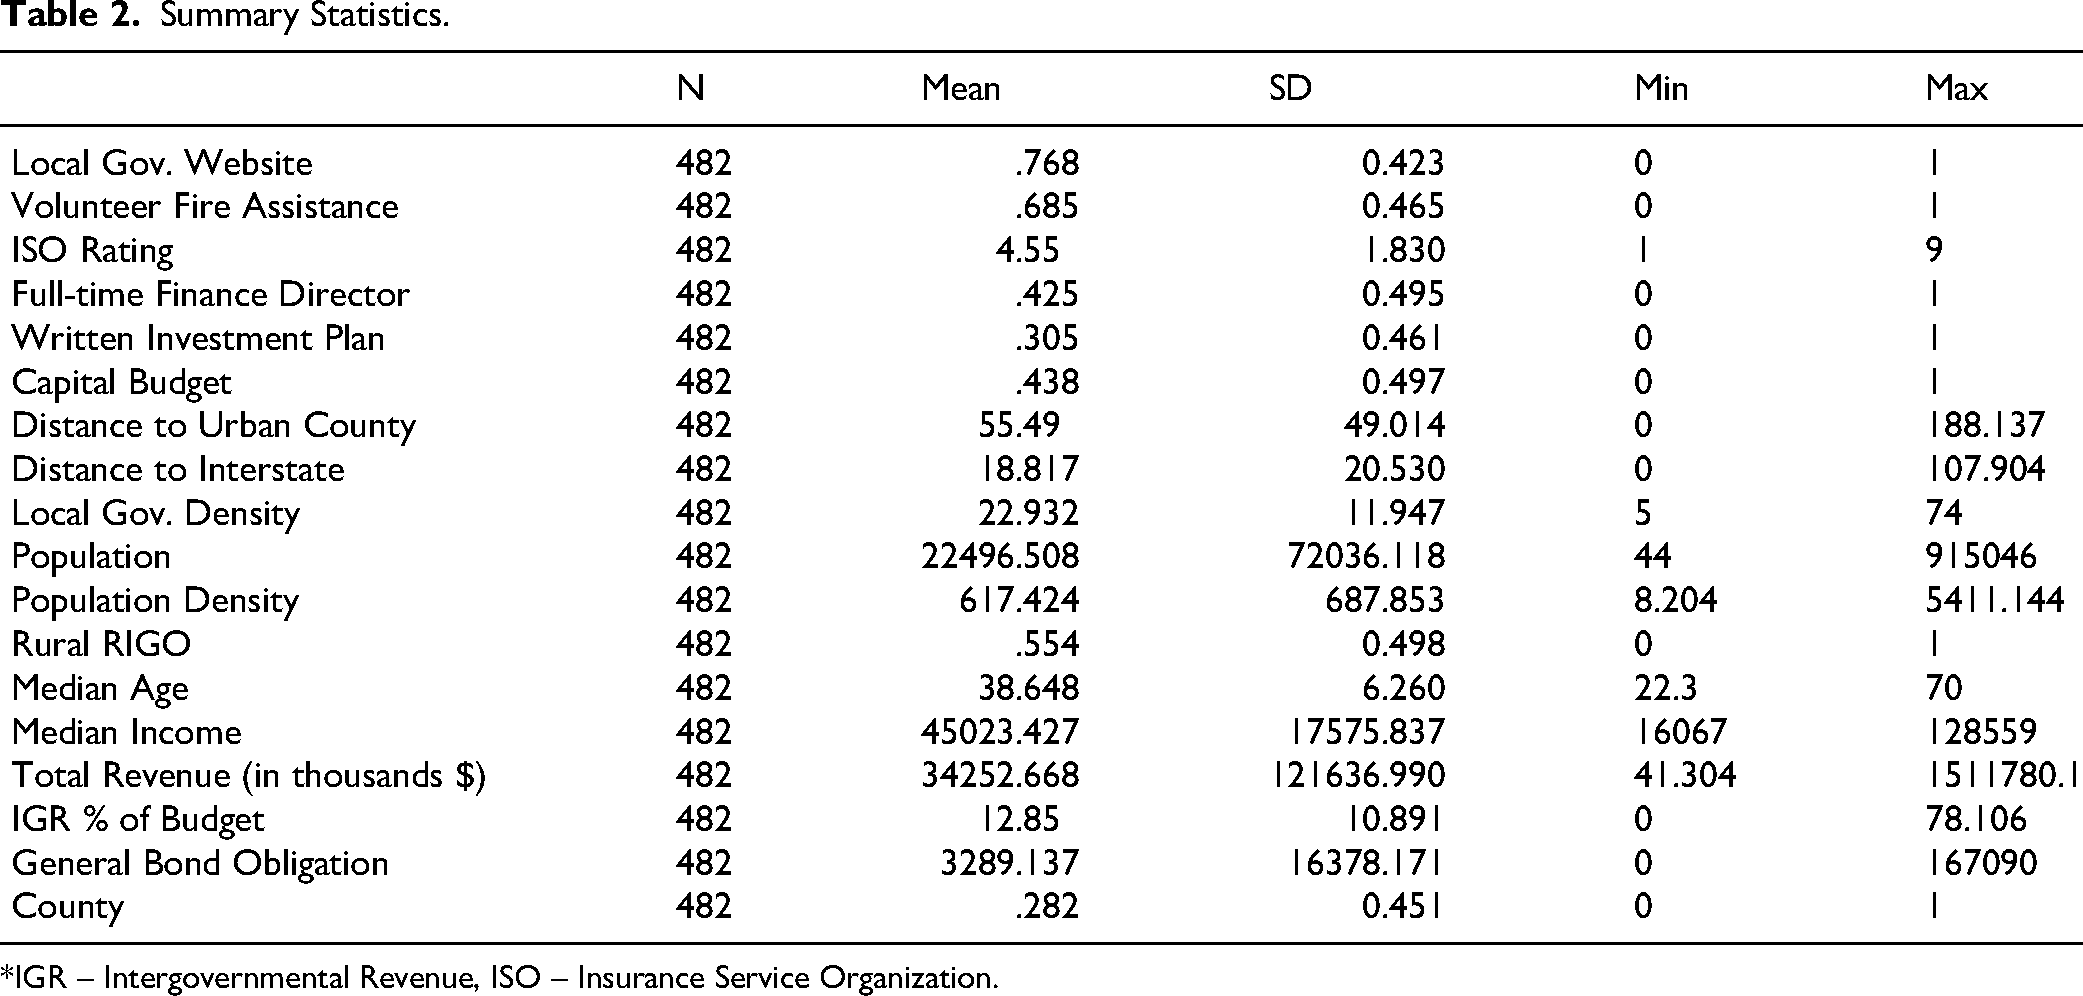
*IGR – Intergovernmental Revenue, ISO – Insurance Service Organization.
(Table 2).
(Table 3).
Representativeness of Analytic Sample.
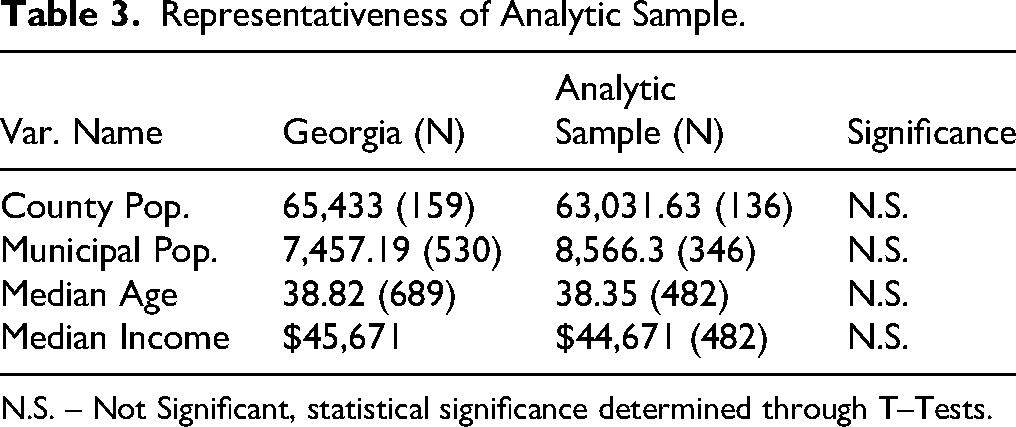
N.S. – Not Significant, statistical significance determined through T–Tests.
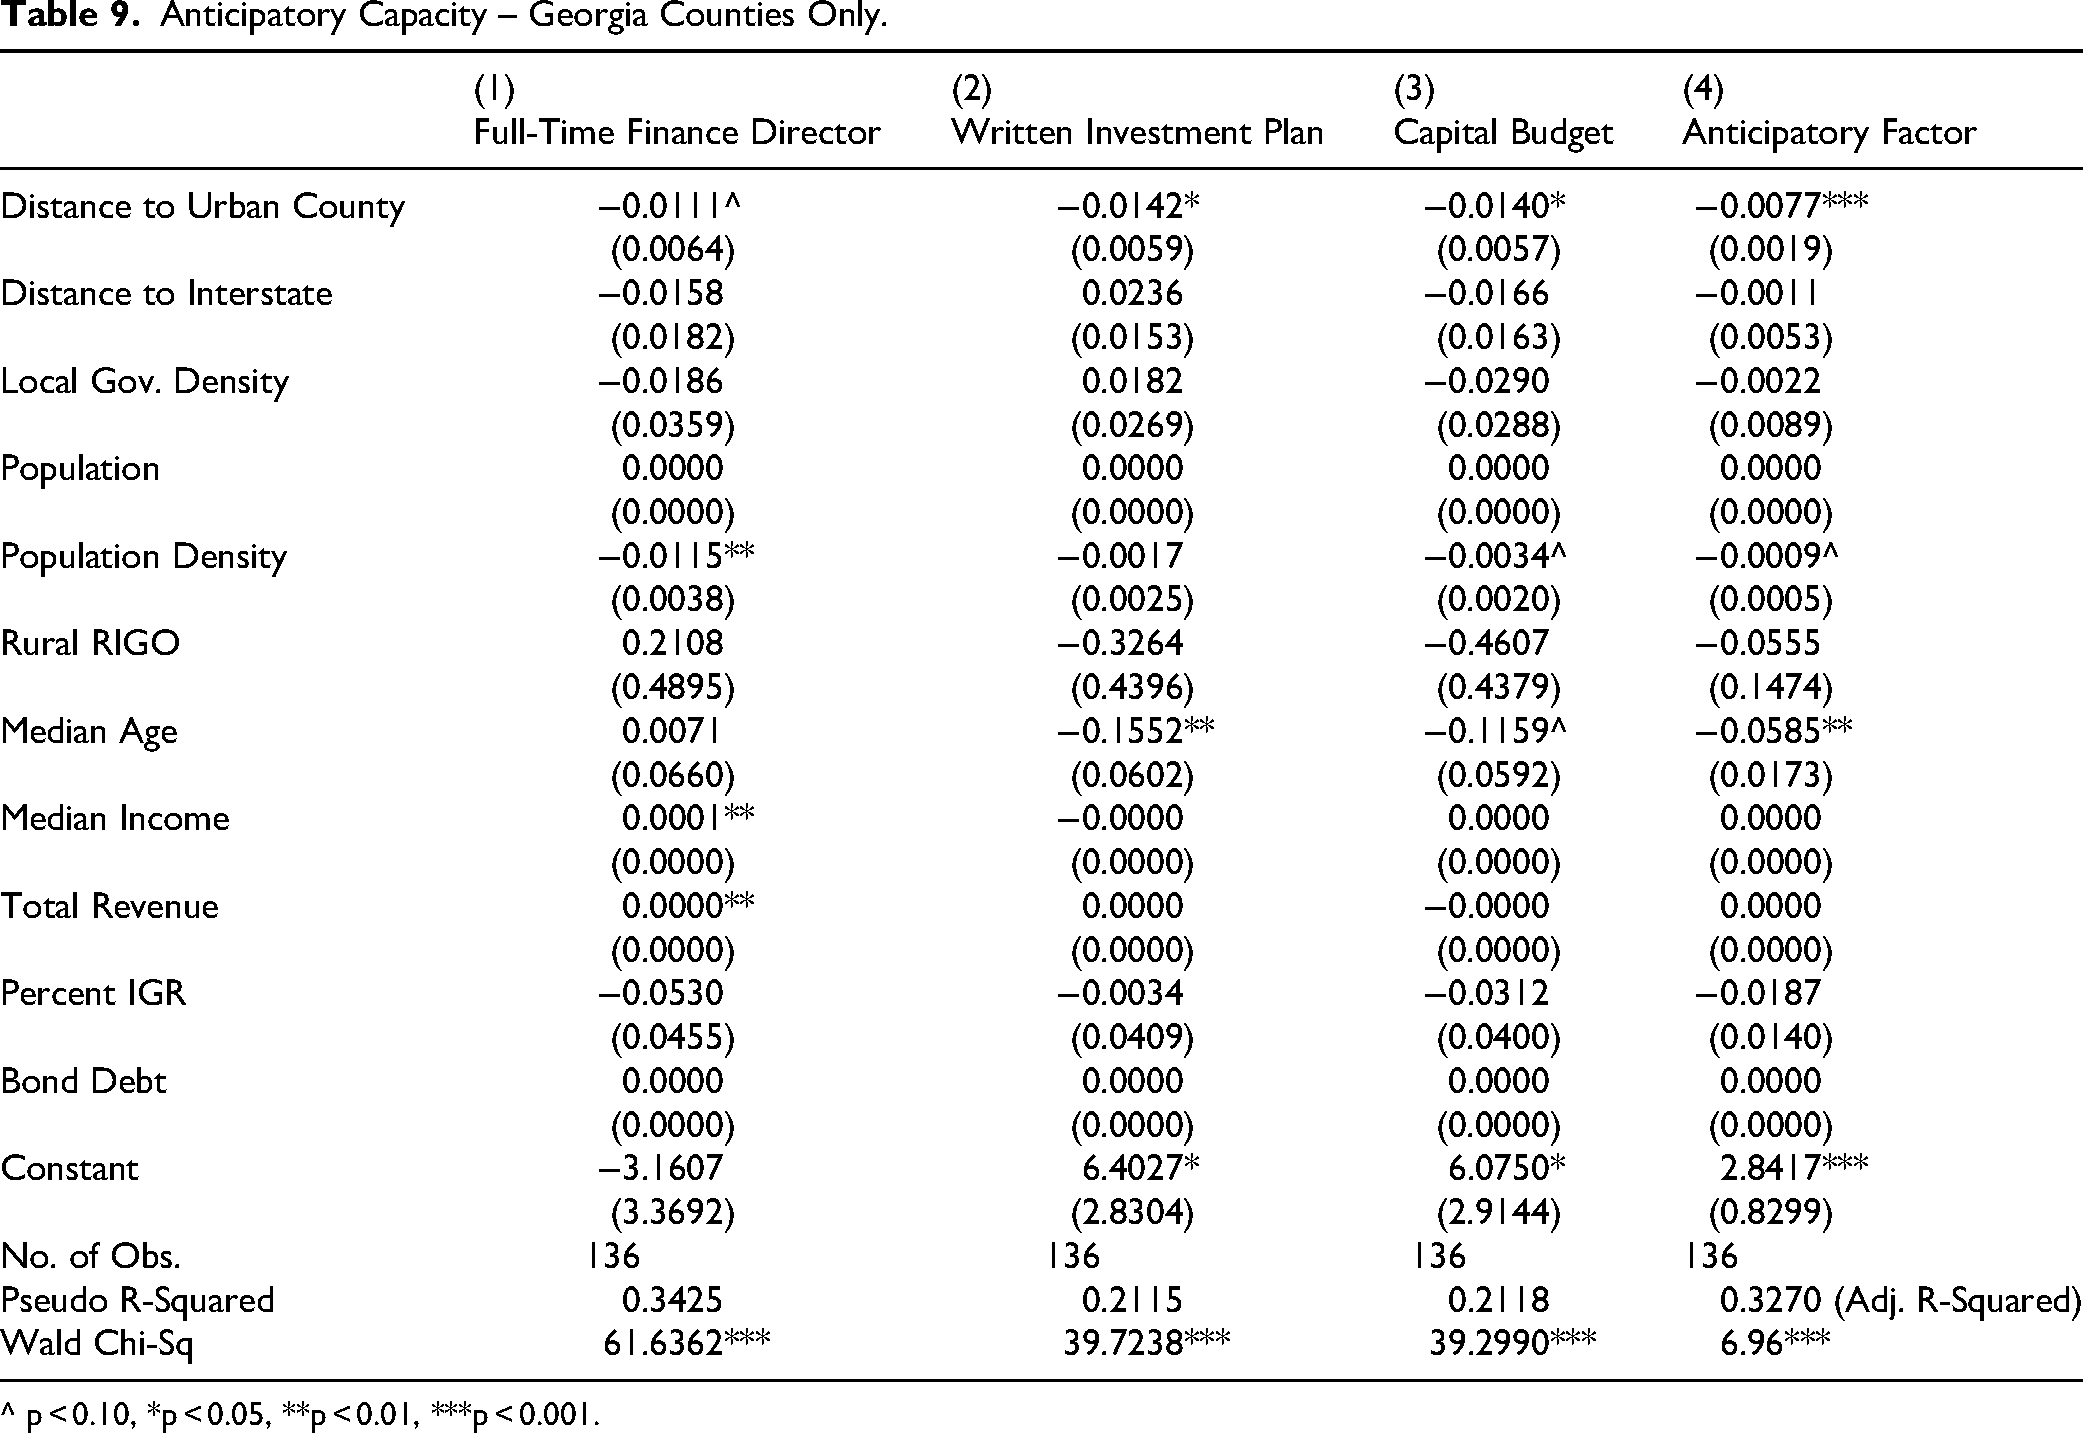
Anticipatory capacity is operationalized by three measures, which all load onto the same factor. These three measures are indicator variables for whether a local government has a written investment policy to govern investment activities, a capital budget for the acquisition of major fixed assets, and a full-time finance director. Anticipation capacity is the ability to anticipate future needs, demands, and events (Ansell et al., 2021, p. 27). Capital budget plans are specifically designed to anticipate the deterioration of capital-intensive assets as well as future demand for these assets. Written local government investment plans are similarly designed to anticipate the future needs and demands of the local government organization and establish an investment plan aligned with the government's values and forecasted needs. Having these plans in place is a strong indicator of anticipatory capacity. However, as Ansell et al. (2021, p. 26) note, “At a minimum, a capacity typically requires experienced practitioners.” For this reason, a third measure of anticipatory capacity is the presence of a practitioner, or in this case, a full-time finance director.
Anticipatory capacity, unlike response capacity, is less dependent on expensive capital-intensive infrastructure and is based on organizational foresight and financial planning. This type of capacity primarily reflects managerial resources, including the ability to evaluate long-term risks, plan for capital replacement, and align investment decisions with future community needs. While the presence of a capital budget or investment plan might imply some level of financial commitment, the actual capacity lies in the planning and decision-making processes these tools represent. For example, outside of the cost of hiring someone with expertise, a written investment policy costs little to draft, but a capital budget signals a deliberate effort to forecast and structure future financial decisions. Similarly, hiring a full-time finance director involves ongoing personnel expenses, but it embeds financial expertise and strategic thinking within the organization. In this way, anticipatory capacity leans on professional skillsets, organizational vision, and strategic intent, which can be developed or leveraged without major capital expenditures.
Response capacity is captured by three measurements. These response capacity measures are 1) the Insurance Service Organization (ISO) rating, 2) whether the local government utilizes volunteer firefighters in responding to emergency calls for assistance, and 3) whether the local government operates a website. Again, response capacity is defined as the ability to act rapidly in response to certain events or situations (Ansell et al., 2021). The most salient measurement of this response capacity is the externally assigned ISO rating, which is often called the ISO fire score. In its most basic form, this measure is designed to calculate how well-equipped fire departments are to put out fires in that community. This score ranges from 1 (best possible score) to 10 (worst possible score) and is assigned by the insurance service organization (ISO). This rating influences property insurance rates, especially for residential and commercial properties. This rating, similar to property taxes, has direct implications for rural citizens and businesses because it affects how much they can expect to pay for insurance to live or operate in a given area. The ISO rating is based on the total of four individual components, which include: emergency communication, fire department, water supply, and community risk reduction. The water supply and fire department dimensions are the most heavily weighted components. While it may seem that such a rating system inherently disadvantages rural areas by weighing capital-intensive fire department infrastructure so heavily, local governments can supplement their own response capacities by entering into automatic aid agreements with larger, more research-rich municipalities and counties. Automatic aid is assistance dispatched automatically by contractual agreement between two communities to all first-alarm structural fires. Such agreements can be recognized and beneficial to ISO ratings. These agreements typically require financial reimbursement and collaborative contract management, but rural local governments may find automatic aid agreements more financially feasible than large capital investments in their own equipment and infrastructure. As a result, despite financial gaps between rural and urban areas, rural areas have the ability, through leveraging external collaborative resources, to minimize or possibly eliminate these response capacity deficits.
The second measurement of response capacity is the utilization of volunteer firefighters. While volunteer firefighters are a critical component of fire response in many areas of the United States (Henderson & Sowa, 2018), they tend to lack the expertise, experience, and knowledge of full-time firefighters. Their utilization suggests lower levels of response capacity. In Georgia, where the data for this study were collected, the State Forestry Commission provides important institutional support to rural departments through its Rural Fire Defense program. This includes technical assistance in establishing fire protection, personnel training opportunities, and access to capital-intensive resources such as water system upgrades and firefighting equipment. The Commission also offers leasing and loan programs for fire trucks and other vehicles and helps local departments pursue state and federal grant opportunities. Additionally, Georgia state law imposes minimum operational standards even for departments in resource-constrained areas. These include requirements for around-the-clock service (i.e., 24 h a day, 365 days a year), staffing minimums (at least four certified firefighters per station), equipment specifications (e.g., specifications for a minimum functioning fire pumper), and training thresholds (O.C.G.A. §§ 25–3–23). While these mandates promote consistency and minimum service levels across jurisdictions, they may also strain departments with limited fiscal or human resources, especially those heavily dependent on volunteer labor. Some rural areas have addressed these pressures by relying on the use of prison labor for firefighting personnel (Purdum, 2024). Together, these regulatory and institutional dynamics highlight the complex role volunteer firefighters play in rural response capacity, where state support may help offset resource limitations, but legal mandates can also exacerbate them.
Finally, the presence of a local government website is the final response capacity measurement. As evidenced in the ISO rating criteria, communication during an emergency is critical. Local governments need a platform where they can share information in times of emergency. One such platform is a local government website. Together, these three measures are designed to operationalize response capacity. Confirmatory factor analysis reveals that each of these three measures loads onto one factor.
The primary right-hand side variables used to develop the hypotheses above have already been discussed at some length, but further clarification on data sourcing and units of measurement is still necessary. Population and population density measures are taken directly from the United States Census Bureau's 2019 American Community Survey. The same is true of both median income and median age. Distance from a local government to the nearest primary road, meaning an interstate highway, and distance to an urban county, meaning the nearest county with a population of 200 thousand or more, were both calculated using the sf package in R, a statistical programming language (Pebesma & Bivand, 2023). All controls related to local government finances were taken directly from the Carl Vinson Institute at the University of Georgia's financial portal. Each year, the Carl Vinson Institute compiles publicly available budget data into a spreadsheet with data for each local government, including total budgeted revenue, general bond obligation, as well as what percentage of total revenues come from other governments, intergovernmental revenues (IGR). Fiscal resources, like population, have a well-established role in the development of government capacity (Lee & Whitford, 2013; Lobao & Kelly, 2019), so it is necessary to control for financial inputs to avoid spurious associations from omitted variable bias. Left unaccounted for, this size disparity can introduce confounding effects and potentially lead to misleading conclusions in statistical analyses.
More broadly, response capacity in this context can be understood as encompassing both tangible and intangible assets that enable timely and effective emergency response. These include physical infrastructure (e.g., fire trucks, stations, water supply lines), human capital (e.g., professional training, managerial competence), and procedural tools (e.g., communication systems, mutual aid agreements, digital platforms). While some of these inputs, like trucks and facilities, are capital-intensive, others, such as management skills, citizen engagement, or technological expertise (e.g., maintaining a functional website), represent lower-cost or no-cost avenues for enhancing capacity. In some cases, smaller or rural jurisdictions may partially offset limited fiscal resources through collaboration, creativity, and digital connectivity. However, such intangible assets are generally insufficient on their own to replace the capital-intensive investments often required to build and sustain response capacity. In this manuscript, the use of volunteer firefighters and the existence of a local government website represent precisely these lower-cost forms of capacity. Together with the ISO rating, these indicators reflect the multidimensional and resource-sensitive nature of local fire response capacity.
Finally, I control for regional intergovernmental organization (RIGO) membership. This is operationalized as being listed as a member of one of Georgia's 12 regional commissions. These commissions were established by the Georgia Planning Act (O.C.G.A. 50-8-32) in order to assist local governments on a regional basis and to develop, promote, and assist in establishing coordinated and comprehensive planning in the state. I included a rural RIGO, meaning RIGO without a metropolitan area with a population of 200,000 or greater, control variable to capture any potential relationship between local government capacity and the regional coordination efforts of RIGOs (see Rickabaugh, 2021).
Models
In my statistical analysis, I use two forms of regression. First, in Model 1 in Table 3, I use ordinary least squares (OLS) regression to analyze ISO rating, as it has a large number of ordinal categories, and the relatively normal distribution of the dependent variable makes it more suitable for OLS analysis rather than ordinal logistic regression. While conducting robustness checks, ordinal logistic models for ISO rating analysis were completed. However, for these models, a Brant test revealed violations of the parallel regression assumption, which can lead to biased estimates. Another potential alternative model specification is generalized ordinal logistic regression but attempts to implement this model did not result in model convergence. Tests for collinearity for this model, which utilizes the same right-hand side variables as all other models, reveal no serious cause for concern as a correlation matrix showed no correlation reaches the empirically grounded (Dormann et al., 2013) and heuristic level of concern of 0.7. Additionally, for the OLS model, the cumulative VIF was 2.62 and did not exceed 6 for an individual variable. For the limited dependent variables, a combination of logistic regression for the dependent variables with binary outcomes and multinomial regression for categorical service delivery outcomes was employed. For each of these limited dependent variable models, McFadden's (1974) pseudo-R-squared and a Likelihood-Ratio Chi-Squared Test are reported. Each of these summary statistics measures whether a model's independent variables have explanatory power. Together, they support each other in confirming that each maximum likelihood estimator for each limited dependent variable model has explanatory power. However, it is important to remember unlike an OLS R-squared measure, these summary statistics do not assess goodness of fit (Hosmer et al., 2013; Long & Freese, 2014).
All coefficients for limited dependent models are reported as odds ratios. This means that a significant coefficient greater than one can be treated as a positive correlation, as a unit increase in the right-hand side variable is associated with an upward shift in the odds of observing the dependent variable, whereas values less than one indicate a negative association. The substantive interpretation of odds ratio coefficients is relatively straightforward. For example, in Model 1 in Table 4, the distance to an urban county variable has a significant coefficient of 0.9932. This means that for each additional mile that a local government is from an urban county, This implies that for each additional mile a local government is from an urban county, the odds of having a full-time finance director decrease by approximately 0.68%.
Regression Results for Response Capacity.
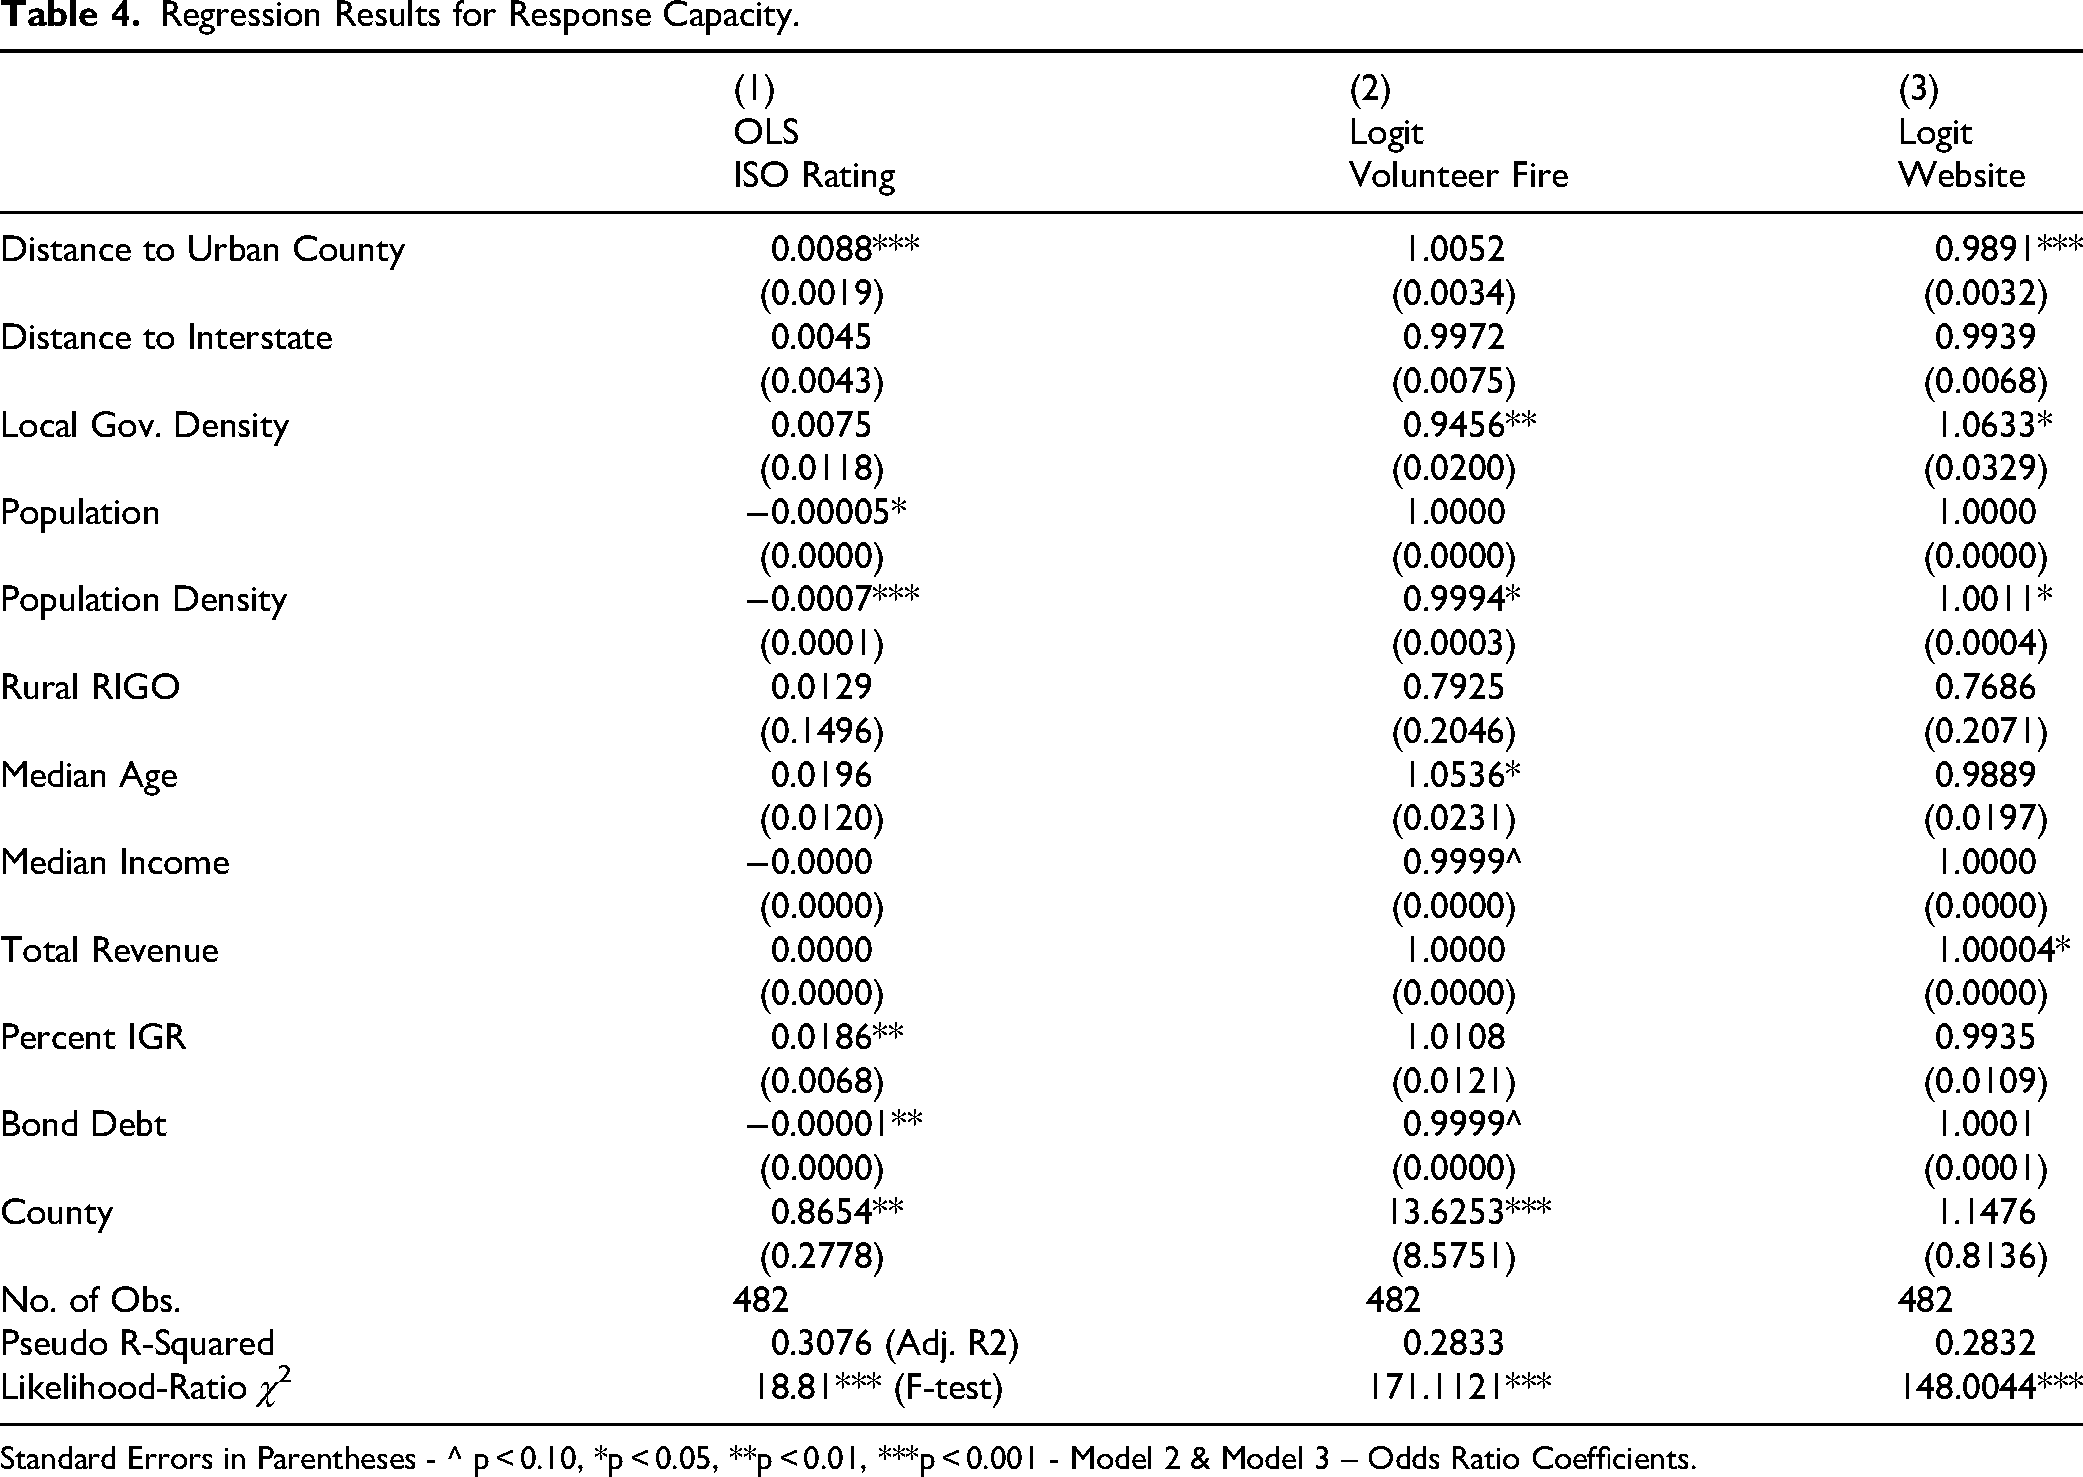
Standard Errors in Parentheses - ^ p < 0.10, *p < 0.05, **p < 0.01, ***p < 0.001 - Model 2 & Model 3 – Odds Ratio Coefficients.
Findings
The regression models examining the relationship between rurality and each of the four dimensions of capacity outlined above are shown in Tables 4 and 5. Each table presents the results for three individual models of a single dimension of response and anticipation capacity.
Logistic Regression Results for Anticipation Capacity.
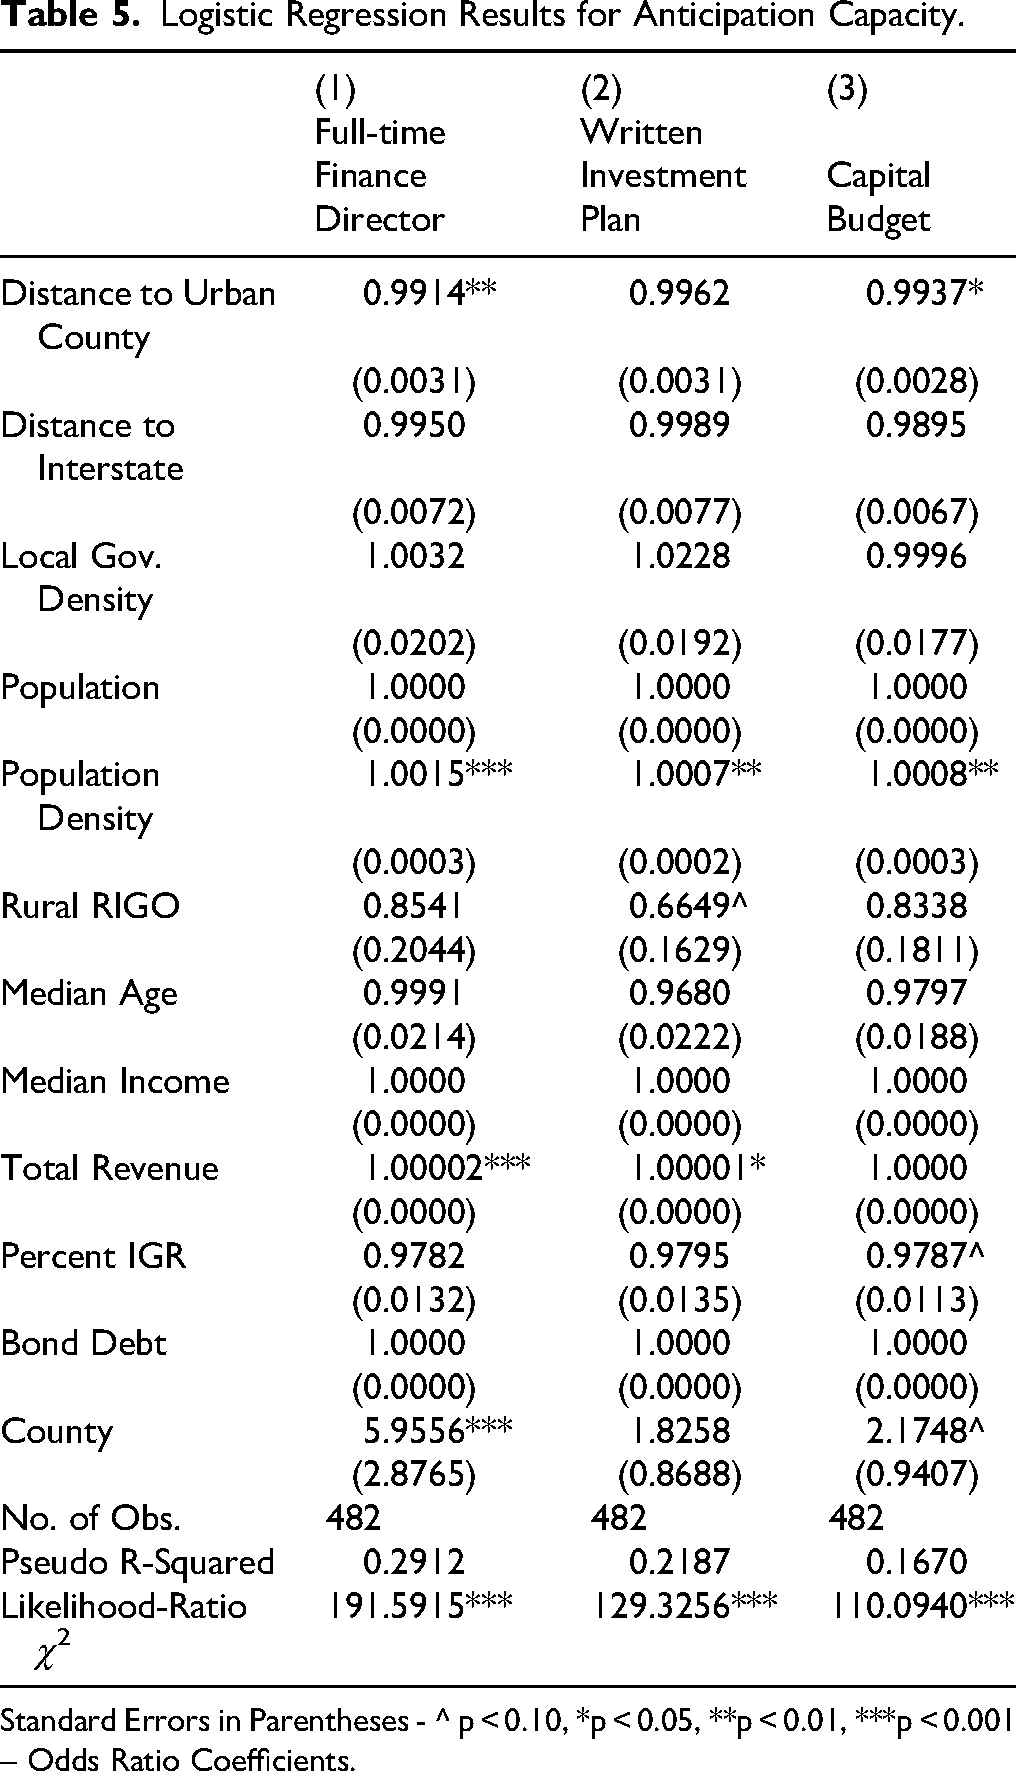
Standard Errors in Parentheses - ^ p < 0.10, *p < 0.05, **p < 0.01, ***p < 0.001 – Odds Ratio Coefficients.
(Table 4).
Response Capacity
Hypotheses one and two posited a negative relationship between rural isolation and response capacity. The results in Table 3 are somewhat consistent with this hypothesis. The best ISO rating possible is a one rather than the lowest, which is a ten. The coefficient for distance from an urban county shows a significant positive association in Models 1 and 3. This means that as the distance from an urban core increases, ISO ratings tend to increase. Therefore, ISO, on average and controlling for these other variables, tends to assign lower fire response ratings to local governments that are more distant from urban counties. These findings are visualized in Figures 2 and 3. A one standard deviation shift in distance from an urban county (49.014 miles), holding other factors constant, is associated with a 0.431 unit increase in average ISO score. This may seem like a relatively small change, but for any whole unit increase in ISO rating property insurance rates property insurance premiums increase. Interestingly, separation from an urban county is also negatively associated with whether a local government has an operational website. Figure 3 plots this relationship and illustrates the substantive significance of this finding. This suggests that distance from an urban center is associated with lower levels of response capacity as assessed by the ISO and a lower likelihood of having an independent platform on which to post emergency information. Together, these two findings are consistent with hypothesis one, as is the finding that isolation from urban cores is also negatively correlated with response capacity. However, regarding Hypothesis 2, distance from interstate highways has no significant effect in any of the six models for response or anticipatory capacity in Table 4 or Table 5. For the utilization of volunteer firefighters, interestingly, distance from an urban county has no significant association. These findings may be indicative of how rural local governments may have adapted to their geographic isolation by developing strategies for emergency response that do not rely heavily on proximity to urban counties or the interstate highways that connect rural areas to urban counties. In addition to empirically measurable rural isolation, rural leaders may also feel that they are alone or have been abandoned by larger areas, so they must respond to any non-catastrophic emergencies on their own. Finally, advances in communication technology may have also reduced the importance of physical proximity, meaning effective information dissemination and coordination can occur despite geographic separation, minimizing the impact of distance. However, each of these potential mechanisms in not been tested in this manuscript and deserves further examination.
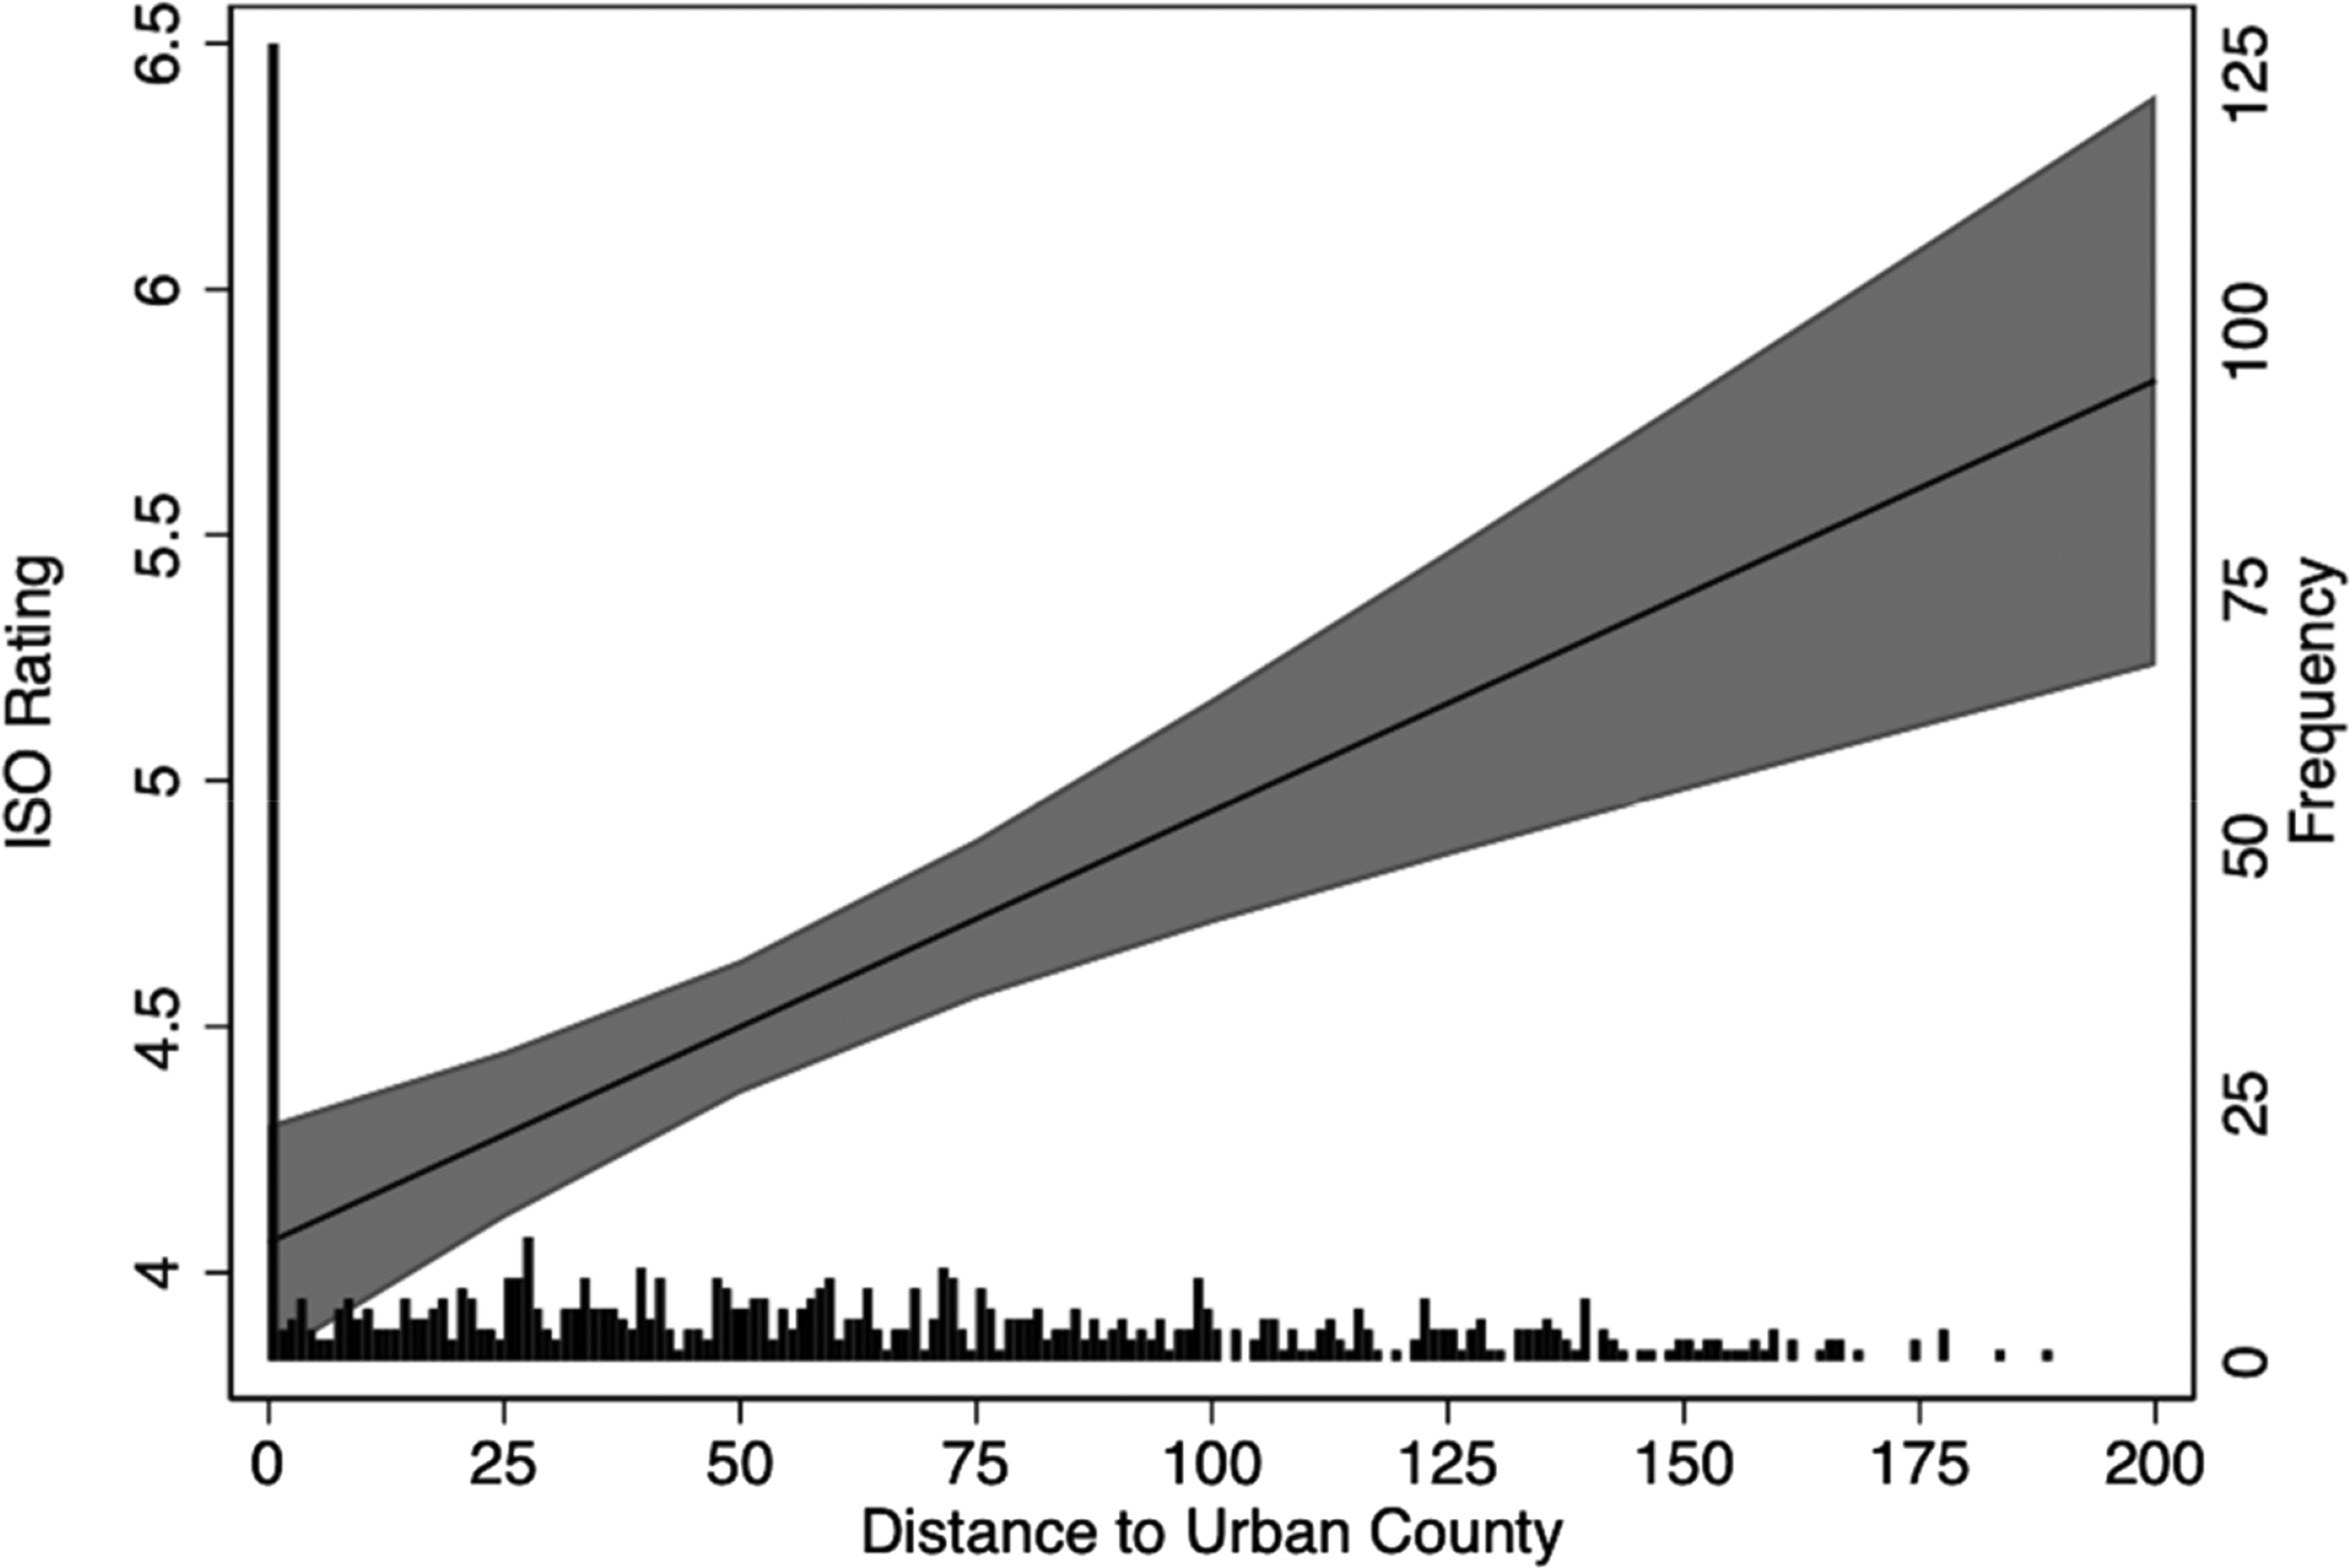
Margin Plot of Relationship between ISO Rating and Urban County Distance. Note: Distances are measured in miles. The bars represent a rug plot displaying the frequency of observations from the analytic sample along the X-axis, with the corresponding counts shown on the secondary Y-axis. The primary Y-axis and X-axis visualize the relationship between distance from an urban county and ISO rating.
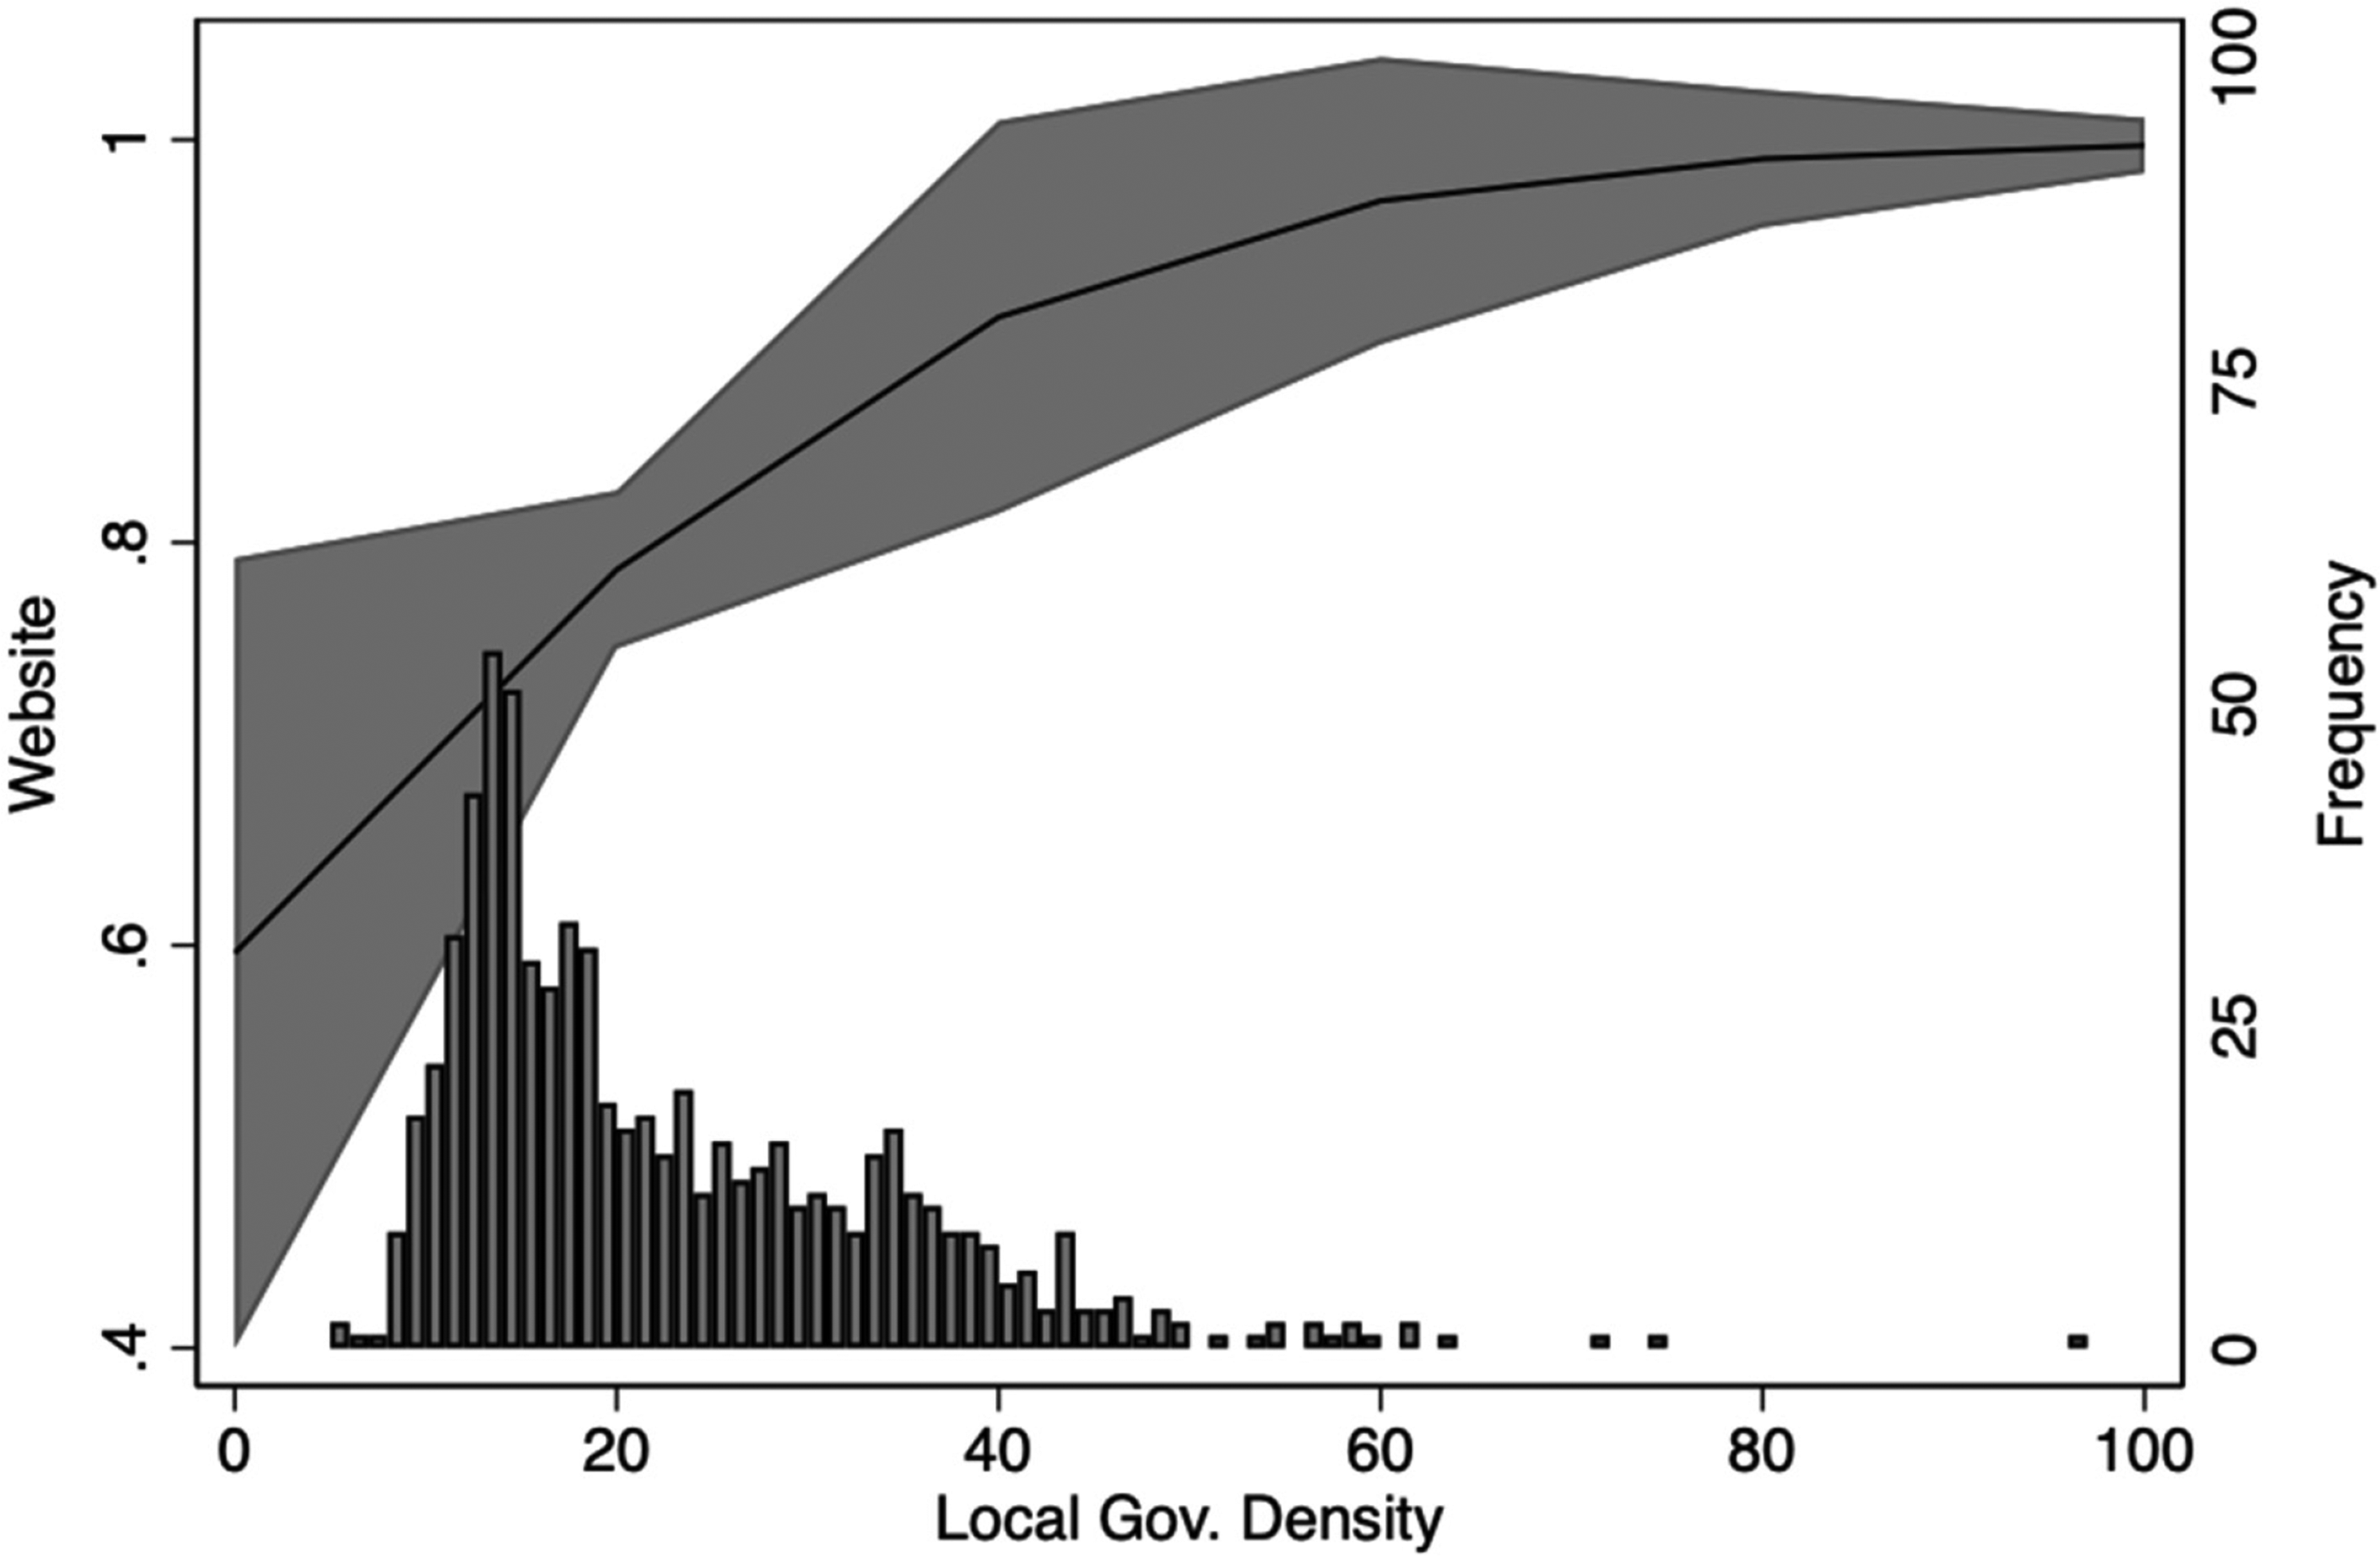
Margin Plot of the Relationship between Local Government Density and Presence of a Website. Note: Local Government Density is measured as the number of general-purpose jurisdictions (e.g., counties and municipalities) overlapping with a jurisdiction's boundaries when extended in all directions by 25 miles. The bars represent a rug plot displaying the frequency of observations from the analytic sample along the X-axis, with the corresponding counts shown on the secondary Y-axis. The primary Y-axis and X-axis visualize the relationship between local government density and the likelihood of having an active website.
Several other control variables are significant. Population density is correlated with lower, or better, ISO ratings, a lower likelihood of using volunteer firefighters, and an increased likelihood of a local government having a website. Figure 3 shows how, as local government density increases, all else equal, the likelihood of having an active website increases. This may be because more population density can provide sufficient financial support, in the form of taxes, for more comprehensive emergency services, equipment, and training programs, leading to improved assessment of response capacity. Counties and local governments with older populations tend to be far more likely to utilize volunteer firefighters. Additionally, counties, relative to municipalities, are correlated with having higher ISO ratings. These findings are not surprising as counties have far more area to cover in the event of a fire. As total revenues increase, the probability of having a website also increases. Local government density significantly decreases the likelihood of the utilization of volunteer firefighters. This may be because having more neighbors allows for mutual and automatic aid agreements, which circumvent the need for volunteer assistance.
(Table 5).
Anticipation Capacity
Hypothesis 3 suggested that local government density would be positively associated with anticipation capacity. However, local government density is only significantly correlated with two response capacity measures and is not significant in any of the anticipatory capacity models Table 4. These findings show a significant relationship between local government density and capacity, but are not consistent with Hypothesis 3, which posited that local government density would be more important for anticipatory capacity rather than response capacity. Instead, for anticipatory capacity, more traditional measures of rurality, specifically population density (see Figure 4) and geographic isolation, appear to be more salient in the relationship between rurality and anticipatory capacity. Local governments further from an urban core are less likely to have a full-time finance director or capital budget when population, median income, and total budget revenues are held constant. These findings may suggest that geographic isolation may not only prevent the exchange of information between urban hubs of innovation and rural areas but that this isolation may reduce expertise, or at least financial expertise, necessary to draft and implement a capital budget. This may be because talent attraction in rural areas has become a serious issue in recent years (Marre, 2020).
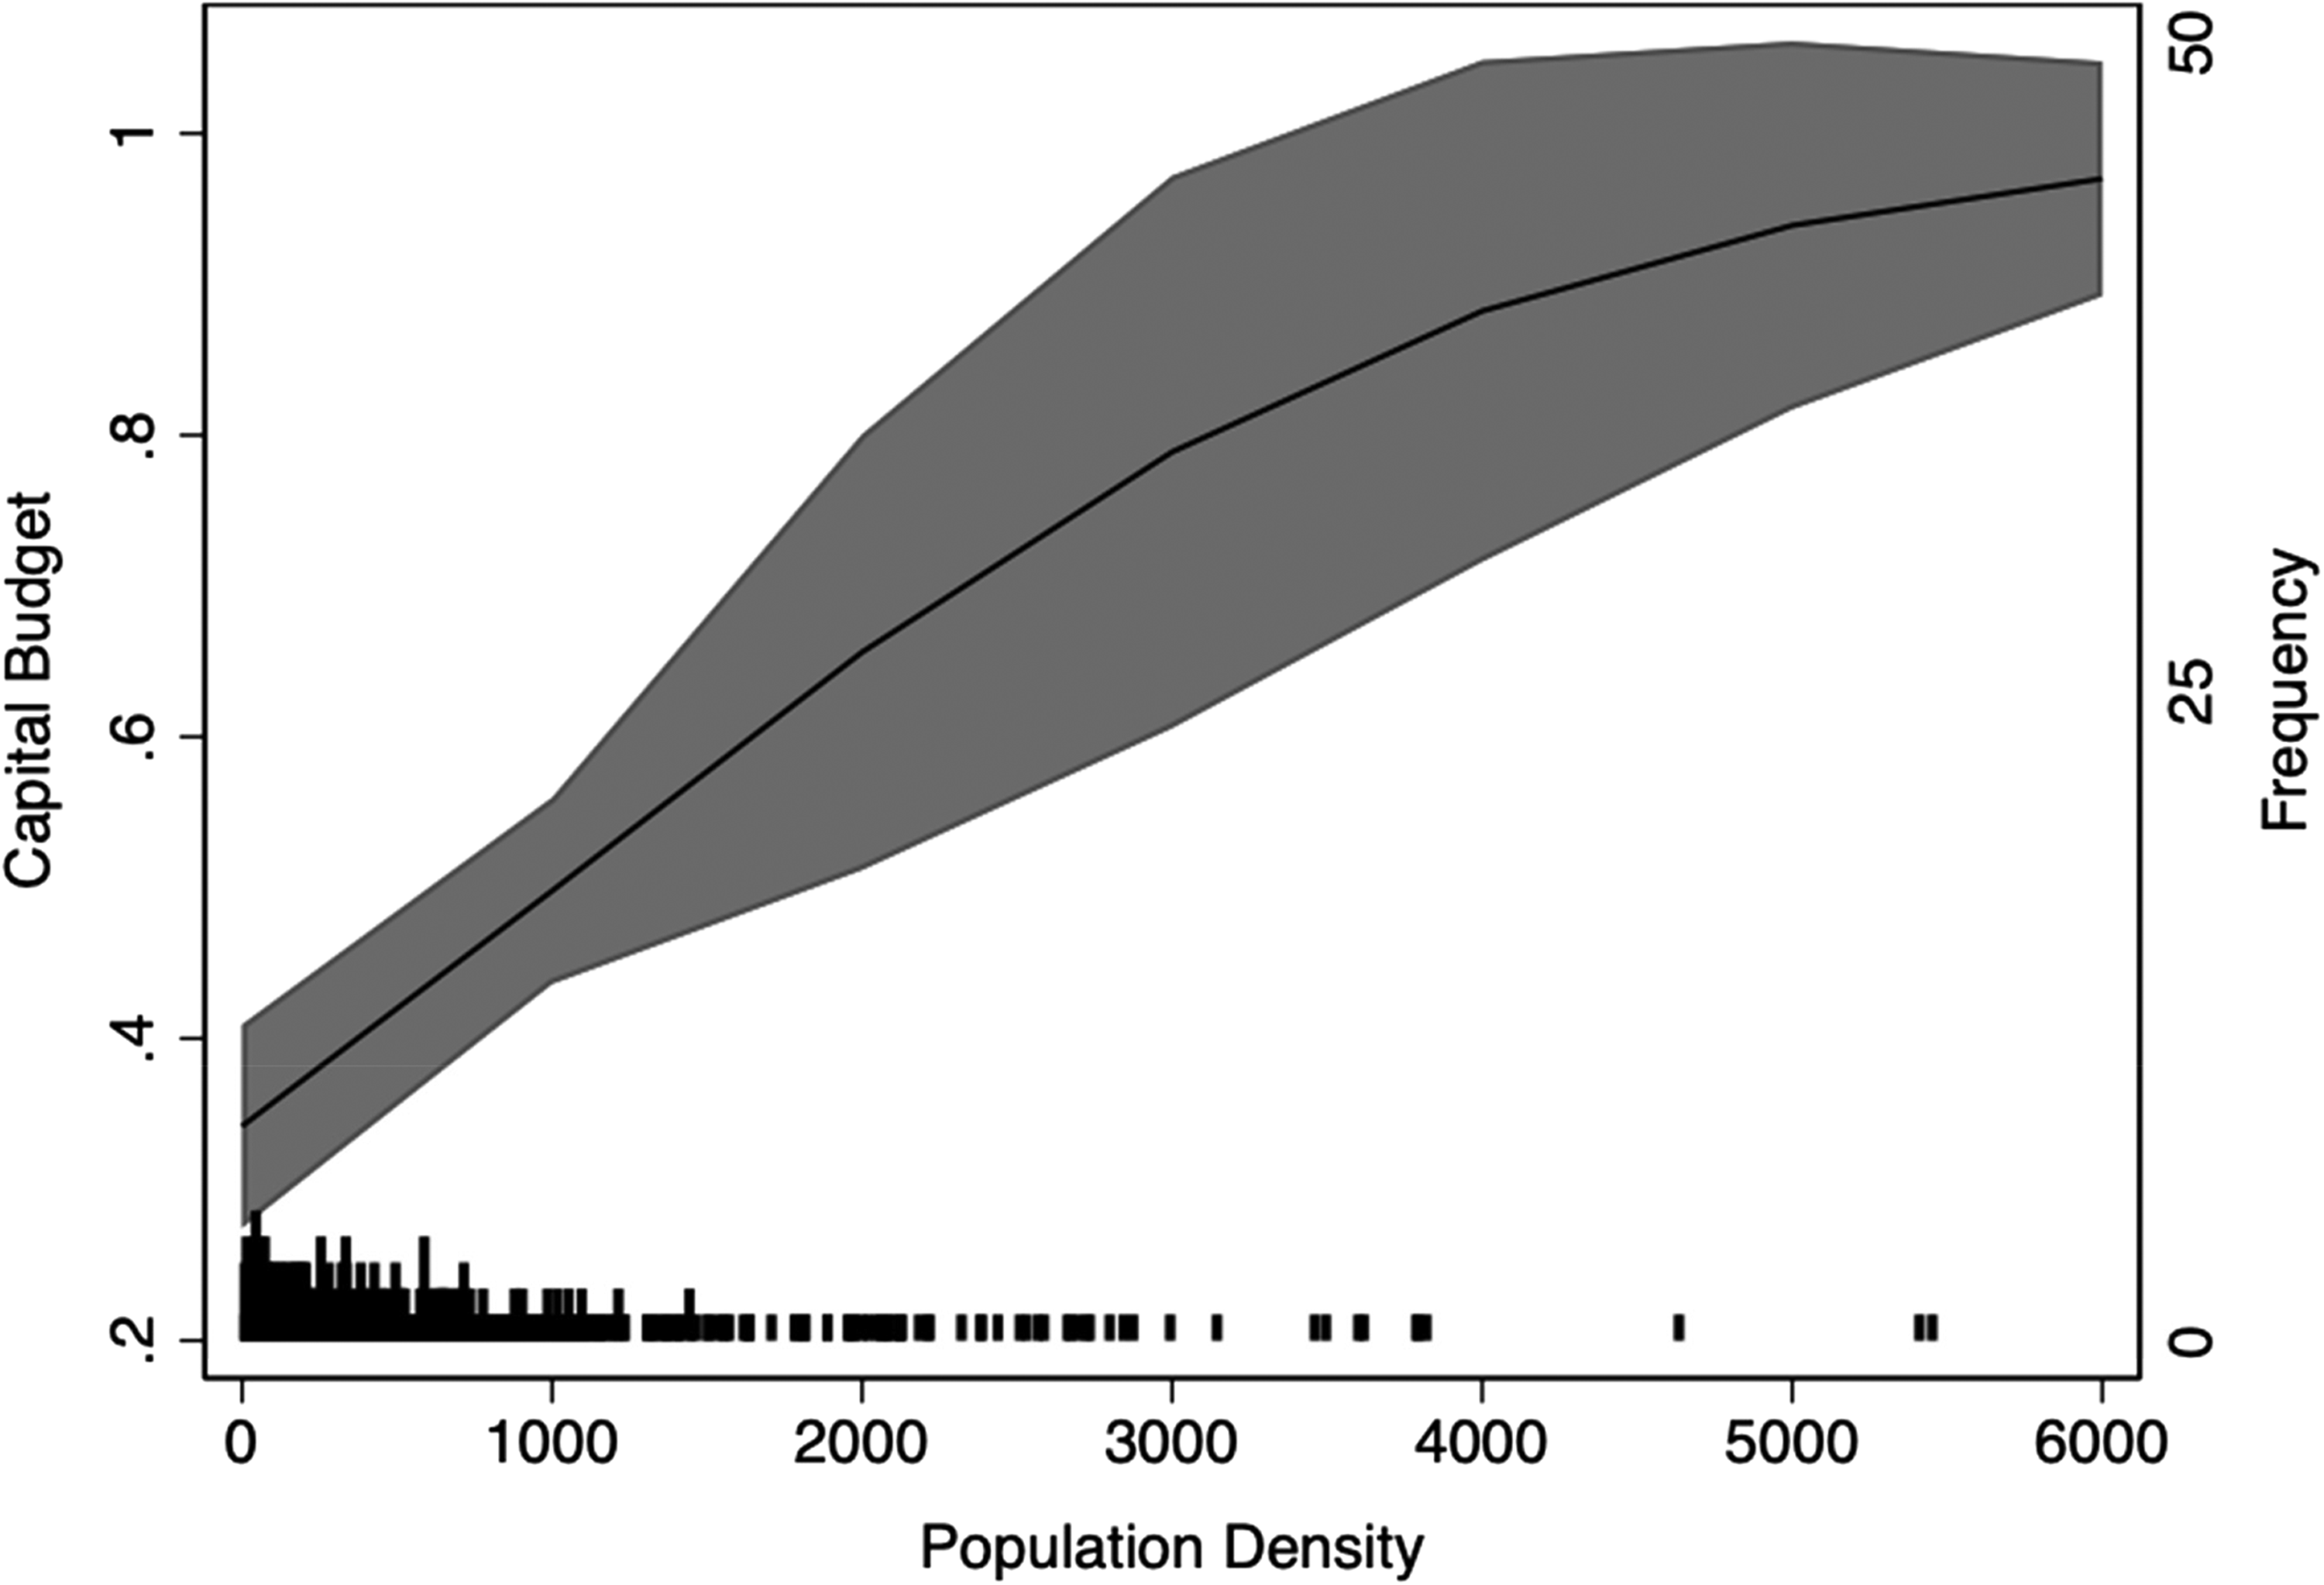
Margin Plot of the Relationship between Population Density and Capital Budget. Note: Population Density is calculated as the average population per square mile within each local government. The bars represent a rug plot displaying the frequency of observations from the analytic sample along the X-axis, with corresponding counts shown on the secondary Y-axis. The primary Y-axis and X-axis visualize the relationship between population density within local governments and the likelihood of having a capital budget.
Among the control variables, higher total revenues tend to be correlated with higher anticipation capacity. This suggests that having more public financial resources to manage typically requires full-time personnel and written guidelines for the management of those resources. Interestingly, the rural RIGO variable is not significant at conventional levels (p < .05) in any of the six models presented in Tables 3 and 4. This is especially surprising for the models examining the correlates of whether a local government has a website, capital budget, or a written investment, where again, rural RIGOs are not significant. These are relatively low-cost planning documents or communication platforms that most RIGOs likely have the capacity to facilitate. However, the findings suggest that rural RIGOs have no statistically significant effect on whether local governments have these documents or platforms in place. Among the response capacity control variables, no control variable is significant in more than one model.
Discussion
The findings show that multiple measures of rurality were found to be significant for both anticipatory and response capacity. For both forms of organizational capacity, anticipatory and response capacity, geographic isolation was consistently important across both dimensions, while local government density was only significantly associated with response capacity. The more traditional measures of rurality based on population and financial resources were significant across both types of capacity, but not for every individual model. These population-related and local government finance findings are consistent with previous work showing that rural capacity deficits in rural areas are at least partially due to lower population and having fewer financial resources (Dougherty et al., 1999). However, a novel contribution to the literature is revealed through the identification of distinct measures of geographic isolation and local government density as additional factors influencing capacity deficits among local governments. The findings suggest that a lack of local government density limits rural governments’ access to some of the necessary external resources to develop and build capacity (Christensen & Gazley, 2008). Collectively, these outcomes emphasize the intricate and multifaceted nature of rurality and its complex connection with urban-rural capacity deficits, offering valuable insights for future rural administration and capacity deficits research.
While the single-state case study research design presented in this article has several strengths, it is limited by its cross-sectional design in not being able to observe longitudinal variation in rural capacity deficits. Future research should incorporate longitudinal data to test whether these additional dimensions of rurality may be able to explain long-term shifts in rural-urban capacity. Additionally, future research should continue to explore rurality as a broad concept deserving of a contingent measurement strategy, rather than exclusively relying on government-produced metrics, which may not capture the most relevant aspects of rurality for a given research design. Further development of rurality measures, of which those tested in this article represent only a small subset, is necessary to support a wider range of research questions. Future research on rural areas should consider differing, context-specific, and research question-specific conceptualizations of rurality. See Nelson et al. (2021) for a systematic review and list of the extensive ways in which rurality has been conceptualized and measured. Finally, more qualitative and ethnographic research on rural administration is necessary. It is only through supplementing quantitative research with these methods that the lived experiences of rural administrators and citizens can most fully be explored and the causal mechanisms behind rural capacity deficits can be more fully identified. As evidenced by work by Cramer (2016), the unique social, cultural, and political norms of the heterogeneous rural areas across the world cannot adequately be understood without qualitative measures.
Finally, the measures used for the operationalization of anticipatory and response capacity are primarily taken from the public finance and emergency response functions of local government. While this limits the external validity of these findings, it highlights one contribution of this manuscript and presents opportunities for future research. First, the multidimensional approach to analyzing capacity loss reveals that the relationship between rurality and capacity is multifaceted and not consistent across all dimensions of capacity. Second, while public finance and emergency response are highly visible functions of local governments, especially in rural areas, they do not encompass all the necessary work that rural local governments must engage in. As a result, more research is needed to explore how rurality affects the ability of local governments to provide other public services.
Conclusion
Across two dimensions of organizational capacity, specifically response and anticipatory capabilities, deficiencies in rural capacity are linked to aspects of rurality that extend beyond mere population density and fiscal inputs. Even after accounting for these conventional population- and finance-based metrics of rurality, additional measures of rurality, such as geographic isolation from urban centers and the density of neighboring local governments, exhibit significant correlations with these critical capacities at the local government level. In addition to providing new insights into the relationship between rurality and organizational capacity, these findings have two additional implications.
First, recent scholarship and policy initiatives have sought to bridge the rural-urban divide (Accordino, 2019). The findings presented here suggest that the problems of rural capacity deficits may not be able to be wholly addressed with more state-level or federal funding and/or population growth. In addition to funding and population growth, rural areas need additional infrastructure that is capable of bridging both real infrastructure deficits and connecting isolated low-density rural areas with new sources of information, rural-specific expertise, and collaborative partnerships will be necessary to avoid further exacerbating rural capacity deficits. Practitioners working in rural governance should consider prioritizing strengthening regional governance organizations (RIGOs) and cross-jurisdictional collaborations to offset the negative impact of low local government density on capacity. However, local government capacity is not shaped solely by formal geographic isolation and low levels of government density. Cultural norms, historical governance traditions, and community values also influence the extent to which policies are accepted and effectively implemented. For instance, rural communities may resist certain governmental interventions due to long-standing traditions of localism and self-reliance. Future research should further explore how these cultural and historical dimensions interact with formal governmental capacity to provide a more comprehensive understanding of rural governance.
Second, given the relationship between various dimensions of rurality and local government capacity, it is important to develop research questions that explore how broader or alternative definitions of rurality may influence government or nonprofit decision-making in different contexts. Rurality is a multidimensional concept with many potential operationalizations (e.g., Nelson et al., 2021), and the choice of definition can significantly shape empirical findings While U.S. federally produced measures of rurality will continue to play a central role in policymaking, particularly because they often determine funding eligibility, public management scholars should critically assess whether the methodologies and spatial assumptions underlying these metrics adequately capture the dimensions of rurality most relevant to their research questions. If federal metrics are the most appropriate measure of rurality, then the rationale for choosing such a measure over the many competing federal rurality measures should be fully justified. Future research should also explore skill-building programs for rural administrators, particularly in network-building and intergovernmental collaboration, as potential strategies and competencies to counteract geographic isolation and low local government density. Finally, given the role of geographic isolation in rural governance challenges, MPA programs and professional development initiatives should emphasize skills such as grant writing, intergovernmental collaboration, and strategic partnerships to help rural officials overcome structural barriers to capacity-building.
Footnotes
Funding
The author received no financial support for the research, authorship, and/or publication of this article.
Declaration of Conflicting Interests
The author declared no potential conflicts of interest with respect to the research, authorship, and/or publication of this article.
Author Biography
Appendix
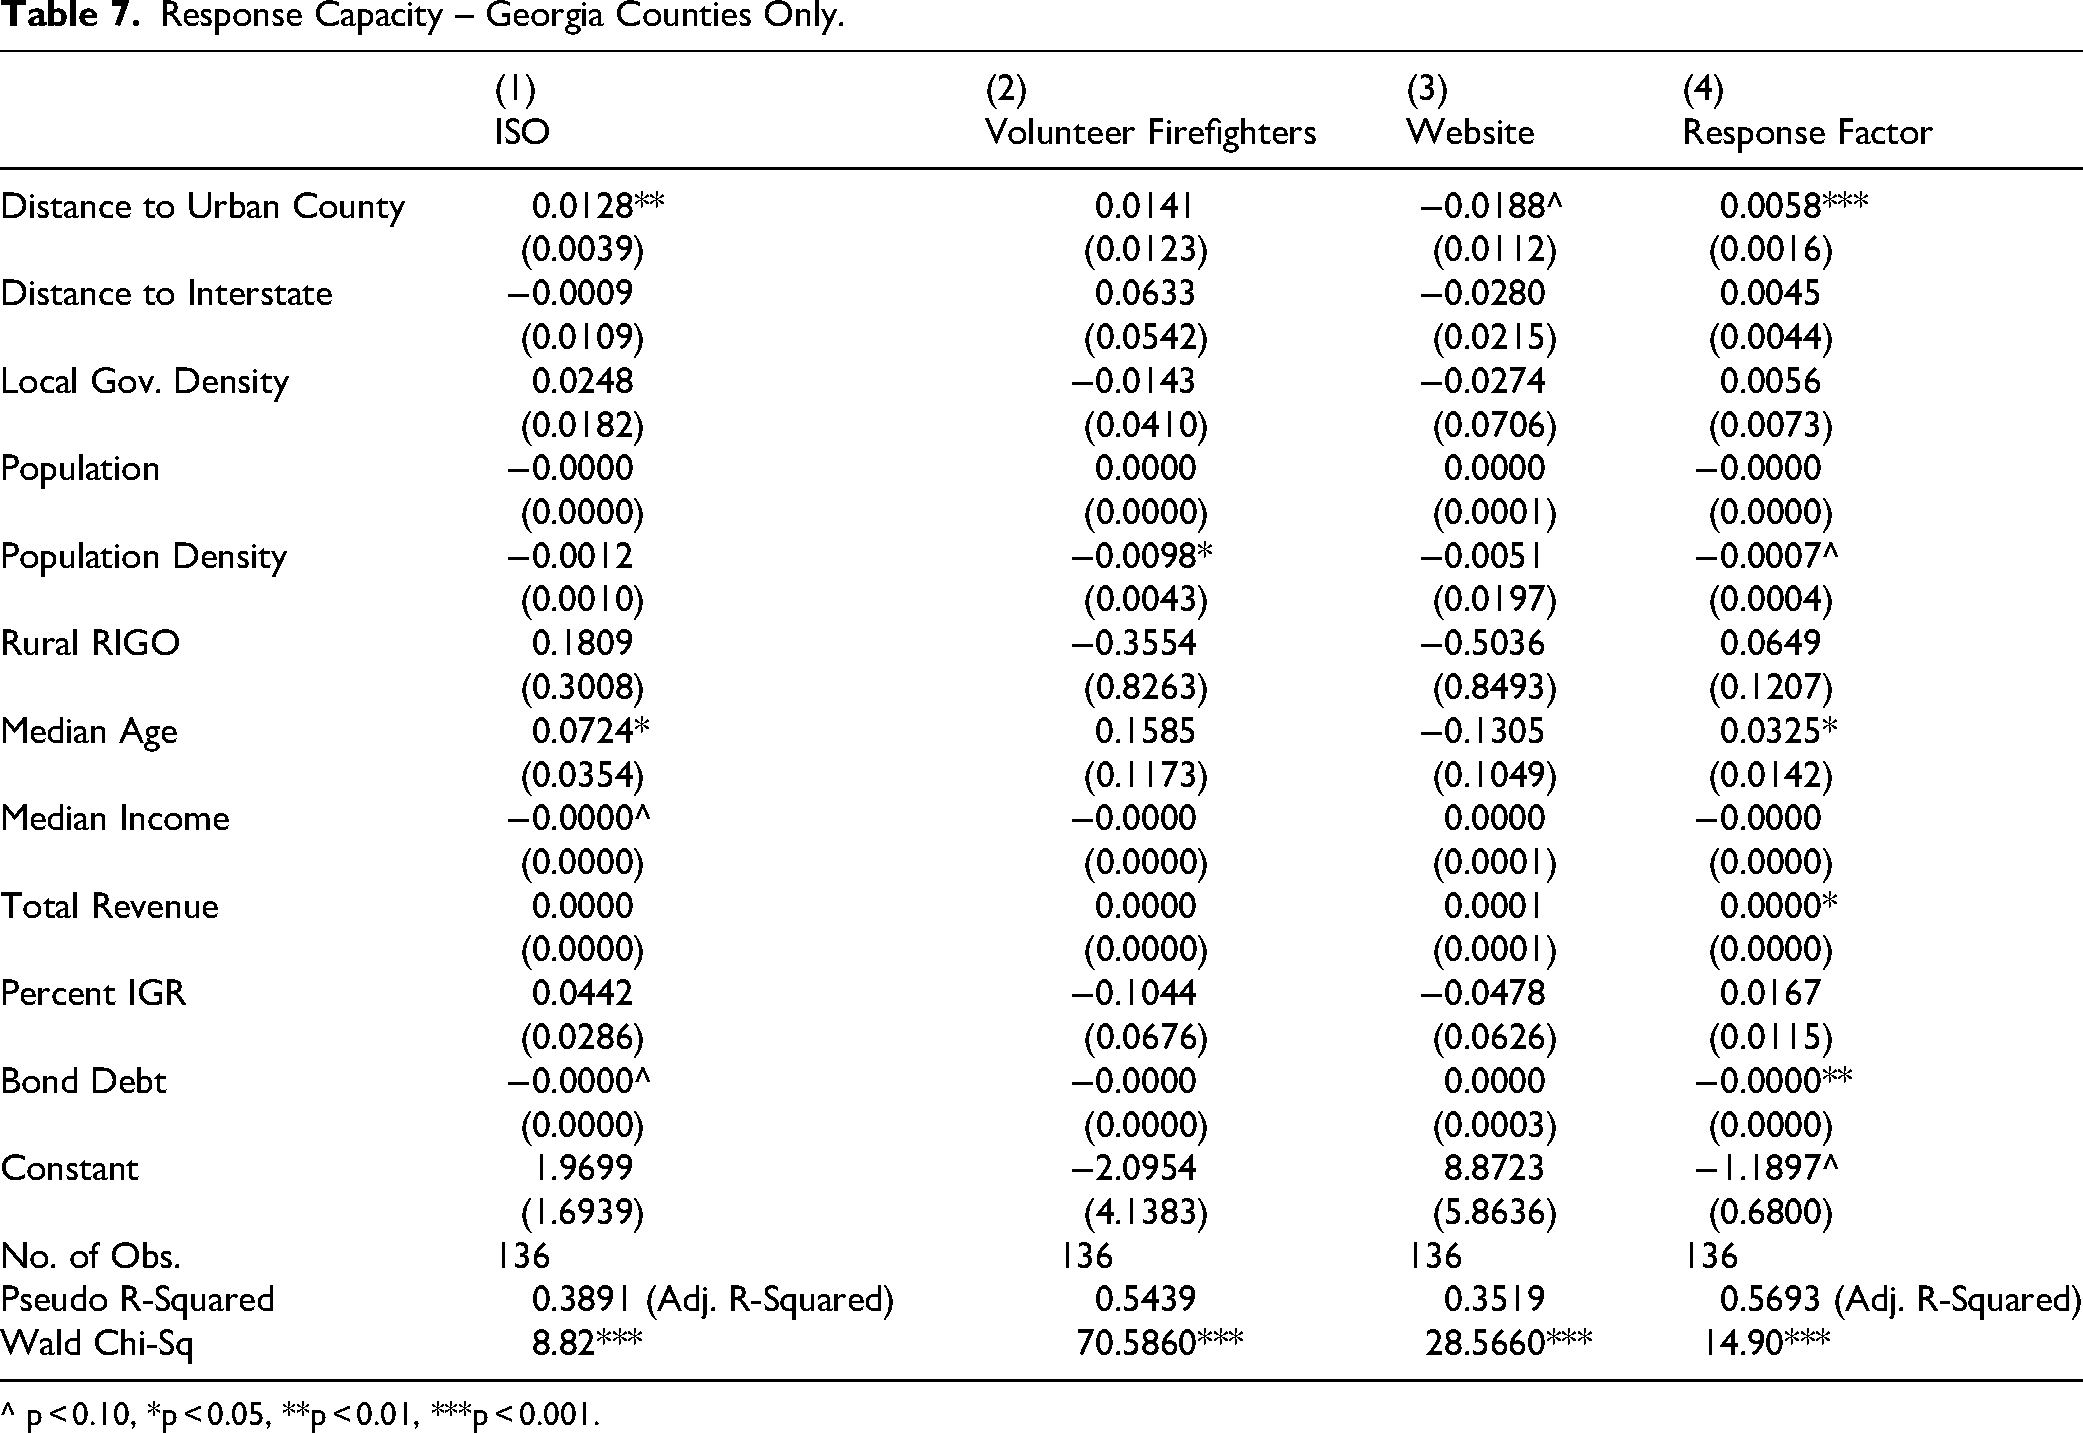
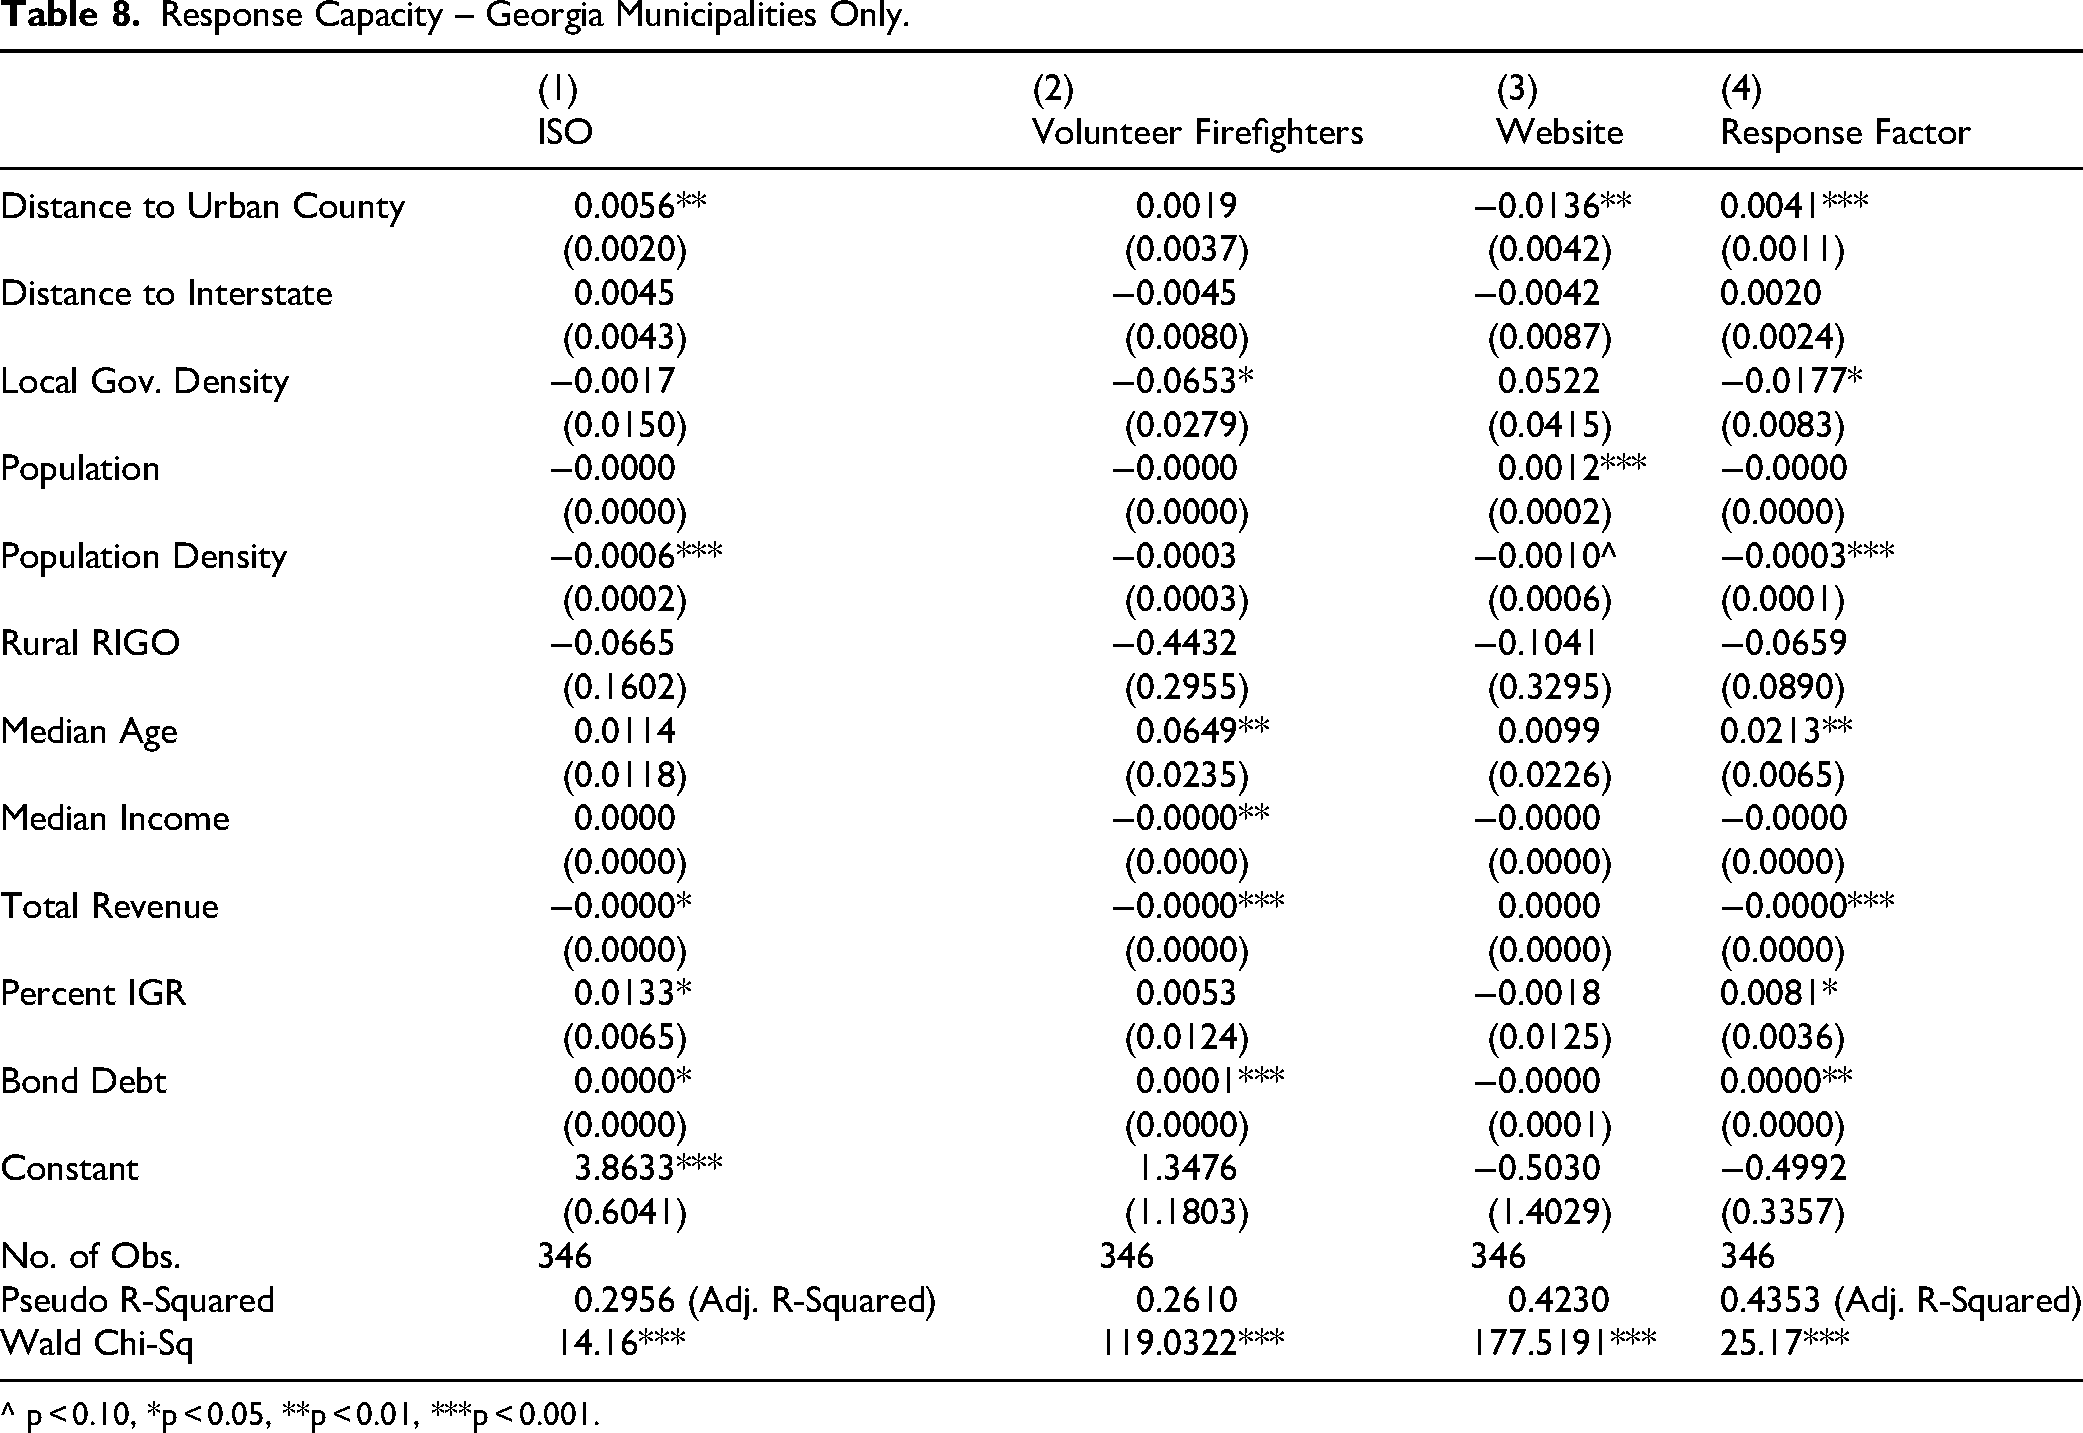
Summary of Results by Observation Type. Response Capacity – Georgia Counties Only. ^ p < 0.10, *p < 0.05, **p < 0.01, ***p < 0.001. Response Capacity – Georgia Municipalities Only. ^ p < 0.10, *p < 0.05, **p < 0.01, ***p < 0.001. Anticipatory Capacity – Georgia Counties Only. ^ p < 0.10, *p < 0.05, **p < 0.01, ***p < 0.001. Anticipatory Capacity – Georgia Municipalities Only. ^ p < 0.10, *p < 0.05, **p < 0.01, ***p < 0.001.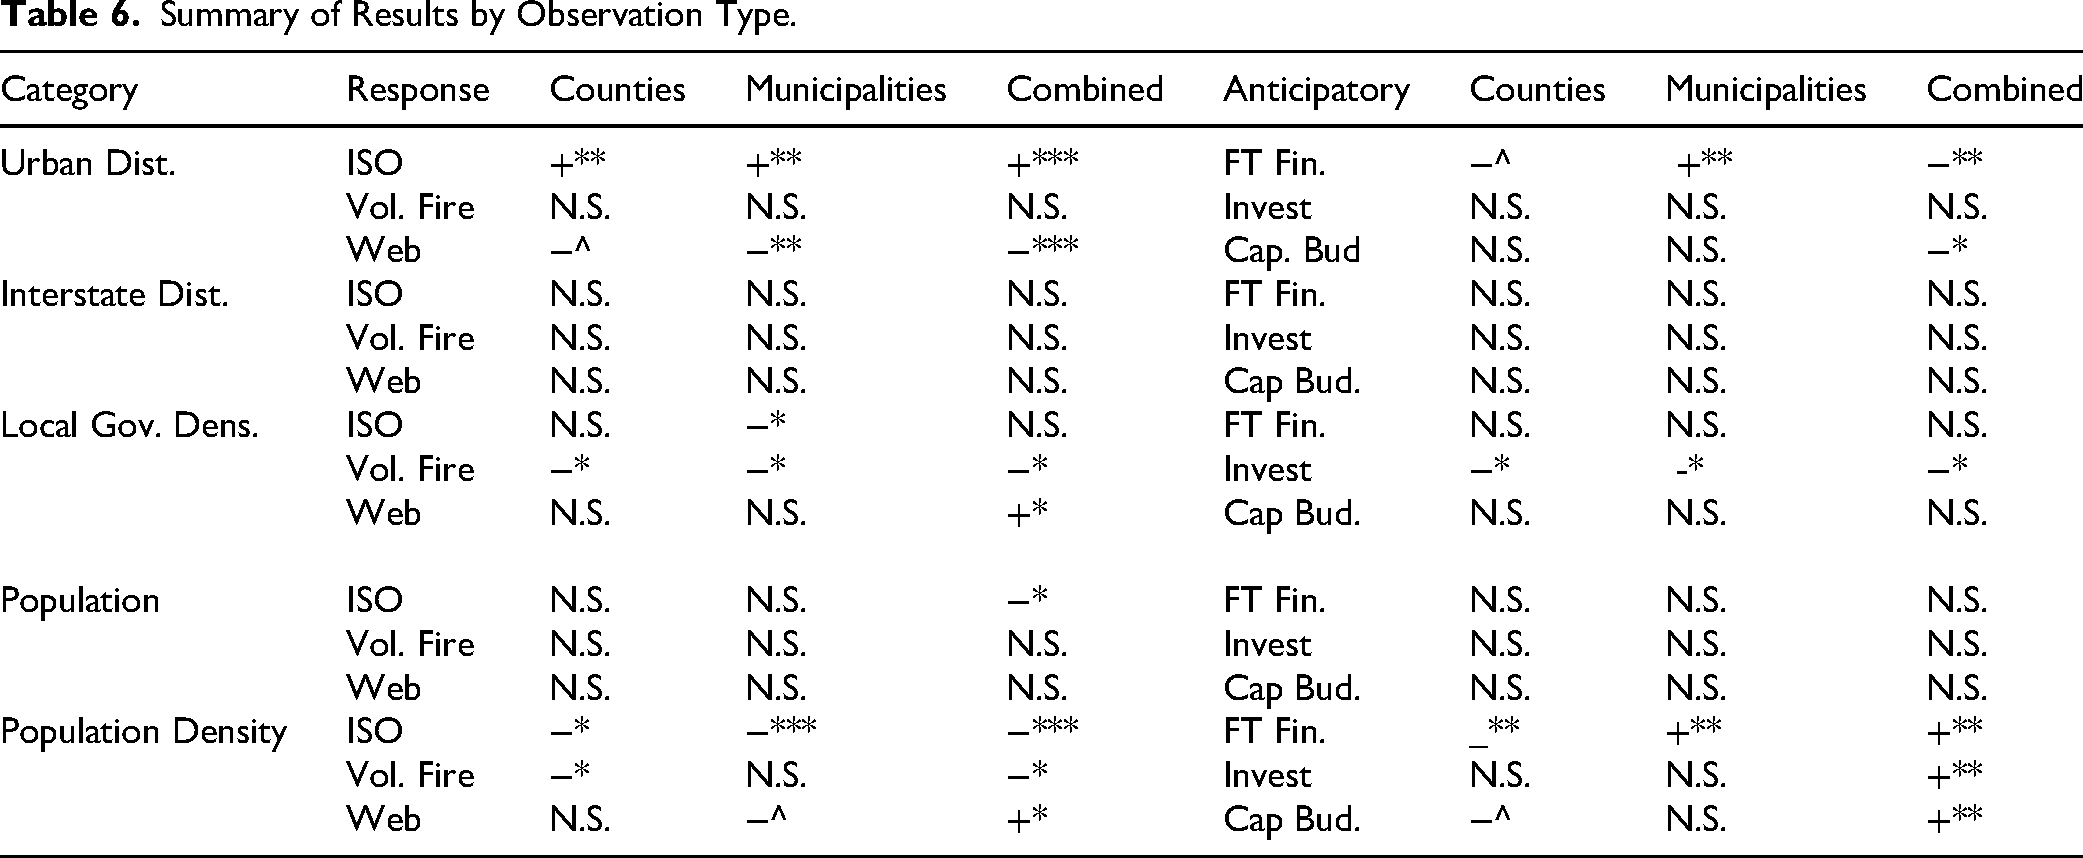
Category
Response
Counties
Municipalities
Combined
Anticipatory
Counties
Municipalities
Combined
Urban Dist.
ISO
+**
+**
+***
FT Fin.
−^
+**
−**
Vol. Fire
N.S.
N.S.
N.S.
Invest
N.S.
N.S.
N.S.
Web
−^
−**
−***
Cap. Bud
N.S.
N.S.
−*
Interstate Dist.
ISO
N.S.
N.S.
N.S.
FT Fin.
N.S.
N.S.
N.S.
Vol. Fire
N.S.
N.S.
N.S.
Invest
N.S.
N.S.
N.S.
Web
N.S.
N.S.
N.S.
Cap Bud.
N.S.
N.S.
N.S.
Local Gov. Dens.
ISO
N.S.
−*
N.S.
FT Fin.
N.S.
N.S.
N.S.
Vol. Fire
−*
−*
−*
Invest
−*
-*
−*
Web
N.S.
N.S.
+*
Cap Bud.
N.S.
N.S.
N.S.
Population
ISO
N.S.
N.S.
−*
FT Fin.
N.S.
N.S.
N.S.
Vol. Fire
N.S.
N.S.
N.S.
Invest
N.S.
N.S.
N.S.
Web
N.S.
N.S.
N.S.
Cap Bud.
N.S.
N.S.
N.S.
Population Density
ISO
−*
−***
−***
FT Fin.
_**
+**
+**
Vol. Fire
−*
N.S.
−*
Invest
N.S.
N.S.
+**
Web
N.S.
−^
+*
Cap Bud.
−^
N.S.
+**
(1)
(2)
(3)
(4)
ISO
Volunteer Firefighters
Website
Response Factor
Distance to Urban County
0.0128**
0.0141
−0.0188^
0.0058***
(0.0039)
(0.0123)
(0.0112)
(0.0016)
Distance to Interstate
−0.0009
0.0633
−0.0280
0.0045
(0.0109)
(0.0542)
(0.0215)
(0.0044)
Local Gov. Density
0.0248
−0.0143
−0.0274
0.0056
(0.0182)
(0.0410)
(0.0706)
(0.0073)
Population
−0.0000
0.0000
0.0000
−0.0000
(0.0000)
(0.0000)
(0.0001)
(0.0000)
Population Density
−0.0012
−0.0098*
−0.0051
−0.0007^
(0.0010)
(0.0043)
(0.0197)
(0.0004)
Rural RIGO
0.1809
−0.3554
−0.5036
0.0649
(0.3008)
(0.8263)
(0.8493)
(0.1207)
Median Age
0.0724*
0.1585
−0.1305
0.0325*
(0.0354)
(0.1173)
(0.1049)
(0.0142)
Median Income
−0.0000^
−0.0000
0.0000
−0.0000
(0.0000)
(0.0000)
(0.0001)
(0.0000)
Total Revenue
0.0000
0.0000
0.0001
0.0000*
(0.0000)
(0.0000)
(0.0001)
(0.0000)
Percent IGR
0.0442
−0.1044
−0.0478
0.0167
(0.0286)
(0.0676)
(0.0626)
(0.0115)
Bond Debt
−0.0000^
−0.0000
0.0000
−0.0000**
(0.0000)
(0.0000)
(0.0003)
(0.0000)
Constant
1.9699
−2.0954
8.8723
−1.1897^
(1.6939)
(4.1383)
(5.8636)
(0.6800)
No. of Obs.
136
136
136
136
Pseudo R-Squared
0.3891 (Adj. R-Squared)
0.5439
0.3519
0.5693 (Adj. R-Squared)
Wald Chi-Sq
8.82***
70.5860***
28.5660***
14.90***
(1)
(2)
(3)
(4)
ISO
Volunteer Firefighters
Website
Response Factor
Distance to Urban County
0.0056**
0.0019
−0.0136**
0.0041***
(0.0020)
(0.0037)
(0.0042)
(0.0011)
Distance to Interstate
0.0045
−0.0045
−0.0042
0.0020
(0.0043)
(0.0080)
(0.0087)
(0.0024)
Local Gov. Density
−0.0017
−0.0653*
0.0522
−0.0177*
(0.0150)
(0.0279)
(0.0415)
(0.0083)
Population
−0.0000
−0.0000
0.0012***
−0.0000
(0.0000)
(0.0000)
(0.0002)
(0.0000)
Population Density
−0.0006***
−0.0003
−0.0010^
−0.0003***
(0.0002)
(0.0003)
(0.0006)
(0.0001)
Rural RIGO
−0.0665
−0.4432
−0.1041
−0.0659
(0.1602)
(0.2955)
(0.3295)
(0.0890)
Median Age
0.0114
0.0649**
0.0099
0.0213**
(0.0118)
(0.0235)
(0.0226)
(0.0065)
Median Income
0.0000
−0.0000**
−0.0000
−0.0000
(0.0000)
(0.0000)
(0.0000)
(0.0000)
Total Revenue
−0.0000*
−0.0000***
0.0000
−0.0000***
(0.0000)
(0.0000)
(0.0000)
(0.0000)
Percent IGR
0.0133*
0.0053
−0.0018
0.0081*
(0.0065)
(0.0124)
(0.0125)
(0.0036)
Bond Debt
0.0000*
0.0001***
−0.0000
0.0000**
(0.0000)
(0.0000)
(0.0001)
(0.0000)
Constant
3.8633***
1.3476
−0.5030
−0.4992
(0.6041)
(1.1803)
(1.4029)
(0.3357)
No. of Obs.
346
346
346
346
Pseudo R-Squared
0.2956 (Adj. R-Squared)
0.2610
0.4230
0.4353 (Adj. R-Squared)
Wald Chi-Sq
14.16***
119.0322***
177.5191***
25.17***
(1)
(2)
(3)
(4)
Full-Time Finance Director
Written Investment Plan
Capital Budget
Anticipatory Factor
Distance to Urban County
−0.0111^
−0.0142*
−0.0140*
−0.0077***
(0.0064)
(0.0059)
(0.0057)
(0.0019)
Distance to Interstate
−0.0158
0.0236
−0.0166
−0.0011
(0.0182)
(0.0153)
(0.0163)
(0.0053)
Local Gov. Density
−0.0186
0.0182
−0.0290
−0.0022
(0.0359)
(0.0269)
(0.0288)
(0.0089)
Population
0.0000
0.0000
0.0000
0.0000
(0.0000)
(0.0000)
(0.0000)
(0.0000)
Population Density
−0.0115**
−0.0017
−0.0034^
−0.0009^
(0.0038)
(0.0025)
(0.0020)
(0.0005)
Rural RIGO
0.2108
−0.3264
−0.4607
−0.0555
(0.4895)
(0.4396)
(0.4379)
(0.1474)
Median Age
0.0071
−0.1552**
−0.1159^
−0.0585**
(0.0660)
(0.0602)
(0.0592)
(0.0173)
Median Income
0.0001**
−0.0000
0.0000
0.0000
(0.0000)
(0.0000)
(0.0000)
(0.0000)
Total Revenue
0.0000**
0.0000
−0.0000
0.0000
(0.0000)
(0.0000)
(0.0000)
(0.0000)
Percent IGR
−0.0530
−0.0034
−0.0312
−0.0187
(0.0455)
(0.0409)
(0.0400)
(0.0140)
Bond Debt
0.0000
0.0000
0.0000
0.0000
(0.0000)
(0.0000)
(0.0000)
(0.0000)
Constant
−3.1607
6.4027*
6.0750*
2.8417***
(3.3692)
(2.8304)
(2.9144)
(0.8299)
No. of Obs.
136
136
136
136
Pseudo R-Squared
0.3425
0.2115
0.2118
0.3270 (Adj. R-Squared)
Wald Chi-Sq
61.6362***
39.7238***
39.2990***
6.96***
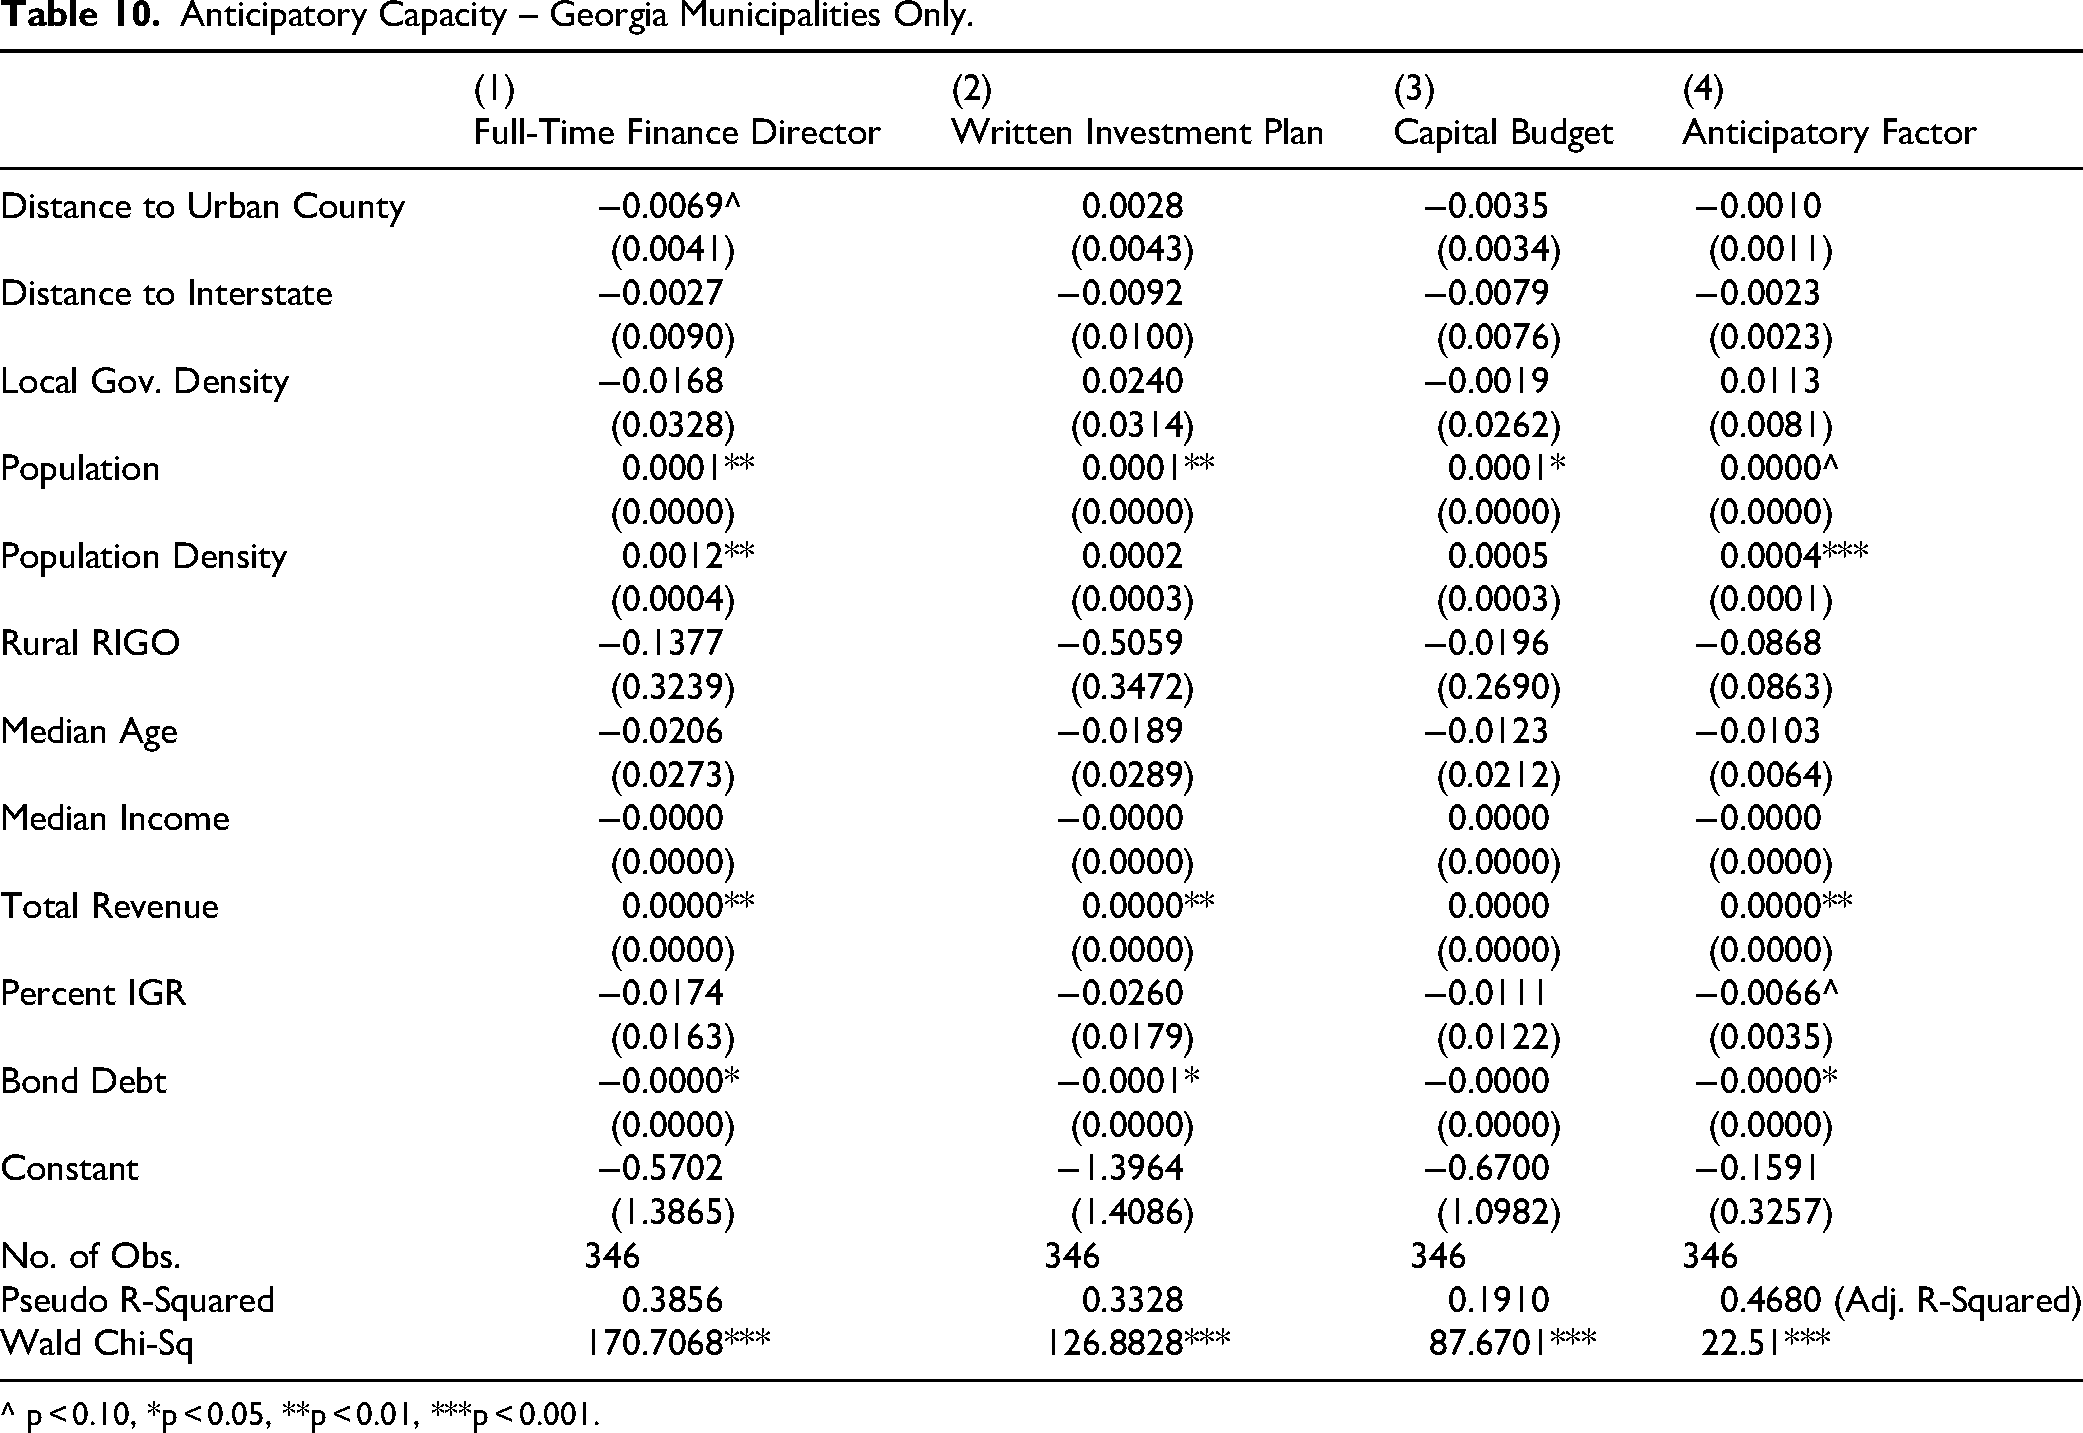
(1)
(2)
(3)
(4)
Full-Time Finance Director
Written Investment Plan
Capital Budget
Anticipatory Factor
Distance to Urban County
−0.0069^
0.0028
−0.0035
−0.0010
(0.0041)
(0.0043)
(0.0034)
(0.0011)
Distance to Interstate
−0.0027
−0.0092
−0.0079
−0.0023
(0.0090)
(0.0100)
(0.0076)
(0.0023)
Local Gov. Density
−0.0168
0.0240
−0.0019
0.0113
(0.0328)
(0.0314)
(0.0262)
(0.0081)
Population
0.0001**
0.0001**
0.0001*
0.0000^
(0.0000)
(0.0000)
(0.0000)
(0.0000)
Population Density
0.0012**
0.0002
0.0005
0.0004***
(0.0004)
(0.0003)
(0.0003)
(0.0001)
Rural RIGO
−0.1377
−0.5059
−0.0196
−0.0868
(0.3239)
(0.3472)
(0.2690)
(0.0863)
Median Age
−0.0206
−0.0189
−0.0123
−0.0103
(0.0273)
(0.0289)
(0.0212)
(0.0064)
Median Income
−0.0000
−0.0000
0.0000
−0.0000
(0.0000)
(0.0000)
(0.0000)
(0.0000)
Total Revenue
0.0000**
0.0000**
0.0000
0.0000**
(0.0000)
(0.0000)
(0.0000)
(0.0000)
Percent IGR
−0.0174
−0.0260
−0.0111
−0.0066^
(0.0163)
(0.0179)
(0.0122)
(0.0035)
Bond Debt
−0.0000*
−0.0001*
−0.0000
−0.0000*
(0.0000)
(0.0000)
(0.0000)
(0.0000)
Constant
−0.5702
−1.3964
−0.6700
−0.1591
(1.3865)
(1.4086)
(1.0982)
(0.3257)
No. of Obs.
346
346
346
346
Pseudo R-Squared
0.3856
0.3328
0.1910
0.4680 (Adj. R-Squared)
Wald Chi-Sq
170.7068***
126.8828***
87.6701***
22.51***