
Abstract
School meal programs have positive effects on student nutrition and academic outcomes, but participation is far from universal. A set of recent school food policies, such as Universal Free Meals (UFM) and Breakfast in the Classroom (BIC), aim to reduce the administrative burden of participating students. While studies find UFM and BIC are effective in increasing participation, little is known about how schools’ physical capacity constraints may limit the effectiveness of these policies or further impose administrative burden. In this study, we use longitudinal school-level data from New York City public schools for academic years 2010–2014 and find that UFM is less effective in schools that share buildings with other schools (“co-located”), especially for low-income students. BIC, however, appears to be similarly effective regardless of school co-location status, suggesting that decentralizing locations for school meal distribution and consumption may serve as an effective policy lever in capacity-constrained settings. We find “overcrowding,” another capacity constraint, does not moderate the effectiveness of either UFM or BIC. Our study provides new evidence of physical barriers in public school settings that may impede policies that aim to increase take-up of school meal programs and the extent to which this burden is unevenly borne by low-income students, which in turn may result in inequitable nutritional, health, and academic outcomes.
Prior research finds that administrative burden makes access to public benefits more challenging, especially for disadvantaged groups, and lowers take-up of social programs (Bell et al., 2021; Deshpande & Li, 2019; Herd & Moynihan, 2019; Olsen et al., 2020; Rossin-Slater, 2013). With increasing attention to policy levers that can alleviate such burdens, recent evidence suggests policy effects may depend on the program design or context. For instance, the effects of automation—a policy lever to reduce administrative burden—may vary with the level of complexity of a program (Young et al., 2023). This paper specifically focuses on administrative burden in the cafeteria and examines whether the effects of school food policies that aim to reduce administrative burden depend on the schools’ physical capacity constraints.
Recent research documents positive effects of school meals on student nutrition and academic outcomes (Corcoran et al., 2016; Frisvold, 2015; Gundersen et al., 2012), yet participation is far from universal, even among low-income students eligible for free or reduced-price meals (Fox et al., 2019; Schwartz & Rothbart, 2020). Policies like Universal Free Meals (UFM) and Breakfast in the Classroom (BIC) aim to increase participation by reducing administrative burden. UFM provides free meals for all students regardless of household income, which streamlines the verification of eligibility for free meals, reduces time processing transactions, and lowers the psychological cost of participation; BIC, in addition, provides breakfast in the classroom instead of the cafeteria, decentralizing service locations. Studies find that these policies are effective in increasing participation (e.g., Holford & Rabe, 2022; Schwartz & Rothbart, 2020), but little is known about how schools’ physical capacity constraints may limit the effectiveness of these policies, impose administrative burden, or require practices of administrative discretion. This is of increasing importance as urban public schools are often overcrowded and increasingly share buildings with other schools (Wolff & Rogers, 2014).
This study examines the relationship between school capacity constraints, specifically density (“overcrowding;” enrollment 5% over capacity as defined by the National Center for Education Statistics (NCES)) and sharing buildings (“co-location;” two or more schools in a building), and student school meal participation. We measure compliance as participation rates in the National School Lunch Program (NSLP) and School Breakfast Program (SBP). We examine school meal participation rates schoolwide and among students eligible for free or reduced-price lunch (FRPL). Critically, we explore whether capacity constraints limit the effectiveness of UFM and BIC.
We use longitudinal, school-level data on New York City (NYC) public schools in academic years (AY) 2010–2014, covering over 1,000 schools each year. Results from school fixed effects models show that UFM and BIC increase take-up of school meals schoolwide and for low-income students. Yet, UFM has smaller positive effects in co-located schools; this gap in UFM effectiveness is larger among low-income students than schoolwide, suggesting uneven distribution of administrative burdens within schools. BIC, on the contrary, does not appear to have smaller effects in co-located settings, suggesting that decentralizing service locations may effectively reduce administrative burden that students face in co-located school settings. We also find that overcrowding does not moderate the effects of UFM or BIC. Finally, an examination of potential mechanisms reveals that co-located schools have wider lunch start time dispersion, suggesting negotiation and administrative discretion in the face of capacity constraints.
Our findings shed light on how physical barriers in public facilities may disproportionately affect program take-up among disadvantaged populations and how policy levers and administrators’ discretion may alleviate or exacerbate such inequities. Our paper contributes to the public management literature by identifying the contexts under which policies intended to reduce administrative burden and increase service take-up are less effective.
Administrative Burden, Administrative Discretion, and Program Participation
Administrative burden occurs when practices of policy implementation create onerous experiences for clients. Examples include the cost of complying with a program's rules, the psychological costs of participating in a program (particularly an unpopular one), and the cost of accessing and learning about a program (Burden et al., 2012; Heinrich, 2018; Herd et al., 2013; Herd & Moynihan, 2019). Administrative burden may be produced through formal procedures and policy or through informal behaviors of bureaucrats implementing the policy, also known as “administrative discretion” (Peeters, 2020). 1 Whether a result of formal or informal processes, administrative burden may result in limited (or denied) access to benefits of public services and programs (Bell et al., 2021; Compton et al., 2022; Herd & Moynihan, 2019; Olsen et al., 2020).
Recent research has focused on identifying the formal procedures and policies that create (or, conversely, are designed to reduce) administrative burden and, in turn, affect client take-up of programs. First, simplified application and enrollment processes can lower the administrative burden on the client side and increase their participation in programs. For example, studies find that eliminating interview requirements for the State Children's Health Insurance Program (SCHIP) or Supplemental Nutrition Assistance Program (SNAP) increases take-up among eligible children (Heflin et al., 2023; Wolfe & Scrivner, 2005); reducing paperwork burden by lengthening certification periods increases the caseloads of SNAP (Klerman & Danielson, 2011); 2 and auto-enrolling eligible children for Medicaid in Wisconsin (along with other assistance in the application process) increases take-up of the program (Herd et al., 2013). 3
Second, policies that make income eligibility and participation less conspicuous, such as universal programs, may lower the psychological cost of participation. Means-tested programs are believed to have higher levels of administrative burden and lower take-up rates among eligible beneficiaries than universal programs (Hernanz et al., 2004; Korpi & Palme, 1998). Many suggest stigma plays a role, as clients may need to signal their eligibility at the application stage or during the participation stage (Stuber & Schlesinger, 2006).
Third, easier physical access to programs may reduce compliance costs and encourage participation in programs. For example, openings of Women, Infants, and Children program clinics increase eligible mothers’ take-up of food benefits (Rossin-Slater, 2013). Likewise, closings of nearby Social Security field offices increase congestion at neighboring offices and reduce disability benefit applications (Deshpande & Li, 2019). Evidence from the healthcare management literature also suggests emergency room overcrowding harms patient experiences and outcomes. Physicians in overcrowded emergency rooms face institutional constraints, such as limited access to hospital technology and emergency beds, reducing job satisfaction (Rondeau et al., 2005). Overcrowded emergency rooms may further result in poor patient outcomes, including long patient waits, ambulance diversion, and prolonged pain and suffering of patients (Derlet & Richards, 2000). 4 In other words, physical capacity constraints serve as a form of administrative burden and thus may increase compliance costs and discourage participation.
Administrative burden may also disproportionately deter some groups from public services. While administrative burden may disincentive clients who are less in need of social and financial assistance (Alvarez et al., 2008), it may also facilitate discrimination and disadvantage marginalized groups (Ray et al., 2020). Complex eligibility requirements for social service programs, for example, limit the number of elderly applicants (Sunstein, 2018). Returning to the example of Social Security field office closings, applicants with lower educational and income levels were most likely to be deterred from applying due to limited physical access to offices (Deshpande & Li, 2019). Overall, prior studies show that administrative burden from formal procedures and policies may impose different levels of barriers to different groups of individuals.
Public administrators’ practices and discretion in allocating public resources may also systematically suppress participation among some groups more than others. When excessive demand is met with limited resources, administrative discretion may be involved to ration and limit access to government assistance programs (Lipsky, 1969, 1984; Winter, 2000). Street-level bureaucrats utilize discretion in their day-to-day tasks to distribute resources and protect themselves from work overload, which may result in differential client access to public service (Bell et al., 2021; Peeters, 2020). 5 Administrators might decline to share information (for example, about new programs) with or behave less welcoming toward particular groups (Heinrich, 2018; Jilke et al., 2018). The administrative practices of principals and other school administrators, as public managers, also shape organizational performance in delivering public school services (Favero et al., 2016); for example, in NYC public schools, principals have sufficient autonomy to practice discretion in adopting programs and practices, changing resource allocation, and altering the composition of school inputs (Rothbart, 2020). Principals and school food managers’ discretionary actions may play similar roles in shaping school meal participation.
While no studies to our knowledge examine administrative discretion in the cafeteria, recent empirical studies—more broadly in school settings—provide evidence of principals’ and other education administrators’ use of administrative discretion resulting in inequitable distribution of resources among students. Sorensen et al. (2022) examine the impact of school principals’ discretion to use disciplinary tools, such as suspension, expulsion, and transfer, on middle school student outcomes in North Carolina. They find that harsher principals reduce minor student misconduct but increase juvenile justice complaints and reduce high school graduation rates. Critically, they find that principals who are more likely to remove Black students for the same offense compared to White students widen the racial gaps in attendance and test outcomes. Another study finds school principals practice administrative discretion when distributing school day shifts (morning or afternoon school hours), with low-income students more likely to be assigned to the afternoon than middle and high-income students (Cárdenas & Ramirez de la Cruz, 2017). They find that the implementation of a lottery system, which reduces school principals’ discretion, results in a more equitable distribution of low-income students across morning and afternoon shifts. Finally, an audit study on Danish primary schools by Olsen et al. (2020) finds that those in the “in-group” (with Danish names) and those in the “out-group” (with Muslim names) receive systematically different responses to their inquiries for school enrollment; those in the in-group received a clear acceptance 25% of the time, while those in the out-group received acceptance at a rate of 15%. In other words, administrative discretion in public education settings may impose higher barriers to some groups of students over others, with higher costs likely borne by racial/ethnic minorities and low-income students.
Policy Context
School Meal Programs
For decades, the U.S. Department of Agriculture (USDA) has subsidized school lunch and breakfast through the NSLP (established 1946) and SBP (established 1966). The programs are large; NSLP subsidized the provision of 29.4 million school lunches per day in fiscal year (FY) 2019, making it the second largest federal food assistance program, and SBP subsidized 14.7 million school breakfasts per day (Tiehen, 2020). As noted previously, small subsidies are provided for all meals served, with more generous subsidies offered for meals given to students from households with incomes at or below 130% of the federal poverty line (meals provided for free) and those from households with incomes between 130% and 185% (meals provided at a substantially reduced price). Approximately three-quarters of school lunches and 85% of school breakfasts served were free or reduced-price in FY 2019 (Tiehen, 2020).
Previous research on NSLP and SBP suggests participation in school meals has positive effects, such as reduced food insecurity, improved academic outcomes, and improved behavior, with mixed results for obesity. NSLP and SBP reduce food insecurity, once accounting for differential selection into program participation by household income (Arteaga & Heflin, 2014; Gundersen et al., 2012). 6 Many find positive effects of school meal participation on test scores (Dotter, 2013; Frisvold, 2015), though several notable studies find null effects (Bartlett et al., 2017; Dunifon & Kowaleski, 2003; Schanzenbach & Zaki, 2014). NSLP and SBP participation also improve long-run test scores and educational attainment (Frisvold, 2015; Hinrichs, 2010). Previous research also documents benefits for student behavior and suspensions (Crawford & Burns, 2022) but no effects on attendance (Bartlett et al., 2017). Effects on obesity are less consistent, with some finding lower obesity (Gundersen et al., 2012), some finding no effects (Millimet et al., 2010), and some finding increased prevalence (Schanzenbach, 2009).
Despite potential benefits, the impacts of NSLP and SBP are hindered by lower than expected daily participation rates—even among FRPL-eligible students (Gleason, 1995; Mirtcheva & Powell, 2009). The School Nutrition and Meal Cost Study found that in 2014–2015, 56.1% of students participated in NSLP and 21.4% in SBP on a typical school day, with rates somewhat higher but far from universal among FRPL-eligible students (78.1 and 37.2%, respectively; Fox et al., 2019). Daily participation rates are similar for lunch but lower for breakfast in NYC; Schwartz and Rothbart (2020) find lunch and breakfast participation rates of 62.2 and 11.3%, respectively, among NYC middle school students ever exposed to UFM, and Corcoran et al. (2016) find rates of about 80% and 24%, respectively, citywide in 2006–2007.
Lower than desired participation may be due to an array of factors that increase administrative burden on clients when taking up programs, as discussed in the previous section. First, the administrative challenges of implementing a means-tested program for children each day include verifying students’ respective individual eligibility and recording the provided meal under the right reimbursement account. Second, administrative burden that increase the psychological cost of participating in school meal programs may play a role, including stigma and low shares of peers who are eligible for (and thus receive) free lunch in a school (Mirtcheva & Powell, 2009). Finally, physical barriers in the cafeteria may get in the way of a student's decision to participate in school lunch. To be sure, myriad other considerations, such as price and individual food preferences, may contribute to the decisions to participate in school meals, but administrative burden may play a prominent role.
School Food Policies That Alleviate Administrative Burden in the Cafeteria
Perhaps motivated to lower the administrative burden of school meal program participation and to maximize the benefits highlighted in previous research, a recent set of federal, state, and local policies aim to increase participation in NSLP and SBP. UFM and BIC are some examples, among others, like direct certification (described below). NYC public schools began citywide direct certification in 2006 and increasingly adopted UFM and BIC since that period. 7 More than 400 NYC public schools implemented UFM between 2009 and 2013, and since the fall of 2017, all NYC public schools have offered UFM under the Community Eligibility Provision (CEP) of the NSLP. 8 Approximately 300 NYC public schools implemented BIC in 2011, and more have adopted over time (Corcoran et al., 2016).
Recent developments in simplifying application and enrollment processes include direct certification of students’ free or reduced-price meal eligibility status. Like other auto-enrollment systems, direct certification eliminates the processes required to demonstrate eligibility for the program and thus lowers compliance costs for students (Hulsey et al., 2022). Direct certification links administrative records from other social services programs that have significant overlaps in the low-income population, such as SNAP or Medicaid, to certify students for free and (recently, with the addition of Medicaid status in pilot settings) reduced-price meals. 9
Under UFM, all students in a school or a district, regardless of individual circumstances or eligibility, are automatically eligible for free meals. For non-poor students who are not eligible for FRPL, UFM not only has price effects of reducing the real cost of purchasing school meals but also effectively reduces administrative burden, as the process of tracking transactions at the point-of-service (and “paying” lunch fees) is simplified. This also reduces the time spent in lunch/breakfast lines. Low-income students who were previously eligible for FRPL also face lower compliance costs by not having to pay for meals nor having to demonstrate eligibility. Moreover, income eligibility becomes less salient under UFM, lowering the psychological cost of participating in school meals. Increased participation among middle- or higher-income peers via UFM may also make participation a less conspicuous signal of poverty, thus reducing stigma.
Indeed, previous research shows that UFM increases participation in school meals, often highlighting reduced administrative burden as a mechanism. 10 There is also likely a price effect from removing fees for some students; previous work finds UFM increases participation among non-poor students more than those already FRPL-eligible (Holford & Rabe, 2022; Schwartz & Rothbart, 2020). Still, this work finds that UFM increases participation even among those who already receive free school meals, suggesting that mechanisms other than price, such as stigma or other administrative burden, matter (Gutierrez, 2021; Schwartz & Rothbart, 2020).
As for BIC, decentralization of service location may serve as an avenue to reduce administrative burden for participating students by improving physical access. BIC delivers school meals in the classroom, where children already congregate, and offers breakfast at hours when students are required to be in school instead of before the bell. A previous study on NYC public schools shows that BIC increases student participation in school breakfasts by as much as 30.2 percentage points (Corcoran et al., 2016). 11
Administrative Burden and Discretion in Overcrowded Schools and Shared Buildings
Schools’ physical capacity constraints may further determine students’ participation decisions and limit the effectiveness of UFM and BIC. Overcrowding may impose administrative burden on delivering public school services, including outside-the-classroom services. 12 Cafeterias are often the highest density areas in schools among locations outside the classroom (Cash et al., 2015) and may display the most visible impact of overcrowding. Indeed, overcrowded schools were documented to have long lines for food in the cafeteria (McCain et al., 1985). Overcrowded cafeterias and long lunch lines may make the administrative processes of completing transactions and demonstrating eligibility more burdensome. This may also complicate school management and reduce effectiveness in administering school meal programs. Although not directly observing measures of overcrowding, Probart et al. (2006) find that school size negatively predicts participation in school lunch. 13 In a more recent study, Prescott et al. (2022) use one year of NYC public school data in AY 2014 and find elementary schools that operate in buildings above 100% of building utilization (their measure of overcrowded schools) had lower breakfast and lunch participation rates on average (by 4.6 and 3.1 percentage points, respectively). Conversely, the authors find no relationship among middle and high schools for lunch and the opposite relationship for breakfast.
While overcrowding has been flagged as a source of physical capacity constraints in public schools for decades, increasing use of shared buildings and spaces presents important new considerations. In the past two decades, several school reforms have worked towards increasing the use of shared spaces between schools, especially in urban school districts. The small schools movement replaced large comprehensive schools with newly created small schools. Charter school expansion further pushed urban districts to provide charter schools with facilities space, often resulting in co-location with smaller traditional public schools that share the same physical building and facilities (Baker et al., 2015; Cordes, 2018; Wulach & Kemple, 2021). In 2013, more than 60% of NYC public schools shared a building with at least one other school (Wolff & Rogers, 2014). While little research has studied co-location outside NYC, co-located schools can be found in cities across the nation, including Chicago, Los Angeles, Washington D.C., and other districts in Texas (Gill & Maas, 2017; Griffin et al., 2015; Mackey, 2022; Sazon, 2011).
Despite the increased use of shared spaces in urban schools, a dearth of research considers impacts of these burdens on school program participation or documents their prevalence across schools of different demographics. While co-located schools rarely share classroom spaces, they “commonly share other facilities, such as cafeterias, gymnasiums, and auditoriums” (Wolff & Rogers, 2014). Students may lack adequate and appropriate access to such shared facilities, as well as the services and programs delivered there. Prescott et al. (2022) use one year of NYC public school data and find co-location is negatively associated with high school breakfast participation (by 5.6 percentage points) but find no relationship for lunch or in elementary or middle schools.
Overcrowding and co-location may further require school managers and principals to use strategies within their discretion to allocate cafeteria space and hours. Previous reports suggest that 74% of overcrowded schools use staggered lunch schedules as a scheduling practice to alleviate overcrowding (NCES, 2000). Co-located schools also typically stagger lunch hours so that children in the two schools do not share the cafeteria at the same time. Negotiating timing and duration of use for shared spaces in co-located schools requires additional interactions between school administrators, as well as coordination and discretion. 14 In the process of staggering lunch hours, undesirable mealtimes may fall disproportionately upon FRPL-eligible students and the schools that serve them, consistent with previous research on administrative discretion.
While there is well-documented evidence that UFM and BIC have independent, positive effects on student participation in school meals, how they interact with school capacity constraints is virtually unknown. Prescott et al. (2022) is the only paper to our knowledge that directly observes the relationship between capacity constraints and school meal participation but does not do so specifically at the intersection of these school food policies. Moreover, Prescott et al. (2022) rely on cross-sectional analyses, which is likely shaped by student sorting into schools and endogenous adoption of school food policies. That is, schools differ on a myriad of factors correlated with overcrowding or co-location, and cross-sectional analyses are limited in teasing such differences apart. Such confounders are particularly concerning within a district like NYC, where school choice is common and schools can opt into UFM or BIC based on perceived needs and/or constraints. For example, overcrowded elementary schools in NYC's choice environment tend to serve lower shares of minority and low-income students, so they may serve school meals at lower rates due to student composition; this would lead to overestimates of the potential harms of overcrowding. As another example, co-located schools are more likely to offer BIC and serve greater shares of minority and low-income students; such patterns may result in an underestimation of the potential harms of co-location for breakfast and lunch participation. As such, previous evidence has not examined (nor has been able to examine) how and the extent to which overcrowding or co-location limits the effectiveness of school food policies like UFM and BIC.
In addition to exploring whether the effectiveness of UFM and BIC is hampered by school capacity constraints, we aim to explore the extent to which the two policy levers are disparately affected by constraints. As noted above, co-location requires additional administrative discretion among school managers across multiple schools to allocate time, timing, and space in the cafeteria. However, co-located schools with BIC no longer need to make use of shared cafeterias to serve breakfasts, which would eliminate the need for such administrative discretion; BIC is hypothesized to work just as effectively in co-located schools (vs. stand-alone schools). UFM, conversely, still takes place in the shared cafeteria, which may limit its effectiveness in co-located schools. These managerial considerations for “heterogeneity” in the effectiveness of these policies at reducing administrative burden have been ignored in previous policy analysis research. Moreover, since this reflects a form of administrative discretion, previous evidence from other contexts would suggest the administrative burden of shared cafeterias would be disproportionately borne by disadvantaged students. Unlike co-location, we expect no such discrepancy in the moderating effects of overcrowding across BIC and UFM.
Data, Measures, and Sample
We construct a school-level panel dataset for NYC public schools between academic years 2009–2010 and 2013–2014 (AY 2010–2014), merging three administrative datasets. First, the New York State Annual School Report and the School Report Card (SRC) provides school location, enrollment, grades served, and student composition, such as share by gender, race/ethnicity, nativity, grade, students with disability (SWD), English language learners (ELL), and FRPL-eligibility. We determine whether a school is co-located if the school uses the same building as other schools, including either other traditional public schools or charter schools.
Second, data from the NYC Department of Education (DOE) Office of School Food provide school-level estimates of annual participation rates in breakfast and lunch for all students, participation rates by FRPL status, and school food policies on BIC and UFM. School lunch or breakfast participation rates are measured using the numbers of breakfasts and lunches served during the year divided by the school's enrollment and the number of school days in the year, providing a per student per day measure that takes a value of 1 if all students eat school meals every day throughout the school year. 15 Similarly, meal participation for FRPL-eligible students is calculated using the count of meals served to FRPL-eligible students and the count of FRPL-eligible students enrolled. Indicators for UFM and BIC capture school offerings of each school food policy in the observation year. The Office of School Food also provides school lunch and breakfast start times for each school, which we only observe for AY 2014. Because we only observe one year of data for this measure, we do not include it in longitudinal analyses and instead document relationships in AY 2014 to shed light on potential mechanisms.
Finally, we integrate data from NYC Open Data, the city's official online data portal, to identify school building capacity and determine whether they are overcrowded. Unlike co-location, which is easily measured based on whether schools use the same building, there is no universal standard for measuring overcrowded schools. We follow the most widely used measure for overcrowded schools, which are defined by NCES (2000) as schools that enroll greater than 5% of their capacity. We measure all other schools (within 5% of capacity or with enrollments below building capacity) as at-capacity. We additionally consider a continuous measure for overcrowding, using the ratio of student enrollment to the school's capacity in robustness checks.
We begin with the universe of NYC public schools that serve general education and part-time education students. For our analytic sample, we focus on a balanced panel of 5,220 school-year observations of 1,044 NYC traditional public schools, continuously operating for AY 2010 through AY 2014. 16 For all schools in our sample, we must observe building locations, capacity constraint measures, school meal participation rates, and student composition. Our sample covers over 700,000 students every year. We define the grade span for each school as “elementary” if the lowest grade served is 4th or lower, “elementary-middle” if the lowest grade served is 4th or lower and contains 7th, “middle” if the lowest grade served is higher than 4th and contains 7th, “middle-high” if contains 7th grade and the highest grade served is 9th or higher, and “high” if does not contain 7th grade and the highest grade served is 9th or higher.
Table 1 shows variable means for our analytic sample as of AY 2014, including breakfast and lunch participation rates. In our analytic sample of all schools (see column 1), the average lunch participation rate is around 61.3% and breakfast participation rate is around 21.7%. School meal participation rates are higher among FRPL-eligible students (70.6 and 24.4% for lunch and breakfast, respectively). Approximately one-fifth of the schools offer UFM, and one-fifth offer BIC. A third of schools are overcrowded and 48% are co-located, demonstrating the prevalence of capacity constraints across NYC public schools. An average school enrolls 675 students. 17
Summary Statistics by Capacity Constraints Status, AY 2014.
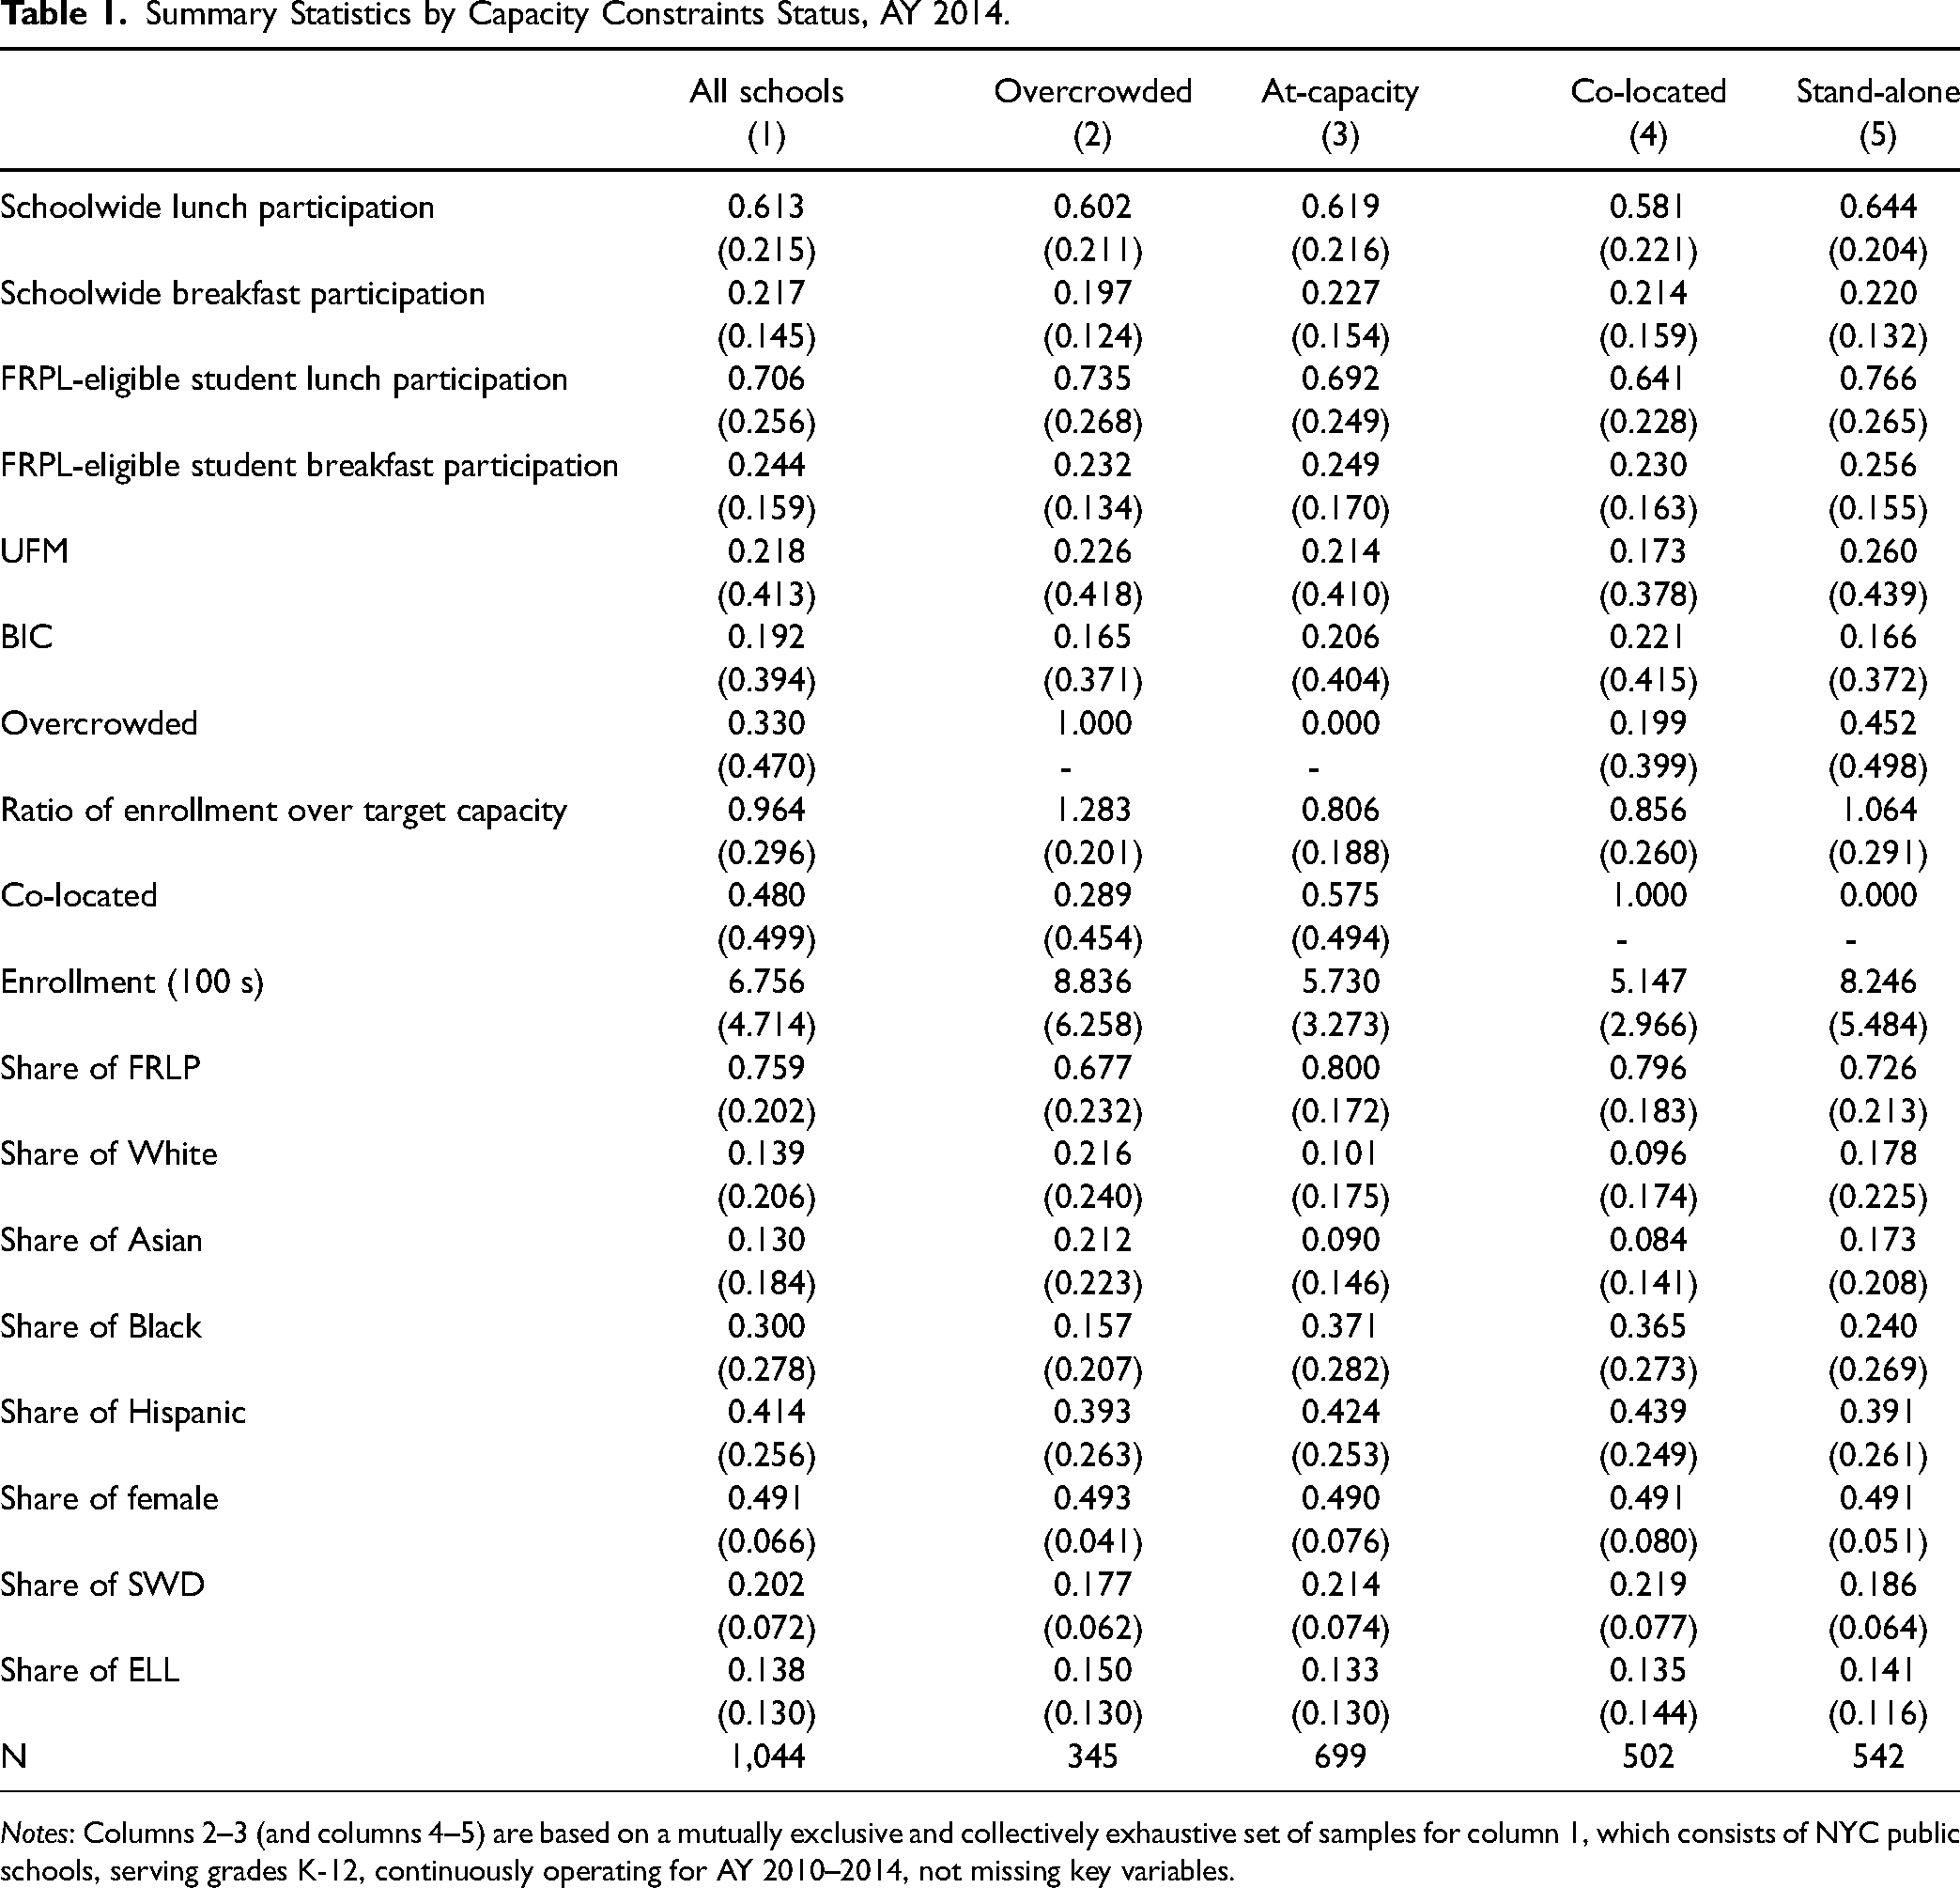
Notes: Columns 2–3 (and columns 4–5) are based on a mutually exclusive and collectively exhaustive set of samples for column 1, which consists of NYC public schools, serving grades K-12, continuously operating for AY 2010–2014, not missing key variables.
Participation rates in lunch (60.2 vs. 61.9%) and breakfast (19.7 vs. 22.7%) are slightly lower in overcrowded schools compared to those at-capacity. Among FRPL-eligible students, overcrowded schools have higher lunch (73.5 vs. 69.2%) and lower breakfast participation. Larger shares of overcrowded schools offer UFM (22.6 vs. 21.4%) but lower shares offer BIC (16.5 vs. 20.6%). Lower shares of overcrowded schools are co-located (28.9%) than at-capacity schools (57.5%), and overcrowded schools tend to be larger (883 vs. 573 students).
Co-located schools, compared to stand-alone schools, have lower participation in lunch (58.1 vs. 64.4%) and breakfast (21.4 vs. 22.0%) overall, and among FRPL-eligible students (64.1 vs. 76.6 and 23.0 vs. 25.6%, respectively). They are much less likely to offer UFM (17.3 vs. 26.0%) but more likely to offer BIC (22.1 vs. 16.6%). Co-located schools are generally less likely to be overcrowded (and vice-versa) and they serve different types of students in NYC, on average. 18 Only 20% of co-located schools are overcrowded (vs. 45.2% for stand-alone schools).
Empirical Strategy
First, following previous research on the impact of school food policies (UFM and BIC), we estimate the effects of the policies on school meal participation within schools over time, conditioning on other time-varying, observable school characteristics. We use the following:

Our estimates are driven by variations in the timing of UFM and BIC adoption across schools, offering a causal impact of each policy if the precise timing of exposure to UFM (and BIC) is exogenous and uncorrelated with unobserved concurrent changes in school policies and characteristics. This strategy is commonly used in previous research on UFM and BIC (see, for example, Imberman & Kugler, 2014; Leos-Urbel et al., 2013; Schwartz & Rothbart, 2020), and this previous work offers supportive evidence of the parallel trends assumption for both policies. Note that unobserved, time-varying features of schools are not controlled for in a school fixed effects model, which may limit a causal interpretation of the policy effects. Yet, conditional exogeneity is plausible in this context, which likely supports a causal interpretation of the impact estimates. Another caveat for the school fixed effects model is that the estimated policy effects of UFM and BIC may reflect mechanisms other than the reduction of administrative burden. For UFM, impact estimates captured by β1 can operate through price effects in addition to alleviation of administrative burden for FRPL ineligible students, because their price for school lunch changes with UFM adoption. For BIC (and the effects of UFM on FRPL-eligible students), price does not change with policy adoption and estimated impacts mostly (or entirely) operate through administrative burden alleviation, per se.
Second, we add our measures of capacity constraints (overcrowded and co-located):
Third, UFM and BIC, aside from independent effects, may (or may not) have smaller effects when introduced in schools that are overcrowded or co-located. As such, we explore the extent to which capacity constraints moderate the link between UFM and school meal participation using the following model: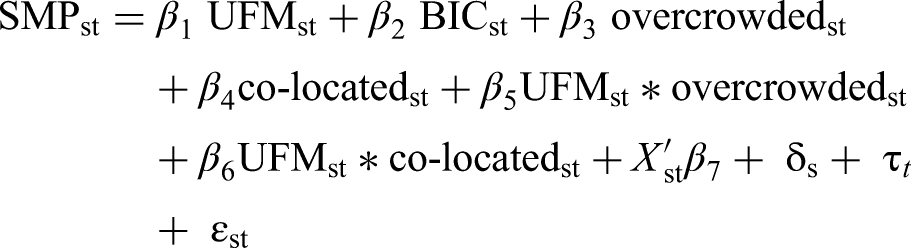
To further explore mechanisms, we consider administrative discretion over meal start times. We examine the distribution of school lunch and breakfast start times by capacity constraints. Making full use of observed mealtimes (in AY 2014), we offer exploratory evidence on one avenue through which school food policies might interact with capacity constraints. We note that BIC is a potential remedy for extreme breakfast start times by decentralizing service locations and reducing constraints for allocating hours in the cafeteria. UFM, conversely, may not solve the problem of extreme lunch hours in the same way, as administrators may still feel compelled to spread out lunch hours to accommodate separate lunch times for multiple schools. Though speculative, links between the distribution of meal start times and capacity constraints may provide one plausible explanation for differences, if any, in how school capacity constraints moderate the relationships between UFM and BIC with school meal participation.
To test another avenue of potential mechanism, we additionally control for school-level attendance rates in our main analyses and examine whether the estimated relationship between capacity constraints and student meal participation, if negative, could be explained through reduced attendance. School capacity constraints may potentially reduce student attendance and would, in turn, reduce student participation in school meal programs. If the coefficients for overcrowded and co-located (and their interaction terms with UFM and BIC) are smaller in magnitude or are no longer significant after controlling for school-level attendance rates, this may suggest the previous estimates for capacity constraints are attributable to changes in student attendance behaviors rather than changes in administrative burden borne on students.
Other robustness checks include replacing our school fixed effects with community school district (CSD) fixed effects to examine the relationships between capacity constraints and school meal participation across schools. 19 This allows us to compare school meal participation patterns across schools that vary in school food policies and capacity constraints (rather than changes in school food policies and capacity constraints over time within schools), similar to the cross-sectional approach in Prescott et al. (2022). If we find a particular capacity constraint “matters” in CSD fixed effects models but not our main models (with school fixed effects), then this would suggest that other, largely time-invariant characteristics of the school (such as location or personnel) matter more than that capacity constraint (overcrowded or co-located) itself. To test for the sensitivity of the binary indicator, overcrowded, we substitute a continuous measure of overcrowding using the ratio between school enrollment and its target capacity. Finally, we include the interaction between overcrowding and co-location to explore the potential twofold blow of multiple capacity constraints.
Results
School Food Policies Help, but Capacity Constraints Do Not
Consistent with previous research, we find evidence that UFM and BIC increase school meal participation. As shown in Table 2, exposure to UFM and BIC have positive and statistically significant effects on lunch and breakfast participation, respectively. Column 1 shows lunch participation increases by 9.0 pp in schools that adopt UFM, and column 2 shows breakfast participation increases by 7.3 pp in schools that adopt BIC and by 2.0 pp in schools that adopt UFM. The links between UFM/BIC and school meal participation are not mediated by schools’ co-location or overcrowding (columns 3 and 4); point estimates in these models are similar. Positive effects of UFM and BIC on breakfast participation are notable, because all NYC public school students had already been eligible for free breakfast throughout our sample period, suggesting that these relationships cannot operate through changes in prices but instead through alternative mechanisms like reduction in administrative burden. Estimated relationships with other time-varying school characteristics are as expected: school lunch and breakfast participation rates decrease with school enrollment, and the school lunch participation rate increases with the share of students who are FRPL-eligible. Additionally, we find negative relationships with the share of students who are white. 20
Regression Results for School Meal Participation, School Fixed Effects, AY 2010–2014.
Notes: Standard errors are clustered at the school level and shown in parentheses (*** p < 0.01, ** p < 0.05, * p < 0.1). All models include year fixed effects. Share of Hispanic students and elementary schools are reference groups.
Capacity constraint estimates (columns 3 and 4) provide novel evidence on the extent to which capacity constraints that increase administrative burden are associated with lower rates of participation. Changes in overcrowded status within schools is not associated (in either direction) with participation in school lunch or breakfast. Yet, co-located has statistically significant, negative relationships with school meal participation across models, suggesting changes in schools’ co-location status are associated with changes in school meal participation.
The coefficients for UFM and BIC are similar in magnitude among FRPL-eligible students as they are overall (columns 5–8 compared to 1–4, respectively). Perhaps surprisingly, the differences in the point estimates between FRPL-eligible students and overall students are not statistically meaningful at conventional levels (p < 0.1) based on a post-estimation F-test. Here, it is worth remembering that UFM changes the price paid by students who are not eligible for FRPL. Thus, insignificant differences in point estimates suggest inequitable administrative burdens, as ineligible students experience price effects while FRPL-eligible students do not. However, the negative relationships between co-location and school meal participation are larger in magnitude among FRPL-eligible students for both lunch (−8.2 vs. −9.8 pp) and breakfast (−4.8 vs. −6.2 pp). Differences are statistically significant based on the post-estimation F-tests. Taken together, student take-up of school lunch and breakfast is lower when schools are co-located (but not during periods when they are overcrowded) and more so among FRPL-eligible students.
Evidence of Capacity Constraints Limiting the Effectiveness of School Food Policies
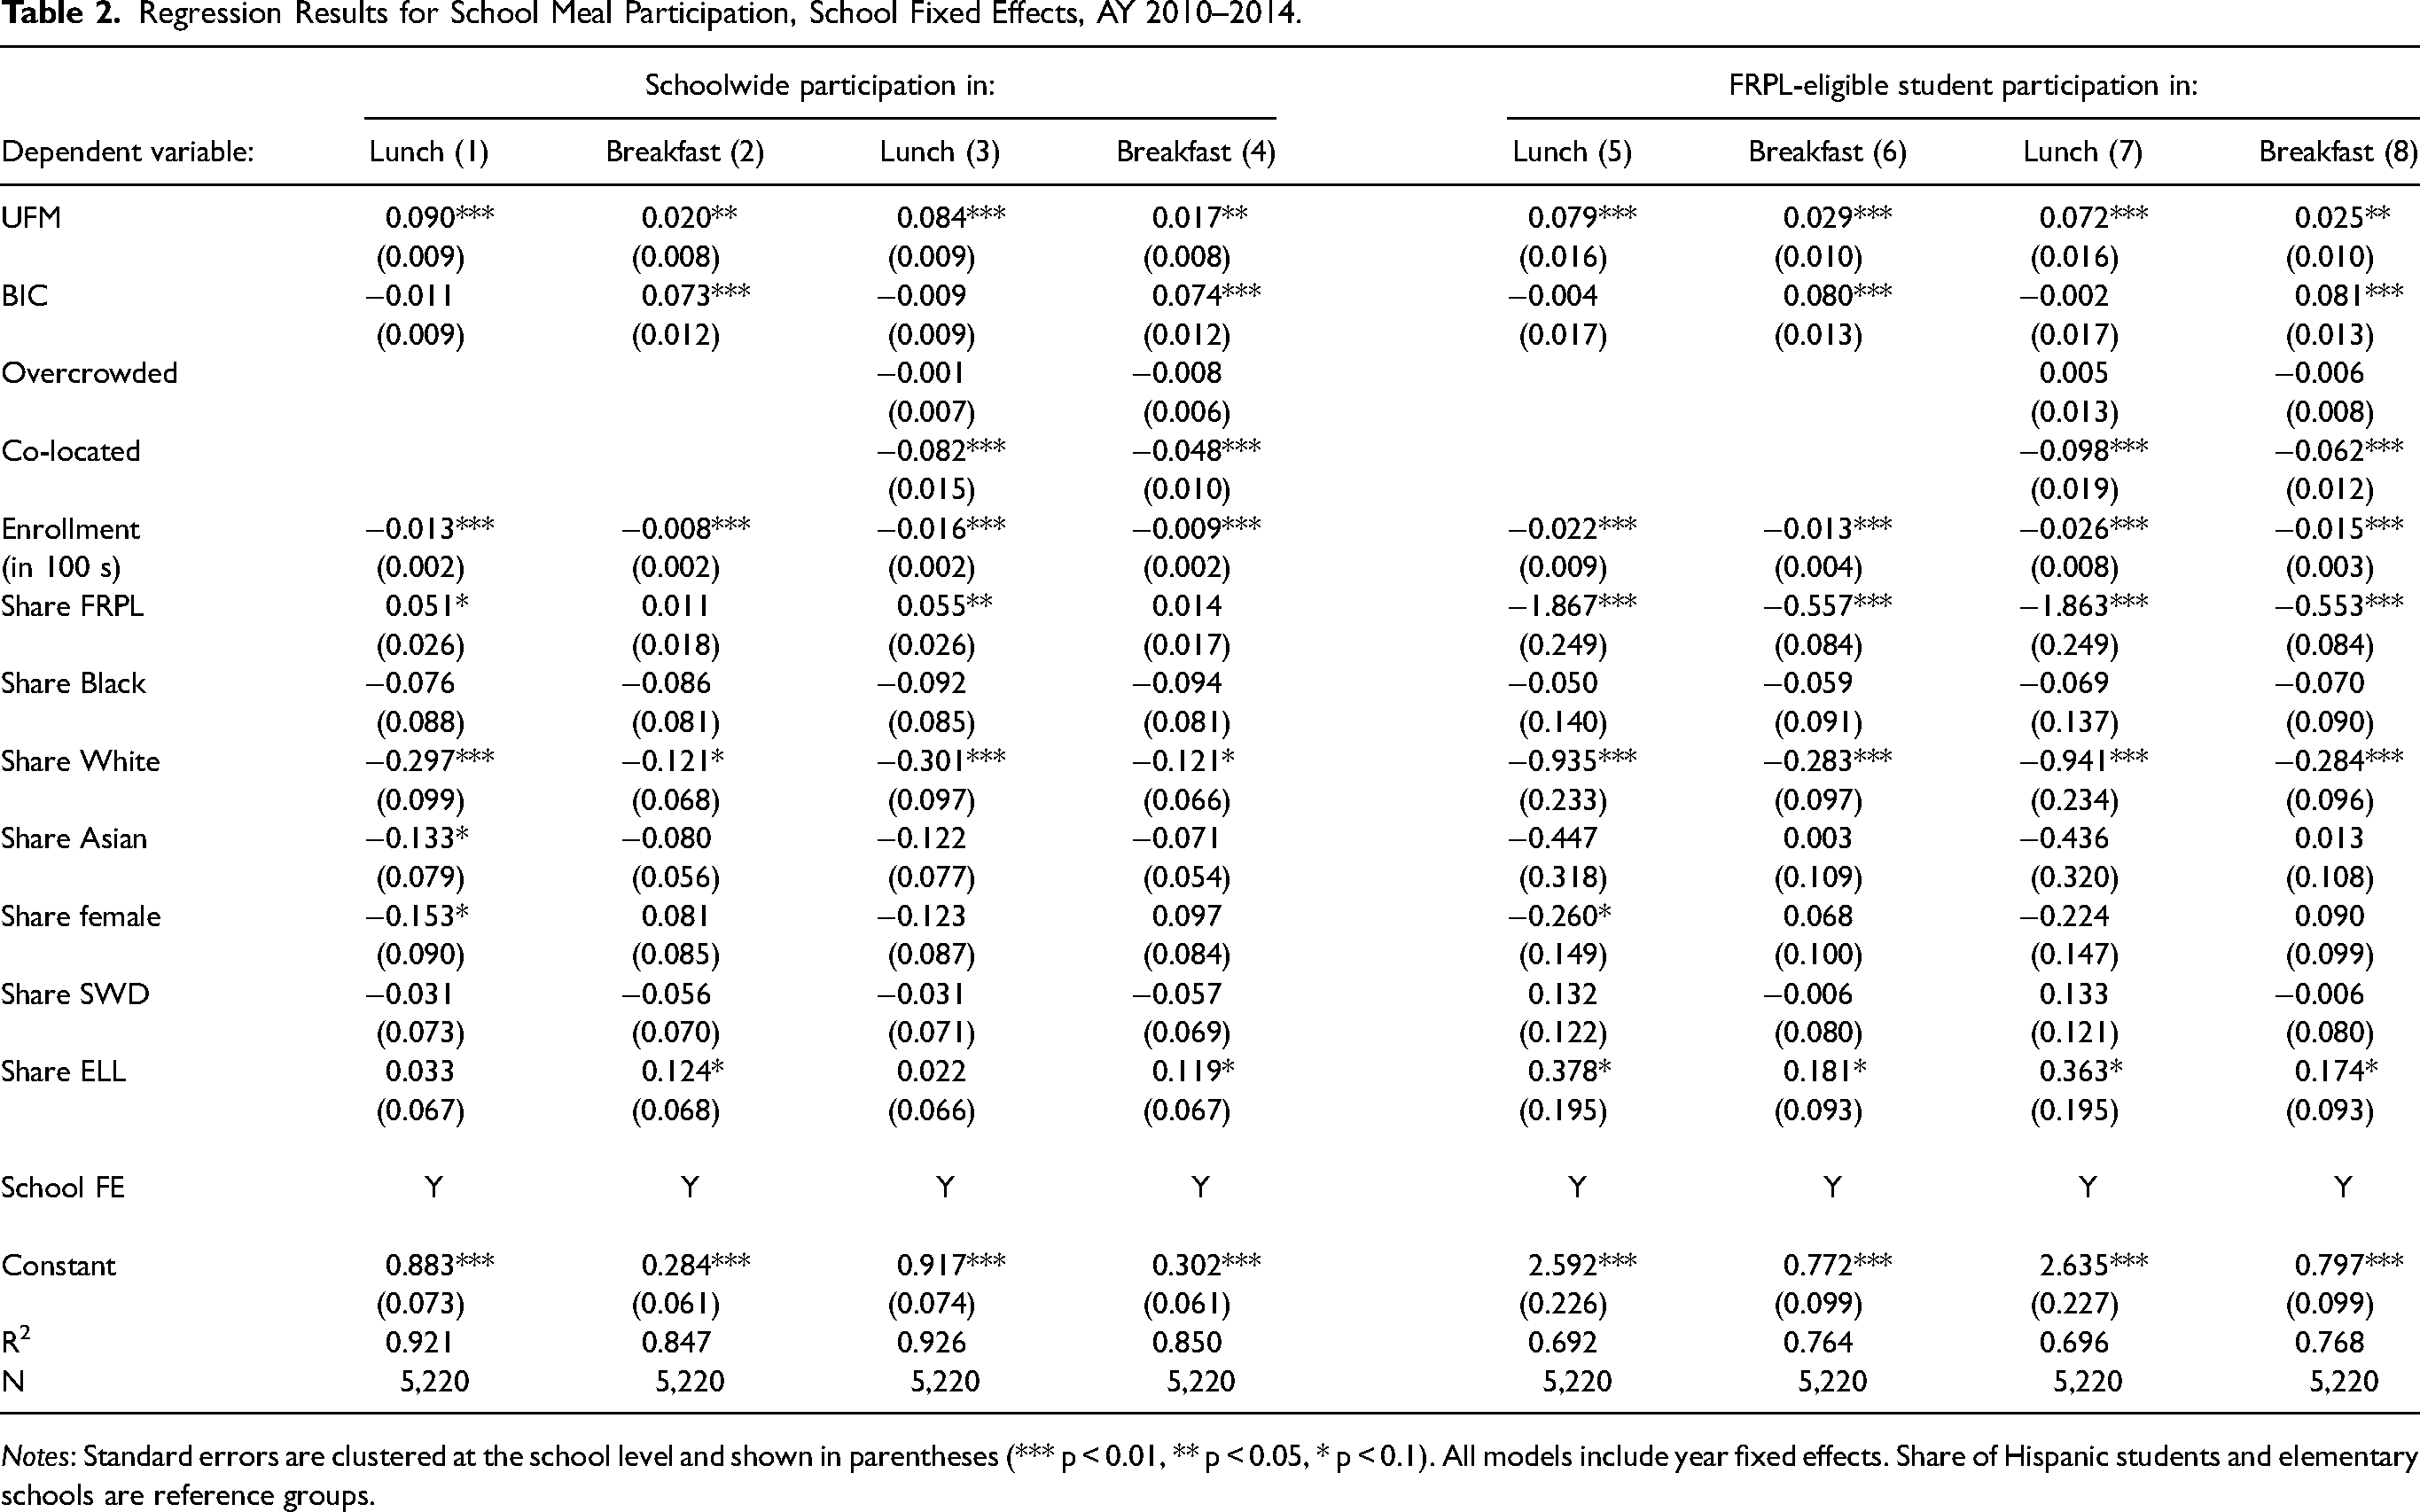
Results from models that include interactions between school food policies and capacity constraints, shown in Table 3, suggest that UFM is less effective at increasing school lunch participation in co-located schools than in stand-alone settings. The coefficient on the interaction term (−0.043) in column 1 suggests UFM in a co-located school increases lunch participation 4.3 percentage points less than UFM in a stand-alone school (about 43% smaller on a base of 0.101). Differences in the effectiveness of UFM are still more pronounced among students individually eligible for FRPL. Table 3 column 3 shows that the relationship between UFM and FRPL-eligible students’ lunch participation rates is 6.2 percentage points lower in co-located schools than in stand-alone schools (about 68% smaller on a base of 0.091). Yet, co-located schools with UFM still have higher participation rates than those without; UFM has a small but positive relationship with lunch participation in co-located schools, with an even smaller (but still positive) relationship among their poorer students.
Interaction Term Results for School Meal Participation, School Fixed Effects, AY 2010–2014.
Notes: Standard errors are clustered at the school level and shown in parentheses (*** p < 0.01, ** p < 0.05, * p < 0.1). All models include year fixed effects and controls for school-level characteristics, including enrollment, student composition (the share of FRPL students, Black, White, Asian, female, and SWD), and grade span.
Conversely, co-location does not moderate the positive relationship between BIC and breakfast participation. The interaction terms for BIC and co-location are insignificant in columns 2 and 4 of Table 3. Likewise, coefficients for BIC are largely unchanged from those in Table 2. Results suggest that BIC helps address administrative burden in breakfast participation, even among those who attend schools in shared buildings. In part, this may be because BIC decentralizes service locations away from shared spaces, which is a clear distinction from UFM.
Similarly, overcrowding does not moderate the relationships between UFM or BIC and school meal participation. That is, UFM and BIC increase school meal participation without evidence of diminishing benefits in overcrowded settings. This is true overall and among low-income students in these schools. In sum, results from our models with interaction terms provide evidence that BIC and UFM increase breakfast and lunch participation, respectively, even in the presence of physical capacity constraints, but the estimates for UFM are smaller in co-located settings, especially for low-income students.
Potential Mechanisms: School Meal Start Times
One potential explanation of our results is the administrative discretion that goes into negotiating lunch times—in line with our expectations discussed in the previous section. UFM may accelerate lunch service and reduce stigma even in overcrowded schools, which could explain why it is equally effective in overcrowded and at-capacity settings. However, UFM may do little to address competition between co-located schools over the use of the cafeteria, unlike BIC, which may alleviate potential problems that arise from sharing cafeterias.
To shed light on this one potential mechanism, we examine the time of day that schools begin serving breakfast and lunch, differentiating between overcrowded (vs. at-capacity) and co-located (vs. stand-alone) schools. Spreading out meal start times is one example of administrative discretion, and examining differences in the distribution of meal start times for schools with capacity constraints may give some indication of why differential patterns in administrative burden emerge among overcrowded and co-located schools. Note that this evidence is only suggestive, in part because we only observe lunch and breakfast start times for one year in our sample, AY 2014. However, we believe this analysis provides important contextual information on one way in which administrative burden plays out in the cafeteria.
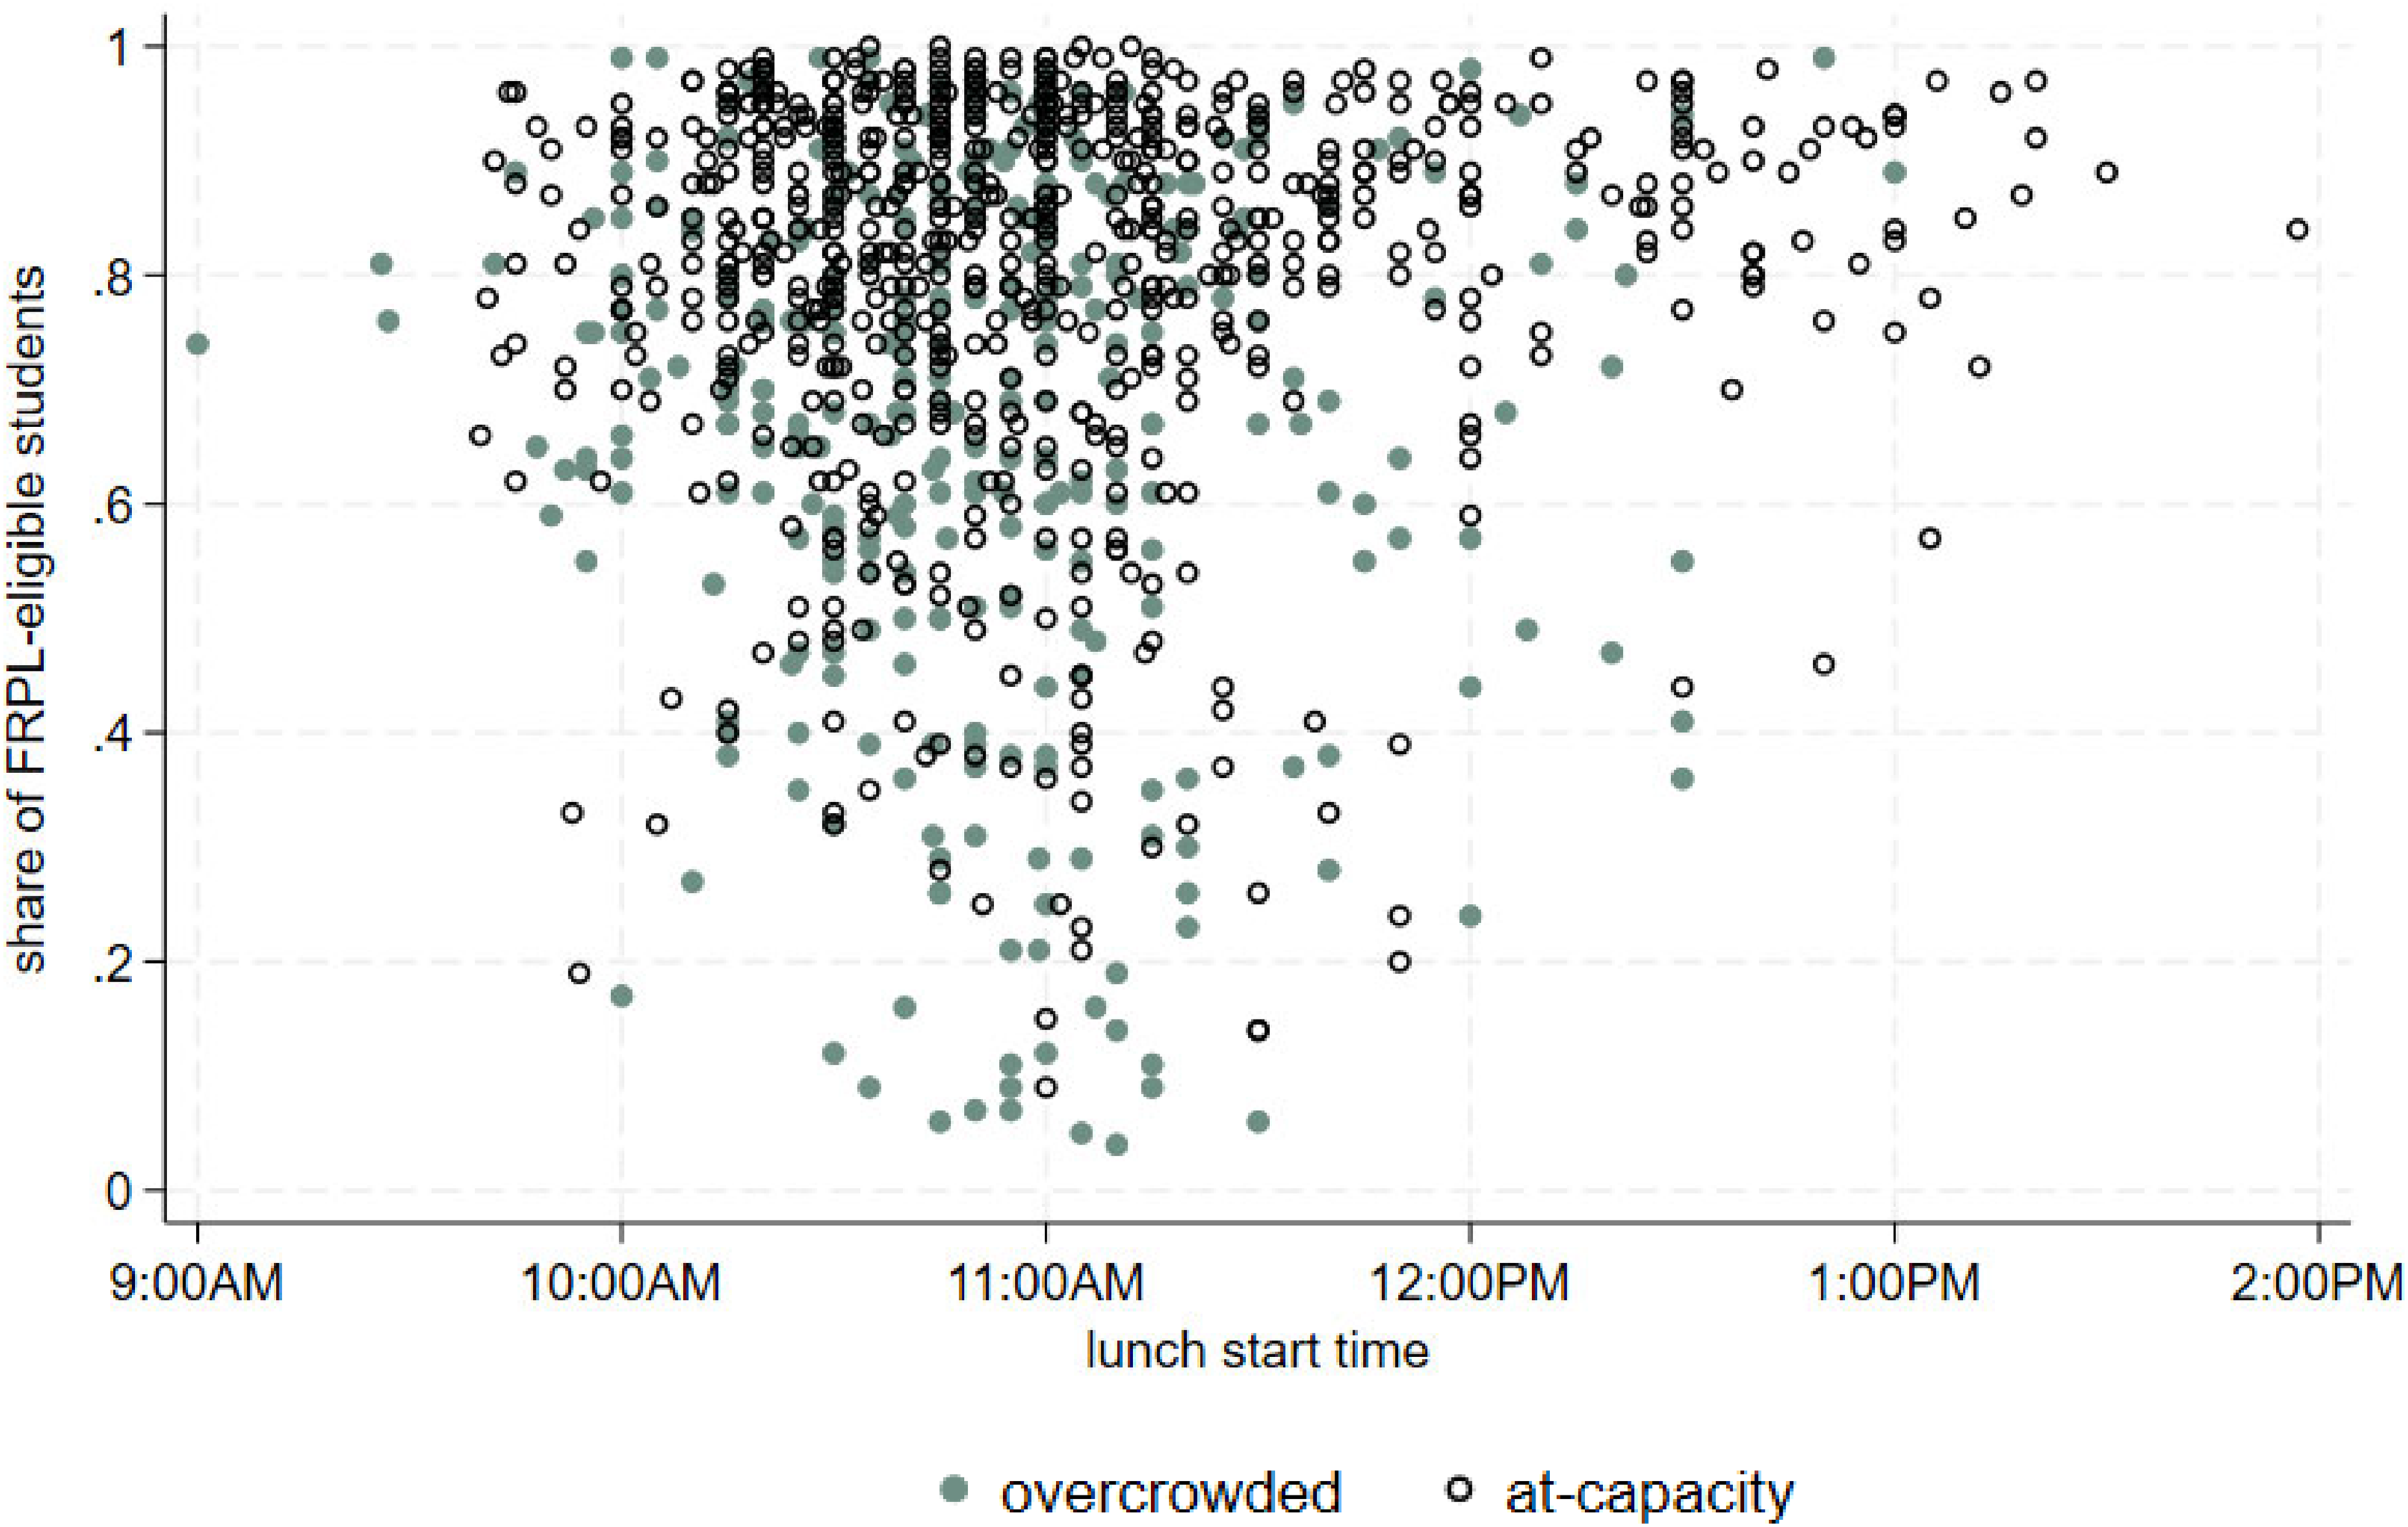
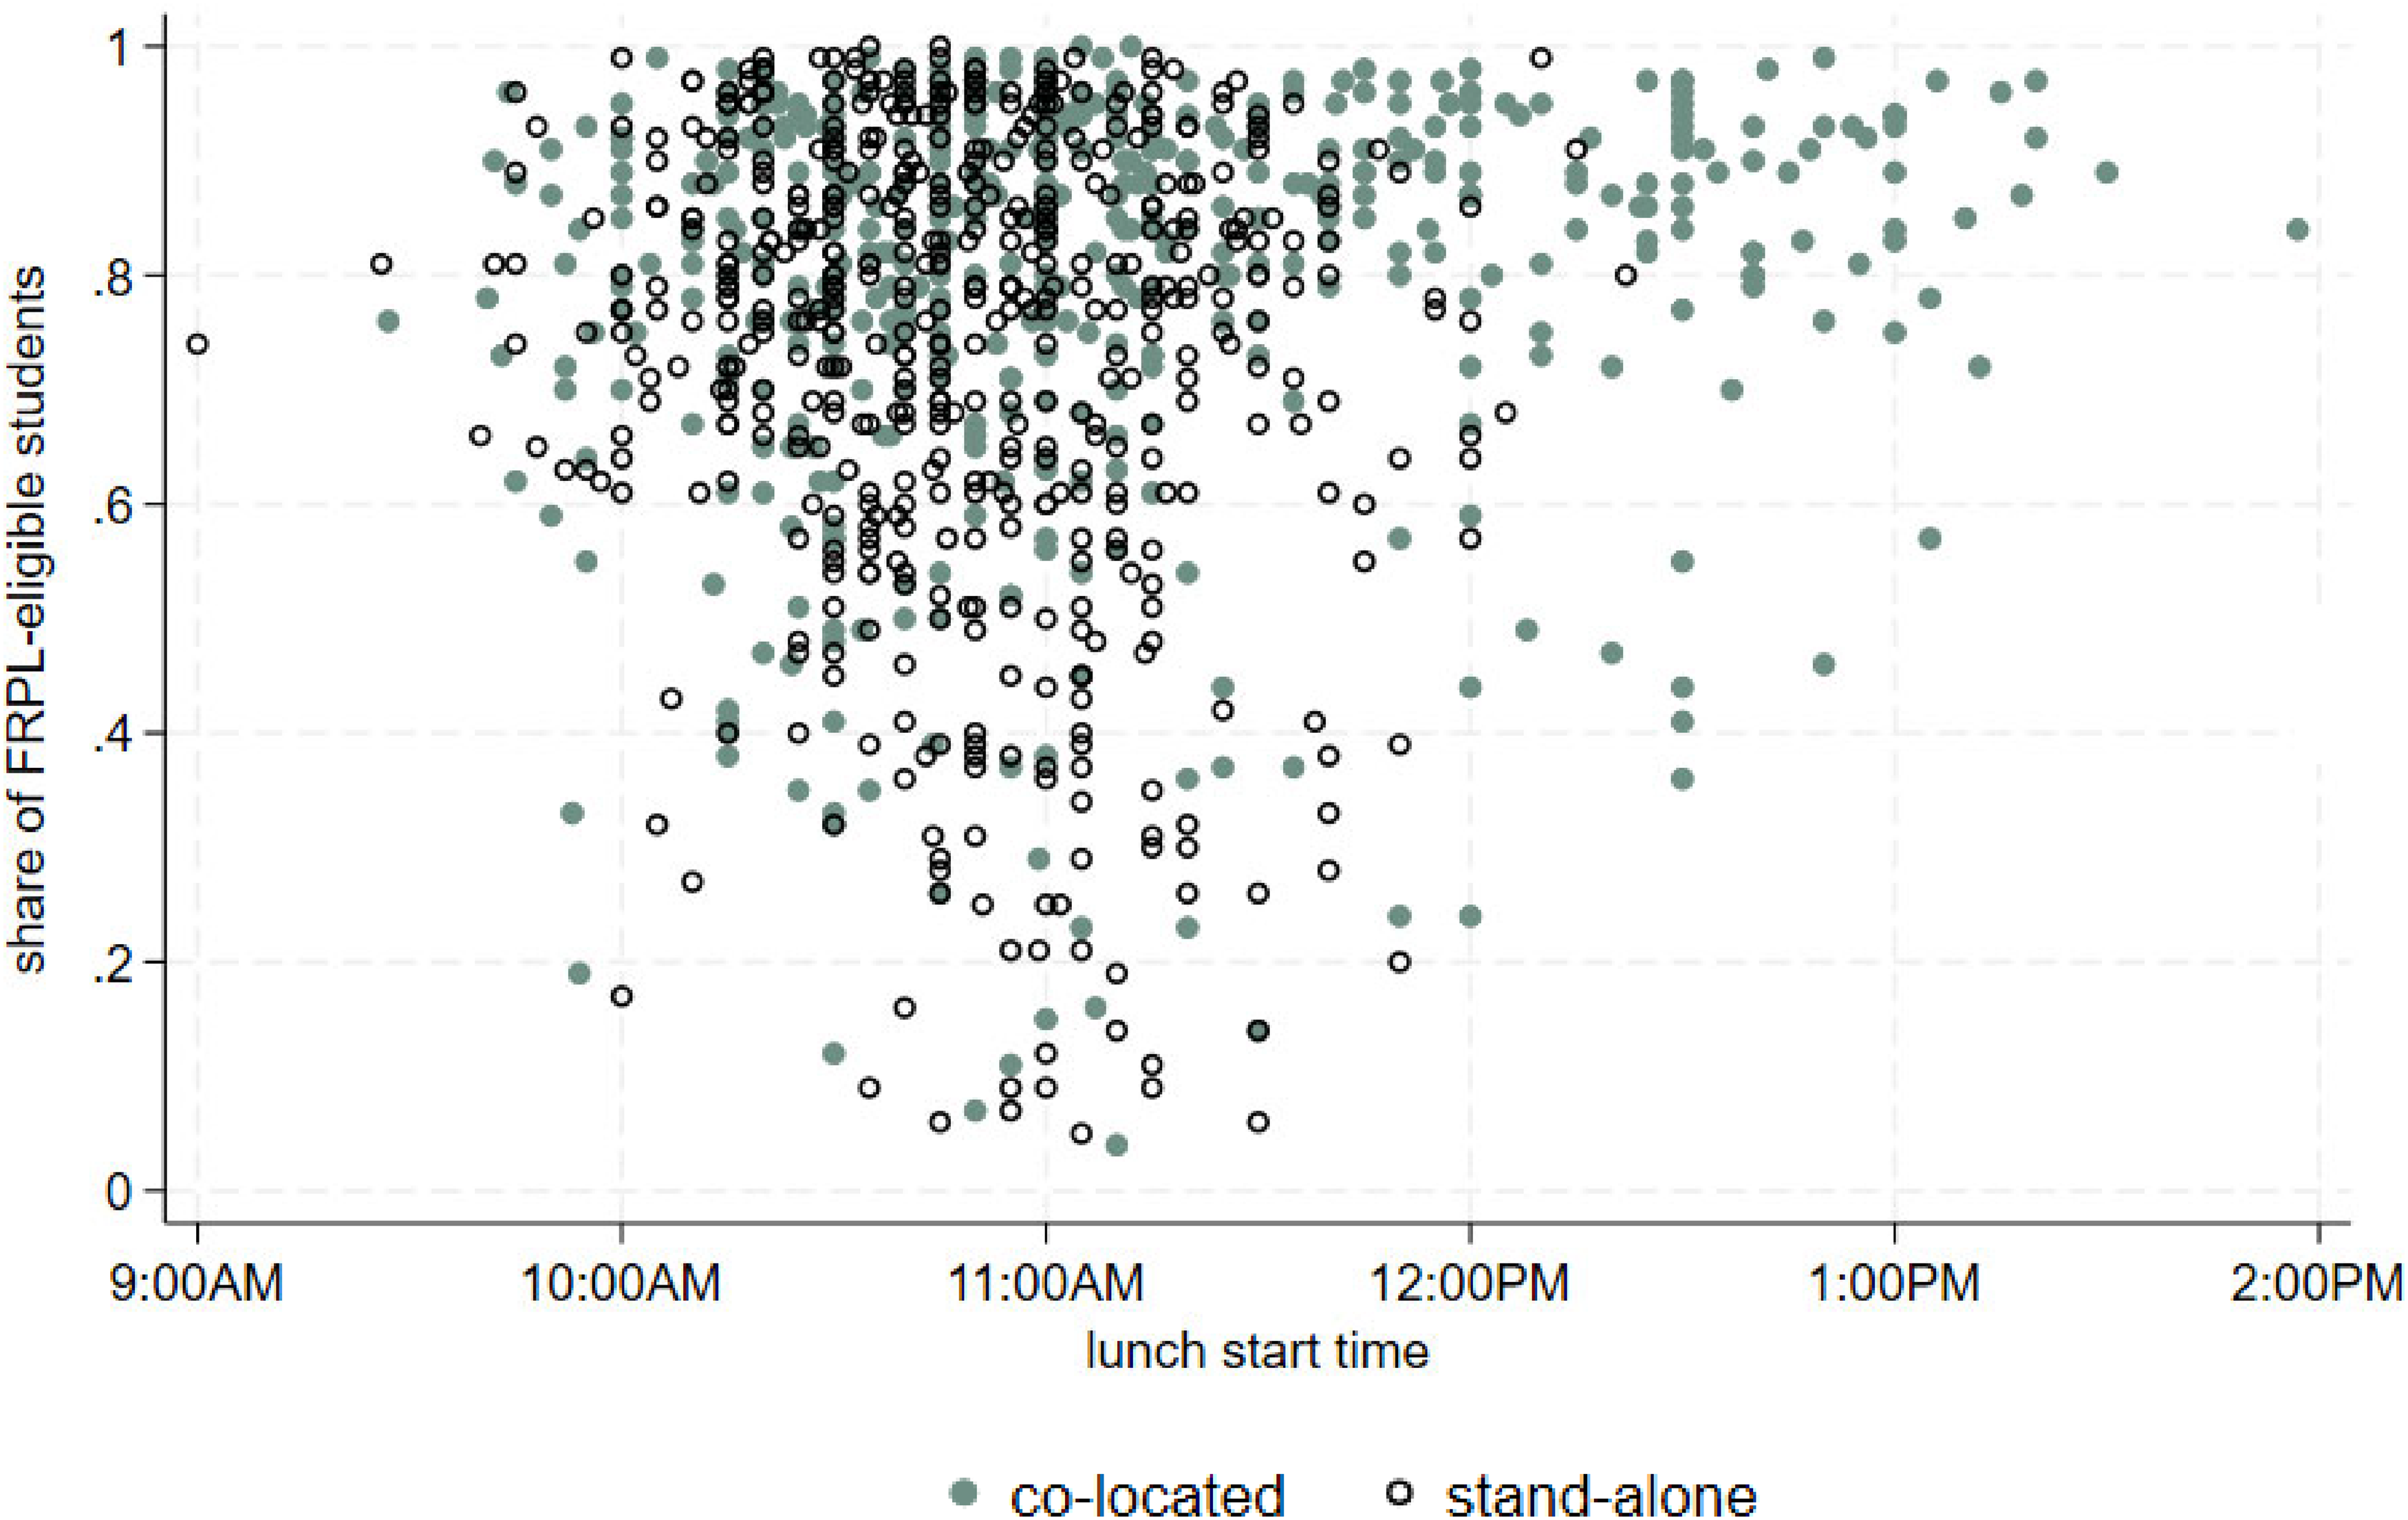
Figure 1 (to a lesser extent, Figure 2) shows overcrowded schools have similar distributions of lunch (breakfast) start times as at-capacity schools. Students in overcrowded schools do not seem to bear additional administrative burden of accessing school meals at more unusual hours than at-capacity schools. Co-located schools, however, provide greater dispersion of lunch (to a lesser extent, breakfast) start times than stand-alone schools, as shown in Figure 3 (Figure 4). A higher share of co-located schools starts lunch in the afternoon compared to stand-alone schools (first lunch hours typically start before noon). Later-than-typical lunch hours may relate to decreased participation in school meals, as students may opt for other “competitive food,” such as snacks from vending machines and meals purchased outside the school campus prior to their scheduled lunch times (Graziose et al., 2019; Probart et al., 2006).
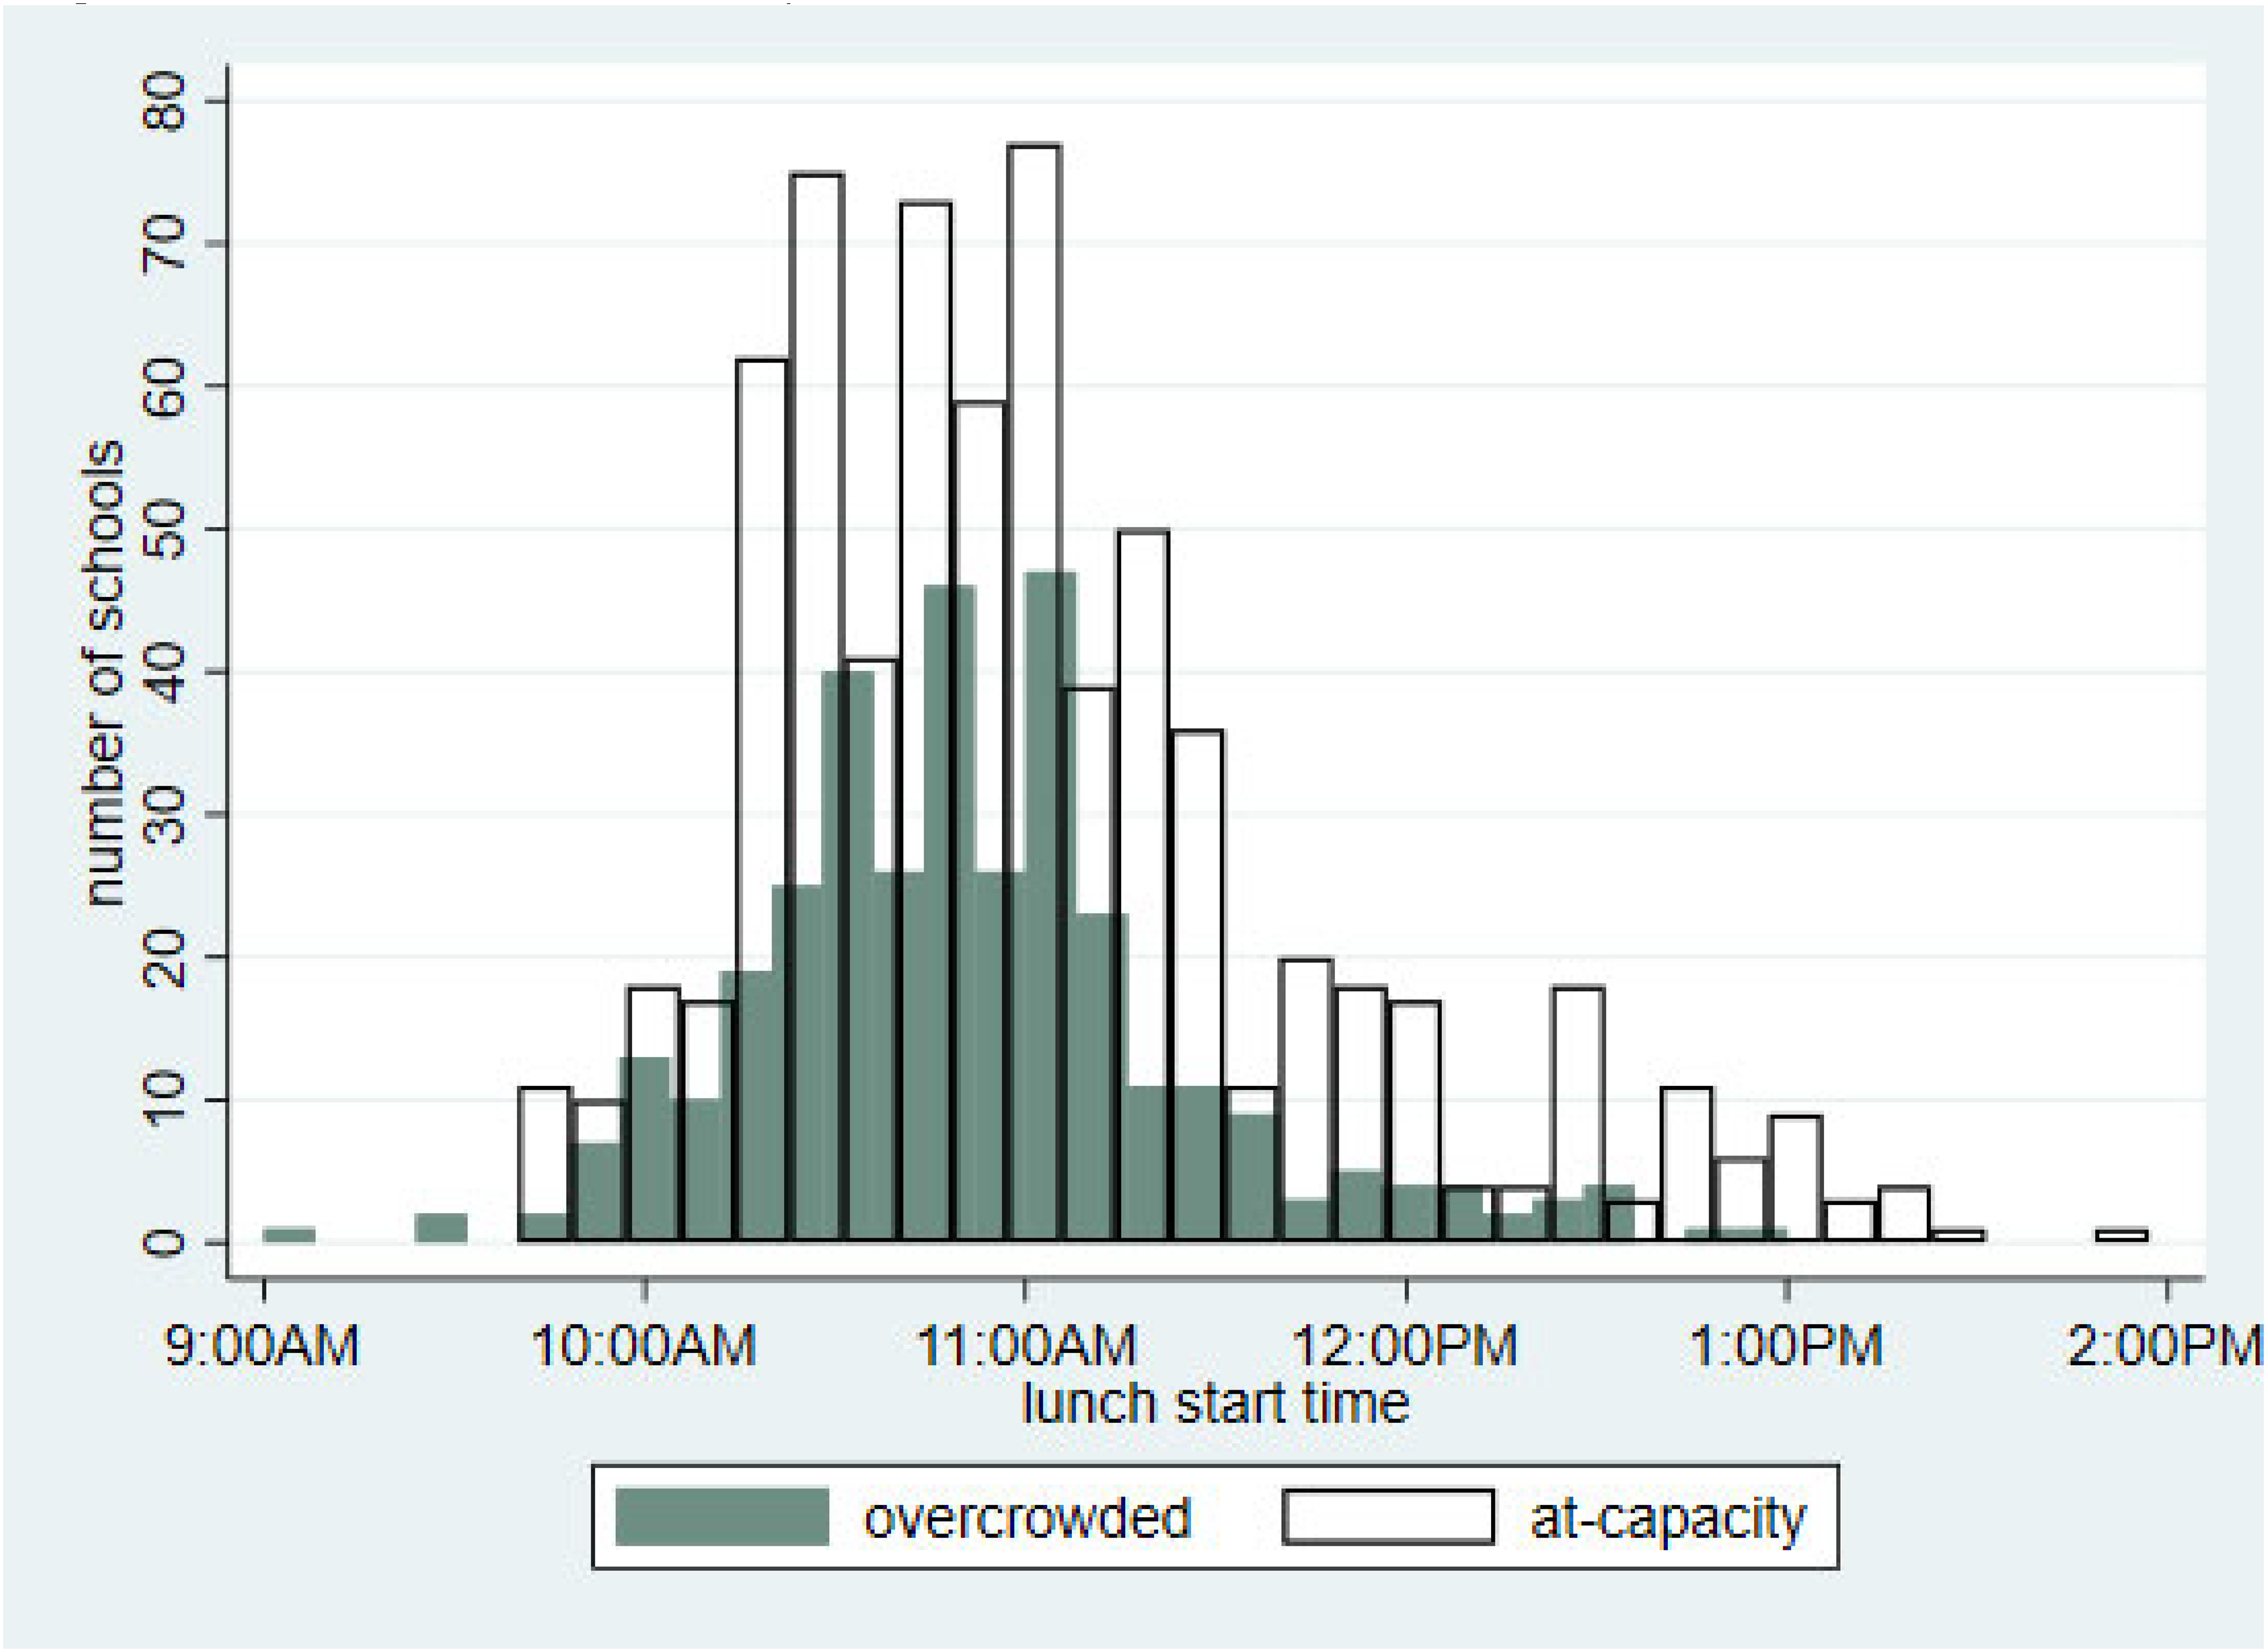
Lunch start time by overcrowded status, AY 2014.
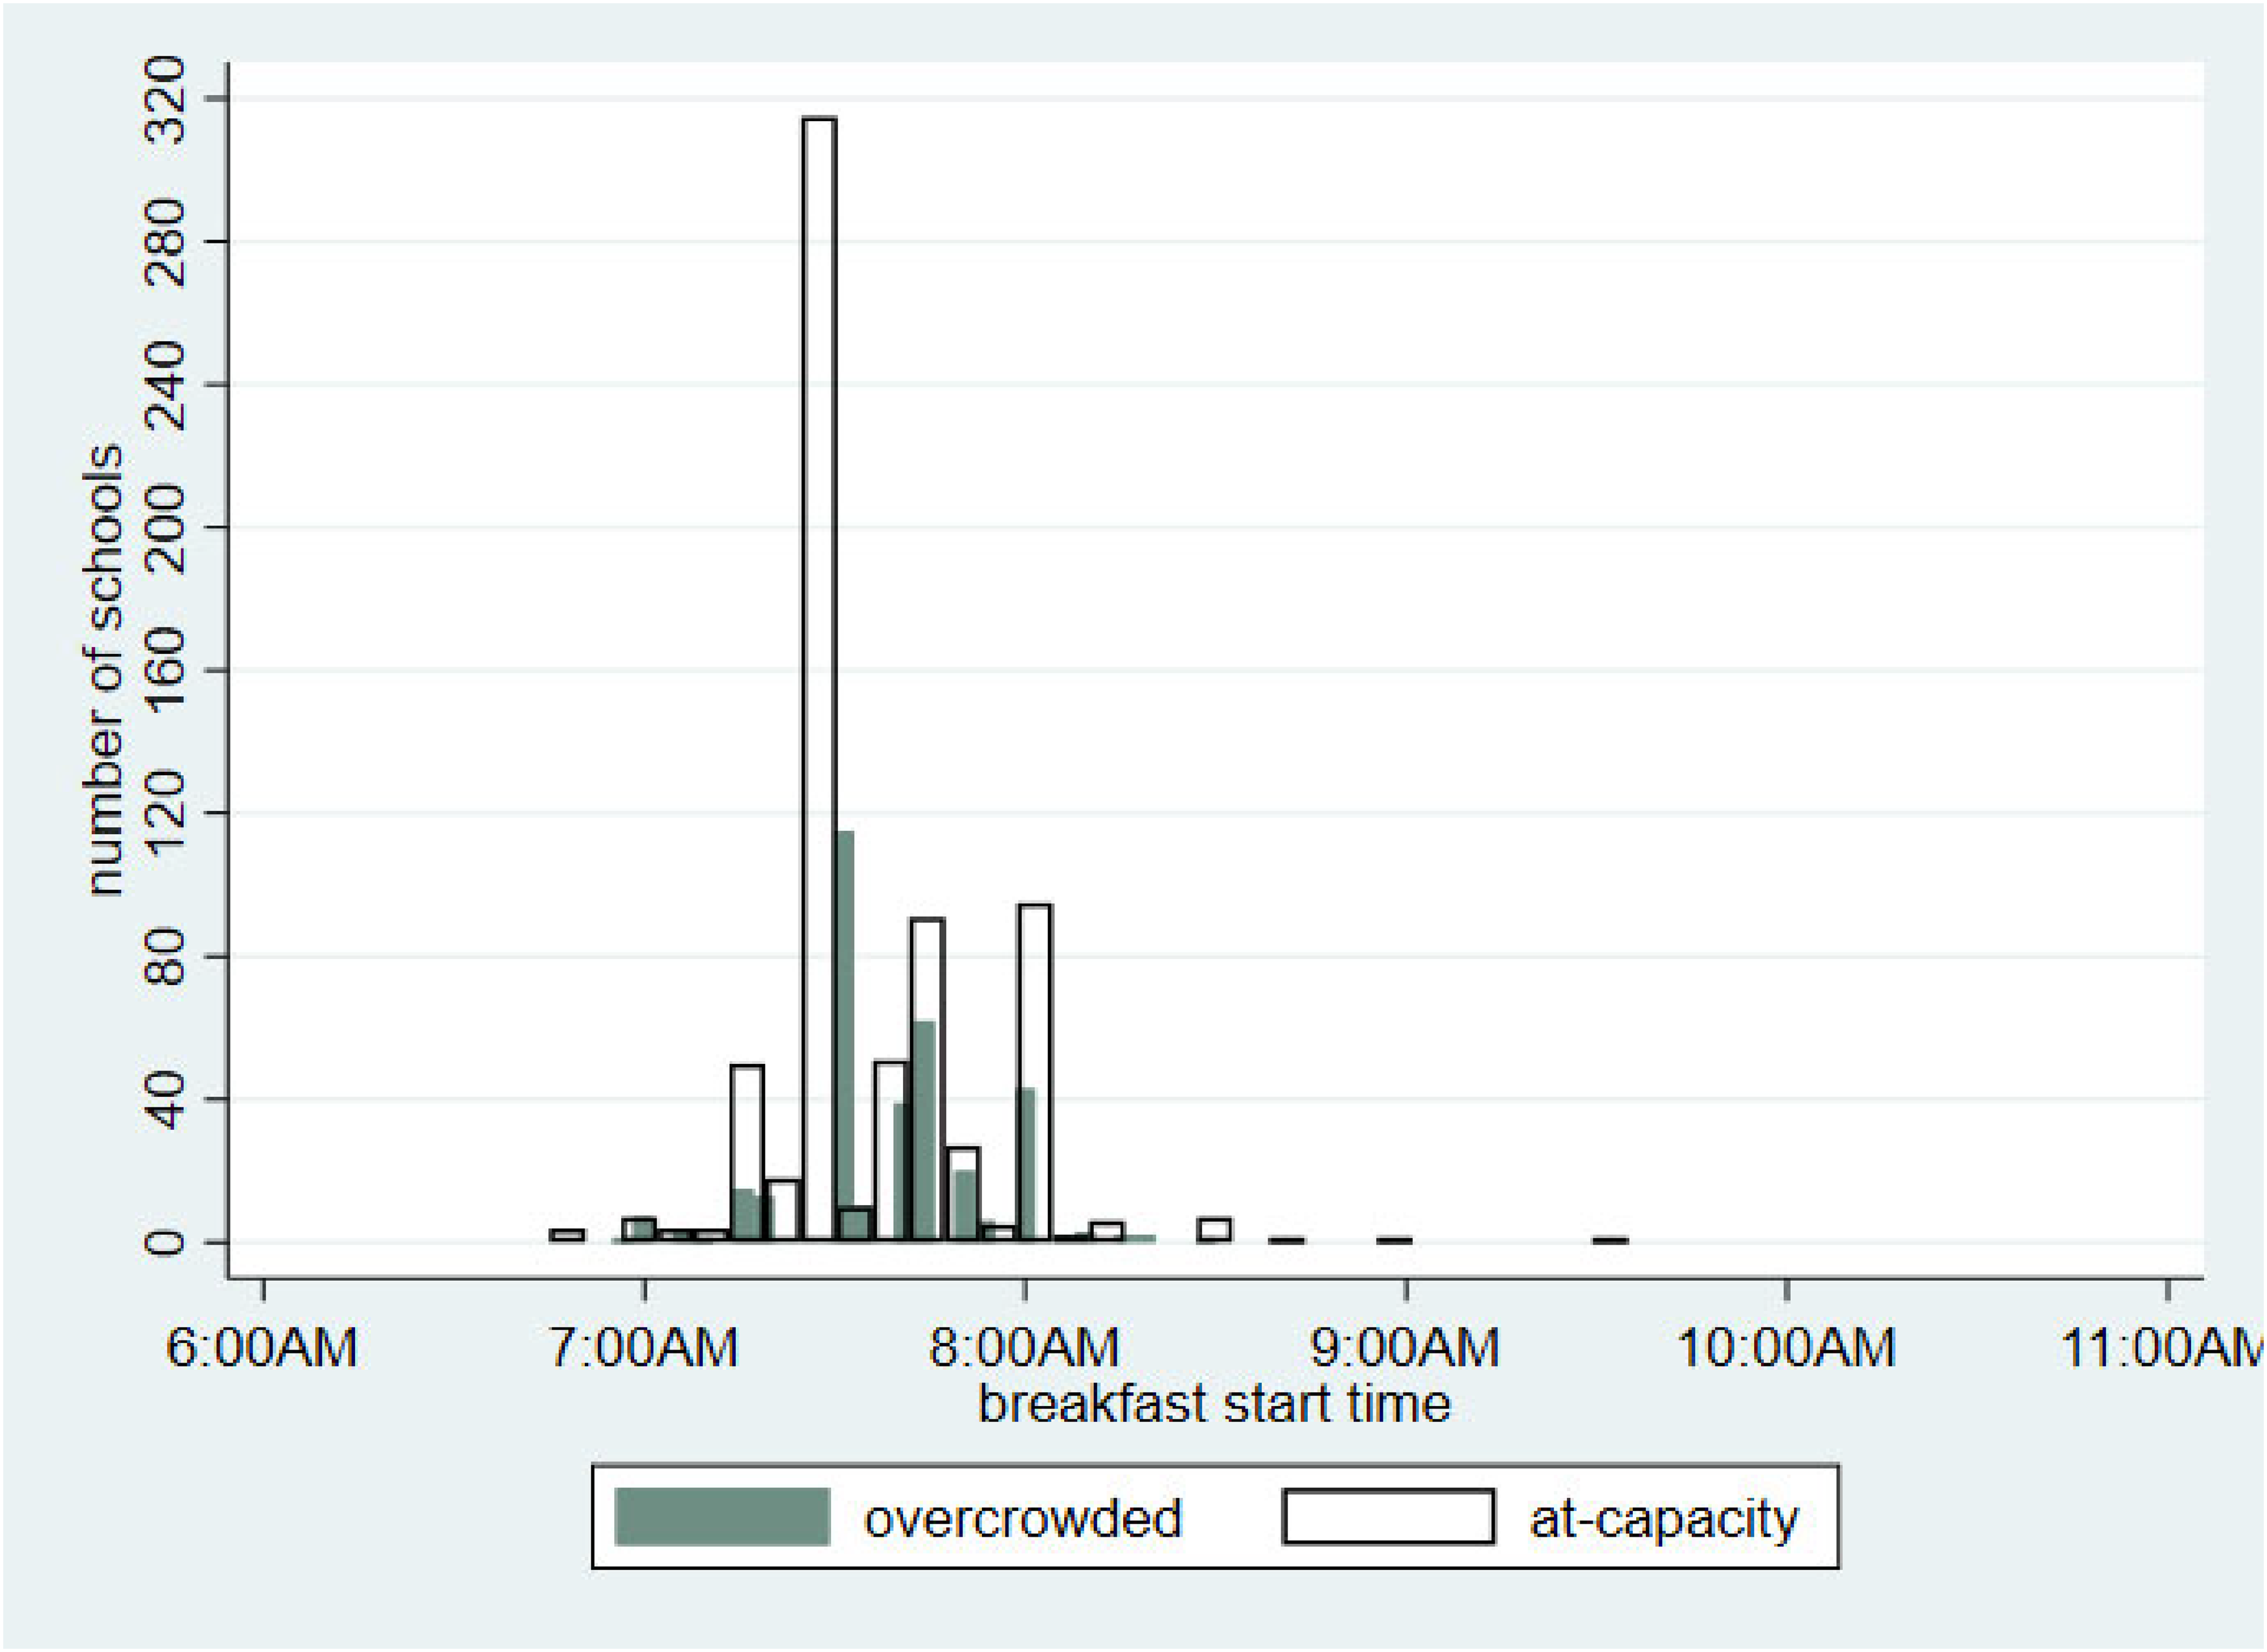
Breakfast start time by overcrowded status, AY 2014.
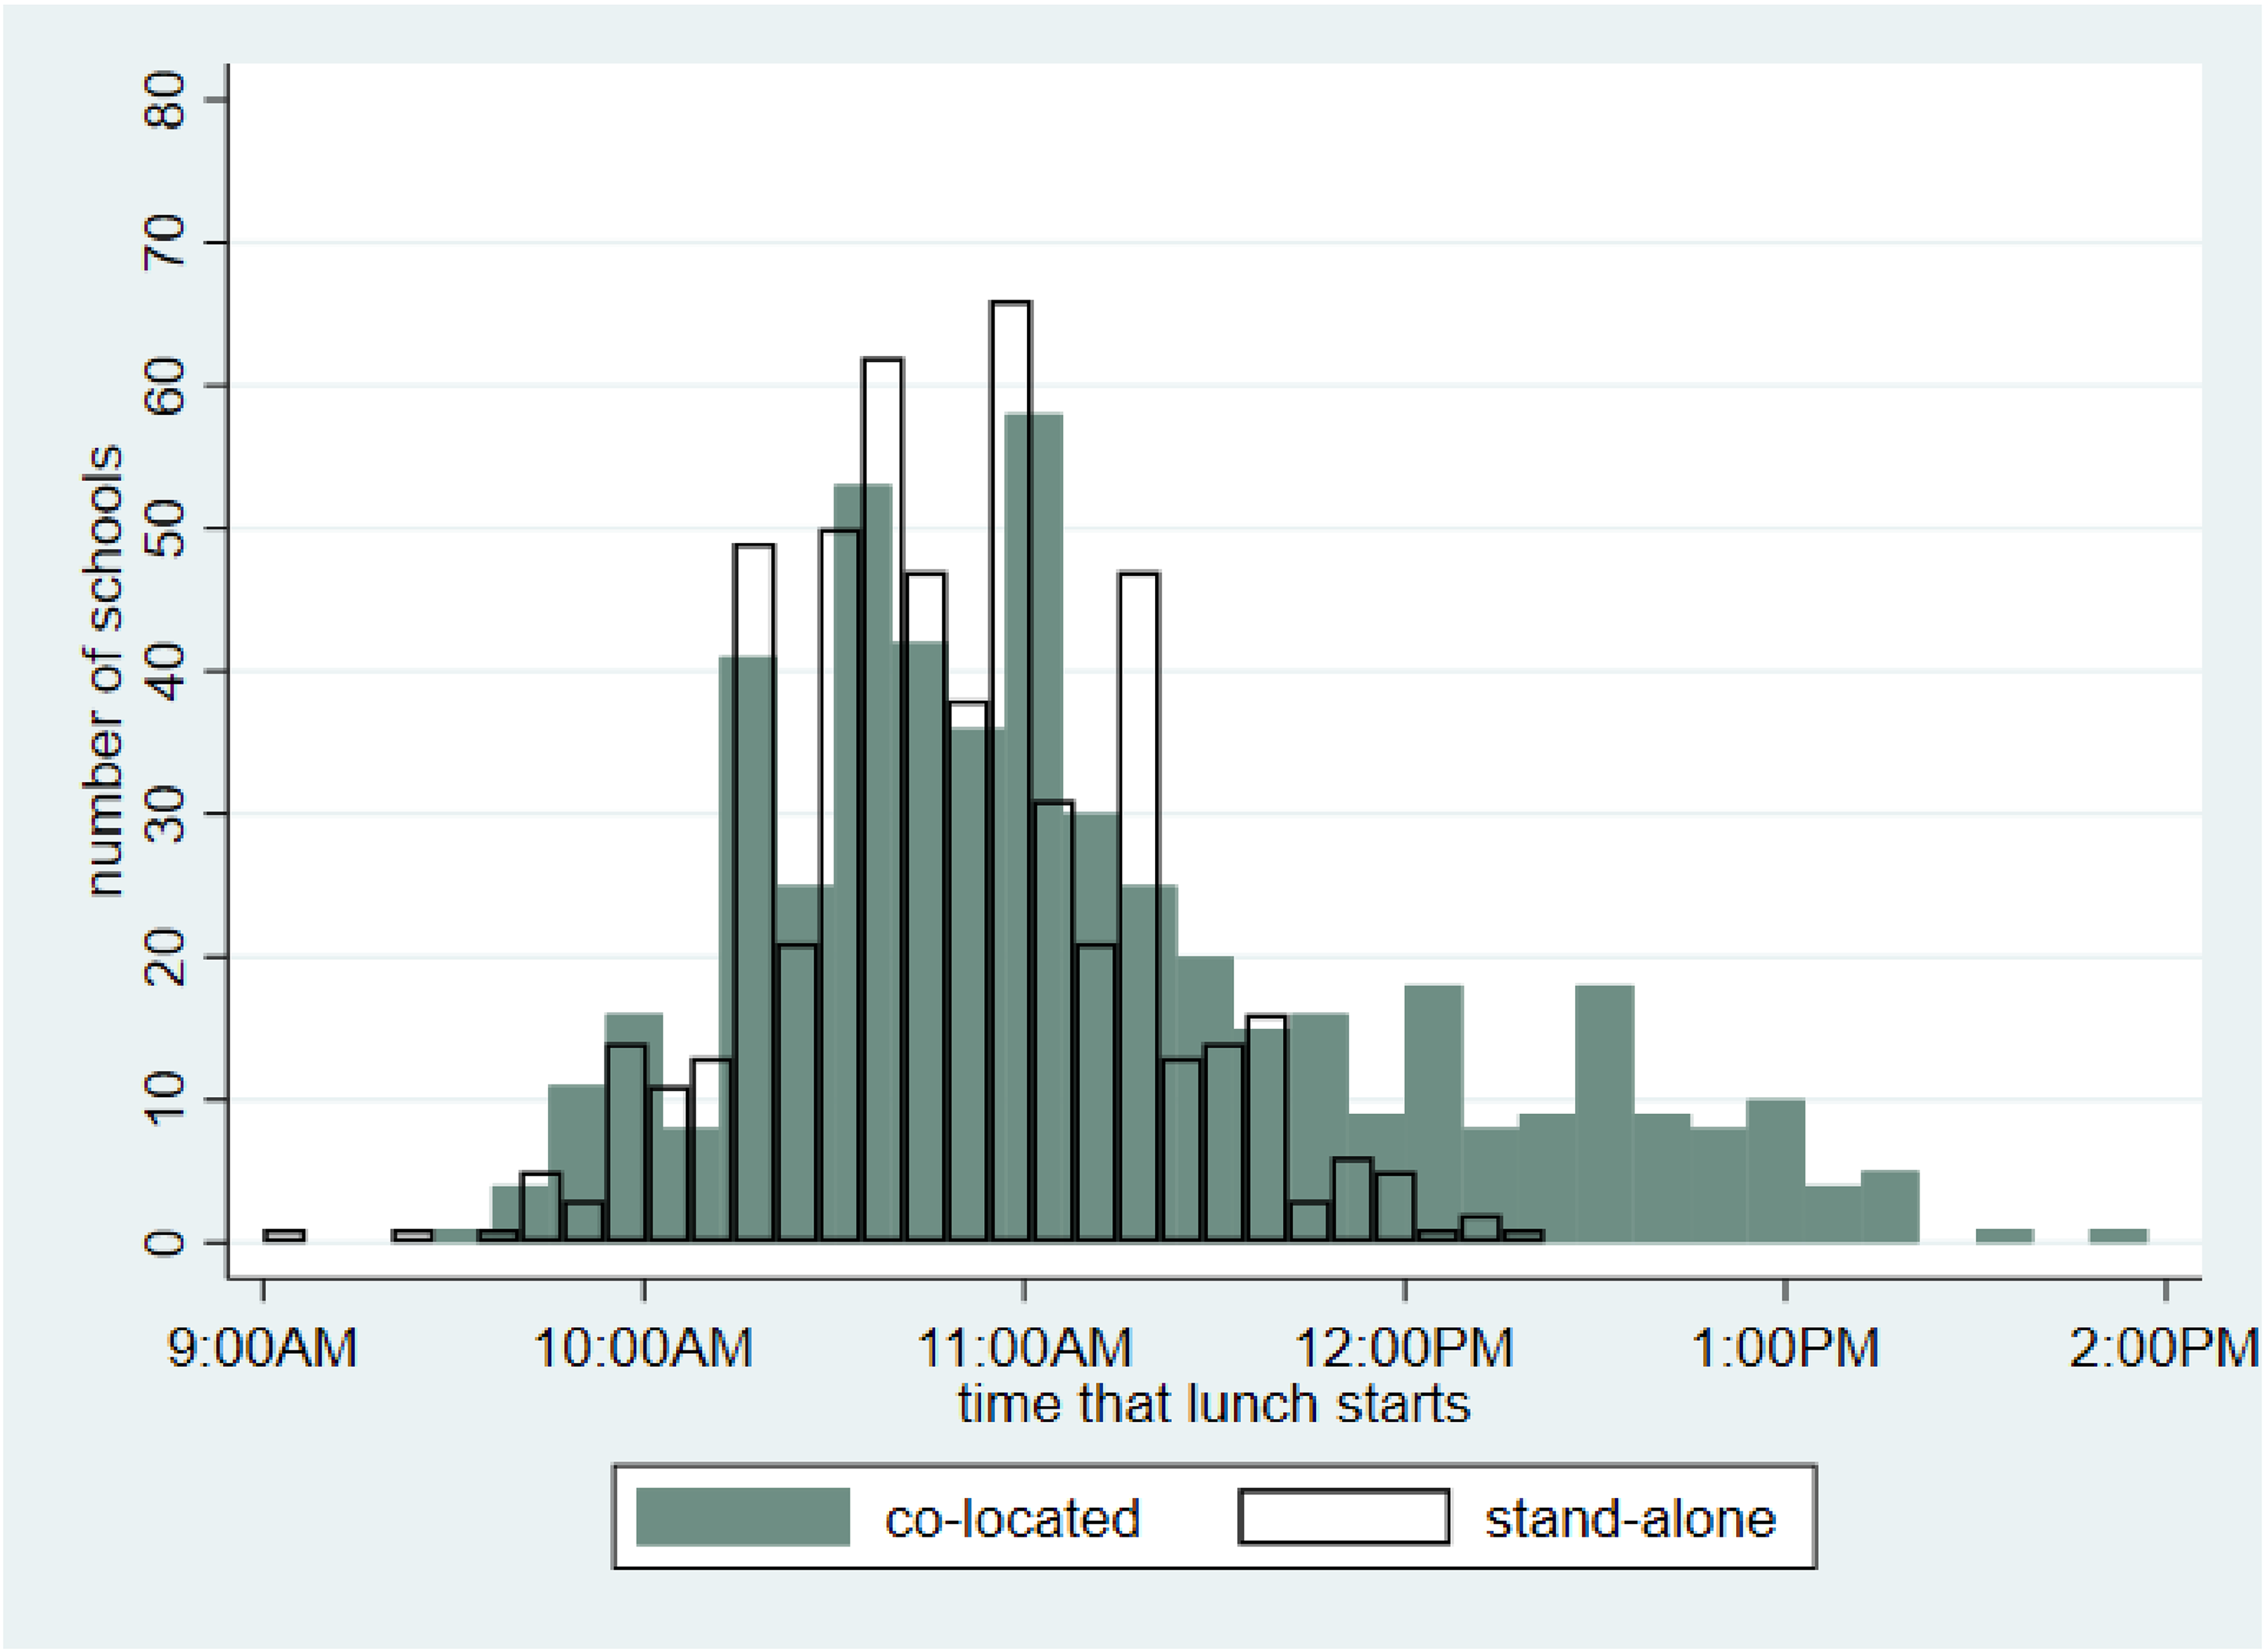
Lunch start time by co-located status, AY 2014.
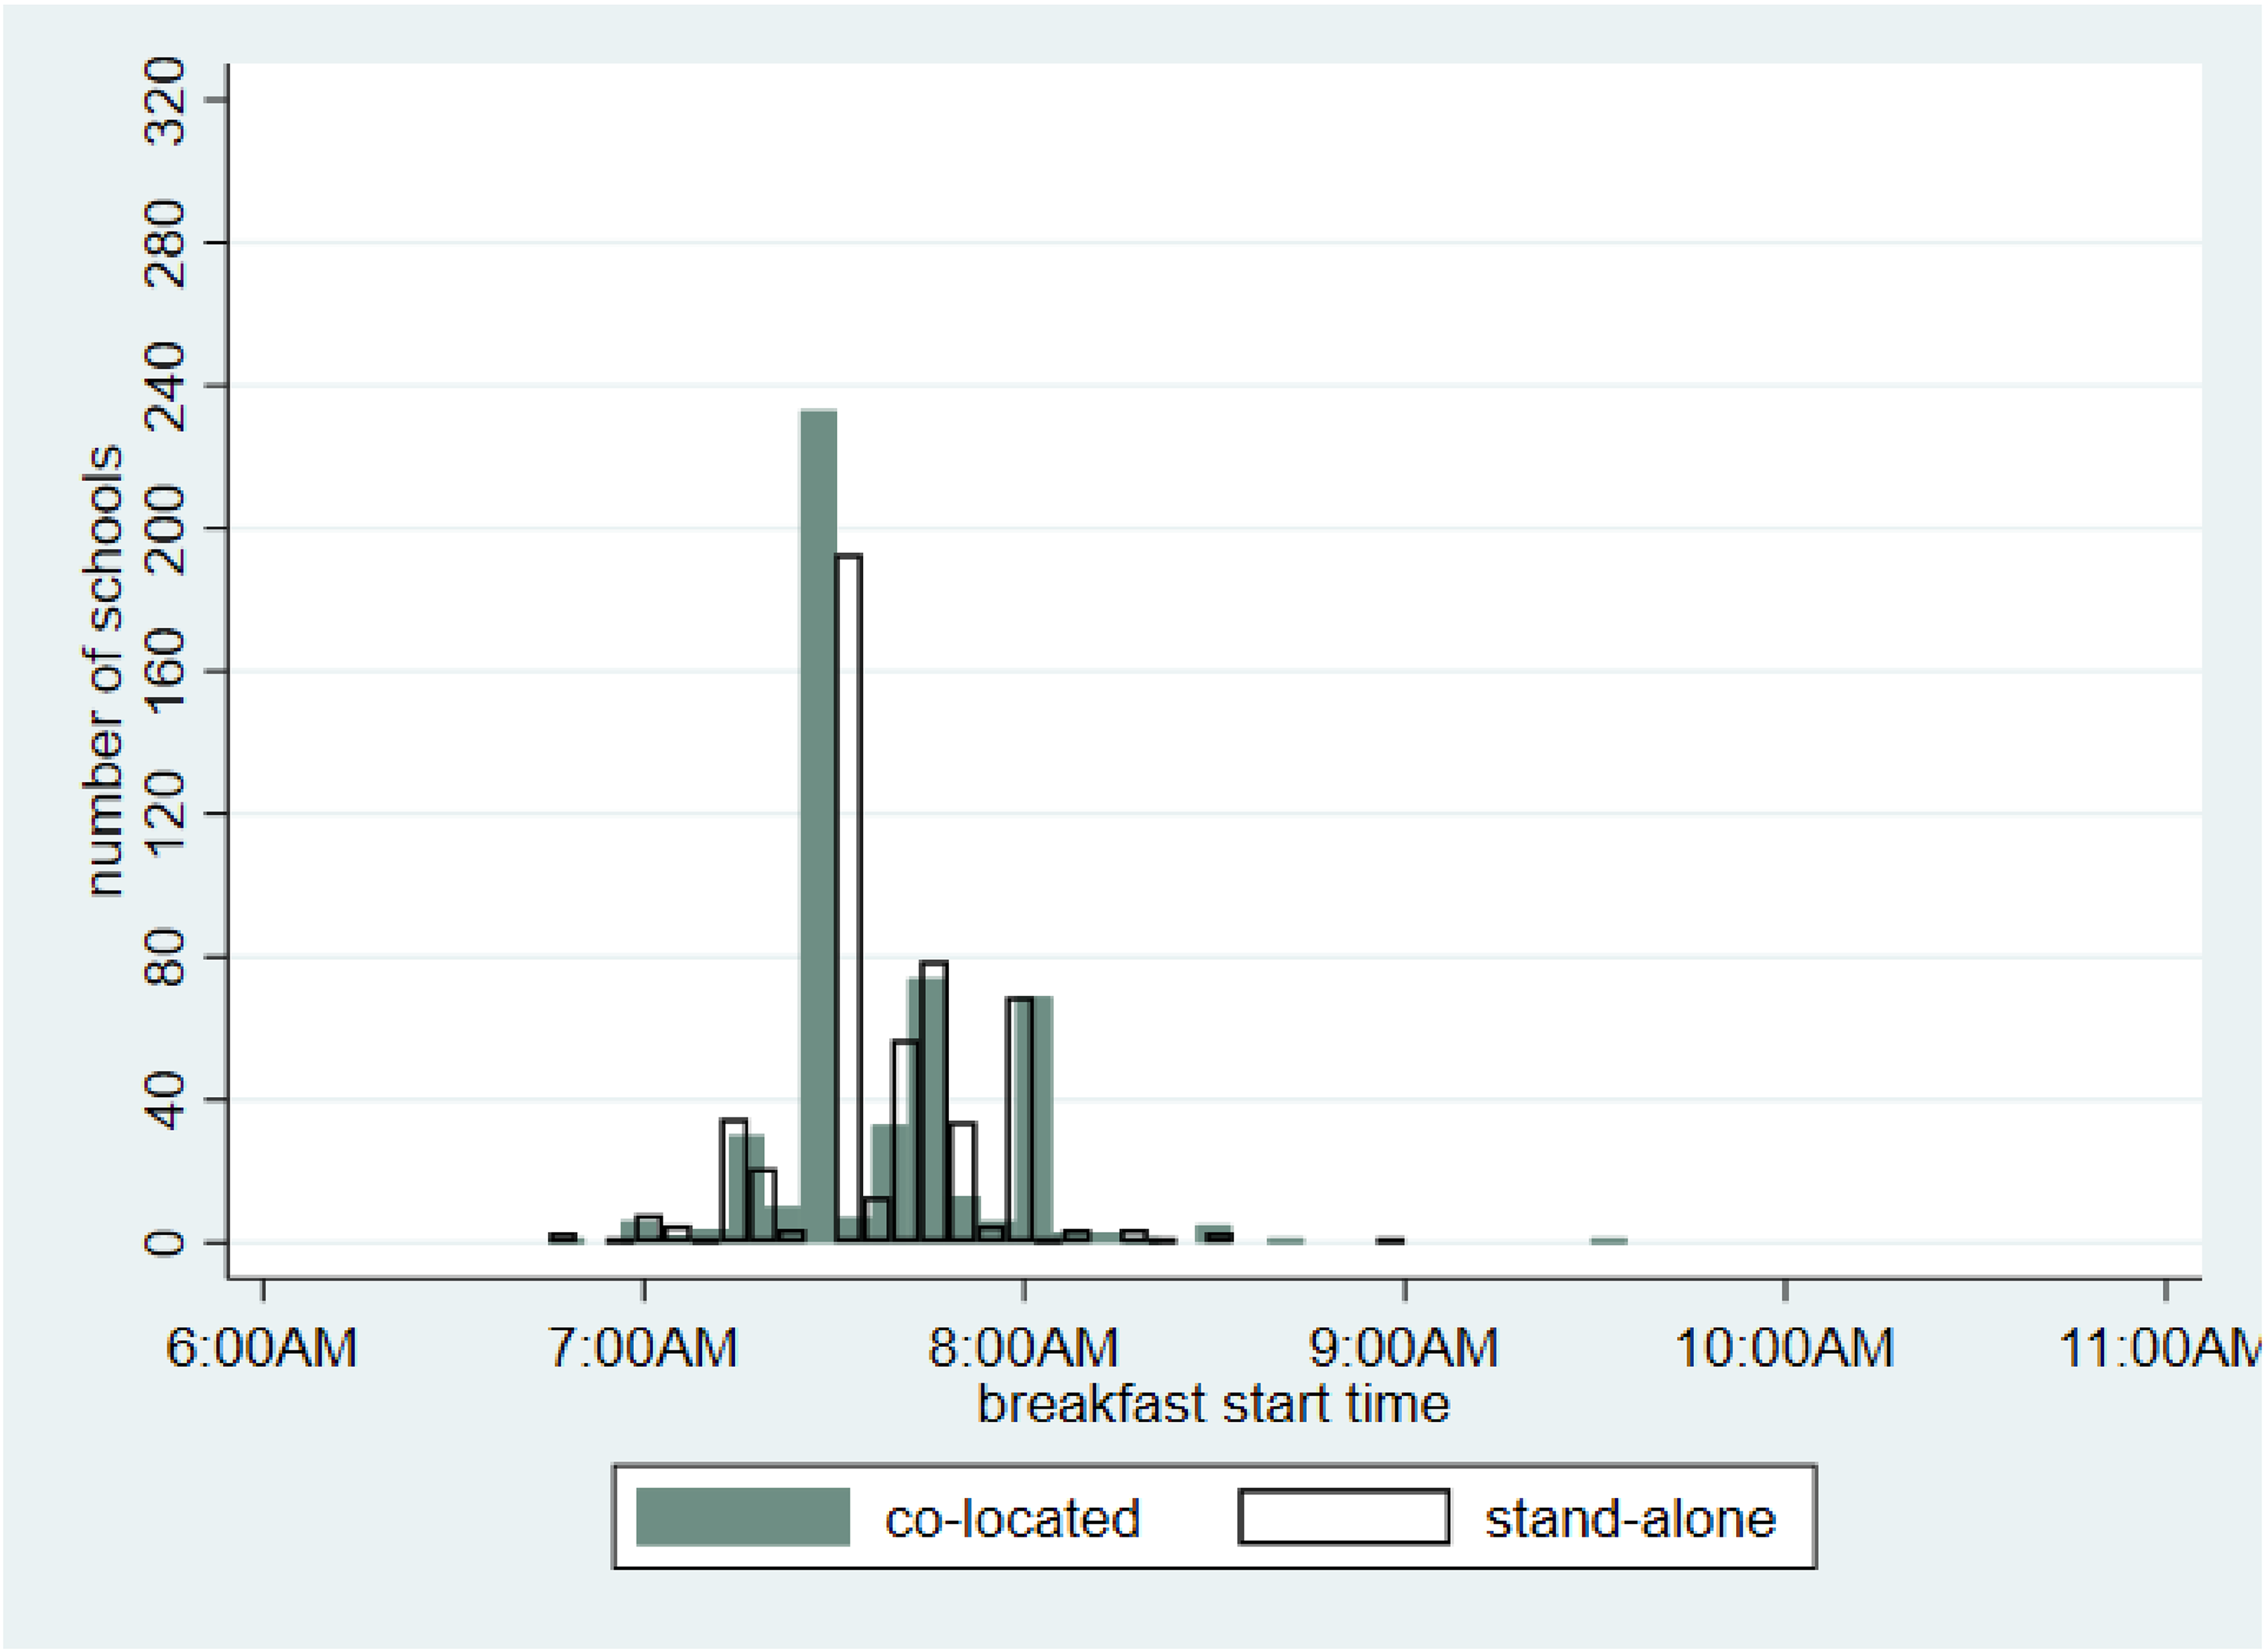
Breakfast start time by co-located status, AY 2014.
Are FRPL-eligible students more likely to be at a disadvantage due to dispersed lunch hours found among co-located schools? As shown in Figure 5, schools serving lunch at later hours are almost exclusively co-located schools that have high shares of FRPL-eligible students. 21 This is not the case for breakfast start times nor is the case for overcrowded versus at-capacity schools (see Figure 6). While descriptive, our cross-sectional analyses suggest that, when co-located, schools with higher shares of low-income students are allotted less desirable lunch hours. This may explain why UFM appears to be a less effective policy at lifting administrative burden and increasing school lunch participation in co-located schools, especially among low-income students. It seems plausible that administrative discretion plays out during negotiations across service providers and such forms of administrative burden cannot be solved by policies like UFM. These results are far from conclusive and warrant future work, especially on negotiation practices between school principals and whether they lead to disproportionate administrative burden in schools with more socioeconomically disadvantaged students.
Lunch start time by share of students who are FRPL-eligible and overcrowded status, AY 2014.
Lunch start time by share of students who are FRPL-eligible and co-location status, AY 2014.
Other Potential Mechanisms
We re-estimate our main analyses with models that include school-level attendance as a control variable and show the results in Tables 4 and 5. We find that the coefficients for the variables of our interest—UFM, BIC, co-location, overcrowding, and the interaction terms between these variables—are substantively unchanged after controlling for attendance. Thus, changes in attendance rates do not appear to explain why co-location moderates the relationship between UFM and school lunch participation.
Regression Results for School Meal Participation, Controlling for School-Level Attendance Rates, School Fixed Effects, AY 2010–2014.
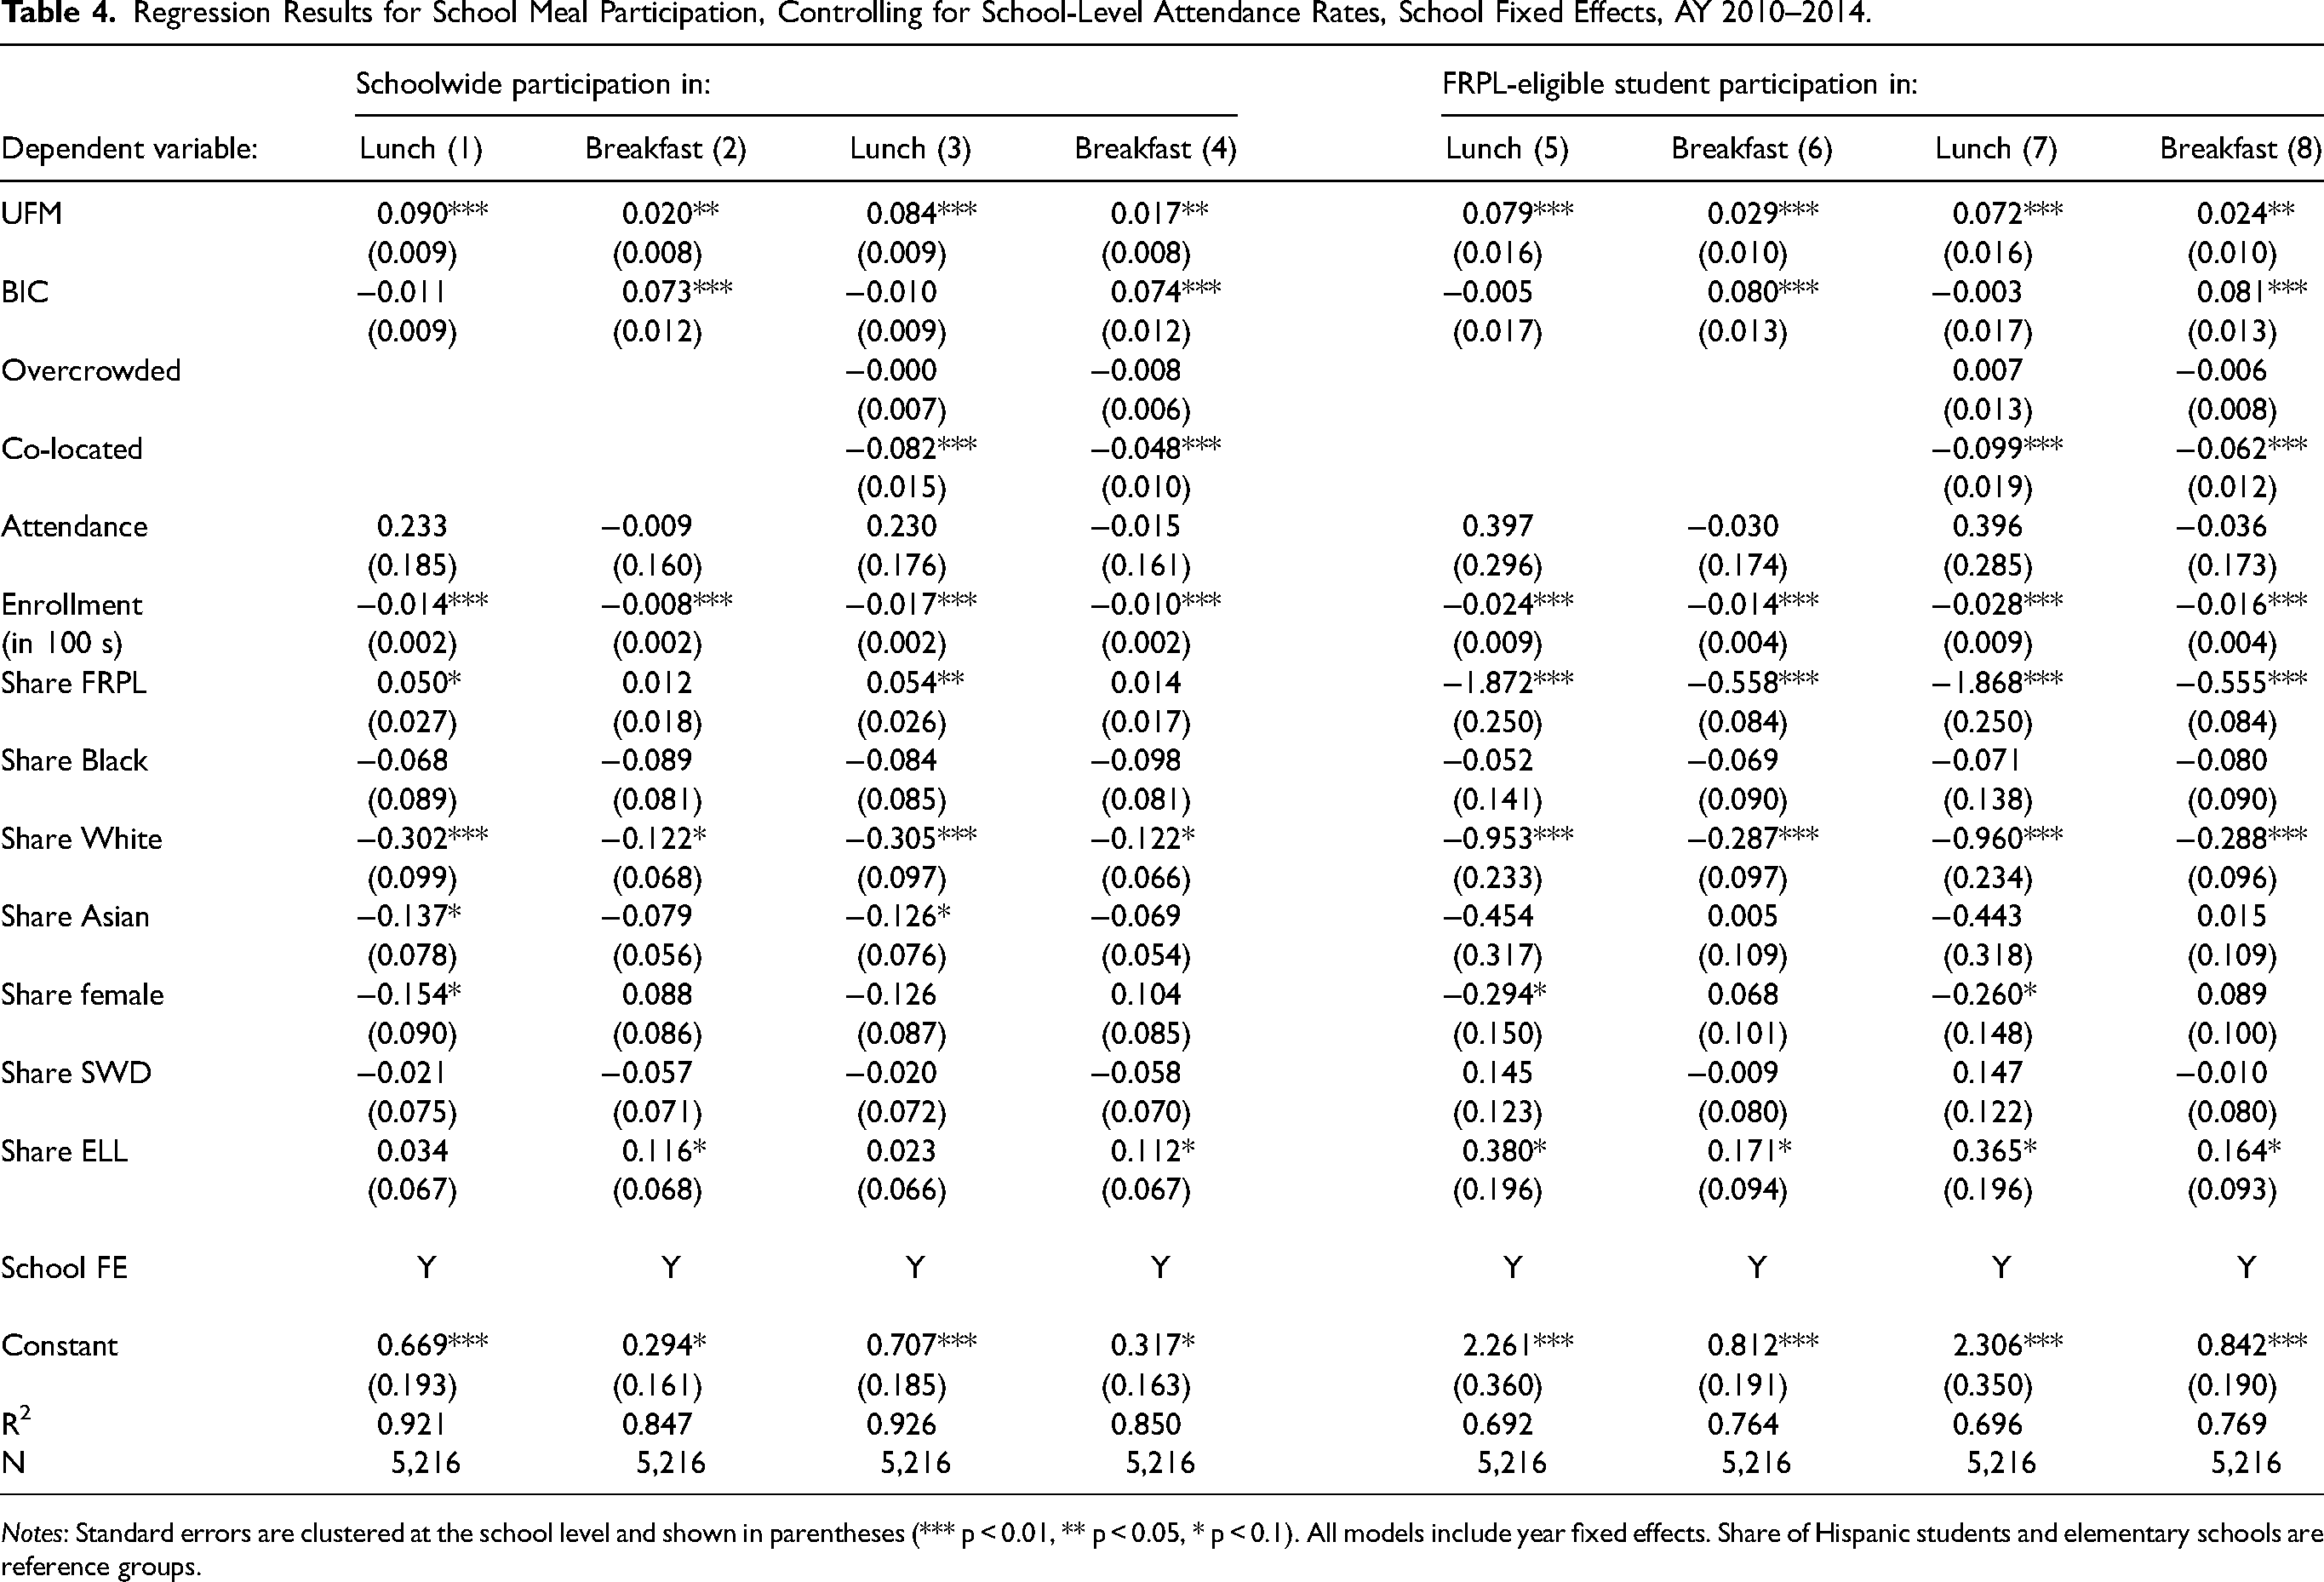
Notes: Standard errors are clustered at the school level and shown in parentheses (*** p < 0.01, ** p < 0.05, * p < 0.1). All models include year fixed effects. Share of Hispanic students and elementary schools are reference groups.
Interaction Term Results for School Meal Participation, Controlling for School-Level Attendance Rates, School Fixed Effects, AY 2010–2014.
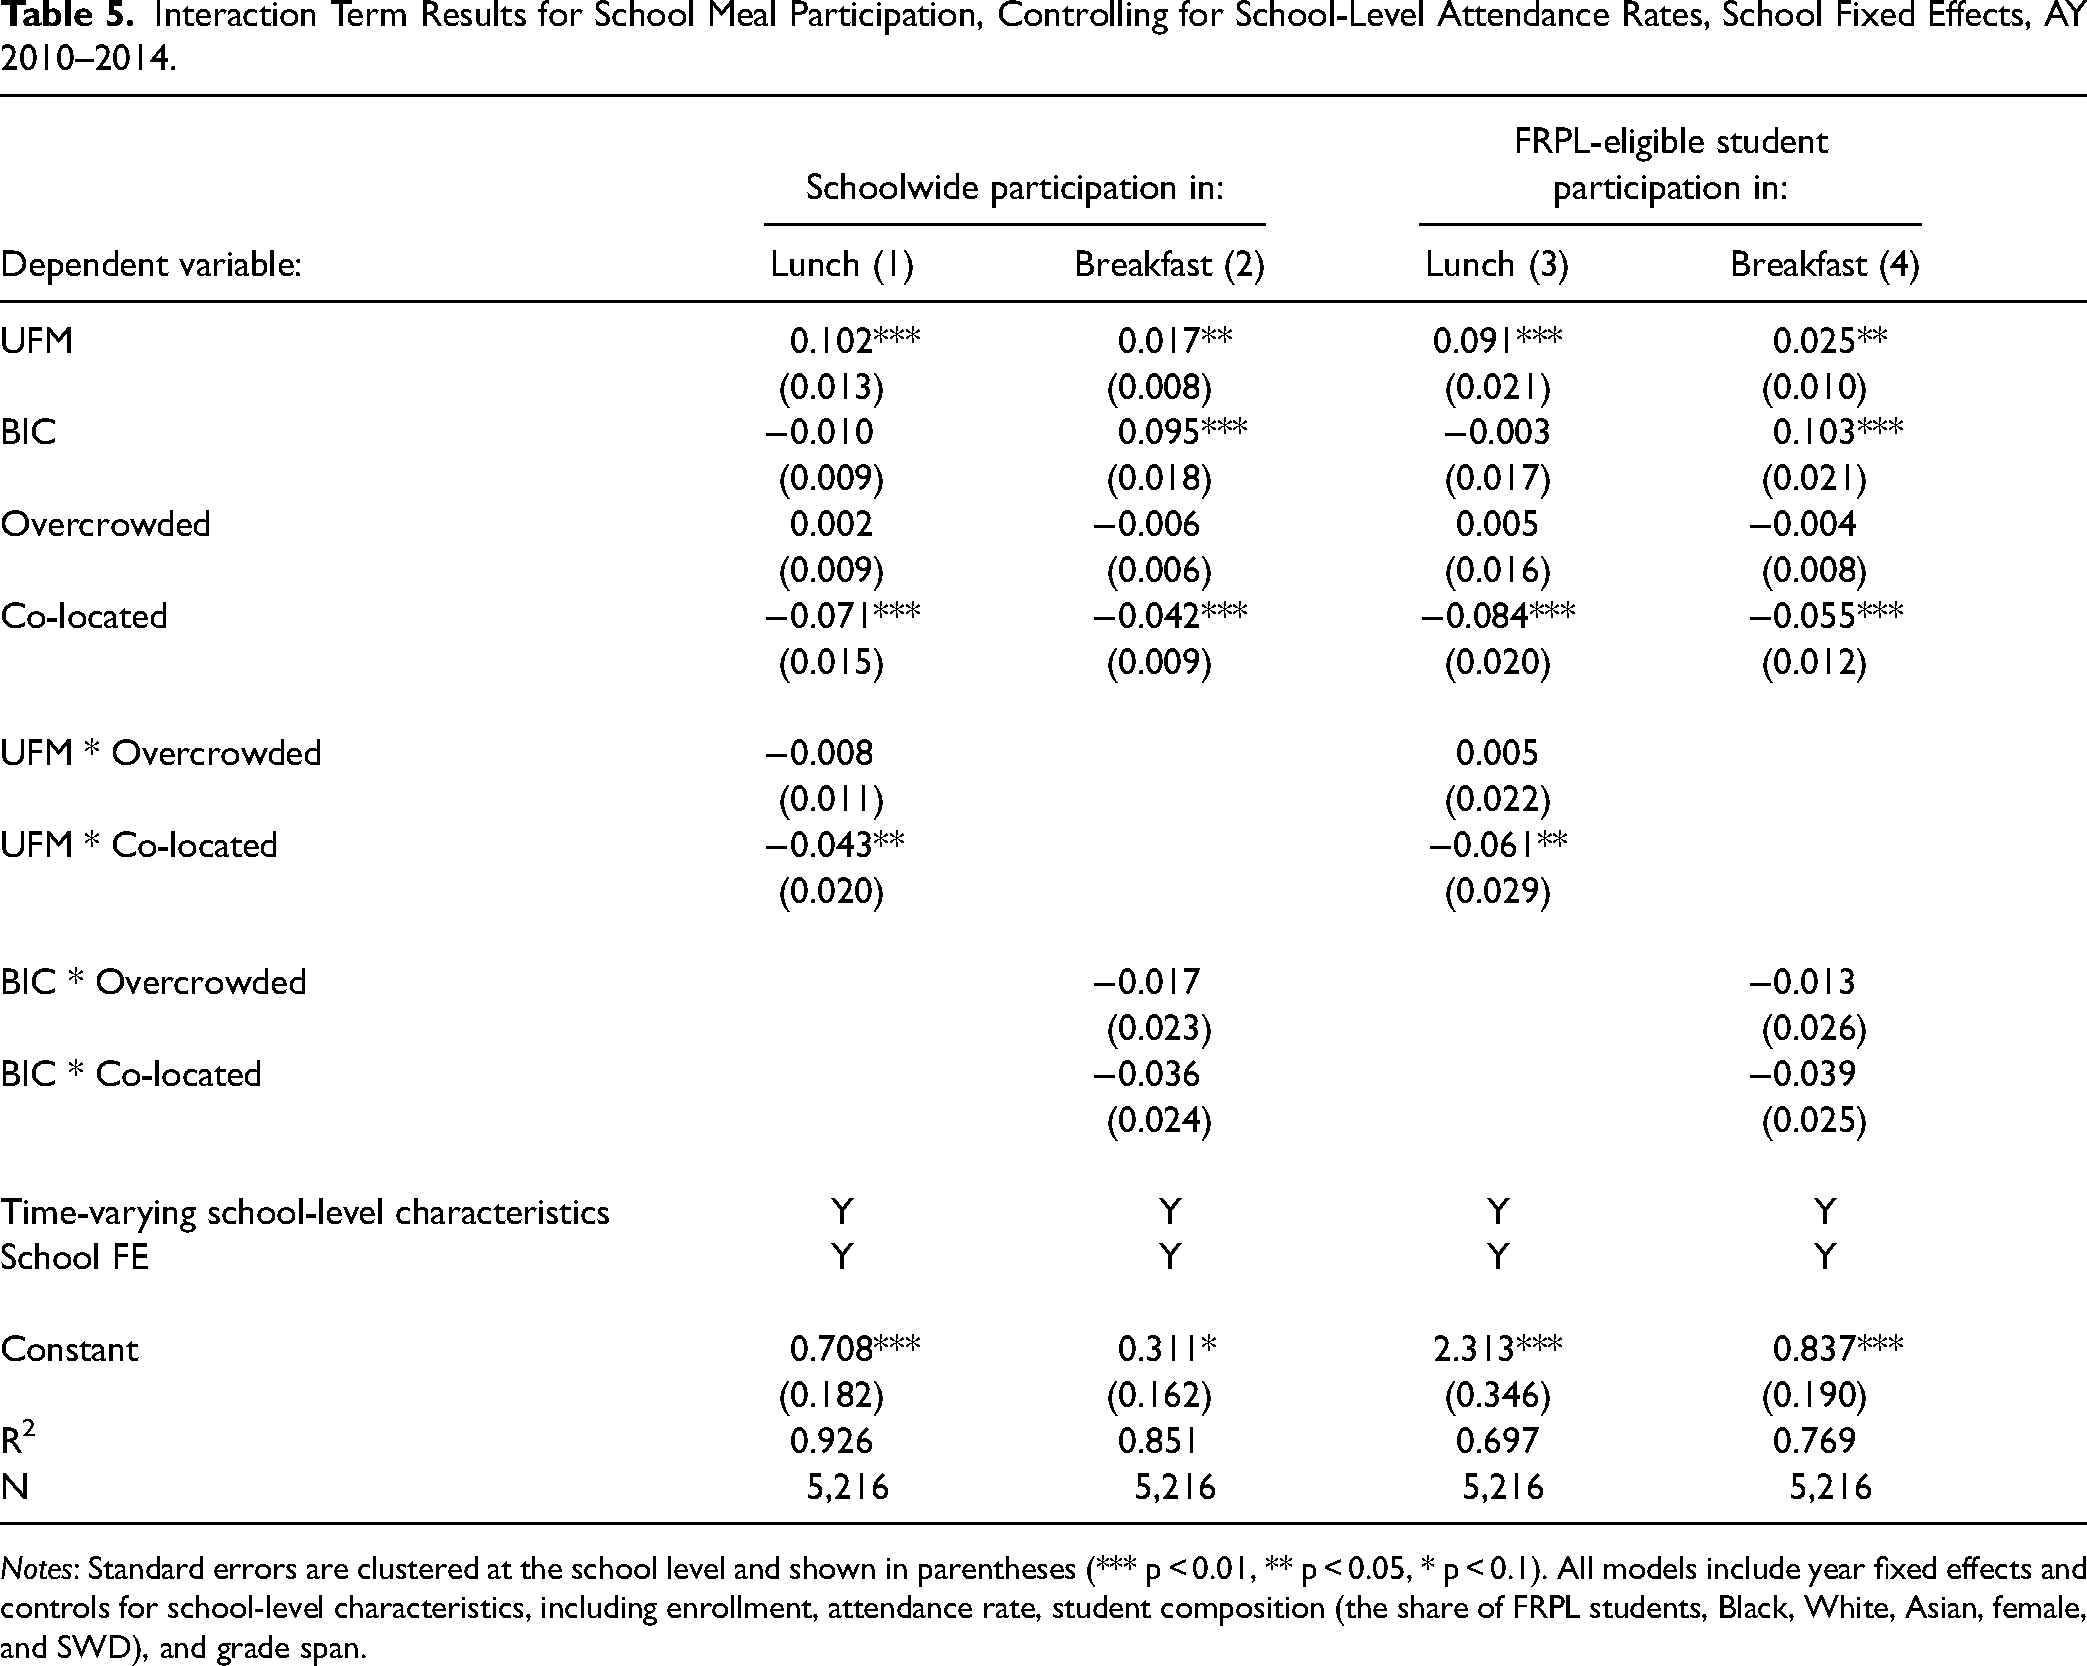
Notes: Standard errors are clustered at the school level and shown in parentheses (*** p < 0.01, ** p < 0.05, * p < 0.1). All models include year fixed effects and controls for school-level characteristics, including enrollment, attendance rate, student composition (the share of FRPL students, Black, White, Asian, female, and SWD), and grade span.
Second, we replace school fixed effects with CSD fixed effects to compare across schools using differing school food policies and facing differential capacity constraints (rather than changes within schools over time). As shown in Table 6, we find similar results for school food policies, co-location, and their interactions but find results that differ for overcrowded and its interactions with school food policies. Unlike the null effects from the school fixed effects model, CSD fixed effects models suggest that overcrowded schools have significantly lower school meal take-up. Furthermore, overcrowded status moderates the positive relationships between school food policies and school meal participation overall (but not for FRPL-eligible students). Results from CSD fixed effects models are more like the findings in Prescott et al. (2022), which rely on cross-sectional analyses and are unable to control for student sorting into schools, endogenous adoption of school food policies, and other time-invariant school characteristics. As discussed in the policy context section, overcrowded schools in NYC's choice environment serve lower shares of minority and low-income students, perhaps serving school meals at lower rates due to student composition; this may upwardly bias estimates of the potential harms of overcrowding. Overcrowded schools may also operate in denser neighborhoods or those with more restaurant-related economic activity. The school fixed effects models suggest that the differences between overcrowded and at capacity schools in school meal participation (as well as its interactions with BIC and UFM) are likely driven by these unobserved features of schools rather than overcrowding itself.
Interaction Term Results for School Meal Participation, Community School District Fixed Effects, AY 2010–2014.
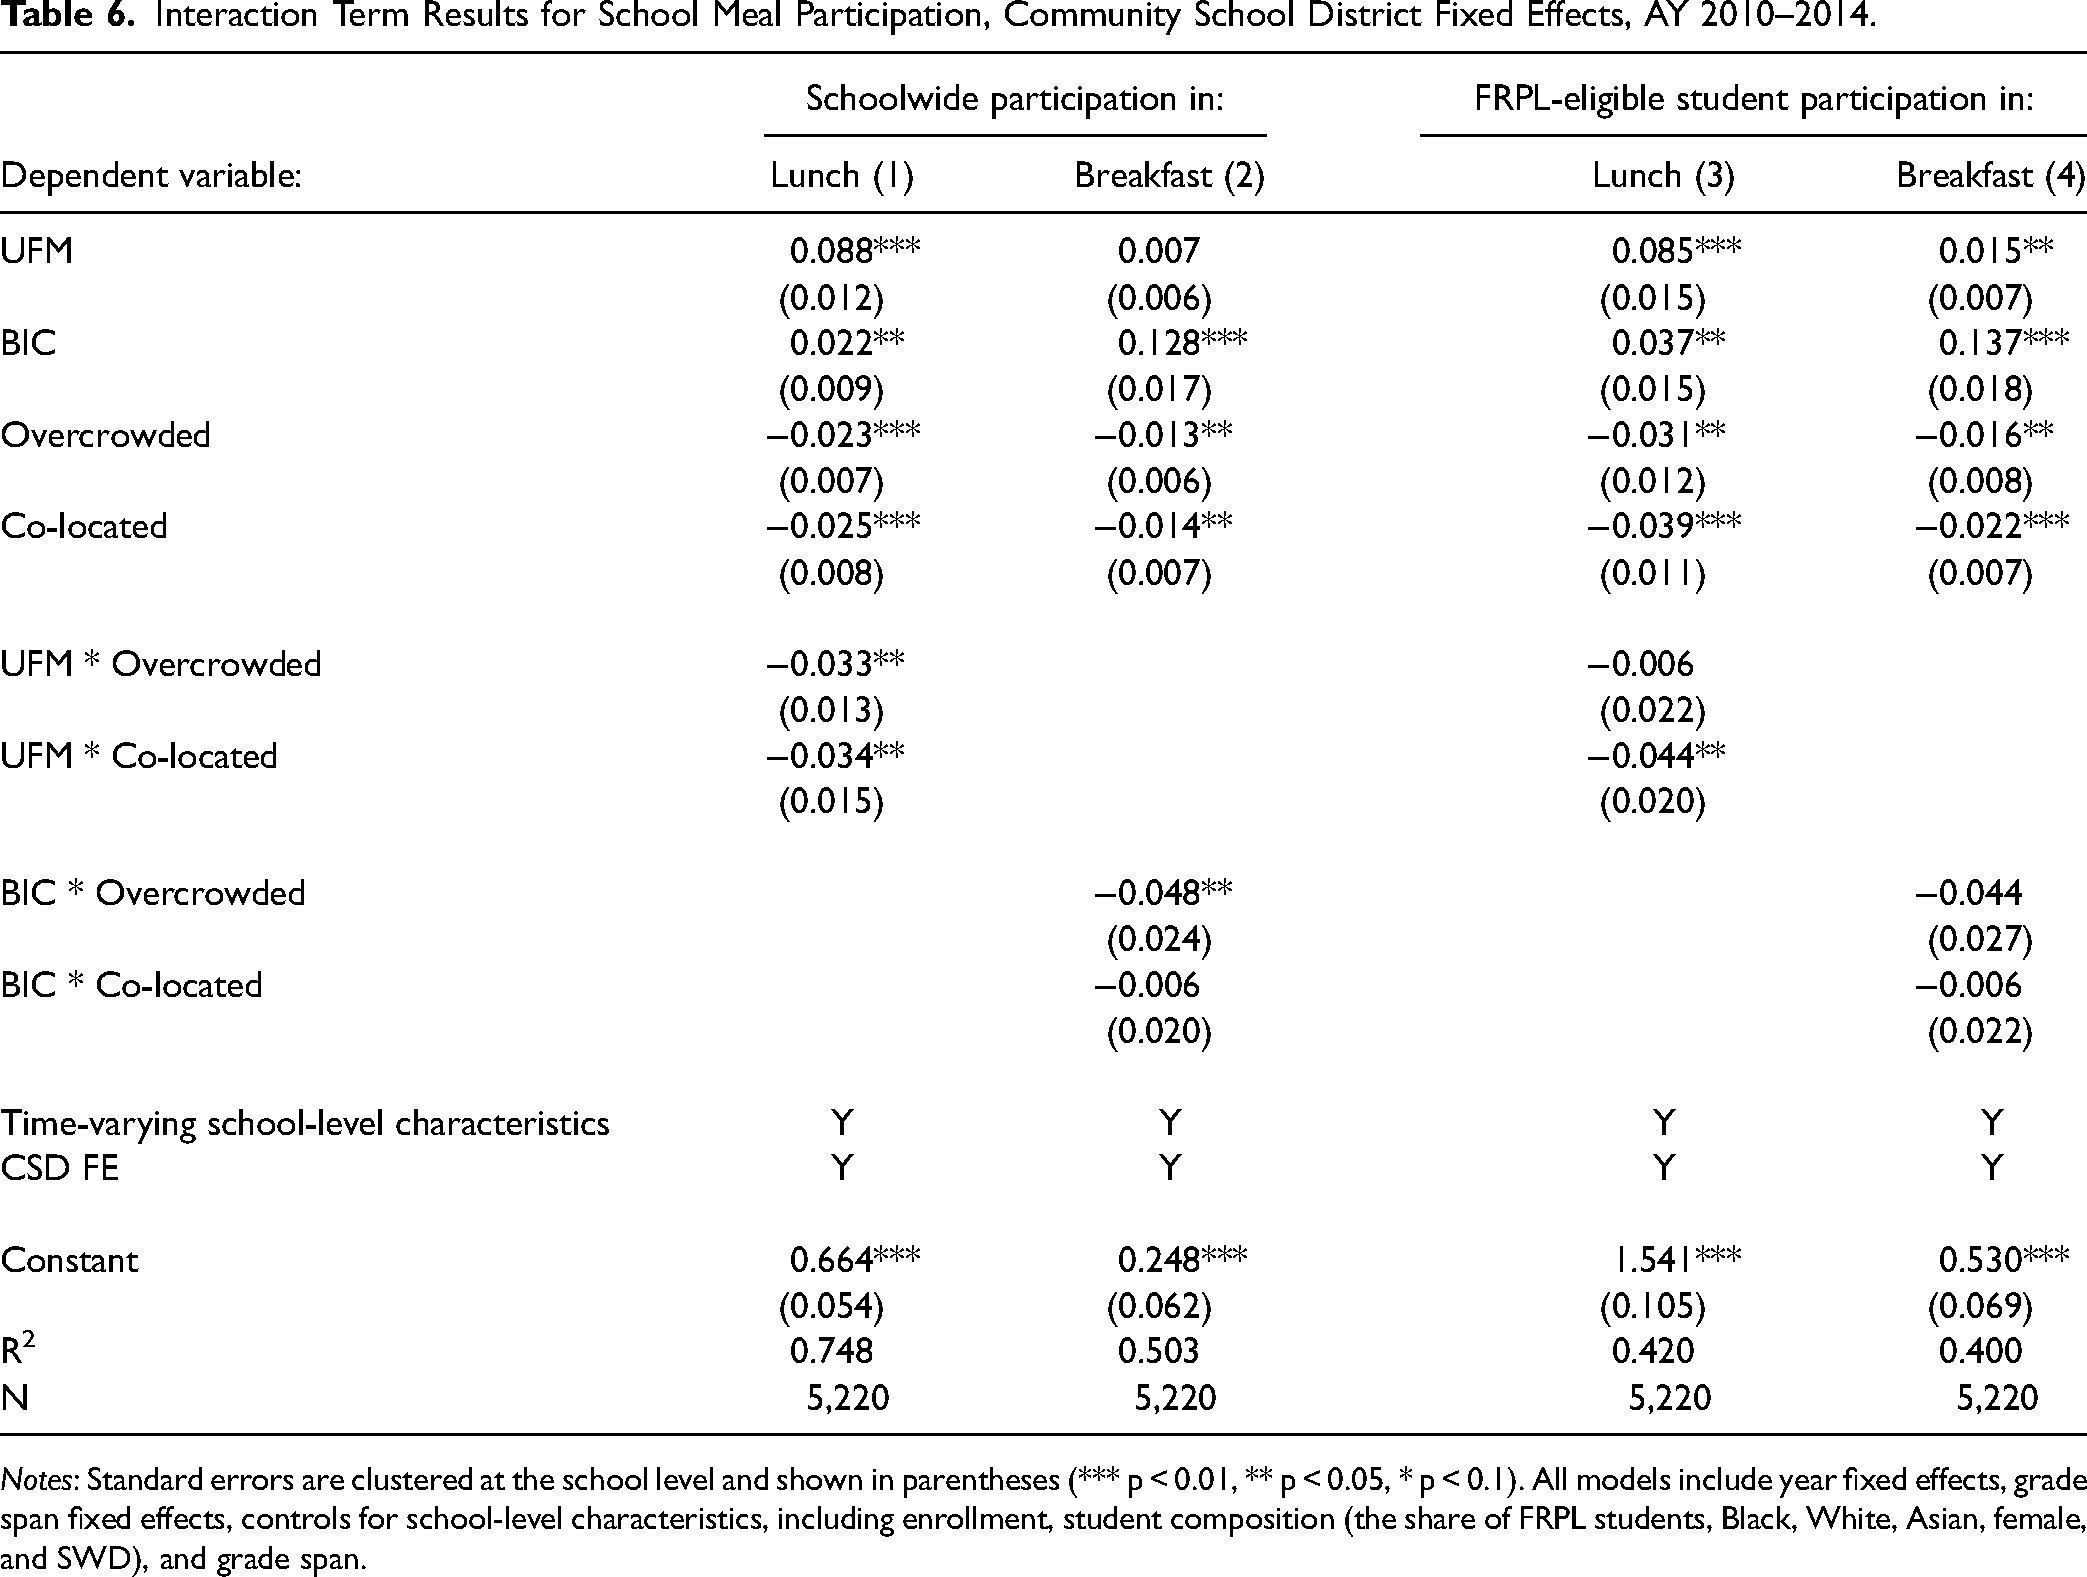
Notes: Standard errors are clustered at the school level and shown in parentheses (*** p < 0.01, ** p < 0.05, * p < 0.1). All models include year fixed effects, grade span fixed effects, controls for school-level characteristics, including enrollment, student composition (the share of FRPL students, Black, White, Asian, female, and SWD), and grade span.
Finally, we test robustness to using a continuous measure of school overcrowding in lieu of our binary measure, overcrowded. We include the ratio of enrollment to target capacity, ETC, in our estimating equation and find similar results (Table 7). The relationship between ETC and school meal participation remains small and statistically insignificant. ETC does not moderate the effects of UFM on lunch participation (or the effects of BIC on breakfast participation). We finally add interactions between overcrowded and co-located (Table 8), finding no evidence the capacity constraints have multiplicative effects and no change to UFM or BIC estimates.
Regression Results for School Meal Participation, Enrollment to Target Capacity (ETC) Ratio, AY 2010–2014.
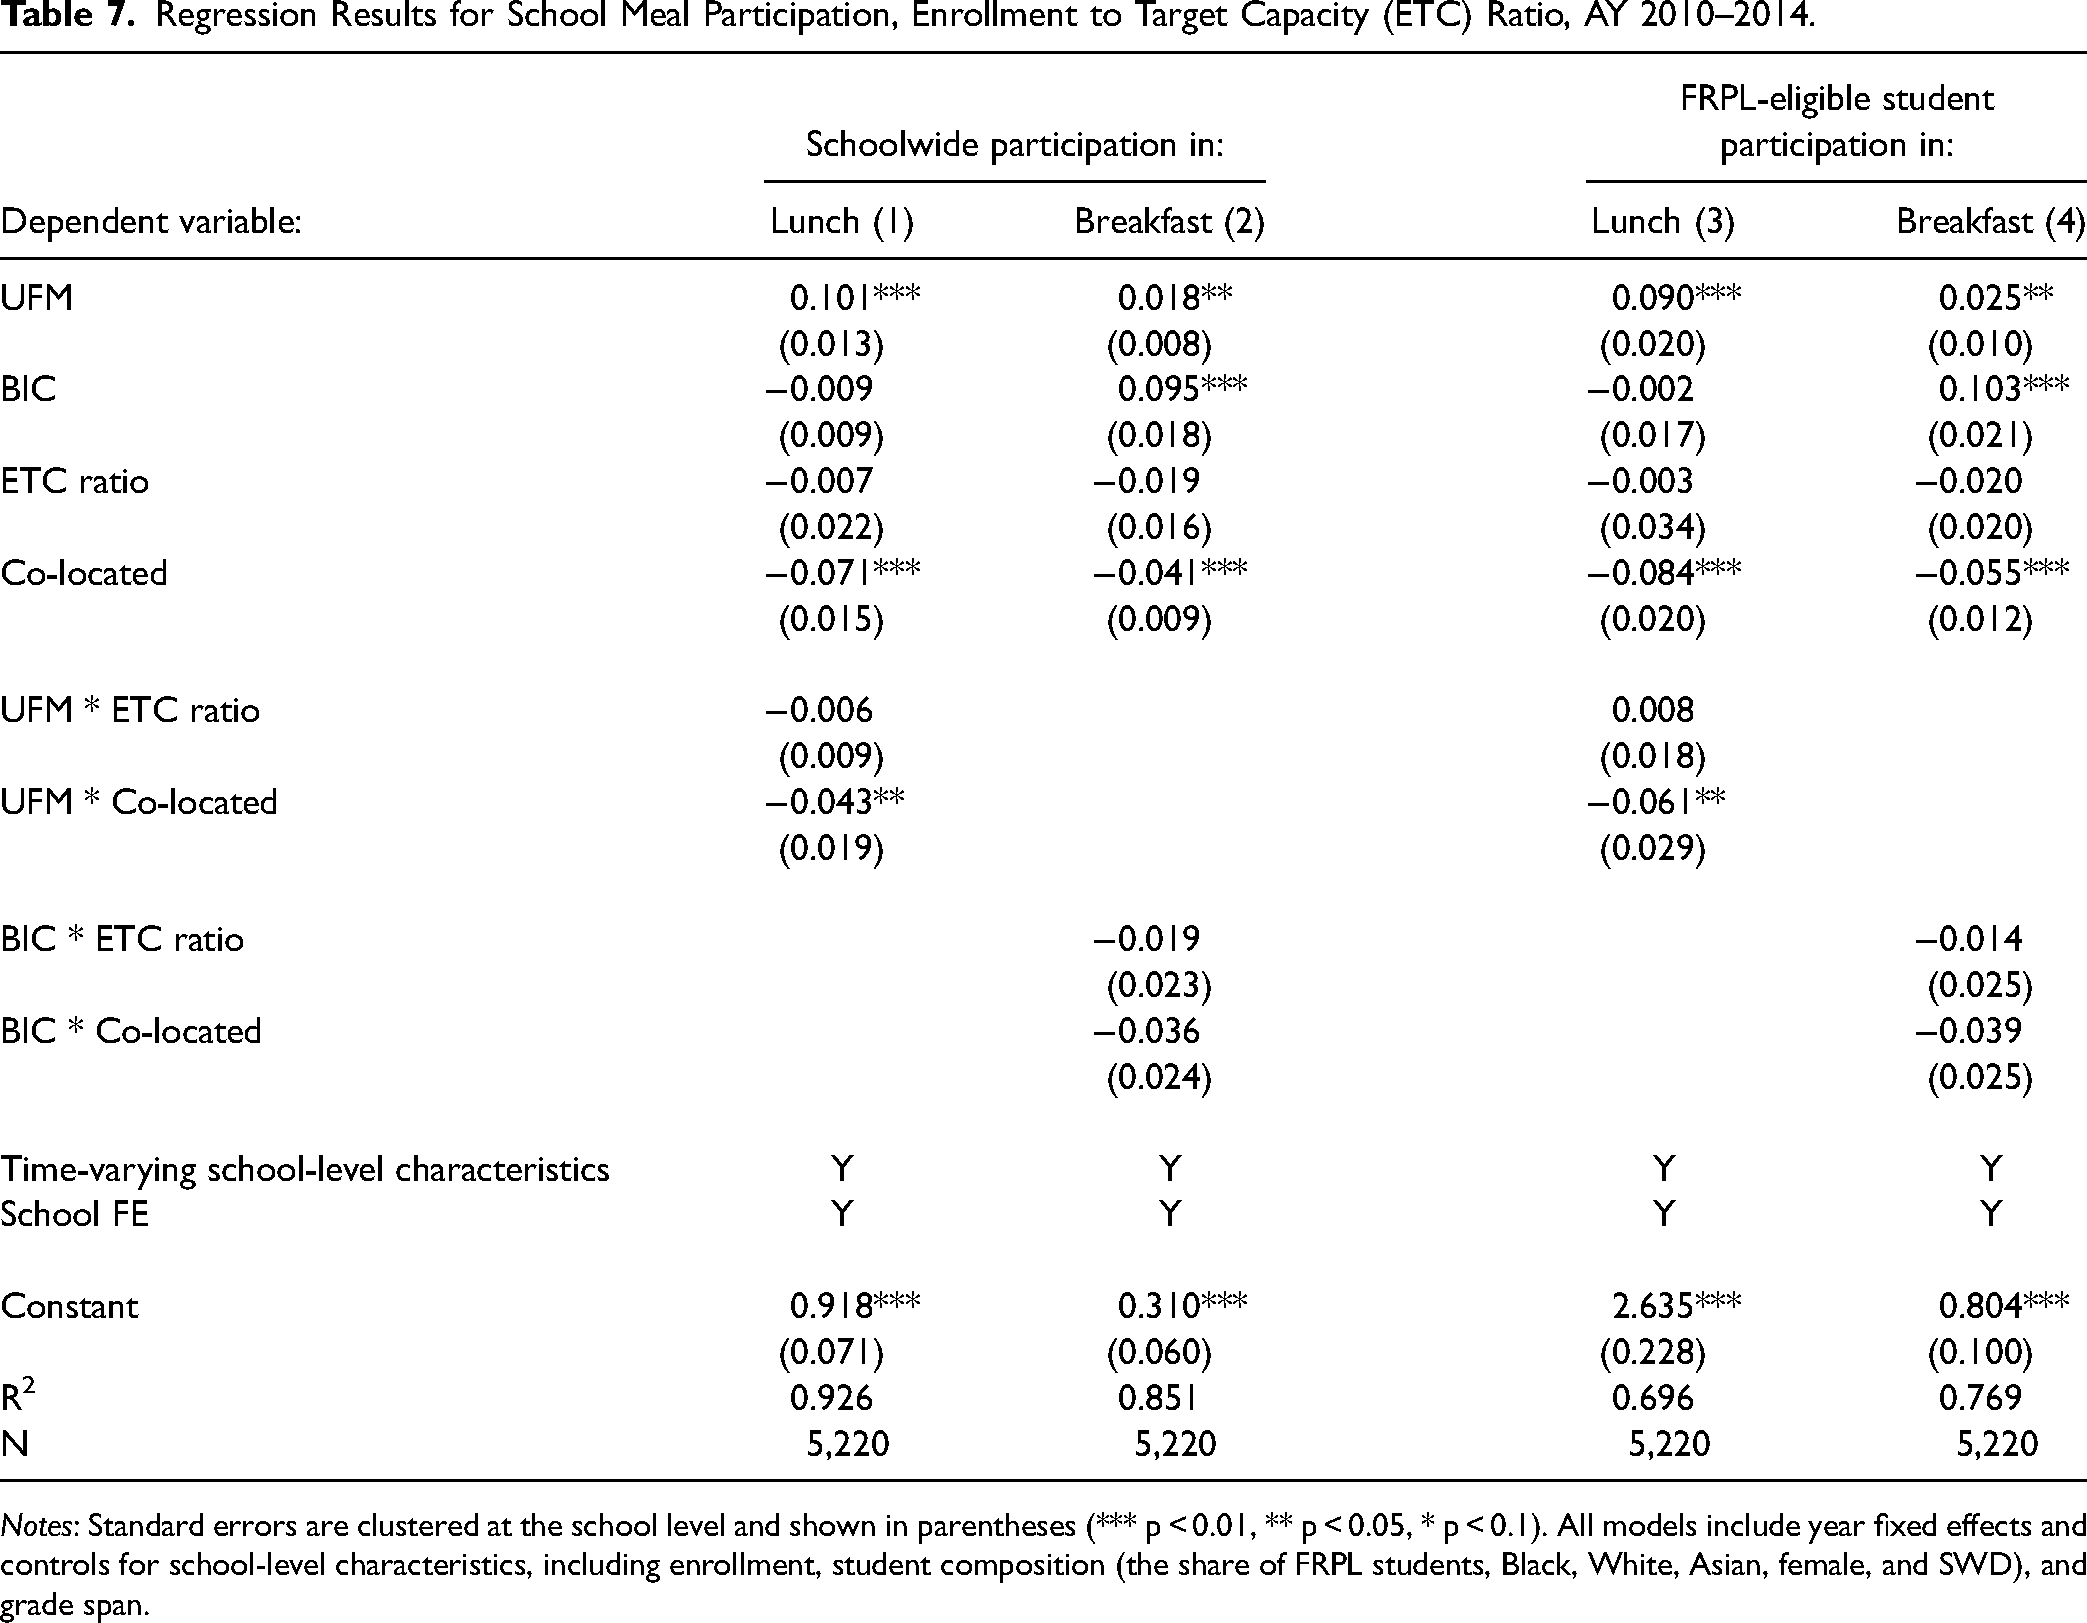
Notes: Standard errors are clustered at the school level and shown in parentheses (*** p < 0.01, ** p < 0.05, * p < 0.1). All models include year fixed effects and controls for school-level characteristics, including enrollment, student composition (the share of FRPL students, Black, White, Asian, female, and SWD), and grade span.
Interaction of Capacity Constraints Results for School Meal Participation, AY 2010–2014.
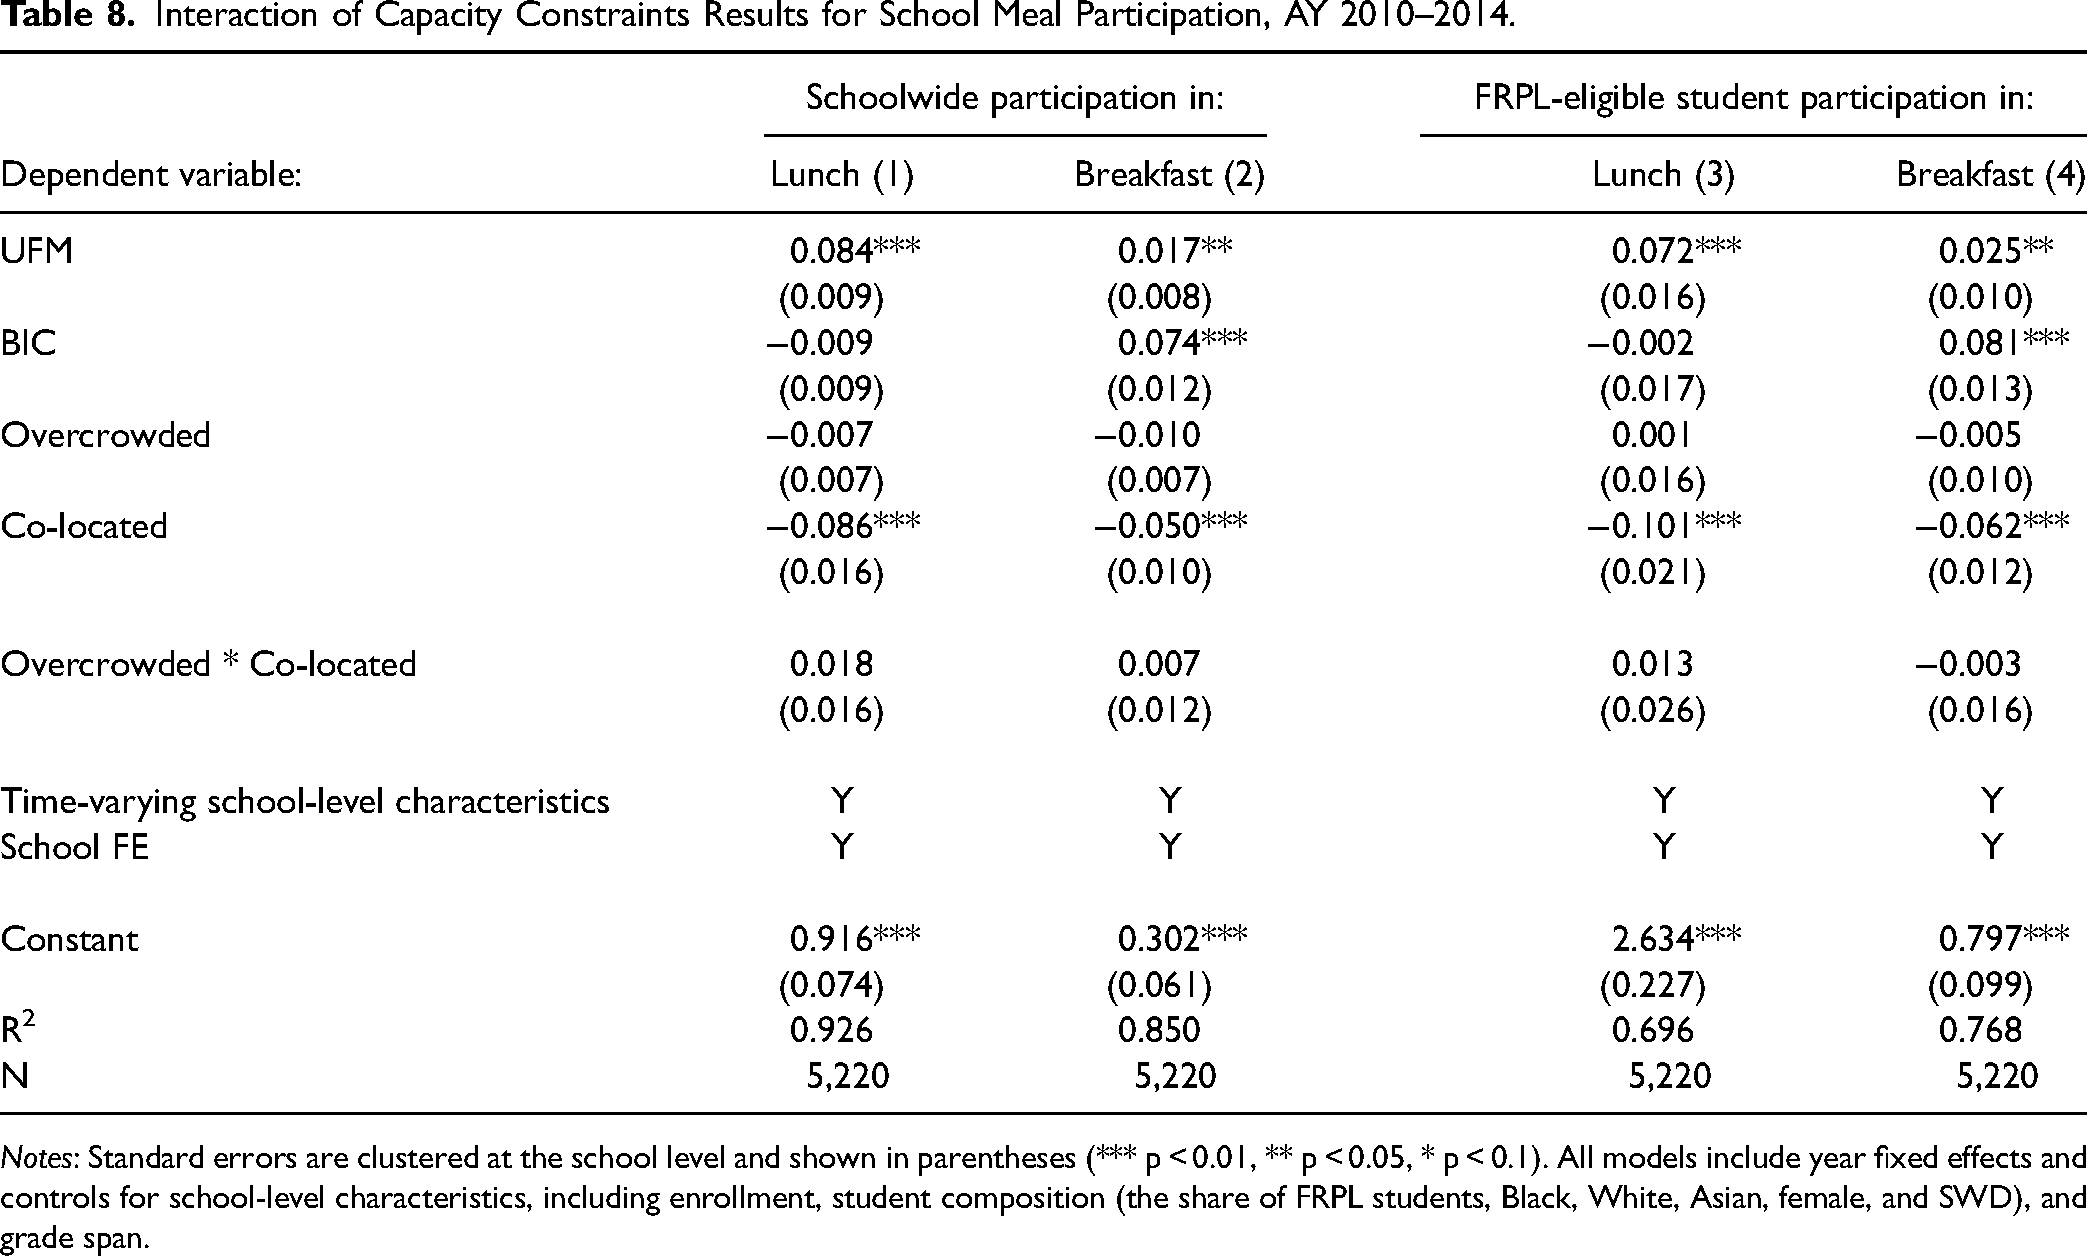
Notes: Standard errors are clustered at the school level and shown in parentheses (*** p < 0.01, ** p < 0.05, * p < 0.1). All models include year fixed effects and controls for school-level characteristics, including enrollment, student composition (the share of FRPL students, Black, White, Asian, female, and SWD), and grade span.
Discussion
NSLP, the second largest food assistance program in the United States, operates in school cafeterias, but a dearth of research examines the contextual challenges of delivering the program and the onerous processes that these challenges create. The same applies to SBP, with similar limitations in previous research and policy implementation. Emerging evidence suggests that reduced physical access to programs increases psychological and compliance costs for program beneficiaries, creating its own administrative burden and reducing program take-up (Deshpande & Li, 2019; Rossin-Slater, 2013). Handling capacity constraints, then, falls on the shoulders of public managers, e.g., principals. Administrative discretion used to allocate limited cafeteria space may, however, harm equity by introducing new administrative burden on disadvantaged students (low-income and/or minority students). Policies alone, such as UFM and BIC, may not overcome additional burden from capacity constraints and discretion used to address them. In fact, negotiations across service providers (schools) may dampen the effectiveness of policies (as evidenced by our results for UFM).
To our knowledge, this is the first study of how school capacity constraints moderate the effectiveness of school food policies to reduce administrative burden and increase program take-up. We use longitudinal data to disentangle the differences in the effectiveness of UFM and BIC across school contexts that face substantial capacity constraints from those that do not. Consistent with previous research, we find UFM and BIC increase average participation rates in school lunch and breakfast, respectively (by 9.0 and 7.3 percentage points). Critically, co-location is negatively correlated with participation and appears to further moderate the effectiveness of UFM, particularly for FRPL-eligible children. UFM increases school lunch participation of FRPL-eligible students at a rate almost 70% smaller than its effect in stand-alone schools (a much sharper decline than is observed among all students). To be sure, even in co-located schools, the net effect of UFM is still positive; co-located schools with UFM have higher lunch participation rates than co-located schools without UFM, but the extent to which the policy improves take-up is 40% smaller on average. While our results suggest schools’ physical capacity constraints shape participation, we can only limitedly parse the underlying mechanism, such as atypical lunch hours, long lunch lines, understaffed kitchens, and lower food quality, among myriads of other aspects of environments that may create administrative burden and increase costs for participation. The effectiveness of BIC, on the contrary, is not dampened by co-location, in part because schools typically do not share classrooms. The positive relationships between school food policies (UFM and BIC) and school meal participation persist in overcrowded schools and look no different than in at-capacity schools.
Taken together, our results are consistent with our hypotheses that school capacity constraints suppress service take-up and limit the effectiveness of school food policies that aim to reduce administrative burden. Still, a causal interpretation of the results should be made with caution. Students attending schools that are overcrowded or co-located may differ from others in unobserved ways and may react to school food policies and administrative burden differently, too. Our estimated impacts of school food policies on school meal participation stand on firmer ground with respect to a causal interpretation, because it relies on the same identification assumptions used and tested in previous work (namely, parallel trends in participation if not for the change in school food policy and conditional exogeneity of policy adoption). Constraints on cafeteria capacity, however, are not adopted policies but, instead, are features of schools that are largely a result of external forces and are less likely to vary much within schools over time. Therefore, we can only provide descriptive evidence on the relationship between co-location (or overcrowding) and school meal participation. We also find evidence that the positive relationship between UFM and lunch participation is weaker in co-located schools in NYC but cannot rule out alternative reasons such patterns exist. Using panel data and including school fixed effects narrows the potential alternative explanations for the relationships identified in this paper, but it is not an elixir.
Another limitation of this study is that we are largely unable to disentangle the various types of administrative burden and the extent to which each independently or collectively affects student participation in school meals. For example, we cannot determine if the estimated differences in participation are more likely to be due to congestion in the cafeteria or decreased stigma attached to school meals. We explore one form of administrative discretion that results in administrative burden and find that co-location is correlated with more dispersed lunch hours. Given that UFM has smaller positive effects in co-located schools, we speculate (at best) that UFM is unable to address this administrative burden in co-located settings. This is because schools generally do not administer school lunch for multiple schools in the cafeteria at the same time. Future studies with detailed quantitative data on specific forms of administrative burden (e.g., lunch lines, longitudinal data on lunch hours, or survey data on peer interactions) or qualitative data from students and school administrators operating in capacity constrained settings may help peel back the layers of administrative burden and discretion.
Similarly, other additional data and information about school meals and cafeterias may help provide more nuanced information on the policy implications. For example, schools may provide students with lower-quality or prepackaged lunches to meet the excess demand for school meals created by UFM or BIC, an unintended consequence of school food policies that aim to increase participation. While policies may appear to meet their intended goals by increasing student take-up in “quantity,” it may be at the cost of lower “quality” of meals consumed, which is unable to be captured in our current dataset. Schools with other constraints, such as understaffed kitchens, may also impose additional administrative burden under excess demand created by UFM and BIC, which may result in an underestimation of UFM or BIC effectiveness (less concerning than bias due to overestimation). 22 Conversely, schools with better marketing strategies that can effectively inform the procedures and benefits of UFM and BIC (or school meal programs, in general) may reduce the learning costs of the policies/programs and thus increase student participation more so than others. Yet, whether these constraints or strategies are more prominent in co-located schools than stand-alone schools is unexplained in this study and is an area for future studies. 23
Despite noted limitations, this study has important implications for policymakers, namely that capacity constraints may create administrative burden and are important contextual considerations that shape participation in public services. Co-location provides a challenging context for implementing policies that aim to reduce administrative burden. Overcrowding, perhaps less so. Some policy recommendations include policies and programs that help principals or school food managers better negotiate or distribute school lunch hours between co-located schools. This may include collaboration among the administrators of multiple schools to identify strategies to share lunch hours and cafeteria spaces. Other recommendations include expanding school food policies that reduce administrative burden, because such policies may offset lower school meal participation in overcrowded and shared spaces. Reaffirming previous research, we show that UFM and BIC increase participation in school meal programs and offer further evidence they may do so by lowering administrative hurdles, even in capacity-constrained settings.
On a final note, this study sheds light on the broader potential consequences of administrative burden created by school reforms. Co-location is a historical consequence of small school movements aimed at improving the learning environments for students, but the resulting changes in the shared use of non-instructional spaces may have unexpected and unintended consequences in school program delivery. The reforms intended to address the problems of large, underperforming schools may have created administrative burden outside the classroom—and in the cafeteria—reducing the effectiveness of delivering school meal programs. Thus, understanding how public management reforms may create administrative burden in different aspects of public service delivery, along with possible inequity in the distribution of such burden, is warranted in future research and practice.
Supplemental Material
sj-docx-1-arp-10.1177_02750740241292073 - Supplemental material for Administrative Burden in the Cafeteria: Evidence from School Meal Participation in Shared Buildings
Supplemental material, sj-docx-1-arp-10.1177_02750740241292073 for Administrative Burden in the Cafeteria: Evidence from School Meal Participation in Shared Buildings by Jeehee Han and Michah W. Rothbart in The American Review of Public Administration
Footnotes
Appendix
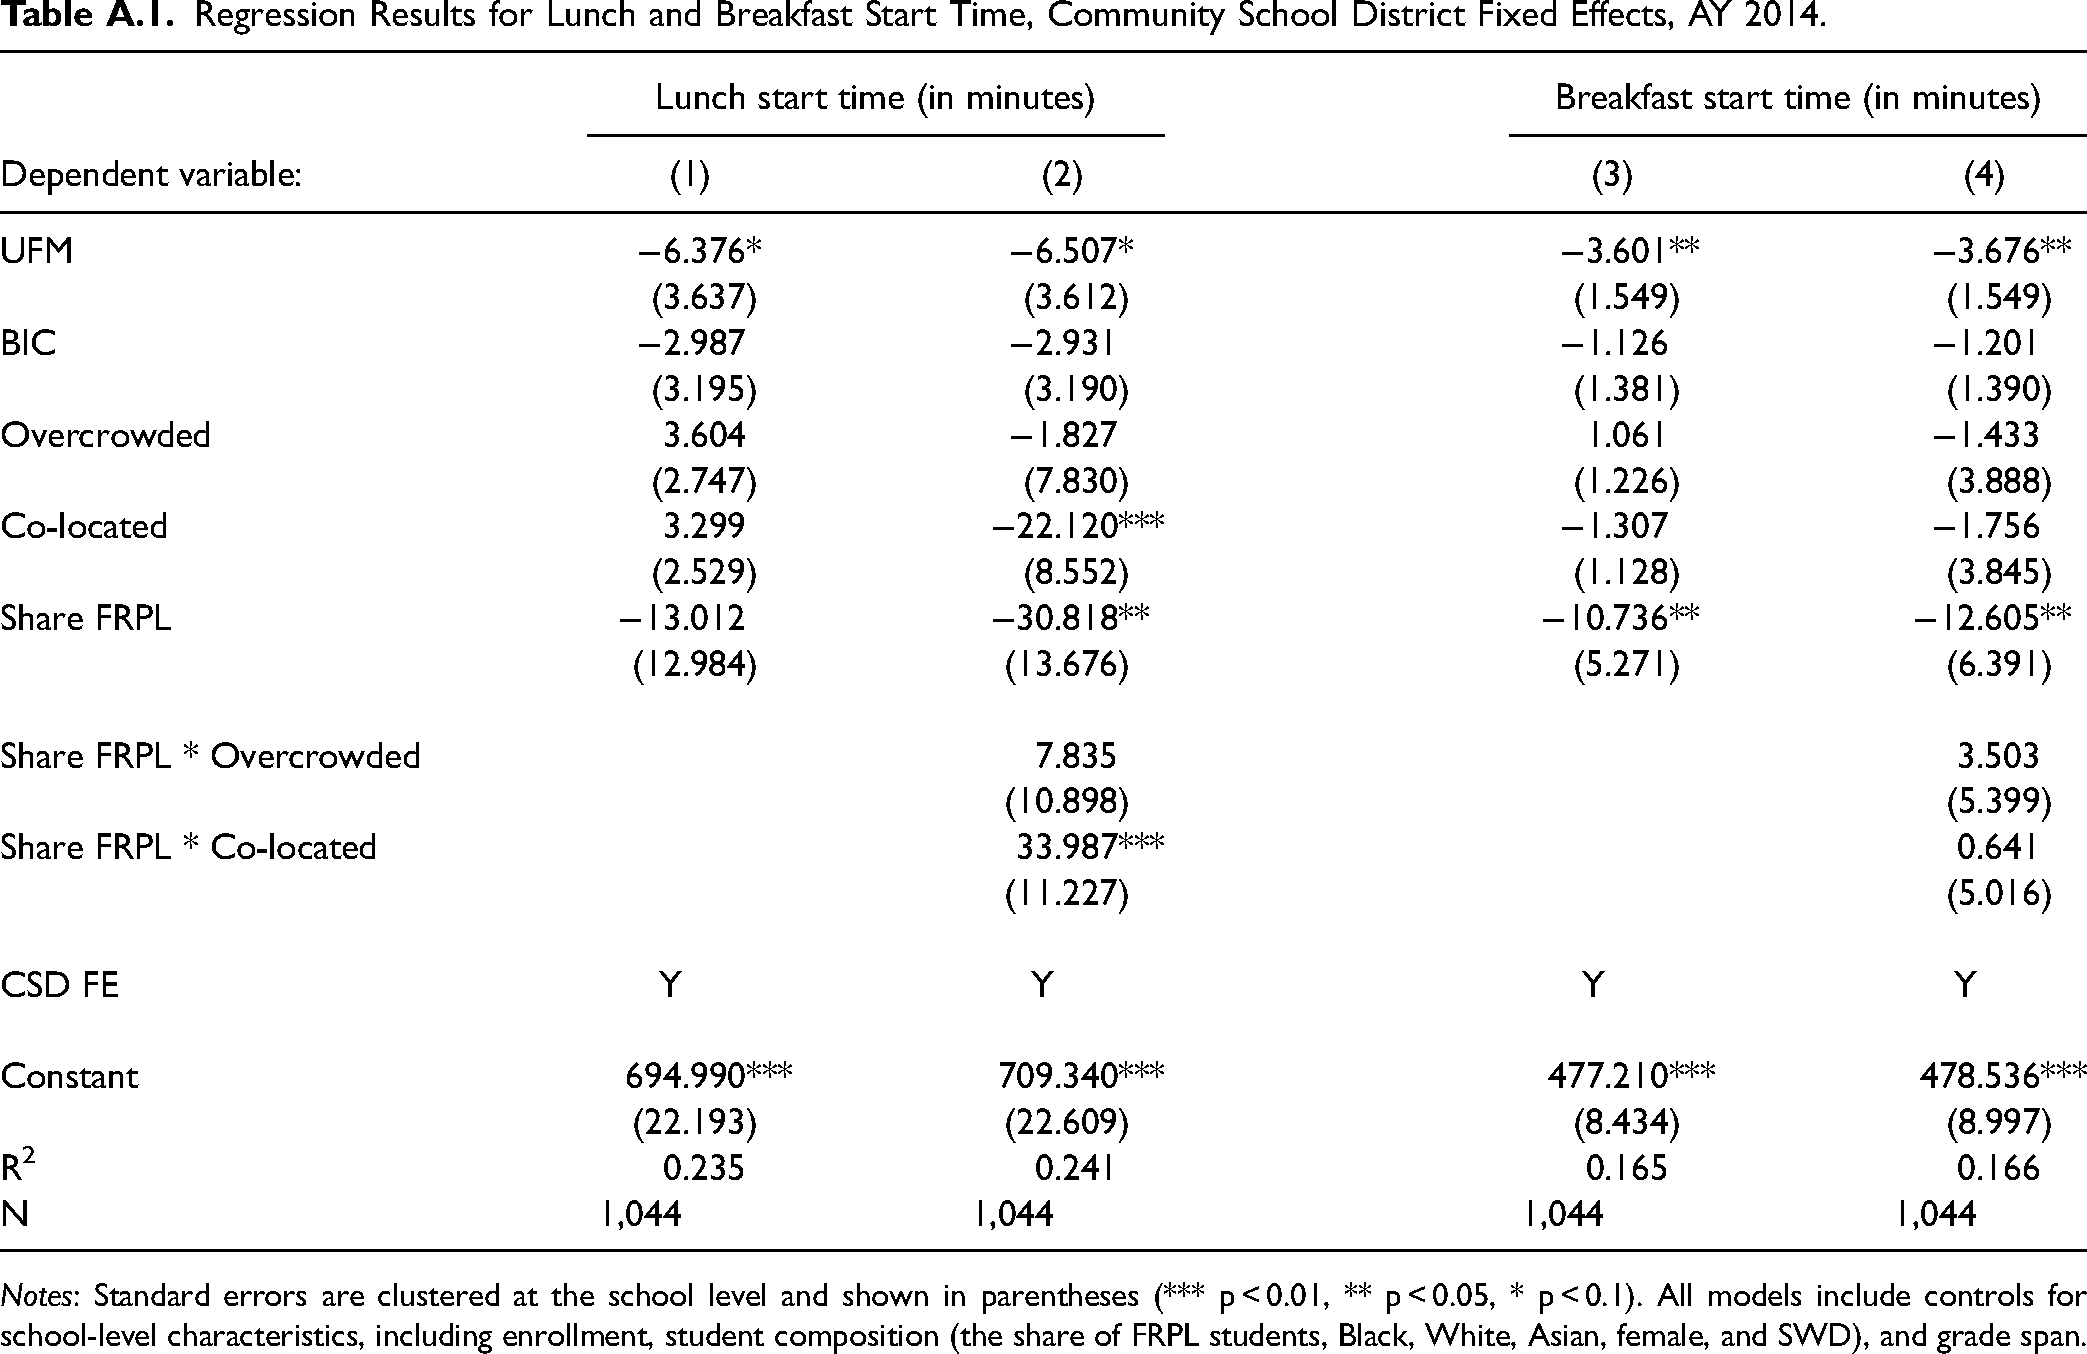
Regression Results for Lunch and Breakfast Start Time, Community School District Fixed Effects, AY 2014.
| Dependent variable: | Lunch start time (in minutes) | Breakfast start time (in minutes) | |||
|---|---|---|---|---|---|
| (1) | (2) | (3) | (4) | ||
| UFM | −6.376* | −6.507* | −3.601** | −3.676** | |
| (3.637) | (3.612) | (1.549) | (1.549) | ||
| BIC | −2.987 | −2.931 | −1.126 | −1.201 | |
| (3.195) | (3.190) | (1.381) | (1.390) | ||
| Overcrowded | 3.604 | −1.827 | 1.061 | −1.433 | |
| (2.747) | (7.830) | (1.226) | (3.888) | ||
| Co-located | 3.299 | −22.120*** | −1.307 | −1.756 | |
| (2.529) | (8.552) | (1.128) | (3.845) | ||
| Share FRPL | −13.012 | −30.818** | −10.736** | −12.605** | |
| (12.984) | (13.676) | (5.271) | (6.391) | ||
| Share FRPL * Overcrowded | 7.835 | 3.503 | |||
| (10.898) | (5.399) | ||||
| Share FRPL * Co-located | 33.987*** | 0.641 | |||
| (11.227) | (5.016) | ||||
| CSD FE | Y | Y | Y | Y | |
| Constant | 694.990*** | 709.340*** | 477.210*** | 478.536*** | |
| (22.193) | (22.609) | (8.434) | (8.997) | ||
| R2 | 0.235 | 0.241 | 0.165 | 0.166 | |
| N | 1,044 | 1,044 | 1,044 | 1,044 | |
Notes: Standard errors are clustered at the school level and shown in parentheses (*** p < 0.01, ** p < 0.05, * p < 0.1). All models include controls for school-level characteristics, including enrollment, student composition (the share of FRPL students, Black, White, Asian, female, and SWD), and grade span.
Acknowledgements
We thank the NYC Department of Education for providing data and for their support. For data support, advice, and suggestions, we also thank Amy Ellen Schwartz, Meryle Weinstein, Saied Toossi, and Mallory Compton. We thank seminar participants at the Maxwell School of Syracuse University, and participants at the APPAM and AEFP conferences for useful comments on previous drafts. The opinions expressed are those of the authors and do not represent views of the NYC Department of Education.
Declaration of Conflicting Interests
The authors declared no potential conflicts of interest with respect to the research, authorship, and/or publication of this article.
Funding
The authors received no financial support for the research, authorship, and/or publication of this article.
Supplemental Material
Supplemental material for this article is available online.
Notes
Author Biographies
References
Supplementary Material
Please find the following supplemental material available below.
For Open Access articles published under a Creative Commons License, all supplemental material carries the same license as the article it is associated with.
For non-Open Access articles published, all supplemental material carries a non-exclusive license, and permission requests for re-use of supplemental material or any part of supplemental material shall be sent directly to the copyright owner as specified in the copyright notice associated with the article.