
Abstract
This study builds on the long-identified gap between the marketing industry and marketing academia. The research investigates the relationship between resource-based factors and marketing faculty’s intention to use marketing analytics technology. The theoretical framework for this study is the concerns-based adoption model (CBAM). Resource-based factors explored included technical support, managerial support, financial support, and time. The methodology included a randomized sample of Association to Advance Collegiate Schools of Business (AACSB) marketing faculty, and the statistical analysis used was multiple regression. Perceived technical support, time to integrate technology, and administrative support are all related to the intention to use marketing analytics technology. Overall, these results indicate that administration within AACSB business schools should consider the resources faculty need to adopt marketing analytics technology into the marketing curriculum, and faculty should consider methods to advocate for such resources.
The importance of marketing analytics is well understood. However, there is still a gap in integrating marketing analytics tools and technology into the marketing curriculum. Business schools across the United States have lagged in serving the marketing analytics needs of the industry, and the integration of analytics into marketing education has been sporadic at best (LeClair, 2018; Spiller & Tuten, 2015; Turel & Kapoor, 2016; Wilson et al., 2018). As LeClair (2018) points out, “Having moved beyond asking whether it is necessary to integrate analytics in the marketing curriculum, we are now considering the best ways to do so” (p. 6). According to Wilder and Ozgur (2015), “the key to a successful analytics program for business students is in the implementation” (p. 185). The understanding of the importance of marketing analytics integration has been written about and identified for well over a decade (Mintu-Wimsatt & Lozada, 2018; Pilling et al., 2012; Schlee & Harcich, 2010). The marketing analytics and curricula integration identification leads to this study’s central research question:
Building off Kurtzke and Setkute’s (2021) practice-informed model for analytics capacity in marketing education, this study aims to identify what faculty need to integrate marketing analytics tools into the marketing curriculum with an explicit emphasis on resource availability. The rationale for focusing on resource availability focuses on the concerns-based adoption model (CBAM). CBAM consists of seven stages of concern for the individual teacher (Schoepp, 2004). The CBAM stages progress from awareness through technology integration (Schoepp, 2004). In the case of marketing analytics, there is an understanding of the importance of marketing analytics technology which represents Stages 0, 1, and 2 in the CBAM model and is covered in depth further in the article. However, there remains a gap in integrating such technology into the marketing curriculum, representing Stage 3 in the model. Thus, this research concentrates on Stage 3 of the CBAM model, which considers the task of technology adoption and focuses on the best use of resources, information, and time (Schoepp, 2004).
The specific focus on resources needed to adopt marketing analytics technology into the marketing curriculum helps to bridge the theory–practice gap and increase students’ employability (Kurtzke & Setkute, 2021; Wilson et al., 2018). To date, there is a paucity of research focused on barriers specific to resource availability. Resource availability is critical regarding the logistical and personal costs individual faculty take to adopt the technology. Many business schools need more resources to train faculty and students in the form of software, training, time, and other logistical resources for adopting marketing technology (Schlee & Harich, 2010). To meet the needs of the industry, educators must find ways to align curriculum with industry needs, and universities must give educators the resources to do so. This research aims to bridge this gap and offers practical recommendations for faculty and administration, specifically focusing on the types of institutional support (resources) needed. Specifically, this research aims to understand which resource barriers are related to the intention to use marketing analytics tools for Association to Advance Collegiate Schools of Business (AACSB) marketing faculty. The following are the research questions guiding the study.
Research Questions
Marketing Analytics and Key Definitions
Marketing analytics tools include but are not limited to research tools, web tools, dashboards, statistical analysis tools, social media, email marketing tools, and customer relationship management (CRM). The uses for marketing analytics, like the number of tools available, are also vast. Marketing analytics can be used to identify patterns in customer behavior, predict future outcomes, identify trends, measure the effectiveness of marketing strategies, and optimize marketing mix decisions (Chou et al., 2022; Harrigan & Hulbert, 2011; Kumar et al., 2020; Mehralian, 2022; Toubes et al., 2021; Wedel & Kannan, 2016). Other common uses of marketing analytics are customer segmentation and market basket analysis (France & Ghose, 2019). It is important to note that marketing analytics is, as other researchers have pointed out, a diverse field ranging from traditional marketing to statistics (France & Ghose, 2019). Of particular importance is to note that marketing analytics and statistics, although they can overlap, are different. Statistics is widely defined as using the scientific process to validate number theories (Diggle et al., 2011). The interdisciplinary and broad scope of marketing analytics makes the analytics term difficult to define concisely.
While there is no consensus definition of marketing analytics within the literature, this study adopts the Wedel and Kannan (2016) definition that “marketing analytics involves collection, management, and analysis—descriptive, diagnostic, predictive, and prescriptive—of data to obtain insights into marketing performance, maximize the effectiveness of instruments of marketing control, and optimize firms’ return on investment (ROI)” (p. 98). Other critical definitions within this study are marketing analytics technology and marketing analytics tools. As identified by SAP, massive data sets cannot be analyzed to discover, interpret, and share new insights without technology tools (SAP, 2023). Thus, technology and tool are interchangeable throughout this article. Finally, this paper discusses resources supporting technology adoption within the curriculum and refers to professional and personal-based resources.
Industry and Academy Alignment
It has been said that technology has transformed the way marketers use technology, and technology has also transformed the way businesses use marketing (Crittenden & Crittenden, 2015). Researchers have identified a need for more technology use in marketing curricula for over two decades. For example, in 2002, the AACSB (2022) identified, in a report, a need for marketing graduates to know how to leverage technology to advance marketing operations and strategies (Schlee & Harich, 2010). Furtheremore, researchers have identified an overall digital paradigm shift in business schools (Schlegelmilch, 2020). A gap still exists between academics and practice, even with the long-identified need for integration. Marketing education researchers have identified a widening gap between marketing practice and what is being taught within marketing education (Duffy & Ney, 2015; Kurtzke & Setkute, 2021; McArthur et al., 2017). This gap will only continue to widen as more technology and uses for data enter the marketing space. As a discipline, marketing will continue to be transformed by technology, digitization, and data (Kurtzke & Setkute, 2021).
The transformation of marketing has led to a shift in worker needs. However, the limited availability of skilled workers was identified as a barrier to implementing analytics within some organizations (Speier-Pero & Schoenherr, 2020). There is a continuously increasing demand for marketing graduates and entry-level job candidates to understand, analyze, interpret, and make decisions based on large amounts of customer data (Kim, 2019; Wedel & Kannan, 2016). Feedback from business executives has indicated a growing need for a workforce with analytical skills. However, a lack of skilled analysts is a barrier for corporations implementing robust analytics platforms (Schoenherr & Speier-Pero, 2015).
A survey of recruiters attempting to hire skilled marketers found that 71% have encountered a need for more workers (Lasonde, 2019). In a survey of 500 marketing managers, 30% could relate to the statement that “finding marketers with the right skills is a nightmare” (Simpson, 2015, para. 1). Marketing students need to have analytical skills and be familiar with technology-supporting analytics. In a field where digital and mobile technologies are paramount, marketing graduates must be savvy with data (Kim, 2019; Schlee & Karns, 2017; Wedel & Kannan, 2016).
The reason for utilizing analytics in the workplace is apparent, as organizations that utilize data analytics perform better (Zhao & Zhao, 2016). As a result, there is little evidence that the need for data analysts and data scientists will soon resolve itself (Violino, 2019). Business schools must address this gap between demand and talent supply for analytics-savvy marketers. Business schools should be proactive in helping address the shortage, as candidates with data science and analytics skills are being given preference by 69% of employers (Sethi et al., 2021). However, only 23% of university leaders indicated that their graduates have those skills (Sethi et al., 2021). Business schools across the United States have struggled to serve the analytical needs of business industries, with the integration of analytics into marketing education being sporadic at best (Schlee & Harich, 2010; Spiller & Tuten, 2015; Turel & Kapoor, 2016; Wilson et al., 2018).
Technical knowledge, including skills, technologies, and techniques, supports the theoretical foundations, course content, and marketing techniques taught within the curriculum (LeClair, 2018). The need to increase technological tools originates from several places. Increased technology integration in the classroom stems from the job market, professional organizations, and students (Padgett & Conceição-Runlee, 2000). Furthermore, researchers have indicated that marketing curricula should incorporate marketing analytics into their overall curriculum to help give students a competitive advantage and improve their career readiness (Iacobucci et al., 2019). To be career-ready at graduation, marketing students should be knowledgeable in highly valued marketing tools and skills (Wilson et al., 2018). For example, understanding marketing analytics and where marketing analytics tools can support various subdisciplines of marketing.
Marketing Analytics Curriculum Integration
Adopting marketing analytics tools and technology within the marketing curriculum is not new. Over a decade ago, researchers identified the need and challenges for marketing educators to incorporate more technical skills (analytical and technology-based) into marketing curricula (Schlee & Harich, 2010). Researchers have long indicated that marketing curriculum, and marketing in general, is going through a considerable shift due to marketing analytics (Iacobucci et al., 2019; Moorman, 2016; Verhoef et al., 2016).
Historically, analytics are more commonly integrated into social media or digital marketing courses (Brocato et al., 2015; Langan et al., 2019; Spiller & Tuten, 2015). However, analytics touches on and can be utilized in nearly every subdiscipline of marketing, including, but not limited to, marketing research, branding, and customer relationship management (see Figure 1). Instead of integrating analytics into many or all marketing classes, business schools have historically operated in a fragmented or silo approach by having standalone marketing analytics courses within marketing education (Kim, 2019). The silo approach is outdated as digital transformation continues accelerating across industries, particularly in marketing (O’Brien, 2022). Furthermore, analytic adoption is no longer the sole function of data scientists alone, analytic capabilities and responsibilities are scattered throughout organizations (Stanton & Stanton, 2009).
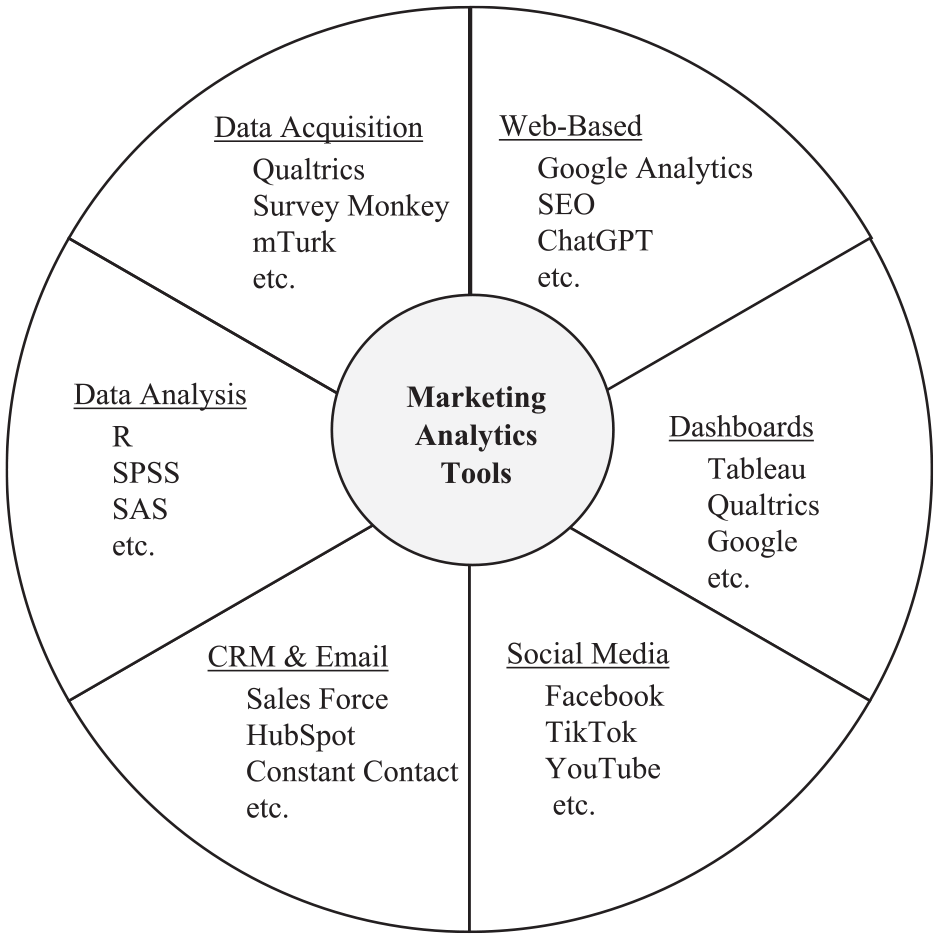
Marketing and Marketing Analytics Tools Selected Top Usage Examples.
Specific Marketing Analytics Tools
There are a significant number of digital resources available for use in marketing analytics. Many researchers have identified and expounded upon the various tools available and how to use them in marketing analytics (Kim, 2019; Schlee & Harich, 2010; Spiller & Tuten, 2015; Weathers & Aragón, 2019). Some marketing analytics tools include but are not limited to, data visualization, data analysis, data collection, content management, and various social media-based tools. Table 1 presents several commonly used marketing analytics tools that support the integration of marketing analytics into the curriculum and specific research on how to integrate the tool or technology into the curriculum.
Common Marketing Analytics Tools & Technology With Implementation Examples.
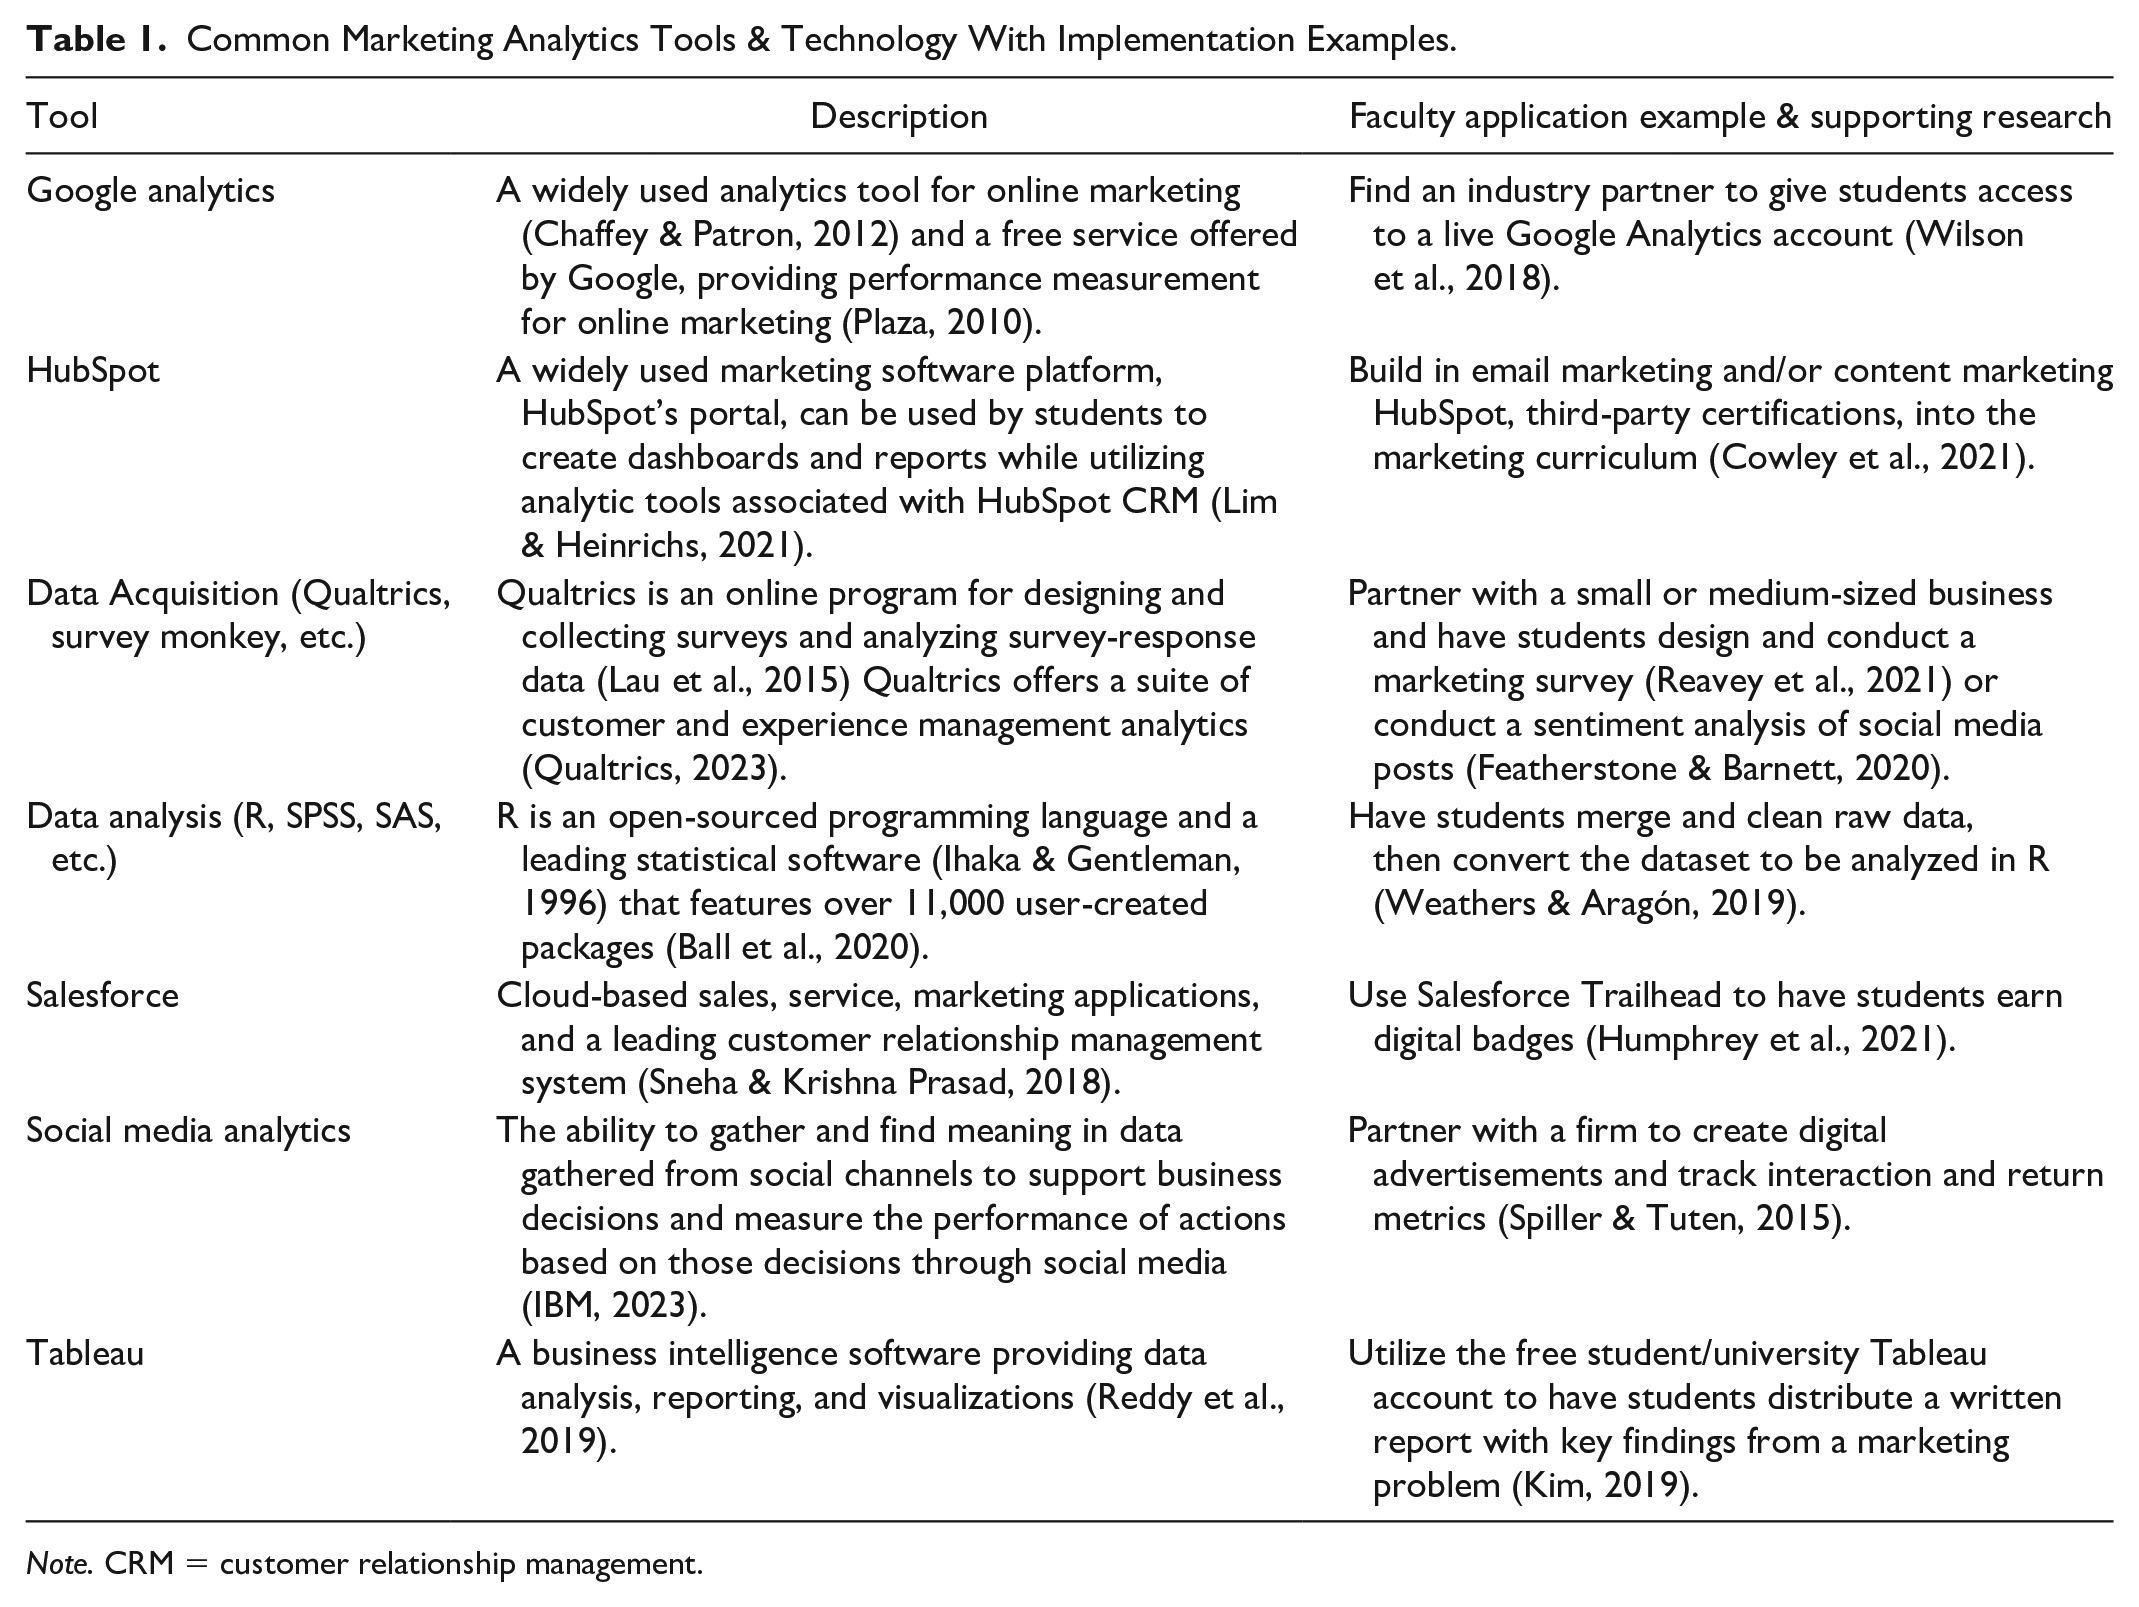
Note. CRM = customer relationship management.
Marketing analytics tools should support the core functions of marketing. The tools and technology listed in Table 1 focus on various marketing analytics sub-areas, including data collection, customer relationship management systems, market research, data analysis, and data visualization, with use not exclusive from one another. For example, a marketer may want to better understand the different types of customers within their organization and look to market segmentation. The marketer could collect consumer data through a Qualtrics survey and then analyze it through a cluster analysis within R or SPSS.
Concerns for Adoption
While technology continues to evolve and integrate into daily lives, many faculty still need to learn to instruct with technology (Belt & Lowenthal, 2020). With the talent supply and demand mismatch of marketing analytics savvy individuals being present in both the marketing industry and the marketing academia, it is time for business schools to shift focus to understand the logistical and administrative-related hesitance for adoption. Research suggests that faculty do not integrate technology into their teaching as much as they could and perhaps should (Bates & Poole, 2003; Koehler & Mishra, 2005; Kukulska-Hulme, 2012).
Concerns, or barriers to adoption, can include factors related to the technology, institutional support, ease of use, and adopters’ attitudes (Butler & Sellbom, 2002). Some of the concerns related to adoption could be related to timing as marketing, as a field, is still transforming due to data, technology, and digitization. As stated by Mintu-Wimsatt and Lozada (2018), “a significant proportion of today’s marketing faculty received their academic training prior to the era of big data (p. 2).” Even so, faculty can complete many certificate and training programs to increase their business analytics skills (Solomon, 2014; Turel & Kapoor, 2016).
Although offering training for faculty can be an excellent first step, requiring or increasing training for faculty will inevitably result in concerns from faculty, as often senior faculty have no incentive to incorporate analytics, and junior faculty are likely focused on research for promotion rather than teaching and curriculum development (Mintu-Wimsatt & Lozada, 2018). Without incentives or resources to support the integration of marketing analytics technology into the curriculum, there will remain a gap between academia and practice. For technology integration to occur, three key factors must exist, which are the willingness to adopt (attitude), proficiency in the technology (skill), and tool accessibility (access) (Altamimi, 2017). More specifically, concerning tool accessibility, institutional support, and the resources needed to adopt new technologies must occur. From this point, this research makes its first assumption based on previous research. Specifically, the underlying assumption is that faculty are aware of the importance of analytics, and marketing analytics technology adoption within the curriculum exists within the greater AACSB marketing faculty community. Within this assumption is that there are understanding, research, and examples of how faculty can enhance their curriculum with analytics learning tools (Mintu-Wimsatt & Lozada, 2018). Thus, resource availability is the next type of barrier (or concern).
Notably, while many of the tools available for use are free from a monetary perspective to the academy and users (e.g., DataCamp, R, HubSpot), there are still costs associated with them. Specifically, there is a resource-based cost. For the professor, there is a direct cost of time required to learn these tools (Spiller & Tuten, 2015). Previous research has shown that this time investment can be even more costly than a monetary cost (Caliendo et al., 2022; Wolcott & Betts, 1999).
In addition to professor costs, there are additional administrative costs. For example, administrative support is needed to provide the faculty members with the requisite time to complete training on top of their other required duties. As discussed below, this administrative support could come in different varieties and incurs financial and non-monetary costs. This research explores the marketing faculty’s perception of resource-based barriers to technology adoption and is grounded in the concerns-based adoption model (CBAM; see Figure 2). The theoretical framework is informed within the next section of this paper through the lens of the CBAM model and speaks to the specific resource-based costs associated with implementing marketing analytics tools.
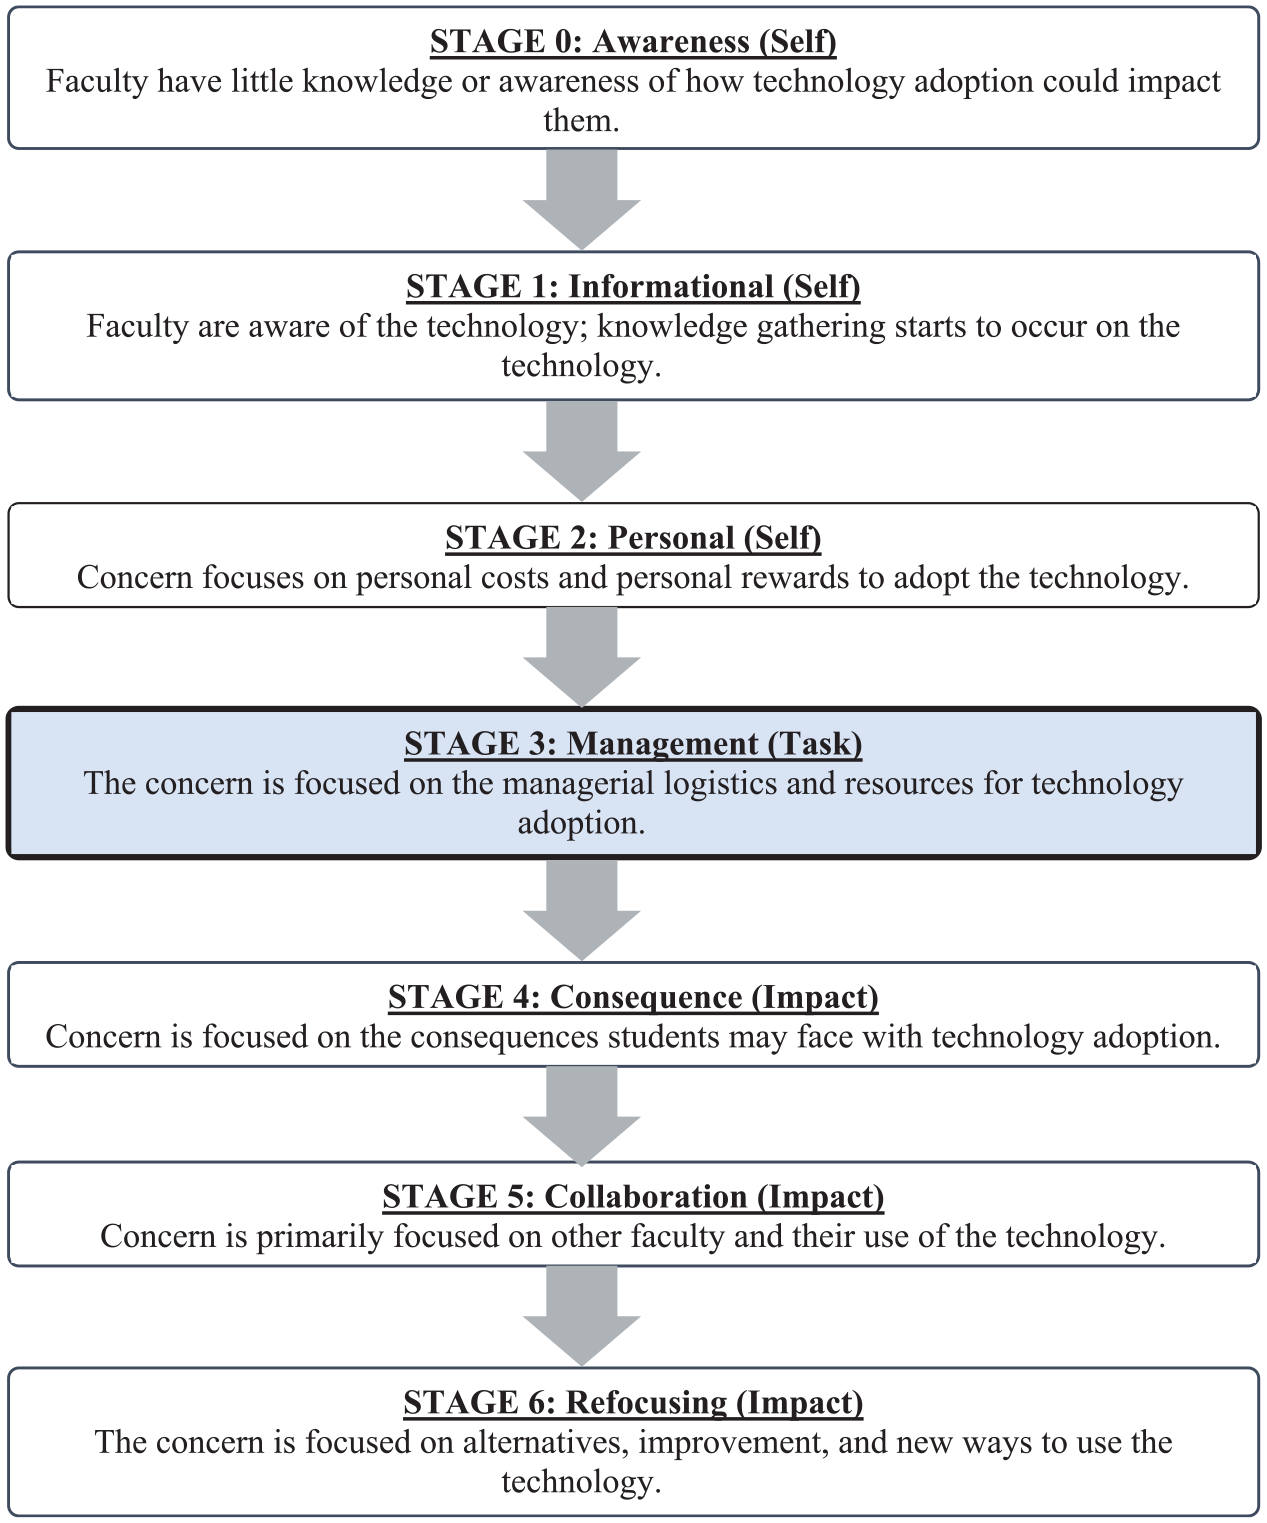
The Stages of the Concerns-Based Adoption Model (CBAM).
Theoretical Framework
Adding marketing analytics and marketing analytics tools into the entire marketing curriculum is still considered a new instructional practice, thus making CBAM an appropriate foundation for this research. CBAM is an empirically grounded and robust theoretical model most often applied to implementing new instructional practices and curricula or introducing innovative curriculum changes (Anderson, 1997; Gabby et al., 2017). The CBAM model is descriptive and predictive, not prescriptive, of teacher attitudes and behaviors in learning to use new classroom ideas, materials, and practices (Anderson, 1997). CBAM is both a theoretical framework and a methodology for investigating concerns about adopting and using technological innovations in educational settings (Al Masarweh, 2019). As described in the introduction, this research focuses on CBAM as the conceptual framework with a specific focus on Stage 3 of the model.
The CBAM Model is an instrument that contains three essential tools. One of the tools is the Stages of Concern (SOC), which consists of seven phases and is the focus of this research (see Figure 2; Schoepp, 2004). Stage 3 of the model is where the adoption of a new pedagogical method, idea, or tool shifts to focus on the task of implementation, which is where we hypothesize the holdup for adoption lives. Such examples of task-focused elements, or resources, include time requirements to adopt and implement new technology, financial resources, administrative support, and technological support. This research aims to identify if resources in the form of perceived administrative support, time support, financial support, and technological support are related to the marketing faculty’s intention to adopt marketing analytics tools.
Technical Support
LeClair (2018) pointed out that “analytics education requires more supporting software and access to computing power” (p. 10). Research has found that technical support is critical in adopting and integrating technology into the classroom (Altamimi, 2017). Importantly, with appropriate professional development and technical support, faculty are typically willing to improve their technology skills (Al-Sarrani, 2010).
Technology adoption, updating, or installation often requires cooperation and consultation with technical support staff (Ali & Murthy, 2010). The reliability of technology has long been a concern for technology adoption. Specifically, researchers found that support services significantly influenced faculty technology adoption (Butler & Sellbom, 2002). Support services include campus support as well as software support.
Time
Having adequate resources for marketing faculty to integrate analytics technological tools into the curriculum goes beyond technical resources. Building a curriculum, analyzing data, providing feedback, and other basic pedagogical tasks also take time (LeClair, 2018). In a 2002 study, the second biggest concern reported by faculty when adopting new technology was the time it took to learn the new technology (Butler & Sellbom, 2002). Another pioneering study for technology adoption addressed the need for the administration to consider the time it took to learn new skills, develop new course materials, and adjust their (faculty’s) attitude toward adopting technology (Rogers, 2000). Appropriate administrative support can help faculty overcome feelings of being pressed for time when working with technology (Petherbridge, 2007).
Financial Support
Financial support is material support from the administration within an institution (Altamimi, 2017). Financial support, in the case of this article, is defined as spending money on what it takes to adopt technology, which can include paying for the technology, training, subscriptions, and so on. In a study from 2000, researchers indicated that “funding is often a major focus of technology planning” (Rogers, 2000, p. 19). Implementing new technologies for the classroom will incur several costs, including hardware and software purchases, licenses, server space, and salaries (Surry & Ensminger, 2006). A crucial part of analytics education is analyzing big data; forging key partnerships and/or purchasing data sets can be a financial undertaking for a university (Clayton & Clopton, 2019). Technological resources are one of the impactful ways to influence teachers’ pedagogical use of technology (Yildirim, 2007).
Administrative Support
Another challenge on the resource side of technology adoption comes in the form of support staff. Several studies have found a lack of administrative support can be a barrier to faculty implementation of technology in the classroom (Butler & Sellbom, 2002; de Boer & Collis, 2001; Fabry & Higgs, 1997; Frey & Donehue, 2003; Jones et al., 2002; Pajo & Wallace, 2001; Petherbridge, 2007; Rogers, 2000; Zahay et al., 2019). Many campus faculty development centers need more time, expertise, and training to help faculty (Wynants & Dennis, 2018). Institutional support is essentially the approval for faculty to complete a task by providing the necessary resources to complete the task at hand (Srivastava & Lee, 2005). Availability and equality of access to technology resources by faculty, students, and administrative staff are essential (Buabeng-Andoh, 2012).
Hypotheses
Method
This model, based on the CBAM model and framework (see Figure 2), explores the perceptions of marketing faculty and potential resource-based barriers regarding adopting marketing analytics technology. The focus is on Stage 3 of the CBAM model and emphasizes time, financial, technical, and administrative support. This article focuses on the perceptions of faculty-specific resources that an institution controls, and thus, we are collecting and comparing results from faculty as opposed to other stakeholders such as the AACSB. The participants for this study are AACSB marketing faculty recruited through random selection.
Sample and Procedure
Participants for the study were 121 marketing faculty randomly selected from the United States AACSB business school population. The institutional review board (IRB)-approved protocols and random sampling methodology. Participant recruitment occurred via direct email invitation from the research team utilizing Constant Contact’s email marketing software tool. A random list of all AACSB-accredited business schools in the United States in 2022 is shown on the AACSB website and was used as the source for sampling. In Excel, a random number generator assigned a number to each school then schools were sorted in order of largest random number to smallest. Starting at the top of random assorted AACSB institution list, researchers compiled a list of 500 faculty who identified, in their title, as teaching within marketing or marketing subdiscipline (such as sales or consumer behavior) on their university website. The 500 random faculty were then sent the recruitment email through Constant Contact with a link to the survey hosted on Qualtrics. A total of 500 faculty were sent the survey, with 19 recruitment emails bounced (3.8%), resulting in 121 usable surveys for a participation rate of 24.2%.
Measures
All constructs for this study were measured using a 5-point Likert-type scale ranging from 1 (strongly disagree) to 5 (strongly agree). All items were presented in English and adapted from published sources (e.g., Teo, 2011). Intention to use was adopted from Teo (2011) and consisted of three items specifically focused on behavioral intention to use marketing analytics tools. The three items included the intention to use, the expectation to use, and the plan to use marketing analytics tools in the future. This latent construct is defined as the intention of an instructor to use a marketing analytics tool in the future. Previous research has indicated behavioral intention, or intention to use (ITU), to be closely linked to actual behavior (Hu et al., 2003; Mathieson, 1991; Teo, 2011). Utilizing ITU instead of actual technology adoption supports the purpose of this paper, which is to understand what resource barriers (time, money, and support) exist for faculty when adopting marketing analytics tools.
Technical support, another latent construct, consisted of three items specific to timely, personalized, and accessible assistance adopted and modified to fit marketing analytics tool-specific questions from Teo (2015). Supervisor support, financial support, and time support were all single items. Literature supports the management and personal-based resource variables included in this model. Experience, measured in years of teaching and age, were the study’s control variables. With the analytics expertise of participants validated by AACSB qualifications, the measurement instrument identifies specific analytics tool usage (see Table 4) then the survey transitions to the faculty’s intention to use marketing analytics tools.
Results
Statistical Assumptions
Multiple regression analyses and assumptions about the data were tested. The assumption of independent errors was nearly at the recommended two (Durbin-Watson value = 1.98). An analysis of standard residuals showed that the data contained no spurious outliers (std. residual min = -1.75, std. residual max = 2.94). Tests to see if the data met the assumption of collinearity indicated that multicollinearity was not a concern. VIF statistics ranged from 1.15 to 2.04, and tolerance statistics ranged from .49 to .87, indicating that the assumption of collinearity was satisfied. The histogram of standardized residuals indicated that the data contained approximately normally distributed errors. For normality, the P-P plot for standardized residuals showed no indication of a violation of normality. Finally, the scatterplot of standardized predicted values indicated that the data met the assumptions of linearity and homogeneity.
Descriptives
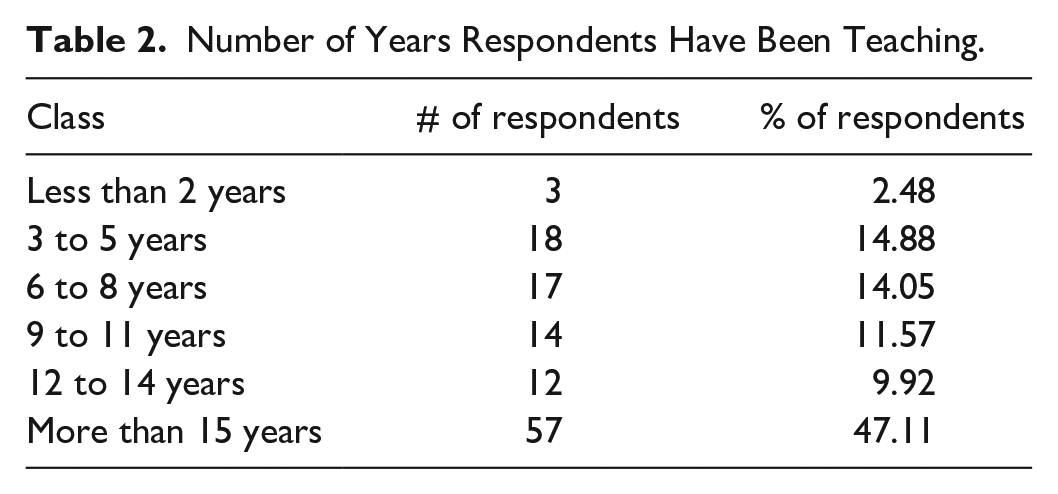
Participants first considered a series of questions about their marketing background. Participants identified how long they had been teaching undergraduate marketing courses and were given six multiple-choice options (see Table 2). The six options were “Less than 2 years”; “3 to 5 years”; “6 to 8 years”; “9 to 11 years”; “12 to 14 years”; or “more than 15 years”. The lowest number of years identified (“Less than 2 years”) was coded as “1” and the highest (“more than 15 years”) as 6.
Number of Years Respondents Have Been Teaching.
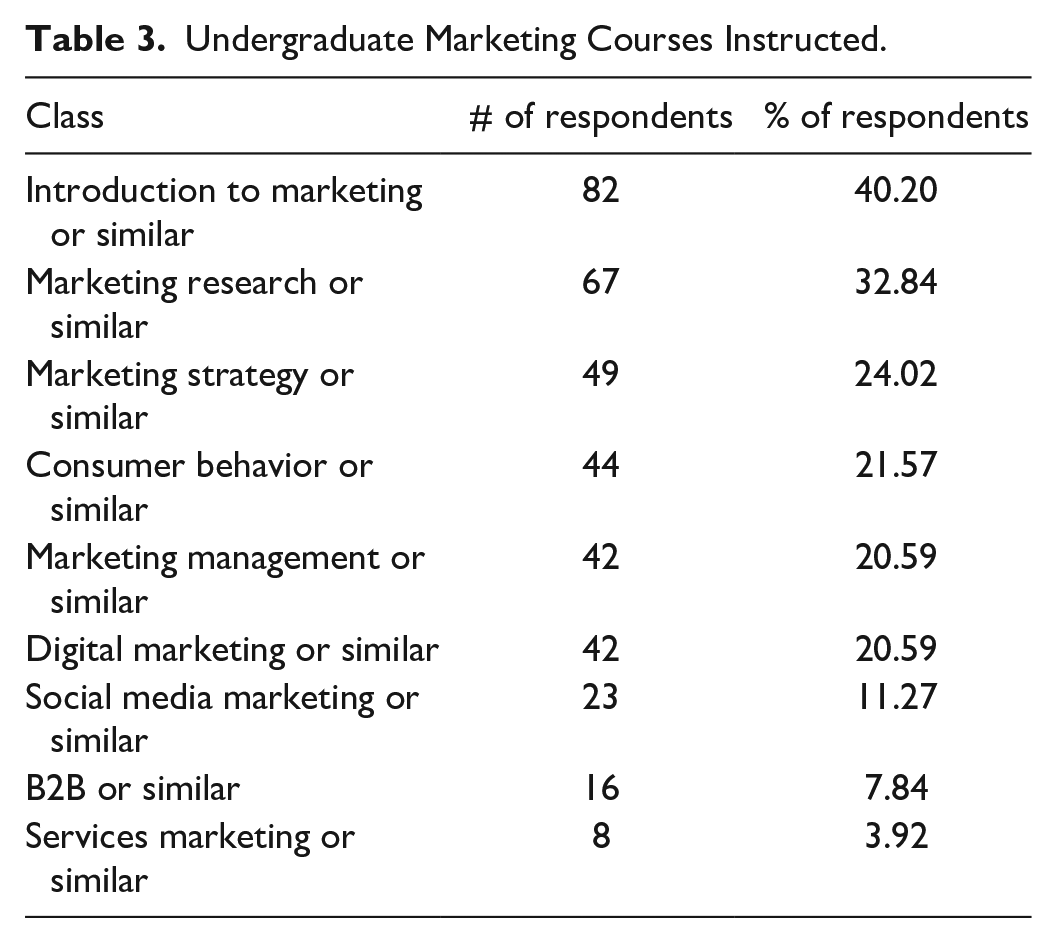
Participants answered which undergraduate marketing courses they taught via a select all-that-apply question developed by the researchers from the common AACSB curriculum (see Table 3). Participants were also given the “other” option for text entry of alternatively titled marketing courses. Marketing courses identified more than two times in the “other” box included advertising, courses focused on branding, international or global marketing, professional sales or selling, retail marketing, and sports marketing.
Undergraduate Marketing Courses Instructed.
Respondents answered questions about using seven commonly used marketing analytics tools/tool categories for tool-specific adoption. Each question read as: “How frequently do you currently incorporate [marketing analytics tool] into your marketing class(es)?” The marketing analytics tools/marketing analytics tool categories that would fit into the brackets of each question with their specific wording are identified in Table 4 and included: (a) Qualtrics, Survey Monkey, or another survey tool; (b) Google Analytics; (c) Social Media Analytics; (d) HubSpot; (e) Salesforce; (f) Tableau; and (g) R, SPSS, or another statistical tool. Respondents could also enter text through the “other” option, for which 11, or 9.09%, of respondents input text (see Table 4). Additional tools identified more than once in the “other” text input option included IBM Watson, Excel, SQL, and Sawtooth. Table 5 shows descriptives for tool-specific frequency of use.
Marketing Analytics Tools Currently Being Used in the Classroom.
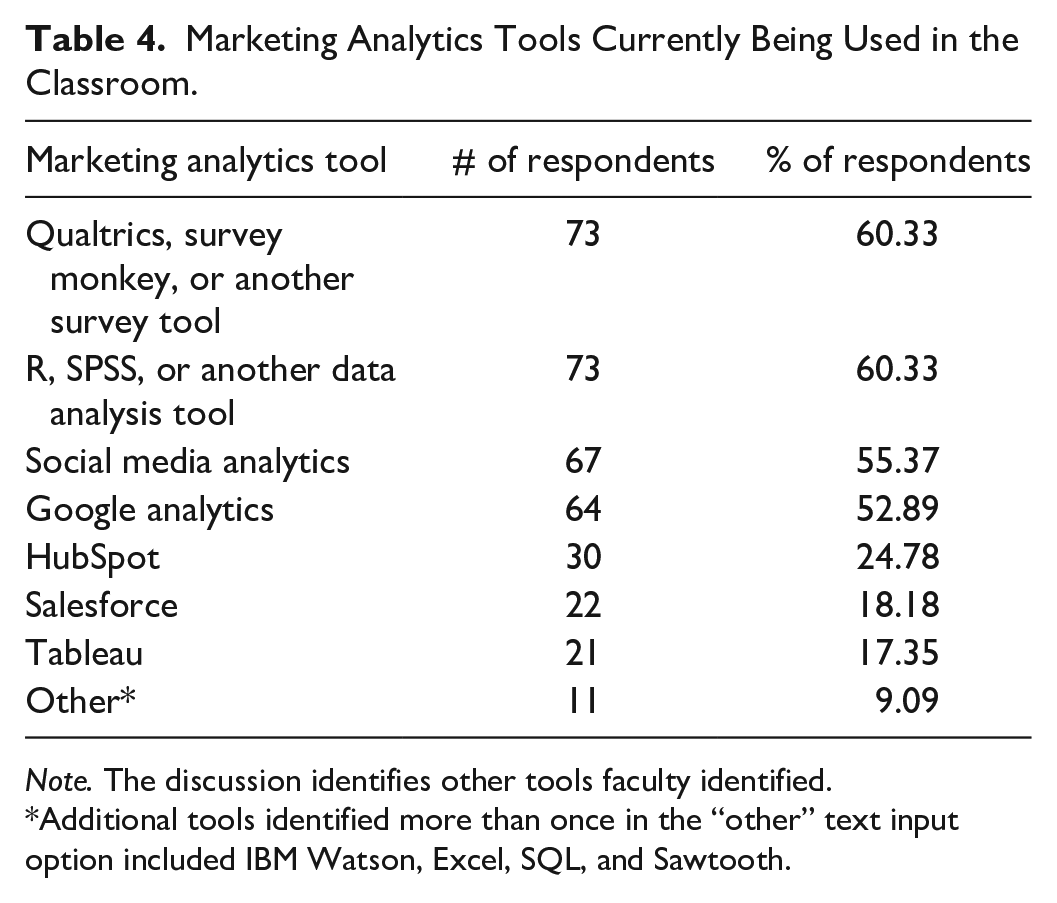
Note. The discussion identifies other tools faculty identified.
Additional tools identified more than once in the “other” text input option included IBM Watson, Excel, SQL, and Sawtooth.
Frequency of Use Descriptives for Specific Marketing Analytics Tools in Courses.
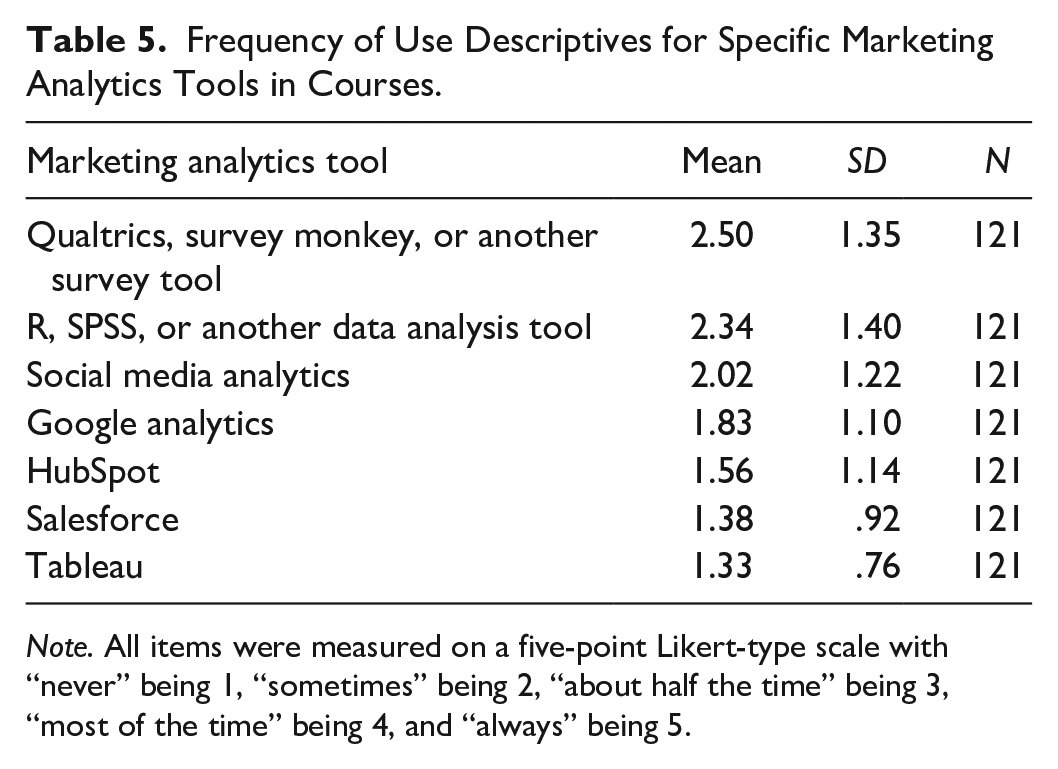
Note. All items were measured on a five-point Likert-type scale with “never” being 1, “sometimes” being 2, “about half the time” being 3, “most of the time” being 4, and “always” being 5.
Regression Analysis
SPSS 28.0.0.0 was used to run correlation and multiple regression analyses to examine the relationship between faculty’s intention to use marketing analytics tools and resource-based predictors utilizing the following regression model:

Specifically, faculty’s perceived administrative encouragement, faculty’s perceived financial support, faculty’s perceived time support from their direct supervisor, and faculty’s perceived technical support to adopt marketing analytics tools were all considered predictors (see Table 6). Age and experience were control variables in the model. Table 7 shows individual items and latent constructs.
Regression Analysis for Support Resources and Intention to Use.
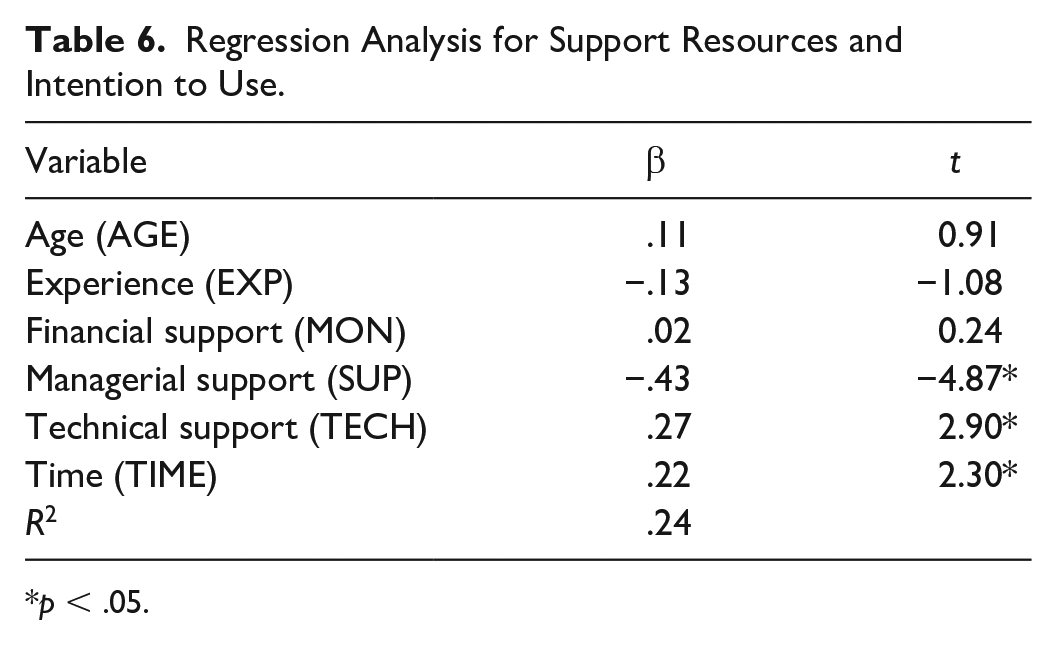
p < .05.
Individual Items and Latent Constructs With Corresponding Items.
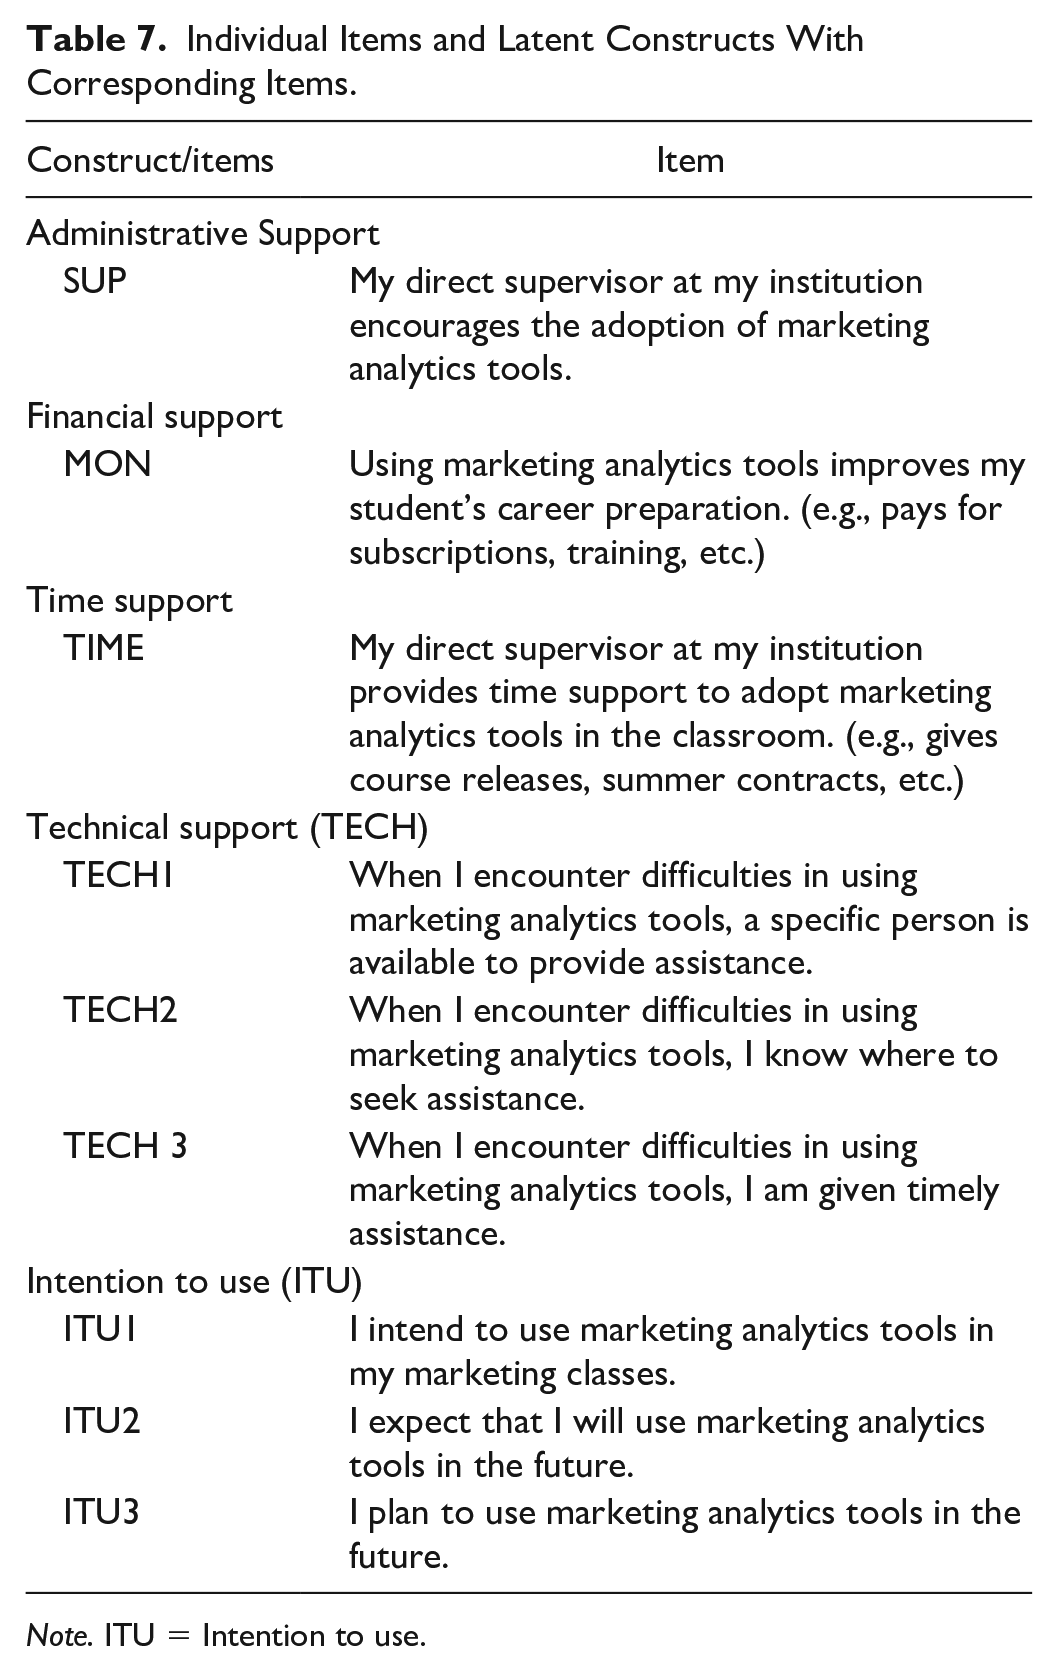
Note. ITU = Intention to use.
The multiple regression model with all six predictors produced
Discussion
The results from this study provide some unique findings. First, in support of H1, we found that faculty perception of administrative support impacts faculty intention to adopt marketing analytics tools. This relationship was negative. With the negative relationship, it could indicate that although faculty are encouraged by the Dean’s Office to adopt marketing analytics technology, they are not likely to do so without additional resources. Conclusively, administrative support is insufficient and could deter faculty from adopting marketing analytics technology if other resources, such as time and technological support, are not available.
Furthermore, we found support for both H3 and H4; the faculty’s concerns about time and technical support impact the intention to adopt marketing analytics technology. However, surprisingly support for H2 was not found: Financial support did not impact the intention to adopt. Furthermore, these findings show, unintuitively, that age and experience do not impact the intention to adopt marketing analytics tools in the classroom.
Implications for Marketing Educators
Like other research studies on marketing analytics curriculum, the researchers strongly believe there is no “one-size-fits-all” model for building analytics into marketing education (Cegielski & Jones-Farmer, 2016). However, the integration must occur across the marketing curriculum, not in a silo approach. The evolving, data-centric environment in marketing sets the stage for business school reform, and a shift in faculty development as more and more platforms and sources of content continue to emerge. Marketing faculty, as supported by an informal query to marketing scholars in 2022, recognize the importance of marketing analytics in the marketing curriculum (Crittenden, 2022). Thus, the next steps in the form of understanding barriers must continue.
Using marketing analytics tools in the marketing curriculum, although it presents concerns for some, can be relatively simple to incorporate into courses if the resource support is there. However, for the integration of marketing analytics tools into the curriculum to be seamless, faculty need support in the form of resources. Notably, this study’s findings focus on the faculty’s perceived support. So, the following sections provide specific and actionable ways the administration can increase this perception. As found in this study, in summary, two main areas of support can encourage the adoption of marketing analytics tools: time and technical support. Again, although administrative support was significant, it was negatively indicating the potential for other resources, such as time and technical support, to be most important.
Time and Technical Support
To increase the adoption of new technology, faculty must perceive that they have time. To this end, we recommend the following. First, we recommend providing faculty with time to facilitate the adoption of analytics technologies. This time support can occur in many ways. For example, giving faculty workload reductions or ensuring that faculty do not have scheduled meetings when technology-specific webinars occur. Furthermore, faculty could be encouraged to learn new technologies with reduced service requirements for a semester. For example, taking a semester off from a committee in exchange for completing a semester-long training on new technology would likely increase faculty adoption.
Administrative Support
To increase faculty perception of administrative support, we first recommend that administrators encourage faculty to adopt marketing analytics tools and also provide time and technical support to do so. One specific method for encouragement is through specific marketing analytics workshops. For example, the American Marketing Association provides webinars on different analytic tools. The administration could provide access to these webinars. Further, the administration should ensure that all necessary resources (hardware, software, licenses, training, etc.) are available to faculty, integrate analytics throughout the marketing curriculum, and recognize faculty who implement analytics in the classroom. There are additional steps that the administration can take to confirm that faculty perceive that they have the administration’s support for pursuing marketing analytics technologies. For example, from a technical perspective, support staff who can support necessary hardware and software and respond to faculty questions promptly are needed but alone are not enough.
Limitations
This research fills a critical gap in marketing education research and has many strengths or delimitations. However, limitations do exist. The use of self-report measures, definitions, tools selected for the study, and variable/theoretical foundation are all limitations. First, one of this study’s limitations is using a self-report measure and, consequently, self-report data. Although self-report data are prevalent and provide a richness of information and easy interpretability, there are limitations to using self-report data in any study (Paulhus & Vazire, 2007). Researchers have long discussed the limitations of self-report measures. Social desirability bias is a potential source of over-reporting (Sallis & Saelens, 2000).
Another limitation of this study is the operational definition the researchers used for marketing analytics tools and the specific tools introduced in the survey. As discussed throughout the article, marketing analytics is a broad term encompassing many subdisciplines within marketing and many disciplines outside of marketing. Identifying a list of tools in the survey could have changed respondents’ perceptions of marketing analytics. Study participants were assumed to be experts in marketing based on AACSB faculty qualifiers. A potential limitation exists with the assumption that the participant understood that classroom use differs from certification exposure.
Furthermore, we acknowledge that the scale, although validated (Konstantinidou & Scherer, 2022; Teo, 2011), may have made participants unsure of how to respond. For example, if a faculty member uses a specific technology only once in a 15-week semester, they may have felt unable to respond that they use it always. Future research should provide a more nuanced understanding of how often faculty use these technologies within a semester timeframe and any applicable interaction effects.
Finally, regarding this study’s focus and theoretical foundation, the researchers believe there are potentially other variables to consider with technology adoption for marketing analytics beyond resource-based variables. A primary assumption for this research is that most marketing faculty have passed through Stage 0 (Awareness) and Stage 1 (Informational) of the CBAM Model. Specifically, the assumption is that most faculty have enough information and awareness about marketing analytics and the value of marketing analytics tools to move toward adopting them in the classroom. It is reasonable to assume that other variables, such as personality traits, could impact marketing technology integration in the marketing curriculum.
Future Research and Conclusion
In terms of financial support, because it did not influence the intention to adopt, the age-old solution of throwing money at the problem may not be the best option for increasing the adoption of analytics tools. The problem of analytics integration cannot be solved by simply providing faculty with financial support or administrative support. For faculty members, the time to complete training and to learn technology well enough to be competent to answer the students’ questions about them is significant. More importantly, it may be better to support business school faculty by providing technical support via training or an in-house technological support group and time to do so. Future research should consider the relationship between the variables studied here as well as additional external variables such as personality.
Another key finding was the negative effect of managerial support. The negative effect suggests that encouraging faculty to adopt new technologies in the classrooms is not enough to increase adoption and may actually decrease adoption if other resources are not provided. Also, these results show that age and experience do not impact the likelihood of adopting new technologies, so it is essential to provide the same encouragement equally across the board in the modernization of marketing curriculum to include aspects of analytics in all courses (Zahay et al., 2022), and not assume that you cannot “teach an old dog new tricks.”
Finally, as with most academics, time is a significant barrier to adoption. Study results display that time support (i.e., through summer support) can positively impact the likelihood of adopting new technologies. For administration, providing the time required for faculty to learn and implement new technologies in their courses is paramount for a successful implementation. A practical implication for faculty is advocating for these resources, such as course releases or summer teaching stipends.
Footnotes
Declaration of Conflicting Interests
The author(s) declared no potential conflicts of interest with respect to the research, authorship, and/or publication of this article.
Funding
The author(s) received no financial support for the research, authorship, and/or publication of this article.