
Abstract
Objectives
Aboriginal and Torres Strait Islander children and adolescents are at higher risk of overweight and obesity, highlighting an inequitable public health concern. The aim of this study was to estimate transition probabilities and validate a model predicting the epidemiologic trajectory of overweight and obesity in Australian Aboriginal and Torres Strait Islander children.
Methods
An individual-level state-transition Markov model was developed to model transitions between healthy weight, overweight, and obesity for Aboriginal and Torres Strait Islander children aged between 2 and 14 y. Age-specific annual transition probabilities were derived from semi-parametric survival analyses using the Longitudinal Study of Indigenous Children. The model used annual cycles over a 12-y time horizon, and the epidemiological predictions of the model were validated using both internal and external data, according to best practice guidelines. The starting age of the model was 2 to 4 y and 4 to 5 y for the internal and external validation, respectively. Aboriginal and Torres Strait Islander children from the Longitudinal Study of Australian Children were used as the external validation cohort.
Results
A total of 1,643 children with 11,514 complete anthropometric measurements were used to estimate transition probabilities. The model predictions showed both good internal and external validity, with most predictions falling within the 95% confidence intervals of measured data. The model was able to reliably capture the epidemiology of overweight and obesity prevalence in early childhood.
Conclusions
Our model predictions showed good internal and external validity, ensuring our model is fit for purpose to use to evaluate Aboriginal and Torres Strait Islander–led programs to achieve a healthy weight.
Highlights
Aboriginal and Torres Strait Islander children experience high rates of overweight and obesity; hence, there is a need for high-quality evidence on both effectiveness and cost-effectiveness of Aboriginal and Torres Strait Islander–led childhood obesity prevention programs to ensure they offer value for money.
This is the first study to develop and validate a predictive model using anthropometric data from Aboriginal and Torres Strait Islander children to inform decision making on childhood obesity programs.
Our model predictions showed good internal and external validity, ensuring our model is fit for purpose to use to evaluate Aboriginal and Torres Strait Islander–led programs to achieve a healthy weight.
The model provides a framework to assist policy makers in identifying when best to intervene in childhood as well as the most effective approaches for maintaining a healthy weight for Aboriginal and Torres Strait Islander children.
Keywords
Overweight and obesity affects 1 in 4 Australian children and adolescents and is a serious public health concern. 1 Australia’s Indigenous population, consisting of Aboriginal and Torres Strait Islander peoples, represents 3.8% of the total Australian population 2 and showcases significant diversity with more than 250 distinct languages. 3 Aboriginal and Torres Strait Islander children experience high rates of overweight and obesity, 3 with 37.9% aged 2 to 17 y affected in 2018 to 2019. These elevated rates of overweight and obesity persist into adulthood. 4 Obesity in Aboriginal and Torres Strait Islander children and adolescents results from a range of biological and environmental factors influenced by historical, cultural, and economic forces. 5 Australia’s invasion and colonization disrupted traditional lifestyles and diet, leading to poor nutrition6–8 and health outcomes.9,10 Urbanization and the availability of energy-dense Western diets have replaced traditional foods, contributing to an obesogenic environment. Economic constraints push families toward inexpensive, convenient, but unhealthy food options. 11 These factors, compounded by social inequality and inadequate access to health care, contribute to the high prevalence of obesity and related health issues in Aboriginal and Torres Strait Islander communities.
Between 2010–2011 and 2019–2020, Australian government health expenditure per Aboriginal and Torres Strait Islander person increased by 7.3% per year ($2,269 to $4,295 per person), and expenditure on health services tailored to the needs of Indigenous Australians grew by 38% ($703 to $972 million). 12 The Australian government’s increased health expenditure reflects its commitment to improving equitable health outcomes for Aboriginal and Torres Strait Islander communities.13,14 A 2022 systematic review revealed insufficient evidence on the cost-effectiveness of Aboriginal and Torres Strait Islander health programs, suggesting that current resource allocation may not prioritize programs offering optimal value for money. 15
Overweight and obesity in childhood tends to persist and progress over the life course, 16 increasing the risk of cardiometabolic morbidity, premature mortality, and increased health care costs in adult life.17–19 As 33.1% of the Aboriginal and Torres Strait Islander population is younger than 15 y, 1 effective obesity prevention in childhood is vital for improving long-term health outcomes. The development of fit-for-purpose epidemiologic models is an important step in capturing the longer-term benefits of Aboriginal and Torres Strait Islander childhood obesity prevention programs.
The Markov model is the most commonly used model type for epidemiological predictions of childhood obesity, 20 in which populations transition through mutually exclusive health states representing healthy weight, overweight, and obesity. Markov models are advantageous over other modelling methods such as microsimulation due to their simplicity, computational efficiency, and ease of use, particularly when outcome data from a health intervention are available only at a cohort rather than an individual level. 21 The reliable estimation of transition probabilities between different health states is required for accurate implementation of these models. 22 Transition probabilities can be constructed by amalgamating various data sources, incorporating values from the existing literature, or using longitudinal data that track individuals over multiple time points.
In this article, we describe the development and validation of a Markov model to predict the epidemiology of overweight and obesity progression for Aboriginal and Torres Strait Islander children and adolescents. The model covers a time frame from early childhood to adolescence (2–14 y), allowing for the analysis of health benefits that could occur within a policy-relevant time frame (i.e., 5–10 y). By creating a model based exclusively on data from Aboriginal and Torres Strait Islander youth, we can enhance the accuracy of predictions and improve decision-making processes for obesity prevention in this priority population.
Methods
Data Sources Informing the Development of Transition Probabilities
We used data from the “baby” (B) and “kindergarten” (K) cohorts from the Footprints in Time: The Longitudinal Study of Indigenous Children (LSIC). LSIC is an ongoing longitudinal study of Aboriginal and Torres Strait Islander children and their families, collecting data on a broad range of social, cultural, and environmental factors. 23 LSIC is funded and managed by the Australian Government Department of Social Services and is the largest longitudinal study of Aboriginal and Torres Strait Islander children to date.
LSIC used a 2-stage sampling design to recruit 2 cohorts of Aboriginal and Torres Strait Islander children: the “baby” (B) cohort aged between 6 mo and 2 y (born between 2006 and 2008) and the “kindergarten” (K) cohort aged between 3.5 y and 5 y (born between 2003 and 2005). Eleven sites across Australia in remote, regional, and urban locations were used for recruitment. Further details of the recruitment, sampling design, and study methodology are described in detail elsewhere.23,24
LSIC commenced in 2008, and children are followed up annually. Interviews were conducted face to face at each annual wave of data collection by trained Indigenous Research Administration Officers.
The study sampled 1,759 children in wave 1, and although it was not designed to be nationally representative, the sample represents approximately 5% to 10% of the total population of Aboriginal and Torres Strait Islander children between 0 and 5 y of age. 23 It also reflects the distribution of Aboriginal and Torres Strait Islander children among the states and territories of Australia and among urban, regional, and remote areas. 24 Twelve waves of the B cohort and 10 waves of the K cohort were used in this study.
Classification of Body Mass Index and Weight Status
Children’s height and weight were collected by interviewers and body mass index z-scores (BMIz) and weight status calculated at each wave. Age- and sex-adjusted BMIz were calculated by LSIC using the World Health Organization (WHO) child growth standards for ages up to 5 y 25 and the WHO growth reference for children aged 5 to 19 y. 26 Children were classified as having underweight, healthy weight, overweight, or obesity according to the WHO and International Obesity Taskforce recommendations. 27 Due to the small proportion of children below a healthy weight, we combined underweight and healthy weight into 1 category. BMIz values that fell outside ±5 were excluded as they were considered biologically implausible. 28
There were appreciable levels of missing values of height and weight (23%) in the first wave of the study, 24 which improved with the formation of a relationship and building of trust between participants and the research administration officers. 29 In the present analysis, observations were dropped if participants had incomplete anthropometric measurements and missingness ranged from 6.9% to 22.7% (see Appendix Table 1).
Statistical Analysis: Development of Transition Probabilities
A Markov model assumes that the transition to a future weight status is dependent on only the individuals’ current weight status, without factoring in their weight status history. 30 For each year of age, 9 distinct transition probabilities were calculated between the 3 weight status categories, representing a total of 108 transitions between 2 and 14 y of age.
Transitions were estimated using time-to-event (survival) analysis. Interval-censored survival curves were estimated because the exact time of transition between weight status categories was unknown and could only be presumed to have occurred within the interval between follow-ups. At each age, semi-parametric survival curves were fitted for 6 transitions: healthy to overweight, healthy to obesity, overweight to healthy, overweight to obesity, obesity to healthy, and obesity to overweight. The probabilities of remaining in the current health state (i.e., healthy to healthy, overweight to overweight, obesity to obesity) could then be calculated as the complement. The time between each wave was measured using age and was dependent on when data collection happened, which was anywhere between 6 and 14 mo. To maximize the number of observed transitions and mitigate loss to follow-up between waves due to attrition or missing data, we used 3 waves of follow-up for each age-specific survival curve. Exponential, Weibull, and Gompertz proportional hazards regression models were estimated, and the best model was chosen based on the Pearson χ2 goodness-of-fit test, which compared the observed to the predicted transitions. For weight categories that had fewer than 20 transitions, no covariates were included in any models, as the estimate would have lacked precision. The cumulative hazard function was derived from the model and a 3-y transition probability calculated, which was then converted into an annual transition probability calculated using the following equation 28 :
3-y transition probability:
1-y transition probability:
The probability of individuals remaining in the baseline weight status category was calculated as the complement of the 2 transition probabilities. For example, an individual who started in the overweight category had a transition probability of remaining in the overweight category calculated as
3.
We conducted 2,000 bootstrap replications of each chosen regression model to estimate a distribution around each transition probability.
Model Structure
An individual-level state-transition Markov model was developed for Aboriginal and Torres Strait Islander children between 2 and 14 y of age (Figure 1). The model used a time horizon of 12 y and consisted of a 1-y cycle length with 3 discrete health states: healthy weight, overweight, and obesity. Individuals in the model can be in only one state at a time and at the end of each 1-y cycle can transition from one health state to another. 30 Statistical analyses of LSIC data to estimate transition probabilities were performed using Stata version 18.0 (StataCorp, College Station, TX, USA). The annual transition probabilities were then integrated into a Markov model for validation and developed in TreeAge Pro 2024 (TreeAge Software Inc., Williamstown, MA, USA).
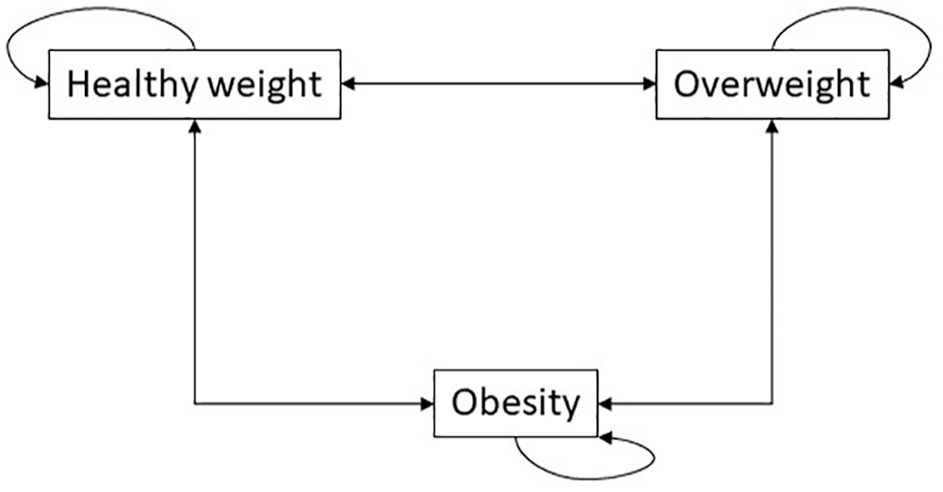
Model structure depicting the transitions between weight status groups.
Model Validation
Model validation was based on best practice guidelines from the International Society for Pharmacoeconomics and Outcomes Research (ISPOR) Task Force-7.31,32 We addressed 2 types of validation in our study: internal and external validation. Internal validation was used to test whether the model’s predicted values were consistent with the data used to develop the model. External validation compared model results with key outcomes from an independent data set that was not used in model development. 31
Our validation outcome of interest was the modeled prevalence of weight status categories when using input data to run the model from both internal and external data, matched by age. We used individual-level data to create an input population using data from the LSIC (internal validation) and from the Aboriginal and Torres Strait Islander participants in the Longitudinal Study of Australian Children (LSAC) for external validation. LSAC is a population-based, nationally representative longitudinal study 33 that has a similar sampling design to the LSIC, with approximately 3% of LSAC participants identifying as Aboriginal and Torres Strait Islander. Data collection was done biennially in waves and began in 2004.
For internal validation, we used an input population of 665 children from the LSIC data aged 2 to 4 y to model outcomes over a 10-y time horizon (until 12–14 y). External validation was conducted using an input population based on the 323 Aboriginal and Torres Strait Islander children from LSAC aged 4 to 5 y. The model used a 12-y time horizon and incorporated out-of-sample external validation, whereby the predicted results could be compared with observed LSAC data points at age 14 to 15 y and 16 to 17 y. We assumed that the transition probabilities from 14 to 17 y of age remained the same as the last calculated transition probabilities at age 13 y.
The model used 10,000 individual trials, which consisted of randomly sampling 1 individual from the respective input populations, accounting for their age and weight status, and running the individual through the model for the appropriate time horizon. For both internal and external validation, model predictions of healthy weight, overweight, and obesity prevalence at each cycle of the model were compared with observed data from LSIC and LSAC. The weight status prevalence in the populations used for internal and external validation are presented in Appendix Table 1.
Results
A total of 1,643 children aged 2 to 14 y with 11,514 complete anthropometric measurements in waves 3 to 12 (B cohort) and 1 to 10 (K cohort) of LSIC were analyzed. The baseline characteristics of the LSIC populations are presented in Table 1 and of the LSAC population in Appendix Table 2. In the longitudinal study design, more than 30% of children entered the dataset after baseline (see Appendix Table 3); however, there was still an average of 7 observations (standard deviation 2.6) per child.
Baseline Characteristics for the Analyzed Sample from LSIC
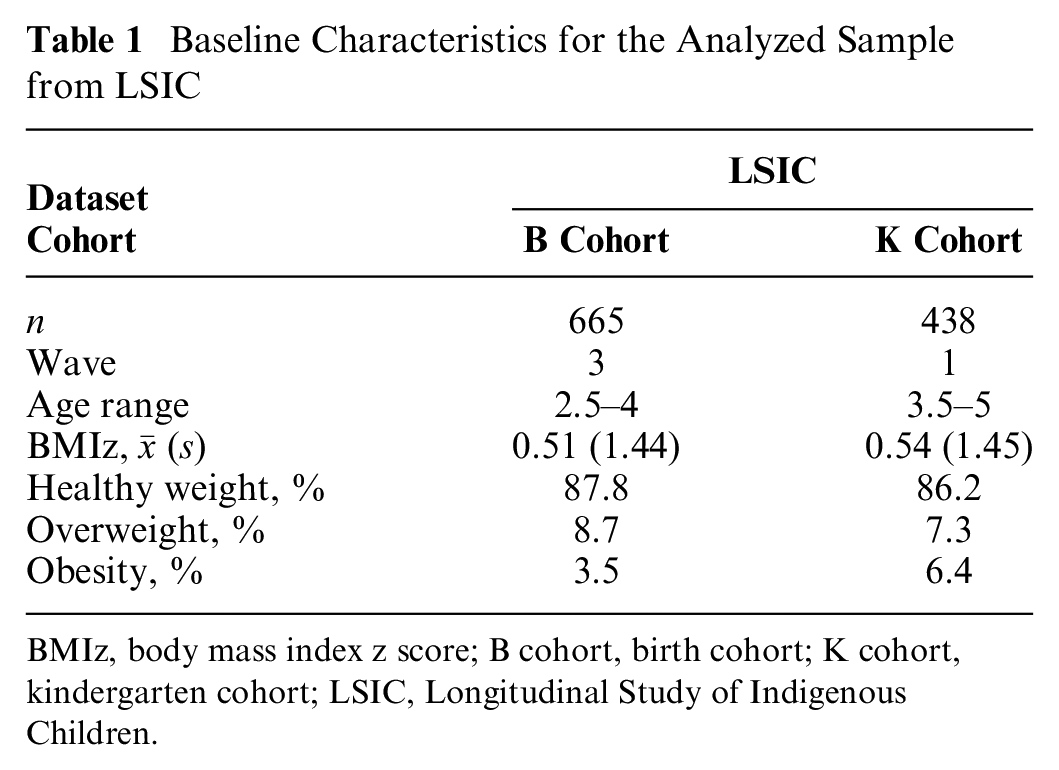
BMIz, body mass index z score; B cohort, birth cohort; K cohort, kindergarten cohort; LSIC, Longitudinal Study of Indigenous Children.
The Weibull parametric model was chosen for each transition based on best fit, and the estimated annual transition probabilities are shown in Figure 2 and Appendix 4. In general, transition probabilities between body weight groups were higher in younger (2–4 y) children than in older children. Transition probabilities from overweight to healthy weight were highest among 2- (53.8%) and 3-y-olds (31.8%), before stabilizing to approximately 13% from ages 7 to 13 y. The resolution of obesity was highest in the same age period, with transition probabilities estimated between 18.1% and 25.0% from obesity to overweight and 20.7% and 26.6% from obesity to healthy weight among 2- and 3-y-olds. Transition probabilities from healthy weight remained stable throughout childhood with a high probability of remaining in healthy weight (83.8% to 93.8%). The probability of remaining in the overweight category was lowest at 2 y of age (38.7%) and steadily increased until it stabilized at approximately 71% from 7 y of age. A similar trend was found for children remaining in the obesity category, increasing from 48.4% at 2 y of age to 92.5% at 7 y of age, before steadily decreasing to 81.9% at 12 y of age.
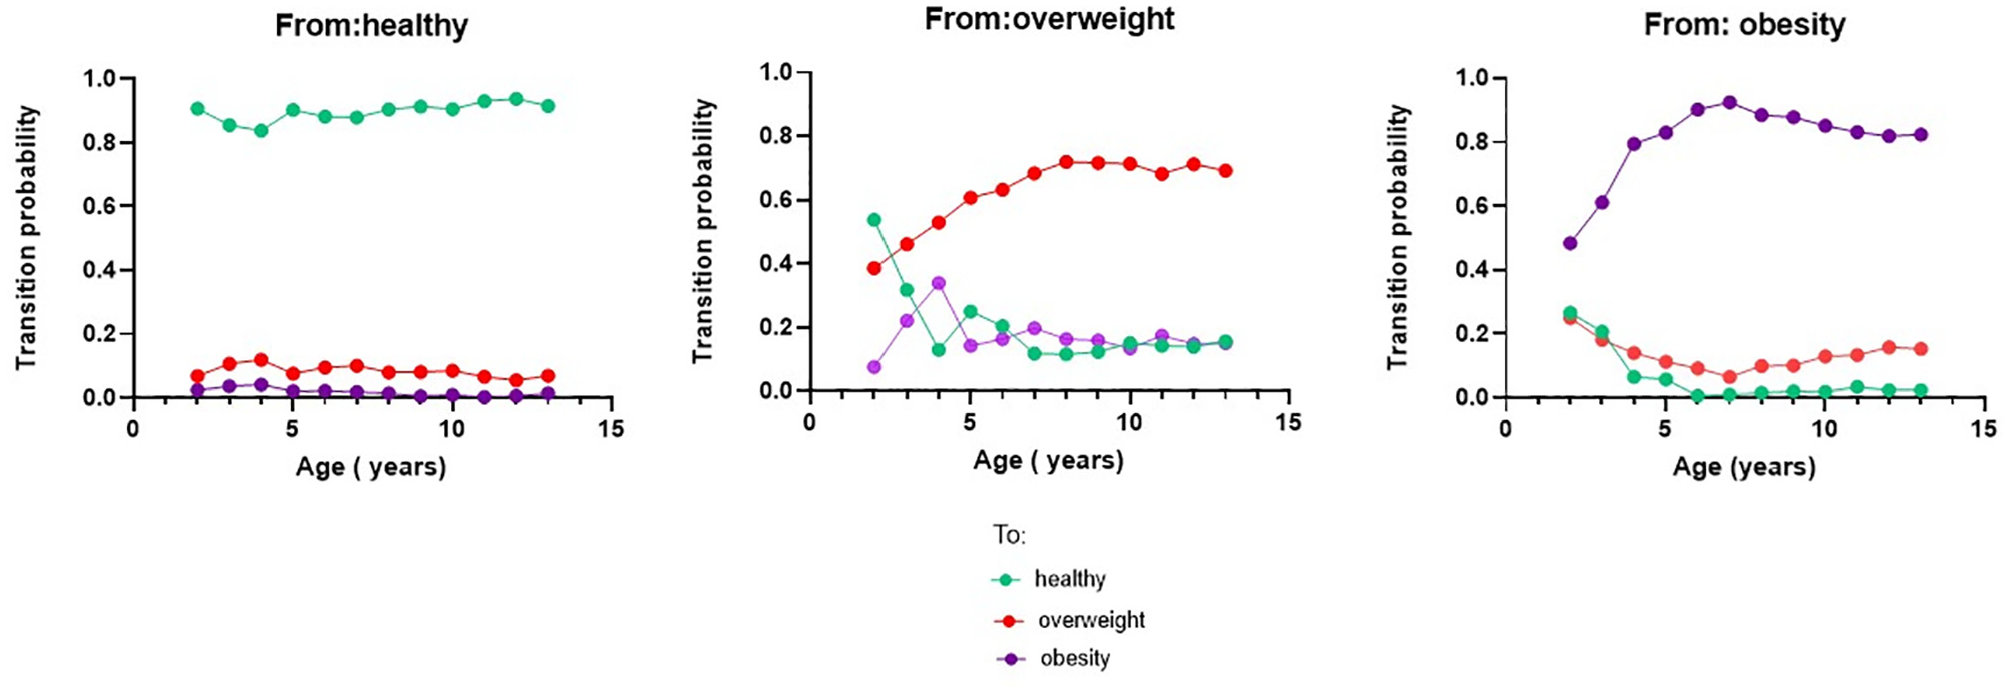
Transition probabilities for healthy weight, overweight, and obesity.
The modeled results showed good internal validation in terms of predicted trends in weight status prevalence. After 10 y, the model predicted overweight and obesity to be 21.9% (95% confidence interval [CI] 20.3–23.5) and 19.2% (95% CI 17.6–20.7), respectively. This is consistent and within the observed prevalence and 95% CIs in LSIC for overweight (24.9% [95% CI 20.9–29.0]) and obesity (21.5% [95% CI 17.7–25.4]). Importantly, the model was able to capture the increase in overweight and obesity prevalence in early childhood and the plateau in overweight from 8 to 14 y of age. The model slightly overpredicted healthy weight prevalence (59.0%) compared with the observed prevalence of 53.5% (95% CI 48.9%–58.2%). Overall, most predictions fell within the 95% CI bands, as seen in Figure 3.
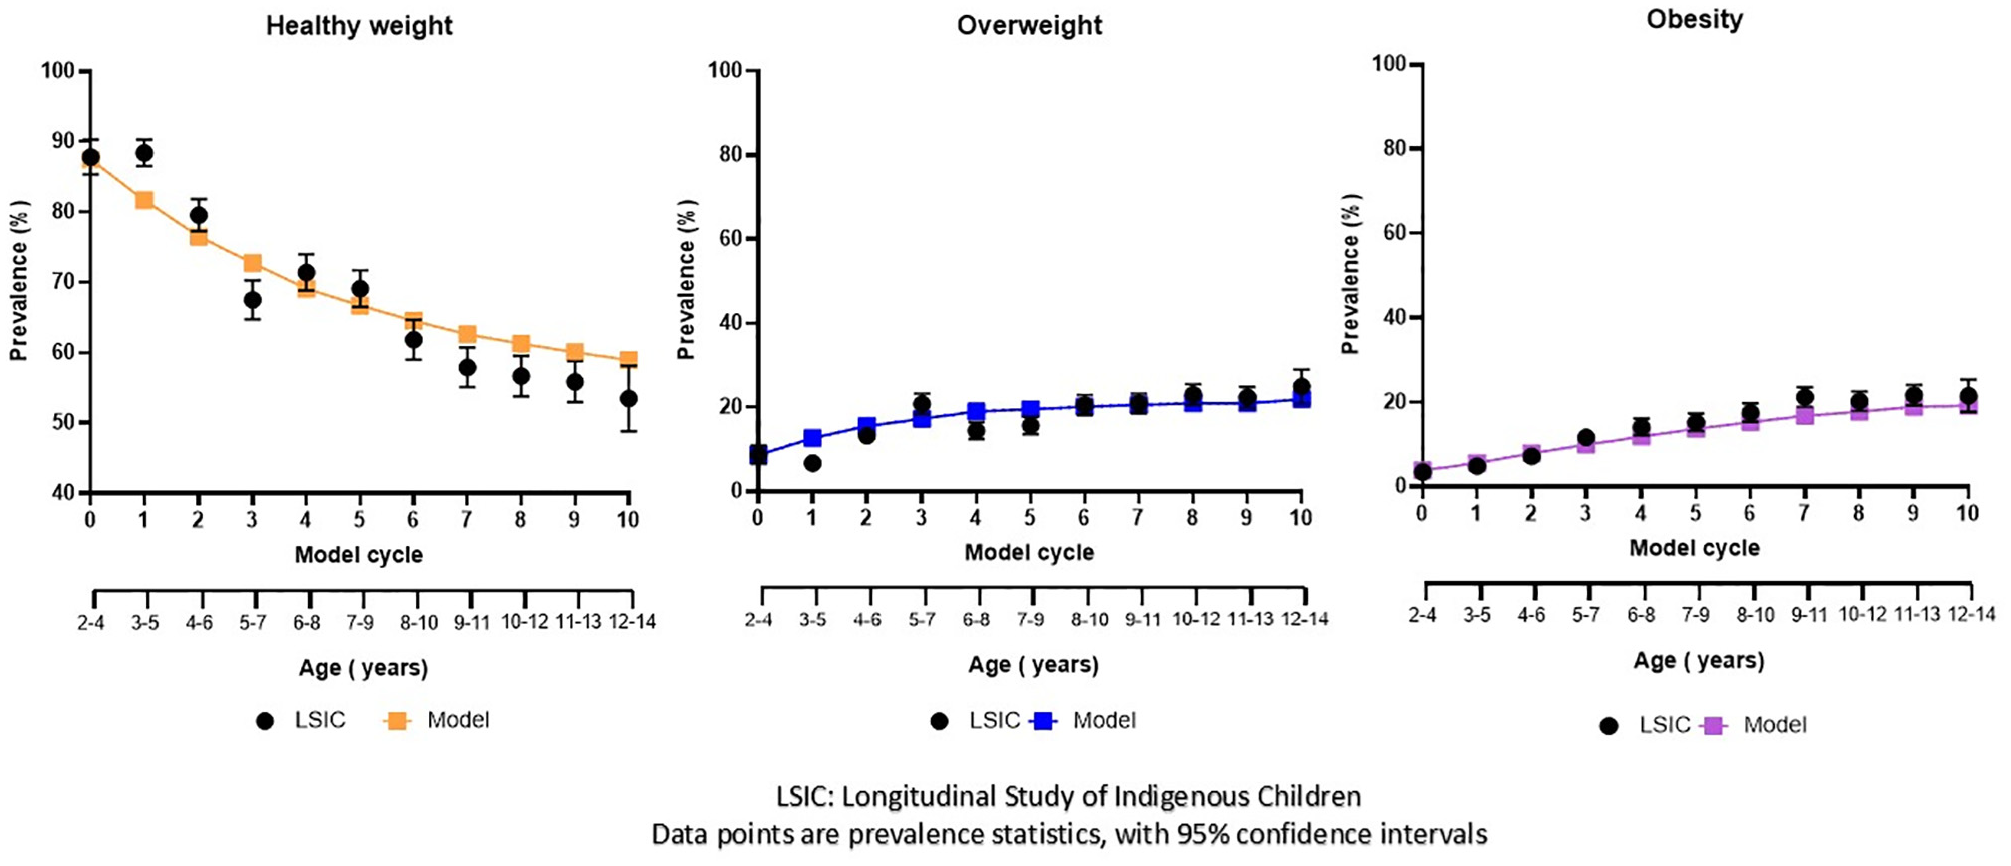
Internal validation of weight status prevalence, modeled using a mixed aged cohort aged 2 to 4 y to the ages of 12 to 14 y.
External validation of the model-estimated prevalence showed good concordance with the observed prevalences using LSAC data (see Figure 4). At 12 to 13 y, the model predicted prevalences of 55.7% (95% CI 53.8–57.6) for healthy weight, 22.5% (95% CI 20.9–24.1) for overweight, and 21.8% (95% CI 20.2–23.4) for obesity. The corresponding observed prevalences were 51.9% (95% CI 44.7–59.2), 27.1% (95% CI 20.6–33.5), and 21.0% (95% CI 15.1–26.3) for healthy weight, overweight, and obesity, respectively. The out-of-sample predictions at 14 to 15 y and 16 to 17 y corresponded well with the observed data, falling within the 95% CI bands.
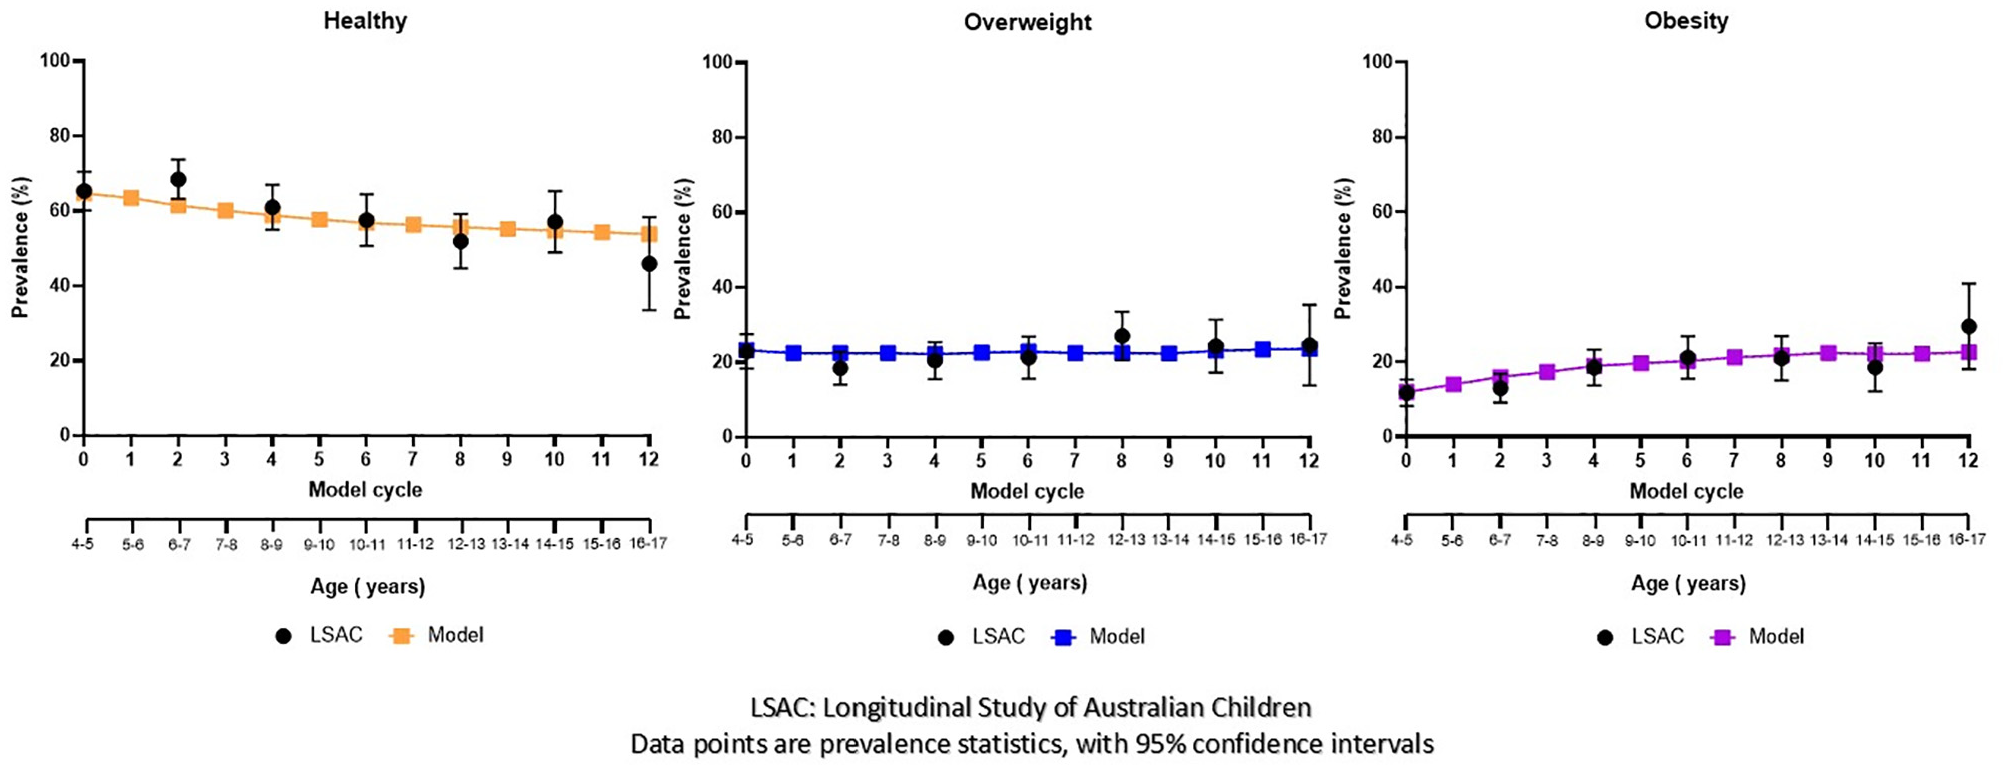
External validation of weight status prevalence, modeled using a mixed aged cohort aged 4 to 5 y to the ages of 16 to 17 y.
Discussion
To the best of our knowledge, this is the first study to estimate transition probabilities and develop and validate an epidemiological model of weight status progression for Aboriginal and Torres Strait Islander children. There is a pressing need to invest in obesity prevention strategies given the high prevalence of obesity in Aboriginal and Torres Strait Islander children. The model’s ability to accurately predict changes in weight status over time will be useful to inform decision makers on the long-term benefits of childhood obesity prevention.
Our findings demonstrated that transitions between weight status groups were age dependent, with 2- and 3-y-olds exhibiting a 2-fold higher probability of moving between weight categories when compared with 11- and 12-y-olds. Our findings align with Australian and international studies, which show that the probability of transitioning between weight categories to be relatively low, while the likelihood of remaining in the same weight status group is high.34–44 Longitudinal studies in the United Kingdom have reported an increased prevalence of obesity among 10- to 11-y-olds compared with 4- to 5-y-olds and found that younger children are more likely to resolve unhealthy weight than older children are.34,35 Similarly, younger children in the overweight category are the most likely to transition to either healthy weight or obesity—a pattern similarly observed in studies from Australia,36,37 the United States,38,39 China,40,41 Germany, 42 Finland, 43 and Portugal. 44 We have confidence in our transition probability estimates as the internal and external validation of our obesity model showed good accuracy when predicting weight status prevalence of Aboriginal and Torres Strait Islander children over time.
This study represents the first step toward building a validated health economic model that will be used for cost-effectiveness analyses to inform sustainable investment into programs improving the health of Aboriginal and Torres Strait Islander children. Despite the recognition of Aboriginal and Torres Strait Islanders as a priority demographic within the National Obesity Strategy, 45 there is a lack of tailored national- or state-level policies or programs to address Aboriginal and Torres Strait Islander obesity in childhood. 46 A recent review 47 of overweight and obesity prevention and management programs for Aboriginal and Torres Strait Islander children aged 5 to 17 y found 8 studies, with only 2 of those48,49 evaluated on their effectiveness. The Go4Fun program, 48 a free 10-wk initiative designed to promote healthier lifestyles among children aged 7 to 13 y and their families in New South Wales (NSW), was one of the studies evaluated. Go4Fun continues to be funded by the NSW government, and delivery of the program has undergone cultural adaptations for Aboriginal communities. 50 No modeled analyses were conducted to show the long-term effectiveness for these Aboriginal and Torres Strait Islander health initiatives, highlighting a significant gap in the evidence base for policy decision making.
A major strength of our study is the transparency of our methods and validation of modeled epidemiological predictions from early childhood to adolescence, using internal and external validation methods as recommended by best practice guidelines.31,32 A recent systematic review found that only 18% of obesity models conducted both internal and external validations, which compromises the confidence that can be placed on the model’s predictions. 19 The internal validation showed the model was accurate in its predictions of weight status prevalence over a 10-y period and was able to predict the plateauing of overweight prevalence from 8 to 14 y of age. Importantly, our model also had good concordance in our external validation, including the out-of-sample validation, which extended the model to 17 y of age. The validation increases confidence in using the model for future applications across childhood and adolescence. We plan to estimate and include transition probabilities for adolescents aged 14 to 17 y into the model as new waves of LSIC data become available. Another strength of our study is that we used the largest national longitudinal study of Aboriginal and Torres Strait Islander children to date, with more than 10 y of follow-up and repeated annual measured height and weight data from more than 1,500 individual children to inform our model. Finally, we have used data in a manner consistent with the Declaration on the Rights of Indigenous Peoples (UNDRIP), to support and enhance Indigenous Peoples’ collective well-being.51,52
The study has several limitations. Despite being the largest longitudinal study of Indigenous children in Australia, we were only able to account for age when estimating transition probabilities due to the small number of observed events for some transitions (i.e., healthy to obesity). We did not include factors such as gender, socioeconomic position, rurality, or environmental and social factors used in previous models of non-Indigenous children,34–44 nor did we explore differences by Indigenous identification (i.e., Torres Strait) or group. 9 Thurber et al. used the LSIC and found no significant association between children’s birth weight and BMIz at age 3 to 9 y by gender or Indigenous identification, indicating transition probabilities to be unlikely affected by those 2 factors. 9 However, identifying whether transition probabilities differ by gender or Indigenous identification is an important avenue of future research. Due to the properties of a Markov model, individuals’ previous weight trajectories or BMI, which are known to influence future weight status, 53 were not accounted for; however, our model demonstrated robust performance in validation, indicating its effectiveness in predicting future weight status at a cohort level.
Our analysis included only children with measured BMIz data. To address the potential impact of loss to follow-up on the estimated time of transition, interval-censored survival analysis was used as the primary statistical methodology. This approach was selected due to its ability to accommodate uncertainty in the precise timing of transitions between weight status groups, in contrast to alternative statistical models that assume discrete transition points coinciding with observation times. We combined underweight and healthy weight due to small numbers in the underweight category, despite the potential for different weight status transitions compared with the healthy group. Finally, as the data are not population representative, findings from the model may not be generalizable to all Aboriginal and Torres Strait Islander children. Further research is required to determine whether the epidemiological model accurately represents Aboriginal and Torres Strait Islander children from the most remote areas.
By estimating the annual transition probabilities, the model is flexible and allows input populations of any age to enter the model. The model can account for the large changes in weight status at early childhood as well as the plateauing of overweight and obesity in middle childhood and adolescence. The model can be used to offer insights on the optimal timing of different strategies that could prevent excess weight gain and obesity among children and adolescents.
This epidemiological model will form an integral component of a health economic model and fill a gap in the literature, as no other models have been developed specifically for Aboriginal and Torres Strait Islander children. Work is currently underway to incorporate probability distributions of transition probabilities to the epidemiological model, Aboriginal and Torres Strait Islander–specific health care costs, and health-related quality-of-life estimates by age and weight status into the model. Importantly, the model will be able to generate a policy-relevant case for the long-term benefits of strengths-based Aboriginal and Torres Strait Islander–led programs to support self-determination and positive health outcomes. 54 This directly aligns with the Australia’s National Obesity Strategy by focusing on and working with Aboriginal and Torres Strait Islander stakeholders to create strategies across childhood and adolescence to reduce health inequities and overweight or obesity. 45
Conclusion
Our findings demonstrate the development of an Aboriginal and Torres Strait Islander–specific Markov model that accurately predicts changes in weight status categories during childhood and adolescence. This will assist policy makers in identifying when best to intervene in childhood for maintaining a healthy weight for Aboriginal and Torres Strait Islander children.
Supplemental Material
sj-docx-1-mdm-10.1177_0272989X251351030 – Supplemental material for Weight Status Transitions and Validation of an Obesity Model for Aboriginal and Torres Strait Islander Children and Adolescents
Supplemental material, sj-docx-1-mdm-10.1177_0272989X251351030 for Weight Status Transitions and Validation of an Obesity Model for Aboriginal and Torres Strait Islander Children and Adolescents by Thomas Lung, Anagha Killedar, Kirsten Howard, Li Ming Wen, Patrick Kelly, Michelle Dickson, Simone Sherriff, Louise Baur and Alison Hayes in Medical Decision Making
Footnotes
Acknowledgements
The authors would like to thank the participants of the Longitudinal Study of Indigenous Children and the Longitudinal Study of Australian Children. We also thank the Australian Institute of Family Studies for providing the data.
This work was completed at University of Sydney School of Public Health, NSW, Australia. The authors declared no potential conflicts of interest with respect to the research, authorship, and/or publication of this article. The authors disclosed receipt of the following financial support for the research, authorship, and/or publication of this article: Financial support for this study was provided by the National Health and Medical Research Council (NHMRC) of Australia Ideas grant (GNT2011342) and an NHMRC Centre of Research Excellence grant (GNT2006999). LB is supported by an NHMRC investigator grant (GNT2009035). The funding agreement ensured the authors’ independence in designing the study, interpreting the data, writing, and publishing the report.
Author Contributions
TL and AH conceived the study design. TL conducted all data analyses and built the model with feedback from AH, AK, PK, and KH. All authors contributed to the writing and editing of the manuscript and approved its final version for publishing.
Ethical Considerations
Ethics approval for this study was received from the University of Sydney Human Research Ethics Committee (project No. 2022/699) and the Aboriginal Health & Medical Research Council (application ID 35578980). The Australian Institute of Family Studies Ethics Committee approved each wave of both the Longitudinal study of Australian Children (LSAC) and Longitudinal Study of Indigenous Children (LSIC). The use of both datasets was in accordance with the terms in each deed of license. Each year, the LSIC study receives national-level ethical clearance from the Australian Institute of Aboriginal and Torres Strait Islander Studies (AIATSIS) Ethics Committee.
Consent to Participate
This study uses the following public datasets: Footprints in Time, the Longitudinal Study of Indigenous Children (LSIC) and Growing up in Australia, and the Longitudinal Study of Australian Children ( LSAC). Parents provided informed consent for themselves and their children to participate in both studies.
Consent for Publication
Not applicable.
References
Supplementary Material
Please find the following supplemental material available below.
For Open Access articles published under a Creative Commons License, all supplemental material carries the same license as the article it is associated with.
For non-Open Access articles published, all supplemental material carries a non-exclusive license, and permission requests for re-use of supplemental material or any part of supplemental material shall be sent directly to the copyright owner as specified in the copyright notice associated with the article.