
Abstract
Objectives
The EQ-5D-5L and Patient-Reported Outcomes Measurement Information System (PROMIS®) preference score (PROPr) are preference-based measures. This study compares mapping and linking approaches to align the PROPr and the PROMIS domains included in PROPr plus Anxiety with EQ-5D-5L item responses and preference scores.
Methods
A general population sample of 983 adults completed the online survey. Regression-based mapping methods and item response theory (IRT) linking methods were used to align scores. Mapping was used to predict EQ-5D-5L item responses or preference scores using PROMIS domain scores. Equating strategies were applied to address regression to the mean. The linking approach estimated item parameters of EQ-5D-5L based on the PROMIS score metric and generated bidirectional crosswalks between EQ-5D-5L item responses and relevant PROMIS domain scores.
Results
EQ-5D-5L item responses were significantly accounted for by PROMIS domains of Anxiety, Depression, Fatigue, Pain Interference, Physical Function, Social Roles, and Sleep Disturbance. EQ-5D-5L preference scores were accounted for by the same PROMIS domains, excluding Anxiety and Fatigue, and by the PROPr preference scores. IRT-linking crosswalks were generated between EQ-5D-5L item responses and PROMIS domains of Physical Function, Pain, and Depression. Small differences were found between observed and predicted scores for all 3 methods. The direct mapping approach (directly predicting EQ-5D-5L scores) with the equipercentile equating strategy proved superior to the linking method due to improved prediction accuracy and comparable score range coverage.
Conclusions
The PROPr and the PROMIS domains included in the PROMIS-29+2 predict EQ-5D-5L preference scores or item responses. Both methods can generate acceptably precise EQ-5D-5L preference scores, with the direct mapping approach using the equating strategy offering better precision. We summarized recommended score conversion tables based on available and desired scores.
Highlights
This study compares mapping (score prediction) and IRT-based linking approaches to align the PROPr and the PROMIS domains with EQ-5D-5L item responses and preference scores.
Researchers, clinicians, and stakeholders can use this study’s regression formulas and score crosswalks to convert scores between PROMIS and EQ-5D-5L.
Mapping can generate more precise scores, while linking offers greater flexibility in score estimation when fewer PROMIS domain scores are collected.
Preference-based measures summarize multiple domains of health-related quality of life (HRQoL) into a single score anchored at 0 (dead) and 1 (“full” health), with a score less than 0 representing health states worse than dead. 1 Preference-based measures are used in cost-effectiveness analysis to compare different treatment options, and they can facilitate clinical decision-making.2,3 The EQ-5D is the most commonly used preference-based measure worldwide.4–6 The UK National Institute for Health and Care Excellence recommends it, and pharmaceutical companies use it to assess the cost-effectiveness of health care interventions. 7 There are 2 versions of EQ-5D adult measures: the EQ-5D-3L and EQ-5D-5L. 8 They share the same 5-question stems, with the former measure having 3 response options per question and the latter 5. The EQ-5D asks about one’s health today with a single item for each of 5 domains: Mobility, Self-care, Usual Activities, Pain/Discomfort, and Anxiety/Depression.
The Patient Reported Outcome Measurement Information System® (PROMIS®) is a family of measures of HRQoL domains increasingly used in studies of general and clinical populations.9–16 PROMIS scores are estimated using item response theory (IRT) parameters, 17 and the measures can be administered using various modes, including short forms and computer adaptive testing options. 18 Most PROMIS measures are calibrated and centered on the general population of the United States, and scores are standardized to a T-score metric with a mean of 50 and a standard deviation (SD) of 10.19,20 Off-the-shelf PROMIS profile measures that cover a core set of health domains, such as the PROMIS-29+2, are available for ease of use. PROMIS also includes a preference-based score: the PROMIS-Preference (PROPr) score.
PROPr is obtained from 7 of the 8 PROMIS health domains (Anxiety excluded) in the PROMIS-29+2 21 : Cognitive Function–Abilities, Depression, Fatigue, Pain Interference, Physical Function, Sleep Disturbance, and Ability to Participate in Social Roles and Activities. 2 PROPr differs notably from other preference-based (“health utility”) measures. First, the scores have a bell-shaped distribution in the general population, have a lower average score, and capture more variation than other preference-based measures do. 22 The best possible health state in PROPr is substantially better than the best health states described in other preference-based measures. 2 Hence, ceiling effects are less common than in EQ-5D-5L.2,23 Second, since the PROPr is built on PROMIS domains, scores of each constituent PROMIS domain are available in addition to the preference scores. Third, because PROMIS measures of the same health domain have been calibrated together, different combinations of items on short forms within the same health domain can be scored on the standard T-score metric.18,20,24 PROPr preference scores can be calculated using any short form or computer adaptive test of the 7 PROMIS domains. 25 Both the PROPr and EQ-5D can be used to estimate quality-adjusted life-years for cost-utility analyses. Previous studies have shown the similarity between these 2 preference measures.23,26 However, some studies found differential performance in the validity of the 2 measures.22,27
Similar content in constituent health domains may allow for a regression-based mapping method to predict EQ-5D scores using PROMIS domains. Revicki et al. 3 used ordinary least squares (OLS) regression to predict EQ-5D-3L scores from PROMIS-29 domain scores based on a sample of the US general population. Klapproth et al. 28 used OLS to predict EQ-5D-5L scores by PROMIS-29 domain scores using data from the United Kingdom, France, and Germany. Recently, Aghdaee et al. 29 used mapping to predict EQ-5D-5L preference scores from PROMIS-29 domain scores based on the Australian general population and compared various mapping models. However, no study has predicated the EQ-5D-5L using PROMIS domains based on a US general population and US value sets. In addition, prior studies used domain scores from the PROMIS-29 that do not include the cognitive function domain in the PROPr. Klapproth et al. 28 suggested that future studies predict EQ-5D preference scores using the PROMIS domains included in the PROPr.
While regression-based mapping is widely used in mapping studies,30,31 predicted scores are affected by regression to the mean.32,33 In response, Fayers and Hays 32 suggested using linear equating or equipercentile equating to align predicted and observed score distributions by matching percentiles, thereby reducing the impact of regression to the mean. 34 We applied the equipercentile strategy to achieve more precise estimates than the original regression predictions.
In addition to mapping, score conversion can be achieved using IRT-based linking methods.35–39 The IRT-based linking method can calibrate items of the EQ-5D-5L based on the score metric of PROMIS measures and generate a bidirectional score conversion table between the 2 measures. This study compares the mapping approach with equating strategies and the IRT-based linking approach to align the scores of the PROPr and the PROMIS domains included in the PROMIS-29+2 with EQ-5D-5L item responses and preference scores. It aims to allow for an interpretation of EQ-5D item-level and scale-level scores based on PROMIS domains and the PROPr.
Methods
Data
The dataset used for this analysis was collected online by ICF (https://www.icf.com/services/research-and-evaluation) and SurveyNow (http://www.surveynowapp.com/) in the spring of 2016. 2 The sample was designed to be representative of the US population 2010 census characteristics (age, gender, race, ethnicity, education, and income). The PROMIS-29 and a 4-item PROMIS cognitive function short form were administered along with the EQ-5D-5L. A published article and a technical report present distributions, correlations, and differences in PROPr and EQ-5D-5L scores associated with 12 chronic health conditions.2,40
Measures
PROPr and PROMIS domains in the PROMIS-29+2
The PROPr items ask about health status with 5 response categories. Each domain is scored separately using established graded response model item parameters. The PROPr scoring algorithm based on domain scores was developed using standard gamble valuations from a US sample. The possible preference score range is −0.022 to 1.0. 21 In this study, domain scores were collected using the 4-item versions of each PROMIS domain included in the PROMIS-29 (Anxiety included) and a 4-item PROMIS cognitive function short form instead of the 2-item version in the PROMIS-29+2. Because of the limited range of 4-item short forms, the maximum score on PROPr is 0.95 for this study. The domain specification of each mentioned measure is listed in Table 1 of Appendix 1.
Sociodemographic Summaries
SORO, Ability to Participate in Social Roles and Activities.
EQ-5D-5L
Each domain in the EQ-5D-5L is assessed by a single item with 5 response options. The response scale is “no,”“slight,”“moderate,”“severe,” and “extreme” levels of the corresponding problems or symptoms (or “unable to”). 7 We estimated the EQ-5D-5L preference scores from a US value set derived from the composite time tradeoff method. 41 Possible scores range from −0.573 to 1.0.
Statistical analysis
We summarized respondent demographic characteristics, PROMIS domain scores, PROPr, and EQ-5D-5L preference scores. We then aligned the scores between the PROMIS domains and the EQ-5D-5L using a series of regression-based direct and indirect mapping approaches and an IRT-based linking method.
Direct and indirect mapping
Direct mapping refers to using PROMIS domains or PROPr preference scores as predictors to directly predict EQ-5D-5L preference scores. Indirect mapping refers to using PROMIS domains or PROPr preference scores as predictors to predict EQ-5D-5L item responses, which are then used to calculate EQ-5D-5L preference scores. We conducted 2 sets of regression-based mapping analyses: the full model and the reduced model. Based on the correlations between PROMIS domain scores and EQ-5D-5L items, we selected PROMIS domains with correlations higher than 0.243 (corresponding to a Cohen’s effect size of 0.5 SD) as predictors. For the full models, we included age, gender, and general health status as an exploratory study to examine if these respondents’ characteristics predict EQ-5D-5L item responses in addition to PROMIS measures. For the reduced model, we removed the 2 demographic variables, the general health status variable, and any statistically nonsignificant PROMIS domain scores. We present the reduced models as our primary models to make the prediction generalizable to the studies that did not collect the same demographic variables. (We include the full model results in Appendix 1 as a reference for interested readers.) We randomly split the data into 60% of the sample as the estimation sample and 40% as the validation sample to implement the cross-validation strategy for evaluating the model performance stability.
We first used the indirect mapping method based on the proportional odds logistic regression model to predict EQ-5D-5L item responses using PROMIS domain scores. We used the probabilistic predictions from logistic regression model results to generate the EQ-5D-5L item responses and then used the predicted EQ-5D-5L item responses to calculate predicted EQ-5D-5L preference scores. The prediction accuracy of the item responses was assessed using Cohen’s weighted kappa with quadratic weights 42 to account for the fact that some disagreements are less severe than others in ordinal item response and total agreement rates. Agreement between predicted and observed preference scores was assessed through intraclass correlations (ICCs), means, SDs, and root mean squared deviations (RMSDs) of the differences between the 2 scores. We applied the following criteria to evaluate Cohen’s kappa statistic: no agreement (≤0), slight agreement (0.01–0.20), fair agreement (0.21– 0.40), moderate agreement (0.41–0.60), substantial agreement (0.61–0.80), and almost perfect agreement (0.81–1.00). 42 For ICCs, we employed the following criteria to evaluate the strength of association: poor (<0.5), moderate (≤0.5 and <0.75), good (≥0.75 and ≤0.90), and excellent (>0.90). 43 The RMSD values were compared with the range and SD of the score distribution to determine if they could be considered small.
Concerning direct mapping, we applied the OLS regression-based method to predict EQ-5D-5L preference scores using the PROMIS domain and PROPr preference scores, respectively. We used the same statistics (i.e., ICCs, means, SDs, and RMSDs between predicted and observed EQ-5D-5L preference scores) to evaluate the direct mapping accuracy. We then applied the equipercentile equating method to align scores between PROPr and EQ-5D-5L preference scores. To reduce the impact of regression to the mean in OLS regressions, we used the equipercentile equating method to align the predicted EQ-5D-5L preference scores with the observed scores. We generated crosswalk tables between the 2 scores.
Linking
For IRT-based linking, we applied the fixed-parameter calibration 35 method based on the graded response model, which estimates the probability that a respondent with a certain level of the measured domain will respond at or above each response category. The GRM model generates slope and threshold parameters of each item. Specifically, for a person with a certain level θ in a health domain, the GRM calculates the probability of responding in each category (e.g., 1–5 in PROMIS measures) by using a logistic function. The formula for the probability (P) of choosing category k or higher as a response Y is

where
θ denotes the person’s level of the health domain,
a denotes how well the item distinguishes between people with different levels in the health domain, and
bk denotes the threshold for category k (how much health level is needed to choose category k or higher).
The IRT-based fixed-parameter calibration method estimates the item parameters of EQ-5D-5L based on the metric of the anchor measure, PROMIS, by fixing the item parameters of the PROMIS measure of each domain at their existing values. The existing PROMIS item parameters are centered on the US general population, except for Sleep Disturbance. Hence, when fixing the item parameters of PROMIS at the existing values during calibration, the EQ-5D-5L item parameters are also calibrated based on the metric of the general population. These calibrated EQ-5D-5L item parameters can then be used to generate scores on the PROMIS T-score metric, enabling the creation of a crosswalk table using the Lord and Wingersky recursive algorithm 44 for each EQ-5D-5L item and corresponding PROMIS domain pair. This crosswalk allows EQ-5D-5L item responses to be translated into relevant PROMIS domain T-scores.
To evaluate the accuracy of these crosswalks from the 2 IRT-linking approaches, we computed ICCs, means, SDs, and RMSDs of the differences between the linked and observed PROMIS domain scores. We chose the optimal linking approach to create the IRT-based linking crosswalk for each EQ-5D-5L item using these statistics. We then converted the observed PROMIS domain scores to EQ-5D-5L item responses based on the bidirectional crosswalk tables. We computed Cohen’s weighted kappa 42 to evaluate the agreement between the observed and linked EQ-5D-5L item responses from PROMIS domain scores. Finally, we calculated the linked EQ-5D-5L preference scores based on these linked item responses and computed means, SDs, RMSDs, and ICCs of differences between observed and linked EQ-5D-5L preference scores for both the mapping and linking approaches to evaluate the accuracy of each approach.
To evaluate if the models met their assumptions, we tested the proportional odds assumption for the ordinal logistic regression models, which indicates if the relationship between each predictor and the response variable is consistent across all response options. The cumulative probabilities of the outcome categories are modeled using the logistic distribution, which assumes a linear relationship between the independent variables and the log-odds of the dependent variable. The assumptions for the IRT-based linking analyses included content relevance, correlations between raw summed scores of the 2 scales, and unidimensionality of the combined scales. The underlying health domain assessed in IRT was assumed to follow a normal distribution. The assumptions for equating analysis (correlations between predicted and observed scores) were also tested. The equipercentile method, a nonparametric approach, does not make distributional or model-based assumptions about the assessed health domain. We used the R program 45 and R packages of PROsetta, 46 MASS, 47 equate, 48 and psych 49 to conduct the analyses.
Results
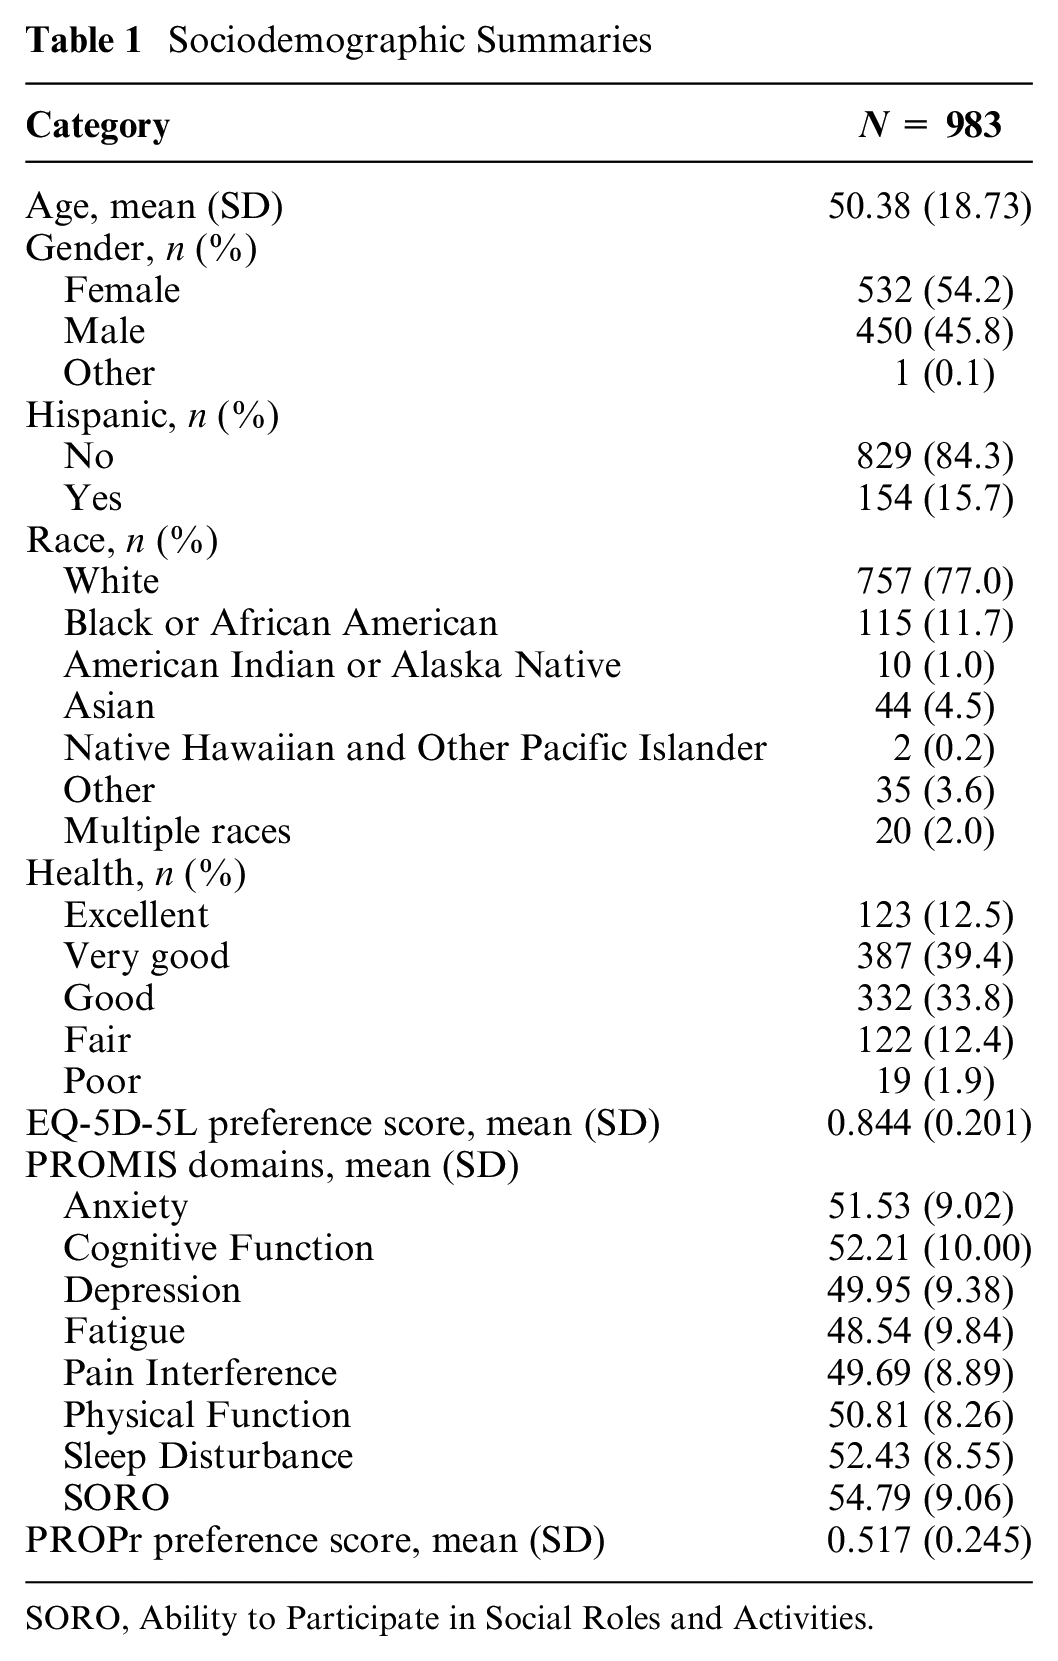
The demographic characteristics and score distributions are summarized in Table 1. The mean age of the respondents was 50 y, with 54% female, 16% Hispanic, and 77% White. This composition is slightly different from the information in the 2010 US census. Fifty-two percent reported that their general health was “very good” or “excellent.” All study participants completed all EQ-5D-5L and PROMIS items. The PROMIS domain scores were distributed around the general population mean of 50 with SDs between 8 and 10, except for the Ability to Participate in Social Roles and Activities domain, which had a mean of 55. The mean PROPr preference score was 0.517 (SD = 0.245), and the mean EQ-5D-5L preference score was 0.844 (SD = 0.201).
Table 2 of Appendix 1 shows the correlations between the PROMIS domain scores and EQ-5D-5L item scores. Each EQ-5D-5L item was highly correlated (≥0.69) with at least 1 of the PROMIS domains of Anxiety, Depression, Fatigue, Pain Interference, Physical Function, and Ability to Participate in Social Roles and Activities, except for the Self-care item. In addition, the EQ-5D-5L Anxiety/Depression item was moderately correlated with the PROMIS Cognitive Function and Sleep Disturbance domains. We predicted each EQ-5D-5L item using PROMIS domains with similar content and correlations greater than 0.243 (corresponding to a Cohen’s effect size of 0.5 SD). For the IRT-based linking analysis, we linked PROMIS Physical Function with the Mobility, Self-care, and Usual Activities items, respectively; PROMIS Pain Interference domain with the Pain/Discomfort item; and PROMIS Depression domain with the Anxiety/Depression item.
SORO, Ability to Participate in Social Roles and Activities.
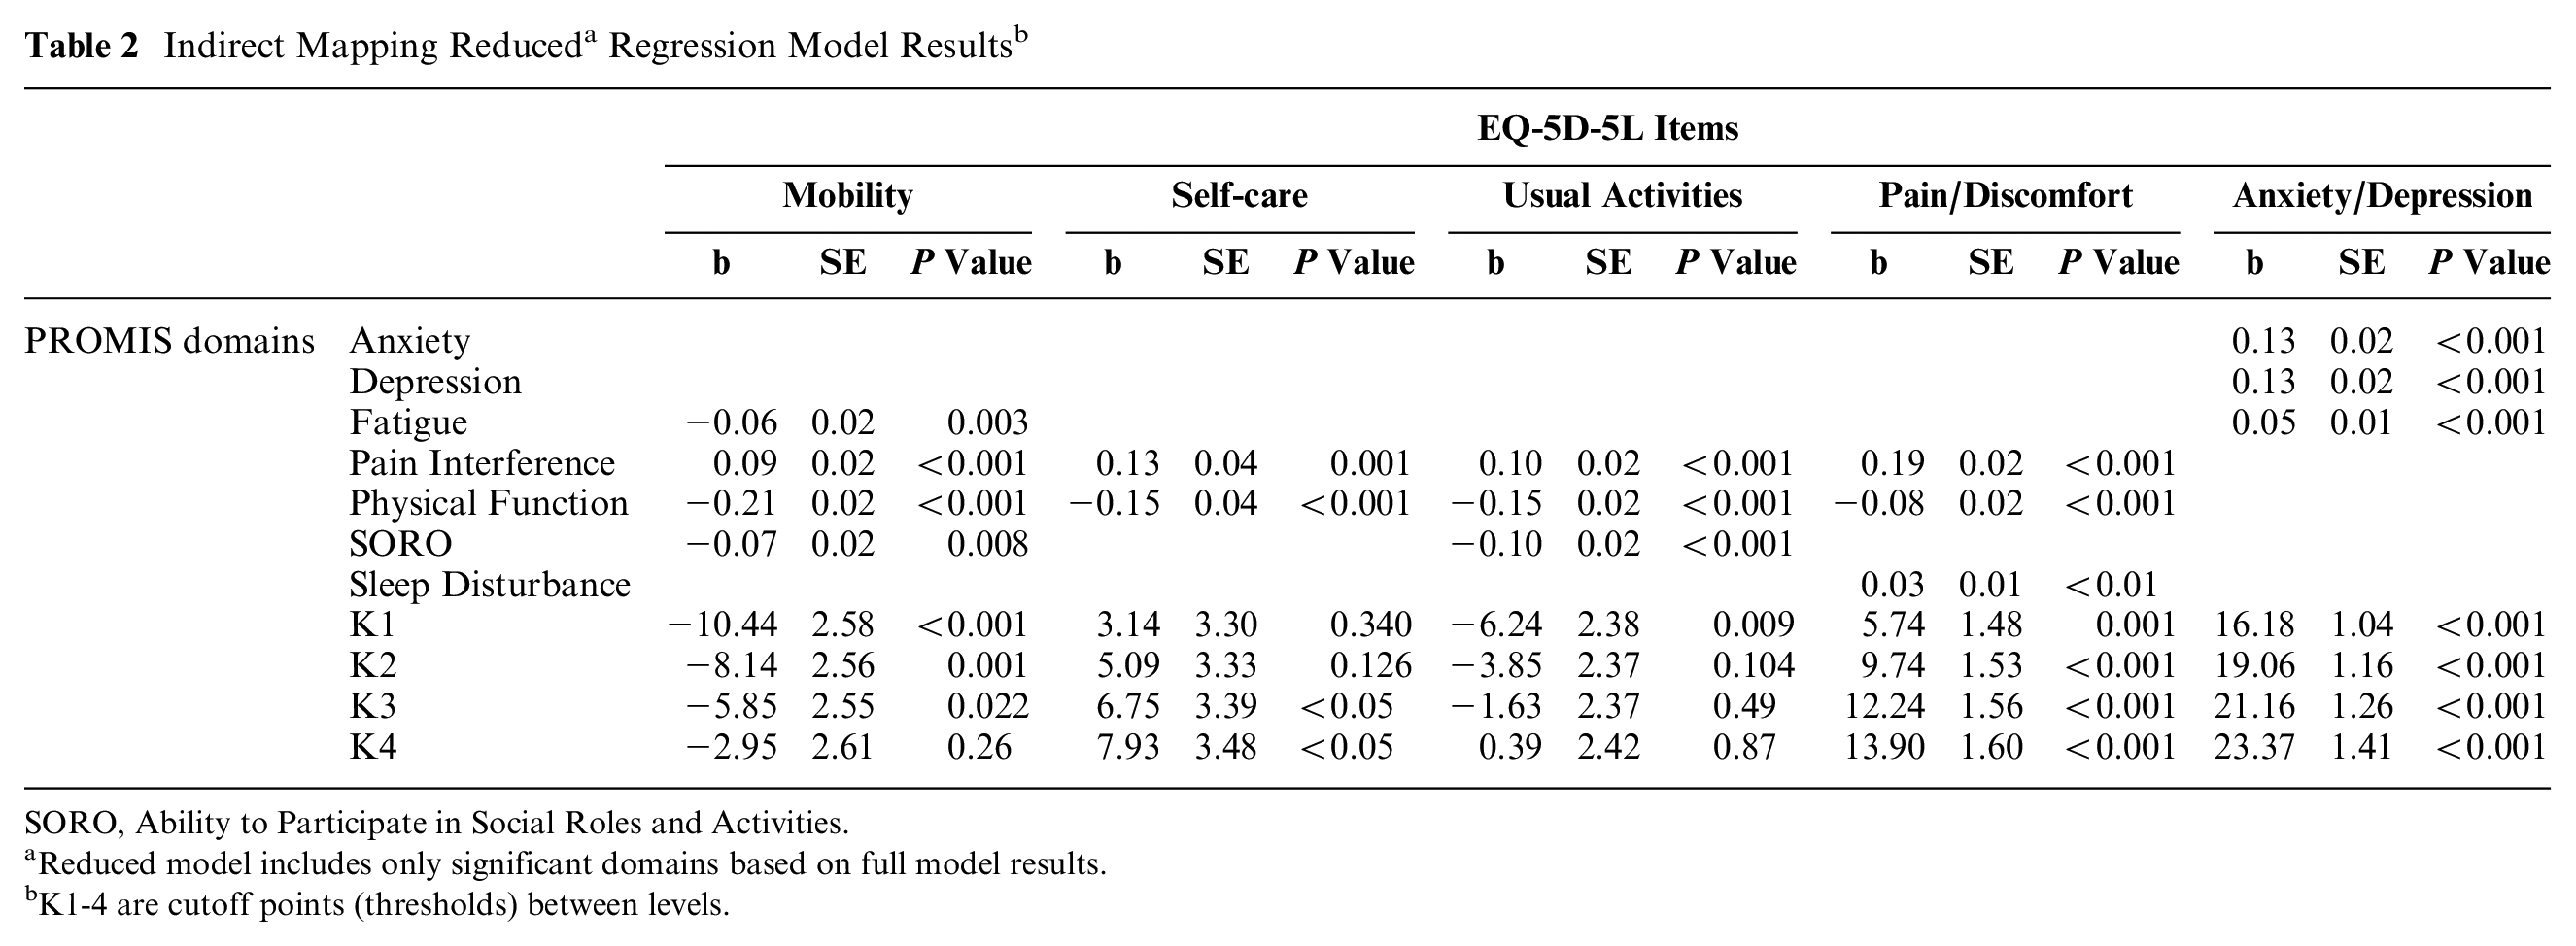
Reduced model includes only significant domains based on full model results.
K1-4 are cutoff points (thresholds) between levels.
All IRT assumptions and logistic assumptions were met. Specifically, all confirmatory factor analysis models built for each IRT-based linking analysis showed that the Comparative Fit Index and the Tucker–Lewis Index were higher than 0.95 and nonsignificant chi-square tests, supporting unidimensionality. Consistent with the high correlations observed in previous IRT-based linking analyses, 24 the correlations between the PROMIS domain raw summed scores and the EQ-5D-5L items to be linked were generally higher than 0.80. Specifically, the correlations were as follows: PROMIS Physical Function with Mobility (−0.97) and Usual Activities (−0.90), PROMIS Pain Interference with Pain/Discomfort (0.87), and PROMIS Depression with Anxiety/Depression (0.84). The exception was the moderate correlation of 0.64 between PROMIS Physical Function and Self-care. We evaluated the robustness of the linking results (shown below) by the accuracy of the linked EQ-5D-5L preference scores and determined that it is worthwhile to maintain this linking. The proportional odds assumption was found to be satisfied for all ordinal logistic regression models. Specifically, the odds ratios for comparing lower categories to higher categories of the response variable were not significantly different across the thresholds, supporting the assumption.
Indirect Mapping
Table 2 shows the indirect mapping results of the reduced models for all 5 EQ-5D-5L items. PROMIS domains of Fatigue, Pain Interference, Physical Function, and Ability to Participate in Social Roles and Activities were significantly associated with Mobility item responses. Pain Interference and Physical Function were significantly related to responses to the Self-care item. Pain Interference, Physical Function, and Ability to Participate in Social Roles and Activities were significantly associated with the Usual Activities item. Pain Interference, Physical Function, and Sleep Disturbance were significantly related to the Pain/Discomfort items. Anxiety, Depression, and Fatigue were significantly associated with the Anxiety/Depression item.
Agreement between observed and predicted EQ-5D-5L item responses tended to be slightly lower in the validation sample, as shown in the weighted kappa column on the right of Table 3. Substantial agreement between observed and predicted item responses was found for the Mobility, Usual Activities, Pain/Discomfort, and Anxiety/Depression items for both estimation and validation samples. The agreement for the Self-care item was moderate in the estimation sample but only fair in the validation sample. This relatively low agreement is consistent with the lower correlations found between this item and PROMIS domains compared with other items.
Evaluation of Prediction Accuracy of Mapping and Linking Models
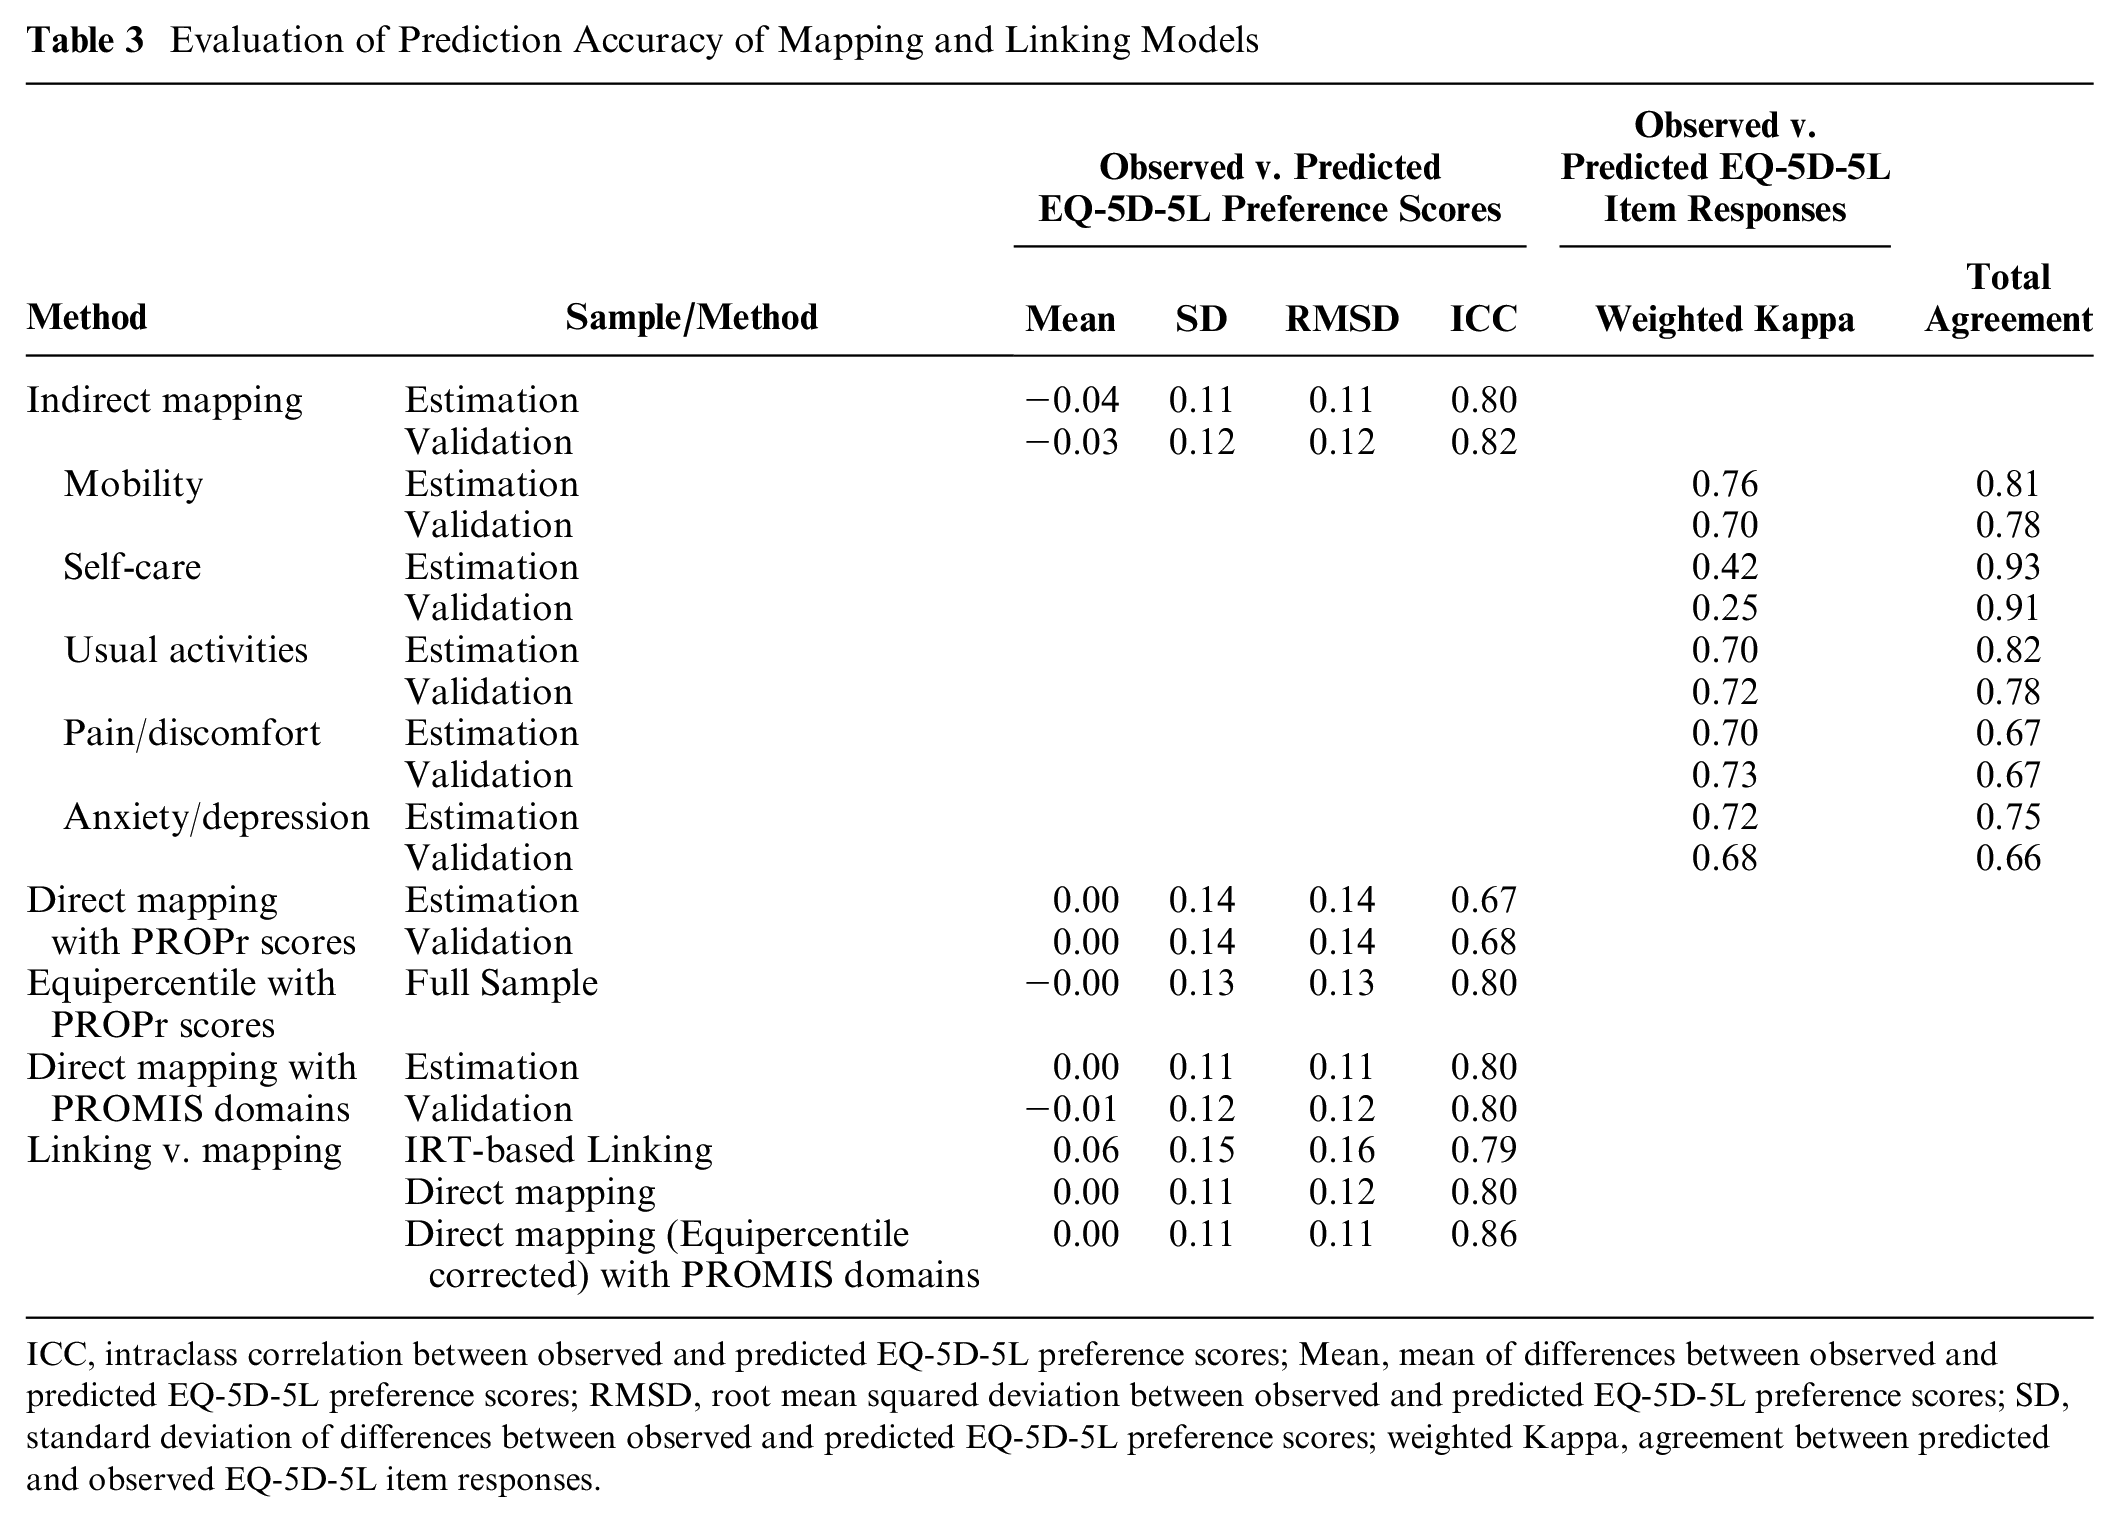
ICC, intraclass correlation between observed and predicted EQ-5D-5L preference scores; Mean, mean of differences between observed and predicted EQ-5D-5L preference scores; RMSD, root mean squared deviation between observed and predicted EQ-5D-5L preference scores; SD, standard deviation of differences between observed and predicted EQ-5D-5L preference scores; weighted Kappa, agreement between predicted and observed EQ-5D-5L item responses.
Predicted EQ-5D-5L item responses were used to estimate EQ-5D-5L preference scores. Table 3 shows the ICCs, means, SDs, and RMSDs of the differences between observed and predicted EQ-5D-5L preference scores based on estimation and validation samples. All models showed acceptable differences between observed and predicted preference scores: small mean differences, SDs, and RMSDs relative to the range of preference scores (<0.15, 9% of the EQ-5D-5L preference score range). ICC values were between 0.6 and 0.9, suggesting moderate to good agreement. These results indicate acceptable model prediction accuracy.
Direct Mapping
In the direct mapping results that used PROMIS domain score as predictors (Table 4), PROMIS Depression, Pain Interference, Physical Function, Ability to Participate in Social Roles and Activities, and Sleep Disturbance were significantly associated with EQ-5D-5L preference scores (see model 1). These PROMIS domains accounted for about 66% of the variance in the EQ-5D-5L preference scores.
Direct Mapping with PROMIS Domains a Reduced Model Results.
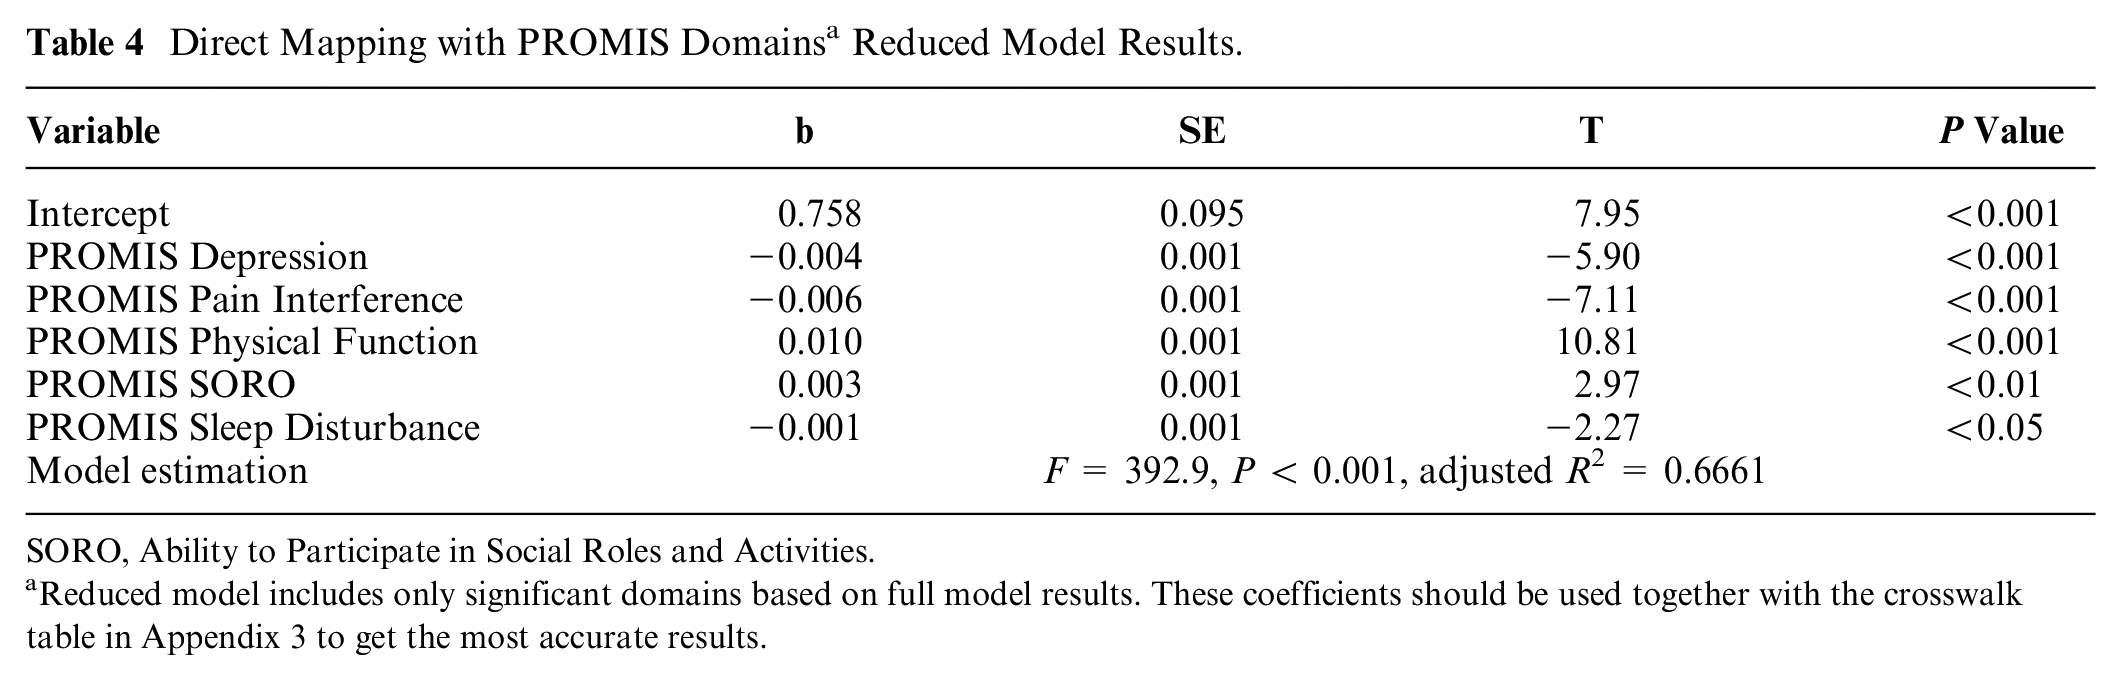
SORO, Ability to Participate in Social Roles and Activities.
Reduced model includes only significant domains based on full model results. These coefficients should be used together with the crosswalk table in Appendix 3 to get the most accurate results.
As shown in Table 3, differences between observed and predicted scores for the direct mapping models indicate that models using the PROPr preference scores or PROMIS domain scores had small SDs and RMSDs (<0.14, 9% of the EQ-5D-5L preference score range), along with moderate to good agreement indicated by ICCs. However, the models using PROMIS domain scores as the predictors showed a smaller magnitude of difference than the models using PROPr preference scores. In particular, the RMSDs of the former models were 0.11 and 0.12 for the estimation and validation samples, respectively, while those of the latter models were 0.14 for both samples.
Table 3 shows that the equipercentile analysis of PROPr scores had smaller SDs and RMSDs than the direct mapping regression models did. Therefore, a crosswalk table (Table 1, Appendix 3) was generated to convert PROPr to EQ-5D-5L preference scores using the equipercentile strategy. The ICCs between predicted and observed scores (>0.8) from the regression models with PROMIS domains supported the equating analysis. It results in a second crosswalk table (Table 2, Appendix 3) for converting EQ-5D-5L preference scores predicted from PROMIS domain scores to more precise scores.
Linking
For the IRT-based linking analysis results, we generated the crosswalks for each linking pair (see Appendix 2). These crosswalks can be used bidirectionally to convert the scores of the 2 measures. We converted EQ-5D-5L item responses to PROMIS domain T-scores and evaluated the discrepancy between observed and linked domain scores. Table 5 shows the linking accuracy for each linking pair. The linking accuracy for the pair of Self-care and PROMIS Physical Function was lower than other pairs, with an ICC of 0.39 and an RMSD of 7.3 on the T-score metric, which typically has an observed range of 70. ICCs were larger than 0.65 for all other pairs, and RMSDs were between 5 and 7 for all other pairs. We converted PROMIS T-scores to EQ-5D-5L item responses. We found substantial agreement (>0.65) between the observed and linked item responses for each item except the Self-care item. This might be due to the lower correlation between the pair of Self-care items and the PROMIS Physical Function domain score. We used the linked EQ-5D-5L item responses to compute the corresponding preference score. The comparison with the observed score shows a slightly higher RMSD (0.16, 10% of the EQ-5D-5L preference score range) than the mapping models (Table 3).
Evaluation of Linking Accuracy
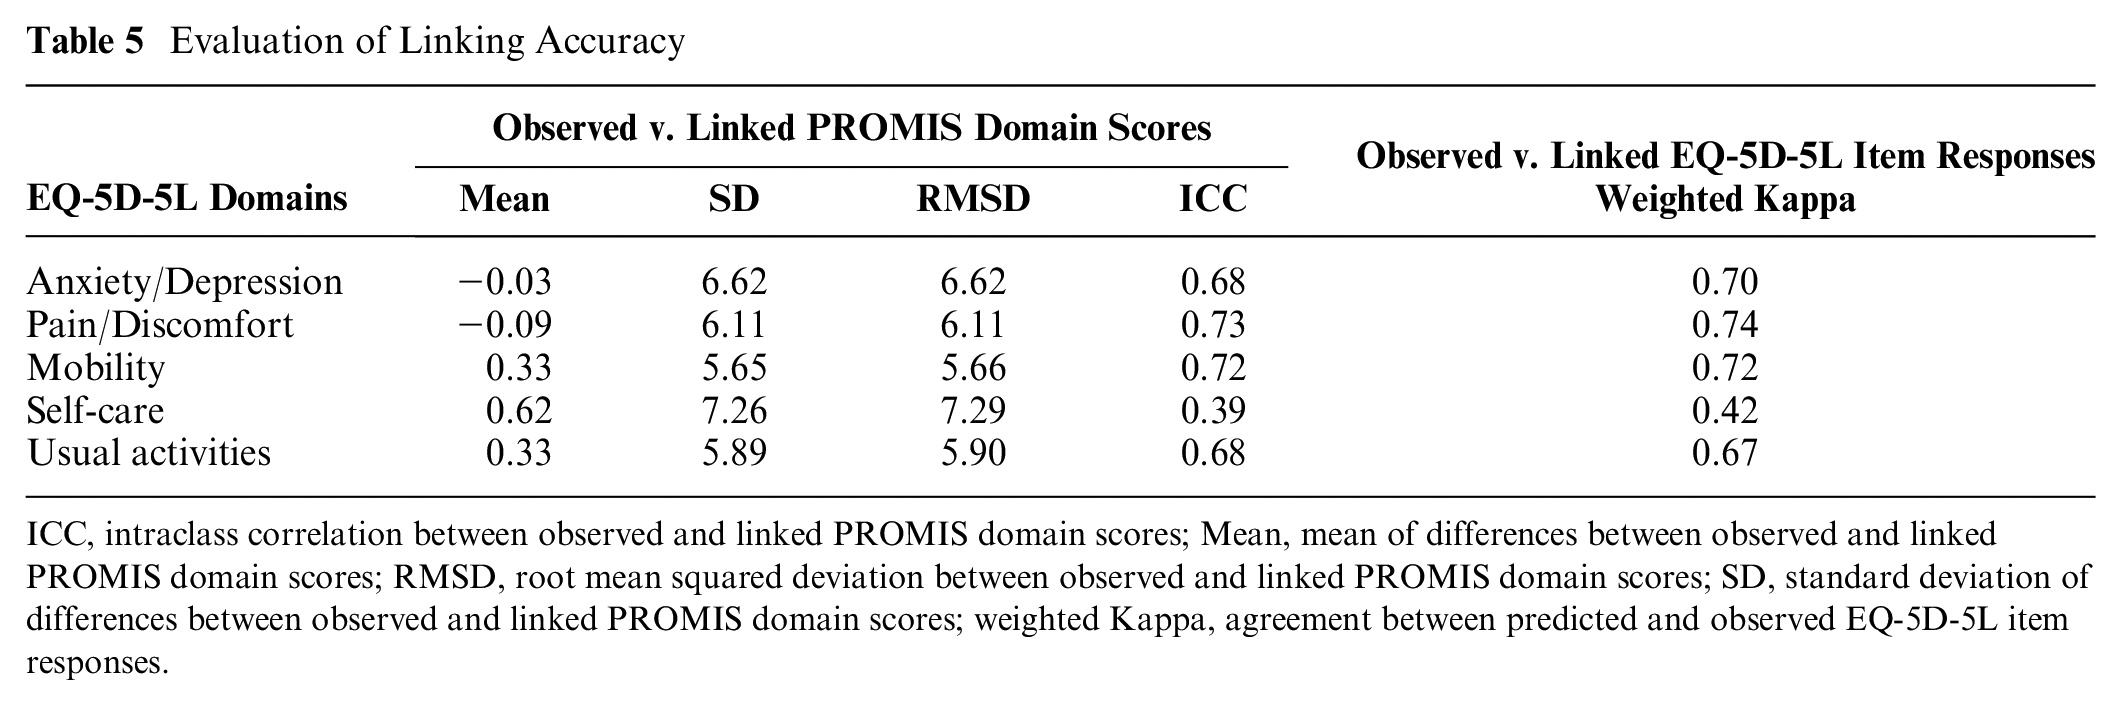
ICC, intraclass correlation between observed and linked PROMIS domain scores; Mean, mean of differences between observed and linked PROMIS domain scores; RMSD, root mean squared deviation between observed and linked PROMIS domain scores; SD, standard deviation of differences between observed and linked PROMIS domain scores; weighted Kappa, agreement between predicted and observed EQ-5D-5L item responses.
Mapping versus Linking
Finally, we compared the linking or prediction accuracy between IRT-based linking and regression-based direct mapping approaches with equating strategies using RMSDs between the observed and predicted EQ-5D-5L preference scores based on the total sample (Table 3). The regression-based direct mapping approach shows lower RMSD (0.12 v. 0.16) and higher ICC than the IRT-based linking (0.80 v. 0.79). The direct mapping with equating strategies exhibits even lower RMSD (0.11, 7% of the score range, v. 0.16, 10%) and higher ICC (0.86 v. 0.79). In addition, the direct mapping RMSD is approximately 50% of the interquartile range of the observed scores, whereas the linking RMSD is about 73%. Both values fall within an acceptable range, but direct mapping demonstrates better precision. Figure 1 shows the observed and predicted preference scores from both approaches. The direct mapping approach showed more precise score estimation than the IRT-based linking approach, especially for participants with moderate to high preference scores. The IRT-based linking approach, however, covers a broader range of the EQ-5D-5L preference score than does the direct mapping approach without equating (1.55 v. 0.73), especially for very low EQ-5D-5L preference scores (<0.2). However, applying the equating strategy to the direct mapping method covered a similarly wide score range as the linking approach, indicating the successful application of the equating strategy. The direct mapping approach with the equipercentile equating strategy proved to be superior to the linking method due to its improved prediction accuracy and comparable score range coverage. The linking approach is beneficial when only the PROMIS domains of Physical Function, Pain Interference, and Depression are available. Table 6 shows a summary of the recommended conversion method to apply based on the available and desired scores.
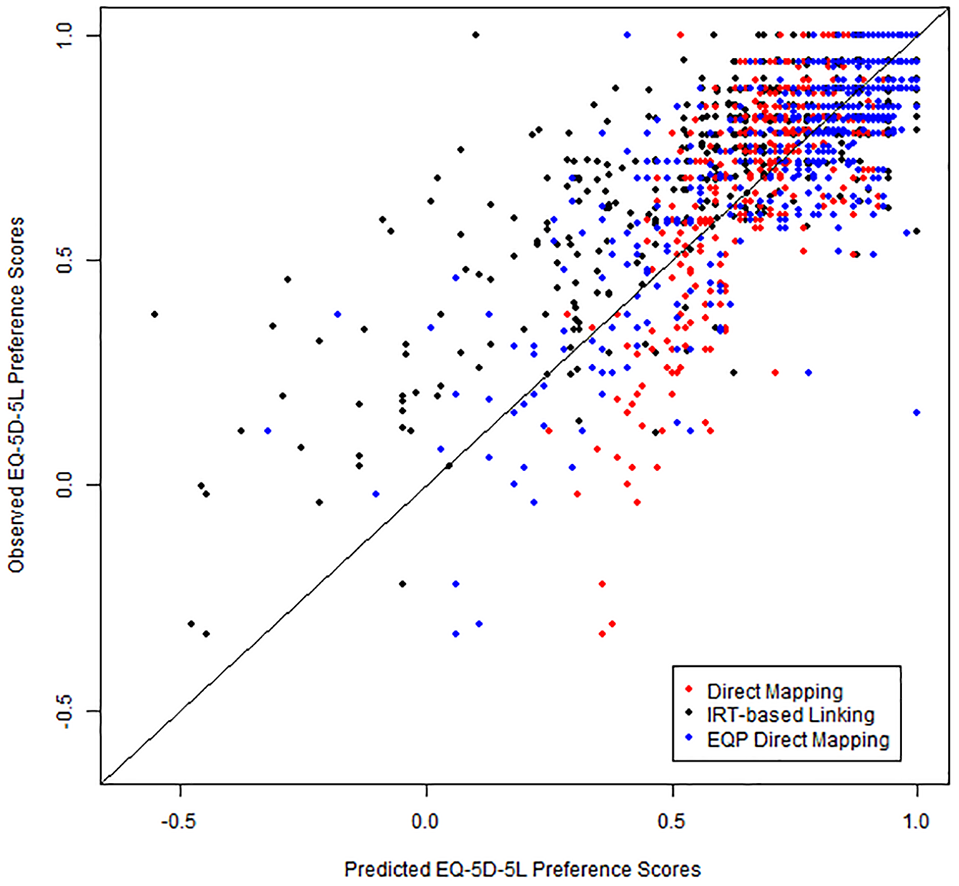
Scatterplots of predicted and observed EQ-5D-5L preference scores based on the direct mapping approach and the IRT-based linking approach, both using PROMIS domains.
Summary of Recommended Score Conversion Methods
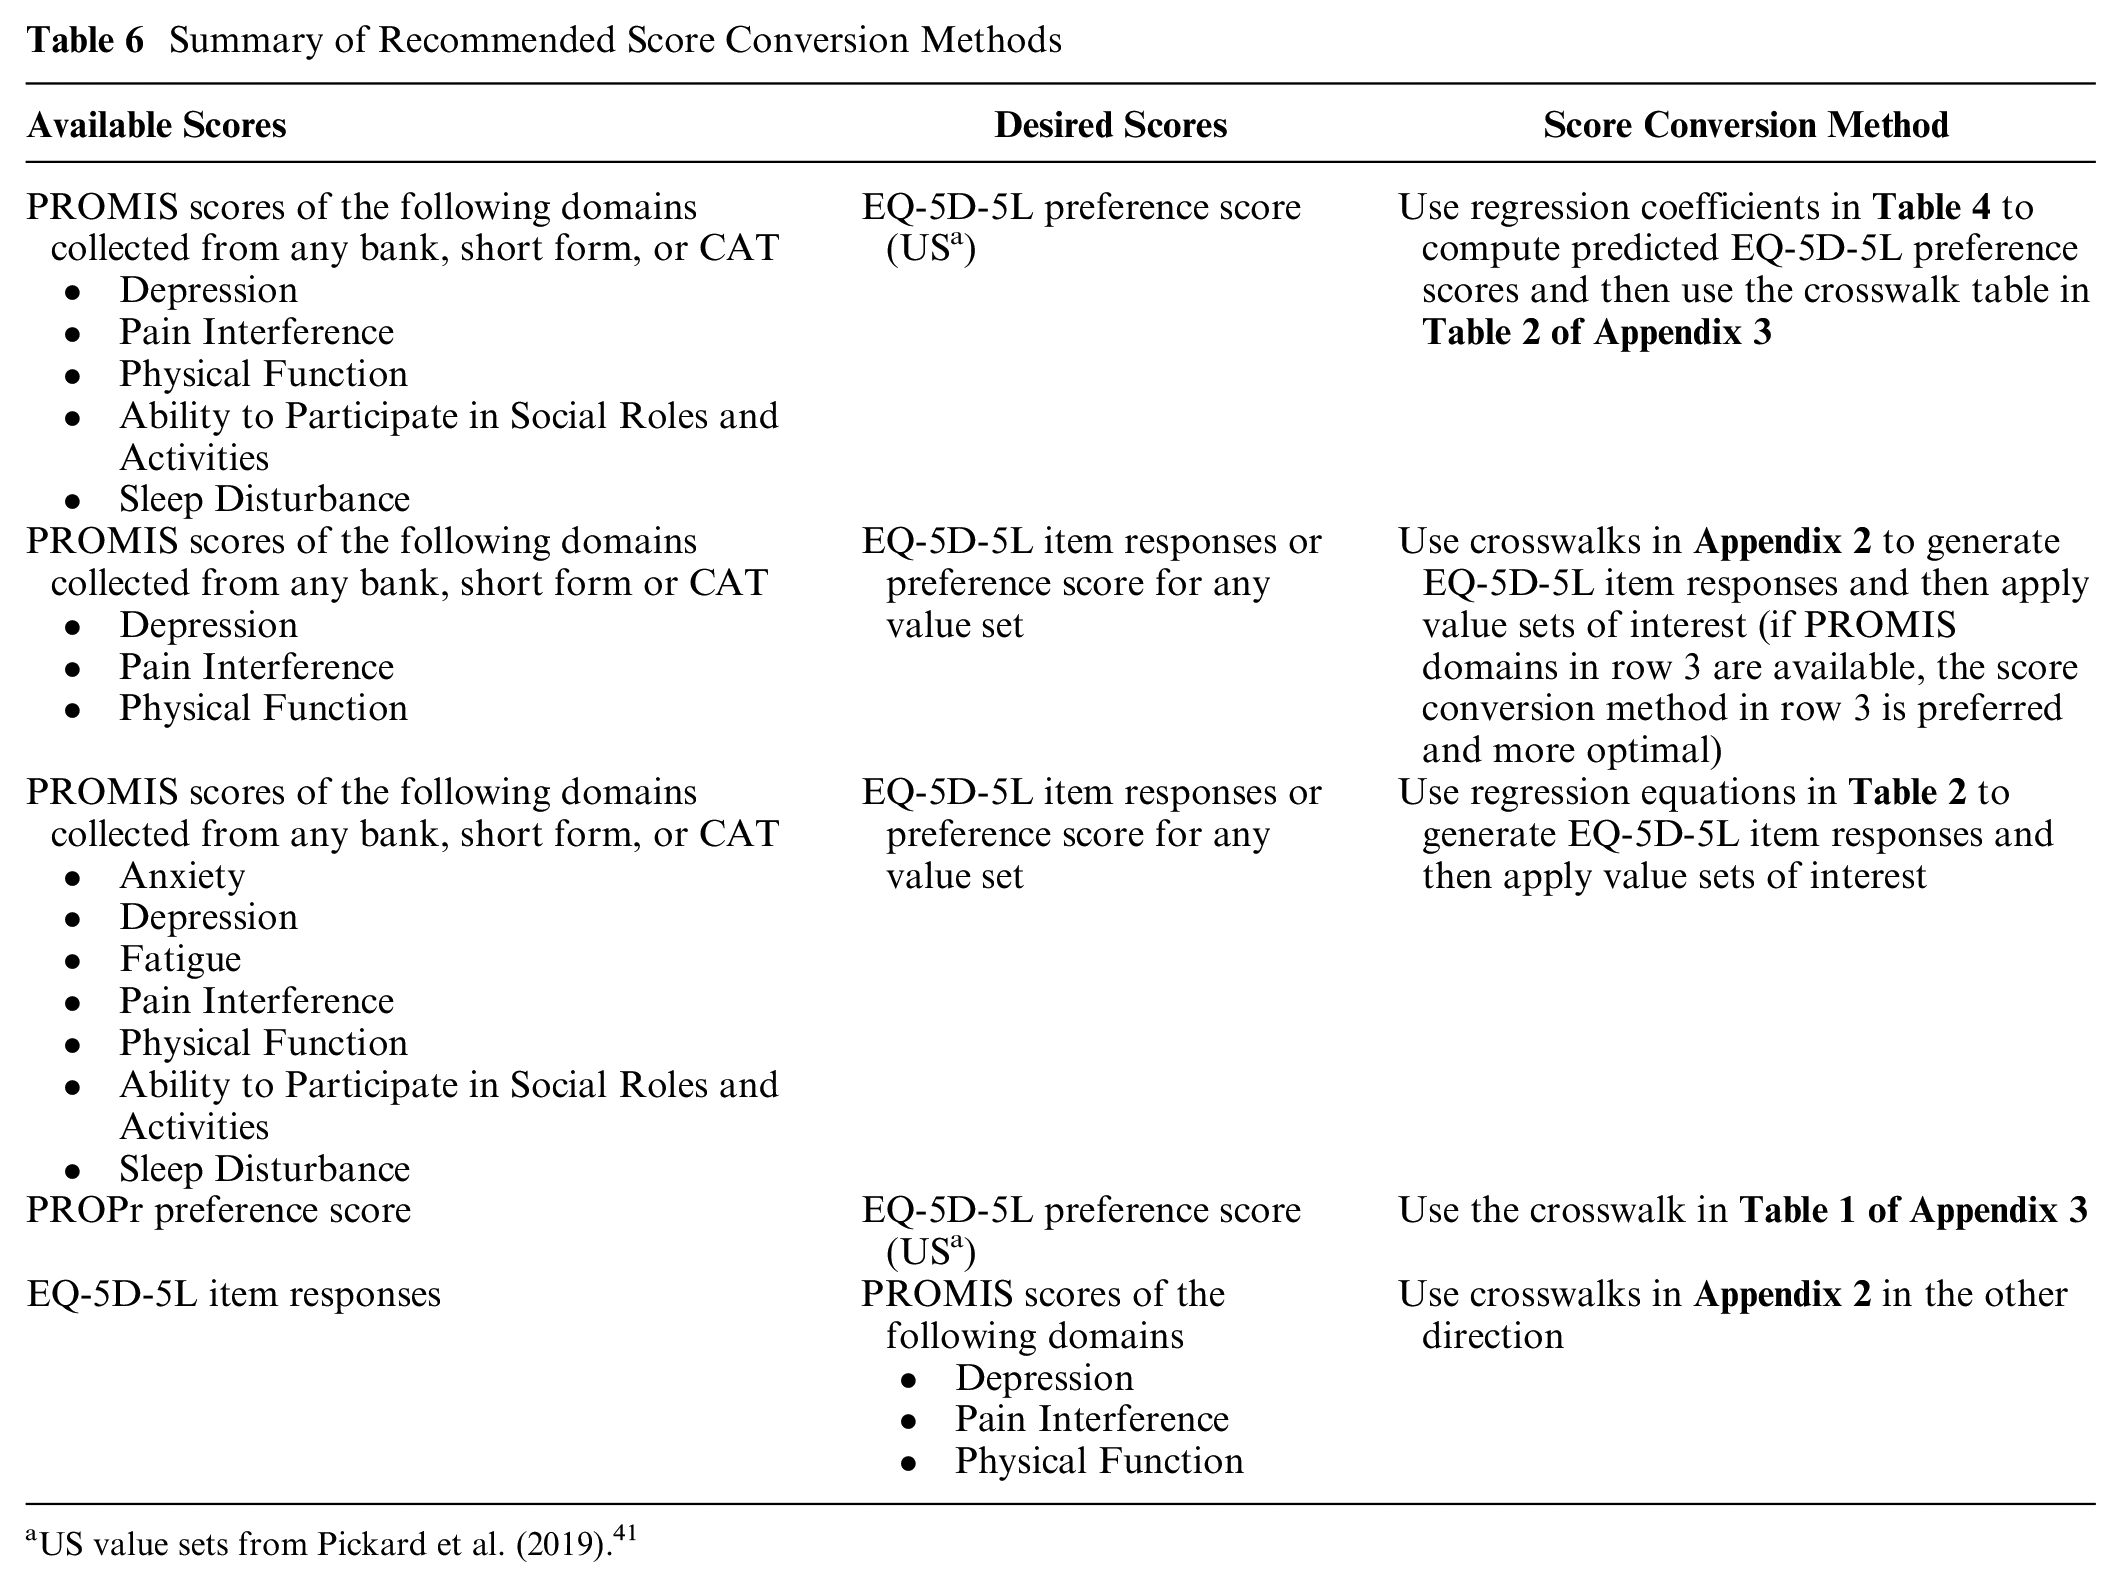
US value sets from Pickard et al. (2019). 41
Discussion
This study used direct and indirect mapping methods with equating strategies to estimate EQ-5D-5L preference scores from the PROPr and the PROMIS domains included in the PROMIS-29+2 based on a sample of the US general population. Furthermore, IRT-based linking methods were applied to link PROMIS domains with EQ-5D-5L items. The accuracy of all methods was estimated and compared. Corresponding crosswalk tables were derived for each method, and recommendations for selecting a conversion method based on available and desired scores were provided.
Five of the 8 PROMIS domains included in the PROMIS-29+2 (Depression, Pain interference, Physical Function, Ability to Participate in Social Roles and Activities, and Sleep Disturbance) yielded significant predictions of EQ-5D-5L preference scores, and 7 domains (above plus Fatigue and Anxiety) significantly predicted the responses of each EQ-5D-5L item. The observed and predicted EQ-5D-5L preference scores and EQ-5D-5L items exhibited minor discrepancies for both the estimation and validation sample, with small RMSDs and moderate to substantial agreement, respectively. Notably, the Cognitive Function domain included in the PROPr and the PROMIS-29+2 did not highly correlate with any of the EQ-5D-5L domains and was not significant in the EQ-5D-5L prediction models. This highlights a limitation of the EQ-5D as several studies have shown that cognitive function is an essential aspect of HRQoL50,51 and was deemed second most important to the overall quality of life after Physical Function by a community sample. 52 Moreover, a recent publication on healthcare consumer acceptability of the EQ-5D-5L in clinical care 53 suggested that the EQ-5D-5L did not capture the cognition-related aspects of illness. Conversely, the PROMIS domains were not strongly associated with the self-care domain, suggesting a possible limitation at the lower end of the PROPr utility scale.
As both direct and indirect mapping approaches demonstrate acceptable precision in score estimation, selecting the 2 methods hinges on the specific research needs. If the aim is to generate EQ-5D-5L item responses alongside the preference score, we recommend using indirect mapping based on the 7 PROMIS domains. However, suppose the interest is only in EQ-5D-5L preference scores estimated from PROMIS domains. In that case, we recommend direct mapping and the corresponding equated crosswalk table, as only the 5 PROMIS domains are required. Finally, we recommend using the equipercentile crosswalk table to convert scores between the PROPr preference scores and EQ-5D-5L preference.
The IRT-based linking approach computes the crosswalk for each EQ-5D-5L item using 3 PROMIS domains: Depression, Pain Interference, and Physical Function. Although the RMSDs between the observed and linked PROMIS domain scores were slightly higher compared with the linking studies crosswalking other patient-reported outcome measures,35,38,54 it can be attributed to the nature of a single-item linking analysis with only 5 categories. We observed substantial agreement between the observed and linked EQ-5D-5L item responses, except for the Self-care item.
Due to the score convertibility of different combinations of items in the same PROMIS domain, 24 using these mapping formulas and linking crosswalks, administering any PROMIS measures or computer adaptive tests of the PROMIS domains would yield satisfactory prediction of EQ-5D-5L preference scores. Previous studies that have independently collected PROMIS domain scores or EQ-5D-5L scores can now be harmonized and compared using this study’s mapping formula or the crosswalks.
Both mapping and linking approaches have strengths and limitations. Indirect and direct mapping can use domain scores and sociodemographic variables to estimate EQ-5D-5L preference scores and item responses. Mapping models outperformed the IRT-based linking approach by showing smaller discrepancies between observed and predicted EQ-5D-5L scores. Because OLS regression is prone to regression to the mean, 32 equating should be applied to predicted estimates. In addition, mapping based on only observed scores may be less accurate due to sampling error when applied to a different sample.
Although this study demonstrates that direct mapping with the equating strategy produces more precise results than the IRT-based linking approach does, the IRT-based linking approach still offers several advantages. It needs scores from only 3 PROMIS domains to generate EQ-5D-5L preference scores. Since the crosswalks compute EQ-5D-5L item responses, EQ-5D-5L preference scores for any value set—not restricted to US value sets as in direct mapping—can be generated using these item responses. In addition, the IRT-based linking relationships will likely be generalizable to other samples. The linking crosswalks can bidirectionally convert scores between the 2 measures. Both methods can generate acceptably precise EQ-5D-5L scores, with the direct mapping approach using the equating strategy offering better precision. Table 6 details specific recommendations for converting scores between PROMIS and EQ-5D-5L based on the available and desired scores.
This study has several limitations. First, although the model results are acceptable, future research may conduct a validation study to evaluate the model results and examine if better mapping accuracy between predicted and actual scores can be achieved. Second, we exclusively used the logistic and OLS regression models commonly used for mapping purposes. However, several advanced models are applicable for mapping,5,29,55,56 such as Tobit and Betamix. Future studies can explore the potential of these models and assess their effectiveness in predicting scores compared with the IRT-based linking approach. Third, we evaluated only some possible sociodemographic variables in the mapping models. Fourth, we conducted this study based on the general population. Future studies can use clinical samples or samples with different characteristics to verify the mapping equations and linking crosswalks.
Conclusions
This study is the first to employ mapping and linking approaches to estimate EQ-5D-5L items and preference scores based on PROMIS health domains and PROPr. Researchers, clinicians, and stakeholders can use this study’s mapping formulas and linking crosswalks to convert scores between PROMIS and EQ-5D-5L. We summarized recommended score conversion tables based on available and desired scores.
Supplemental Material
sj-docx-1-mdm-10.1177_0272989X251340990 – Supplemental material for Mapping and Linking between the EQ-5D-5L and the PROMIS Domains in the United States
Supplemental material, sj-docx-1-mdm-10.1177_0272989X251340990 for Mapping and Linking between the EQ-5D-5L and the PROMIS Domains in the United States by Xiaodan Tang, Ron D. Hays, David Cella, Sarah Acaster, Benjamin David Schalet, Asia Sikora Kessler, Montserrat Vera Llonch and Janel Hanmer in Medical Decision Making
Supplemental Material
sj-docx-2-mdm-10.1177_0272989X251340990 – Supplemental material for Mapping and Linking between the EQ-5D-5L and the PROMIS Domains in the United States
Supplemental material, sj-docx-2-mdm-10.1177_0272989X251340990 for Mapping and Linking between the EQ-5D-5L and the PROMIS Domains in the United States by Xiaodan Tang, Ron D. Hays, David Cella, Sarah Acaster, Benjamin David Schalet, Asia Sikora Kessler, Montserrat Vera Llonch and Janel Hanmer in Medical Decision Making
Supplemental Material
sj-docx-3-mdm-10.1177_0272989X251340990 – Supplemental material for Mapping and Linking between the EQ-5D-5L and the PROMIS Domains in the United States
Supplemental material, sj-docx-3-mdm-10.1177_0272989X251340990 for Mapping and Linking between the EQ-5D-5L and the PROMIS Domains in the United States by Xiaodan Tang, Ron D. Hays, David Cella, Sarah Acaster, Benjamin David Schalet, Asia Sikora Kessler, Montserrat Vera Llonch and Janel Hanmer in Medical Decision Making
Footnotes
The authors declared the following potential conflicts of interest with respect to the research, authorship, and/or publication of this article: Asia Sikora Kessler and Montserrat Vera Llonch are employed by Ionis and own company stock. The rest of the authors have no relevant financial or nonfinancial interests to disclose. The authors disclosed receipt of the following financial support for the research, authorship, and/or publication of this article: This study was funded by Ionis Pharmaceuticals.
Authors’ Contributions
Conceptualization: all authors; methodology: all authors; data curation: Janel Hanmer; formal analysis and investigation: Xiaodan Tang, David Cella; writing – original draft preparation: Xiaodan Tang; writing – review and editing: all authors; funding acquisition: Asia Sikora Kessler, Montserrat Vera Llonch; resources: Ron D. Hays, Sarah Acaster, Benjamin David Schalet, David Cella; supervision: David Cella.
Ethical Considerations
The study that collected survey data used in the current study was approved by the Institutional Review Board at ICF International (study No. FWA00002349).
Consent to Participate
Not applicable.
Consent for Publication
Not applicable.
References
Supplementary Material
Please find the following supplemental material available below.
For Open Access articles published under a Creative Commons License, all supplemental material carries the same license as the article it is associated with.
For non-Open Access articles published, all supplemental material carries a non-exclusive license, and permission requests for re-use of supplemental material or any part of supplemental material shall be sent directly to the copyright owner as specified in the copyright notice associated with the article.