
Abstract
Background
Parameter uncertainty in EQ-5D-5L value sets often exceeds the instrument’s minimum important difference, yet this is routinely ignored. Multiple imputation (MI) accounts for parameter uncertainty in the value set; however, no valuation study has implemented this methodology. Our objective was to create a Canadian MI value set for the EQ-5D-5L, thus enabling users to account for parameter uncertainty in the value set.
Methods
Using the Canadian EQ-5D-5L valuation study (N = 1,073), we first refit the original model followed by models with state-level misspecification. Models were compared based on the adequacy of 95% credible interval (CrI) coverage for out-of-sample predictions. Using the best-fitting model, we took 100 draws from the posterior distribution to create 100 imputed value sets. We examined how much the standard error of the estimated mean health utilities increased after accounting for parameter uncertainty in the value set by using the MI and original value sets to score 2 data sets: 1) a sample of 1,208 individuals from the Canadian general public and 2) a sample of 401 women with breast cancer.
Results
The selected model with state-level misspecification outperformed the original model (95% CrI coverage: 94.2% v. 11.6%). We observed wider standard errors for the estimated mean utilities on using the MI value set for both the Canadian general public (MI: 0.0091; original: 0.0035) and patients with breast cancer (MI: 0.0169; original: 0.0066).
Discussion and Conclusions
We provide 1) the first MI value sets for the EQ-5D-5L and 2) code to construct MI value sets while accounting for state-level model misspecification. Our study suggests that ignoring parameter uncertainty in value sets leads to falsely narrow SEs.
Highlights
Value sets for health state utility instruments are estimated subject to parameter uncertainty; this parameter uncertainty may exceed the minimum important difference of the instrument, yet it is not fully captured using current methods.
This study creates the first multiply imputed value set for a multiattribute utility instrument, the EQ-5D-5L, to fully capture this parameter uncertainty.
We apply the multiply imputed value set to 2 data sets from 1) the Canadian general public and 2) women with invasive breast cancer.
Scoring the EQ-5D-5L using a multiply imputed value set led to wider standard error estimates, suggesting that the current practice of ignoring parameter uncertainty in the value set leads to falsely low standard errors.
Our work will be of interest to methodologists and developers of the EQ-5D-5L and users of the EQ-5D-5L, such as health economists, researchers, and policy makers.
This is a visual representation of the abstract.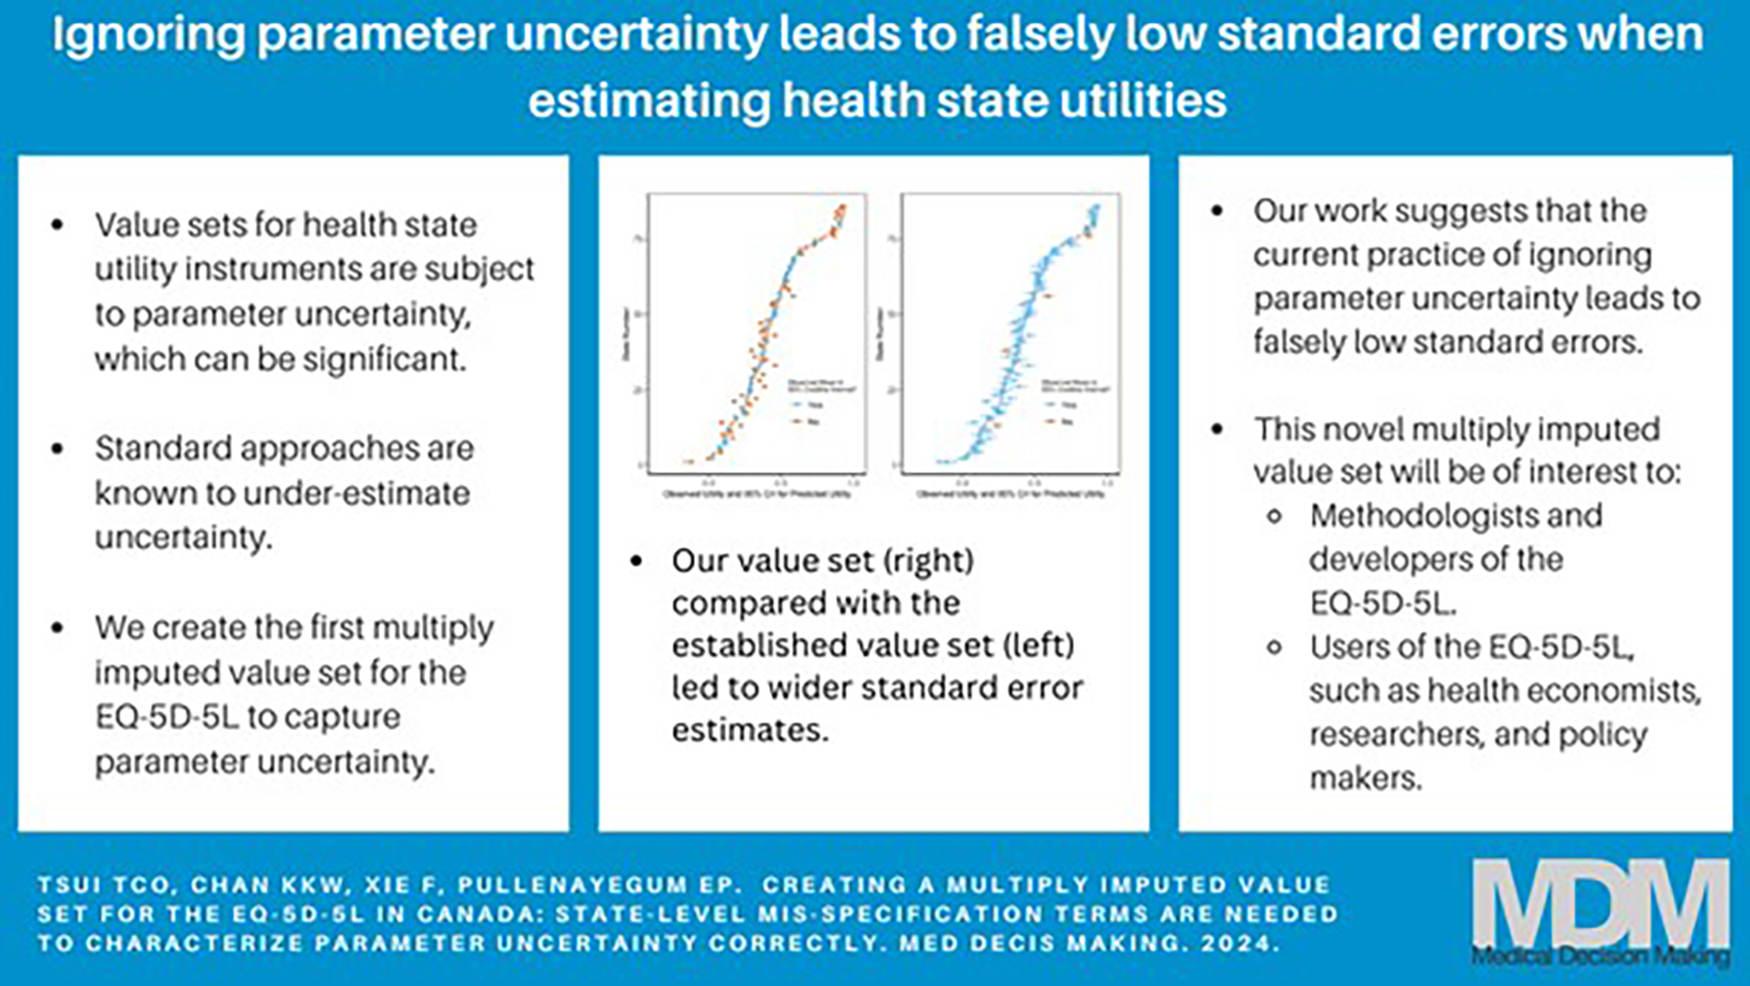
Value sets enable the scoring of preference-based instruments to calculate quality-adjusted life-years (QALYs). Decisions regarding the public reimbursement of drugs rely heavily on the incremental cost-effectiveness ratio of an economic evaluation, the additional cost of a new intervention relative to QALYs gained. QALYs are health utilities multiplied by quantity of life, a key measure of effectiveness in economic evaluations. Multiattribute utility instruments (MAUIs) are preference-based instruments that measure health-related quality of life, anchored at 0 (dead) and 1 (full health). MAUIs consist of attributes and levels within each attribute.
Responses to MAUIs are scored using a value set, which assigns a utility to each health state captured by the instrument. According to welfarist economics, utilities used in economic evaluations should reflect the preferences of the general public. 1 Utilities are elicited using direct approaches such as time tradeoff (TTO), standard gamble (SG), or discrete choice experiments (DCE). 1 While value sets are vital, they are also estimated, rather than known.
Conventionally, the uncertainty in estimated value sets is ignored, yet health utilities are input parameters in cost utility analyses. Parameter uncertainty in value sets includes uncertainty in the functional form of the model and estimation of regression coefficients. 2 Pullenayegum et al. 2 found that uncertainty in the functional form explained 84% of the mean squared prediction error. When both sources were accounted for in the US EQ-5D-3L valuation study, the mean 95% credible interval (CrI) width for the mean utilities in the value set was 0.152, exceeding the minimum important difference (MID) for the EQ-5D-3L (range: 0.03 to 0.08).3–5 Kharroubi et al. 6 found that the uncertainty around SF-6D health states is comparably large, with posterior standard deviations (s) of ∼0.03, which would lead to 95% CrI widths of about 0.12. While this magnitude of uncertainty is known for the EQ-5D-3L and SF-6D, parameter uncertainty is not known for other preference instruments. When it comes to the severity of health states, mild health states have a smaller magnitude of uncertainty; however, this uncertainty is still nonnegligibly large relative to their disutility. This uncertainty in health utilities is not conventionally accounted for, and therefore, 95% CrIs that do not account for the true extent of uncertainty are falsely narrow. Ignoring the uncertainty in health utilities results in incremental cost-effectiveness ratios (ICERs) that use health utilities being reported with a false level of precision and consequently misrepresentation of the level of confidence provided by these economic analyses.
Since the true value of the mean health utility for each health state is unknown, it can be conceptualized as missing data. Chan et al. 7 proposed multiple imputation to account for uncertainty in the value set. When using multiple imputation to handle missing data, one takes multiple draws of the missing data from its distribution given the observed data to create multiple imputed data sets. Each imputed data set is analyzed to obtain multiple estimates of the parameter of interest. This allows us to quantify uncertainty in the estimated parameter due to not knowing the true values of the missing data: when computing the standard error (SE) of an estimated parameter, one considers both the estimated SE from analyzing each imputed data set as well as the variance of the estimates across imputations (known as Rubin’s rule 8 ).
The same principle applies to value sets when we consider the true value of the value set as missing data. We take multiple draws of the value set from its posterior distribution given the valuation data; we thus have multiple value sets. Now suppose a sample of respondents in a randomized controlled trial has filled out the MAUI and we wish to score their responses to estimate the incremental mean QALYs (ΔQALY). The researcher would score the MAUI responses using each imputed value set and estimate ΔQALY using each imputed value set. The uncertainty in ΔQALY due to both sampling variation in MAUI responses and due to parameter uncertainty in the value set is then quantified using both the estimated SEs in ΔQALY on using each value set and the variance in estimates of ΔQALY across value sets.
While this methodology has been shown to account for uncertainty in the value set, 7 the methodology has never been implemented in practice. No valuation study has published multiple draws of the value set from its posterior distribution. The EQ-5D-5L is the most widely used MAUI.9–13 The EQ-5D-5L has 5 dimensions of health (i.e., mobility, self-care, usual activities, pain/discomfort, anxiety/depression),14,15 each with 5 levels of severity (i.e., no, slight, moderate, severe, and extreme problems), 15 representing 3,125 (5 5 ) possible health states. The Canadian EQ-5D-5L value set used individual-level TTO utilities to predict population mean utilities for each health state as a function of health state attributes. The overall objective of this study was to create a Canadian multiply imputed value set for the EQ-5D-5L that can be used to account for parameter uncertainty. Toward this objective, we compared 3 models: 1) the original model, 2) a main effects model with state-level misspecification terms, and 3) a main effects model with spatially correlated misspecification terms. We used the best performing model to create 100 imputed value sets. We then illustrated how these imputed value sets can be used to account for uncertainty in 2 studies: in the first, we estimated mean utility experienced by the Canadian general population, and in the second, we estimated mean health utility among women with breast cancer from the Breast Utility Instrument study.16,17
Methods
Canadian EQ-5D-5L Data
We used EQ-VT TTO responses collected from members of the general public from the Canadian valuation study (N = 1,073). 18 A previous multicountry pilot study determined that a sample size of 1,000 per country and valuing 86 health states would allow estimating 50 parameters with acceptable precision. 19 In this study, participants were quota sampled to represent the Canadian general population from Ontario, British Columbia, Alberta, and Quebec. 18 Participants first completed the EQ-5D-5L to indicate their own health state. Next, participants valued a block of 10 health states using composite TTO (cTTO) tasks presented in random order. The 86 health states valued were grouped into 10 blocks, with 10 health states per block. 18 These 86 health states included 5 very mild health states with only 1 dimension at level 2 (e.g., 21111, 12111) and the worst state (55555). The remaining 80 health states were selected to cover a range of severity. 18 Each participant also completed traditional TTO (tTTO) for 2 severe health states from among the 86 health states.
Models Used to Estimate Mean Health State Disutilities
First, we refit the original model, followed by fitting models with model misspecification terms. As in the original study, due to concerns about using cTTO to elicit utilities for health states worse than dead, cTTO values were censored at zero while the tTTO values were left uncensored. 18
Notation
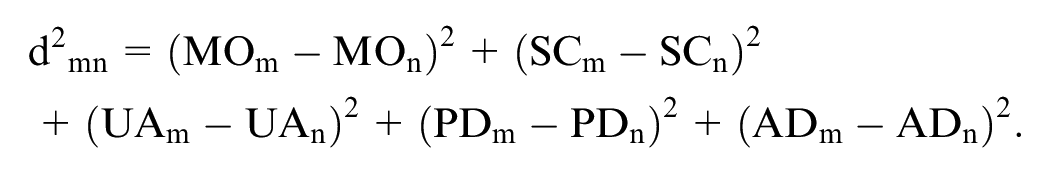
Let Tik be participant i’s disutility (i.e., 1-utility) for the kth health state that they value (thus k = 1, 2, . . ., 12 since each respondent valued 10 health states using cTTO and 2 health states using tTTO). Let j(ik) index be the state number corresponding to the kth health state valued by individual i, with j(ik) taking values in 1, . . ., 86. Let
Original Model
The original scoring model for EQ-5D-5L responses developed by Xie et al. 18 is expressed as

where
εik,∼ N(0, σε2)
where Tik, j(ik), Xj,
Adding Misspecification
The original Xie model assumes that

where
Main Effects Model with Correlated Model Misspecification
Shams and Pullenayegum
20
extended equation 2 above, where
Mathematically, the model with correlated misspecification can be specified as

where
We refer to this model as the Shams model. 20
Model Fitting
We fit the original model (Xie model)
18
and misspecification models without spatial correlation (“Chan model”) and with spatial correlation (“Shams model”) under the Bayesian paradigm. We assigned vague priors, as follows:
Model Diagnostics
The 3 fitted models were evaluated based on 3 criteria: 1) posterior predictive assessment of model fit, 26 2) adequacy of 95% CrIs, and 3) width of 95% CrI for out-of-sample states. We describe these criteria in more detail below.
Posterior predictive assessment of model fit
Gelman et al.
26
outlined an approach to assessing model fit via posterior predictive distributions, which we operationalized in our analysis as follows. We sampled 1,000 replicate data sets from the posterior predictive distribution. Specifically, we saved 1,000 samples of
We also computed the sample mean utilities for the original data, which we denote
For each replicate data set s, we formed the statistics

and

We counted the proportion of times that
2. Adequacy of 95% CrIs derived from posterior predictive distributions.
For all 3 models, we iteratively omitted 1 health state (state j, j = 1, . . .,86), refit the model, and obtained the predicted mean utility
With 86 health states, we had 86 such intervals. We computed the proportion of these intervals that contained zero. If the model is correct, we would expect this proportion to lie between 0.91 and 0.99 with probability 0.95 (these numbers were obtained by inverting the Clopper-Pearson exact binomial test for the probability of a proportion being equal to 0.95).
3. The 95% CrI of the posterior predictive distribution of the mean utility for each omitted health state is
We used the first 2 criteria to assess the adequacy of each model. Among models that were adequate, we used the third criterion to identify the model that gave the most precise predictions and that would therefore be preferred.
Creating a Multiply Imputed Value Set
Using these criteria, we selected a preferred model and took draws from its posterior distribution to create a multiply imputed value set for the EQ-5D-5L in Canada. Specifically, using the preferred model, we ran an additional 10,000 iterations and took draws at lags of 100 to create 100 imputed value sets, with each value set comprising a draw from the posterior distribution of the utilities for each of 3,125 health states.
Applying the Multiply Imputed Value Set to 2 Data Sets
With the multiply imputed value set, we calculated pooled means and SE in the Canadian general public and in a sample of women with invasive breast cancer. We describe these 2 populations below.
Before completing their valuation tasks, participants in the Canadian EQ-5D-5L valuation study indicated their own health state using the EQ-5D-5L. There were 1,208 valid EQ-5D-5L responses. 18 The target of inference in this data set is the mean utility of the adult Canadian general public.
The Breast Utility Instrument (BUI) study included a convenience sample of 401 women 18 y and older with invasive breast cancer.16,17 As part of the larger study, participants completed the EQ-5D-5L. The target of inference in this study is the mean health utility among women with invasive breast cancer.
For the purposes of comparison, we began by ignoring parameter uncertainty in the value set and estimated the mean utility and its associated SE using the originally published value set.
We then used our imputed value sets. Specifically, for each data set and for each value set k, k = 1, . . ., 100, we computed the sample mean utility Uk and its associated SE Sk. The estimate of the population’s mean utility is then the mean of the Uk’s, that is,
Its associated SE is
Within imputation variance (W):

Between imputation variance (B):

Total variance (T):

Research Ethics Board Approval
Research ethics approval was obtained from all recruitment sites for the Canadian EQ-5D-5L valuation study. Use of the BUI data was approved by the Sunnybrook Research Institute Research Ethics Board. All participants provided informed consent.
Results
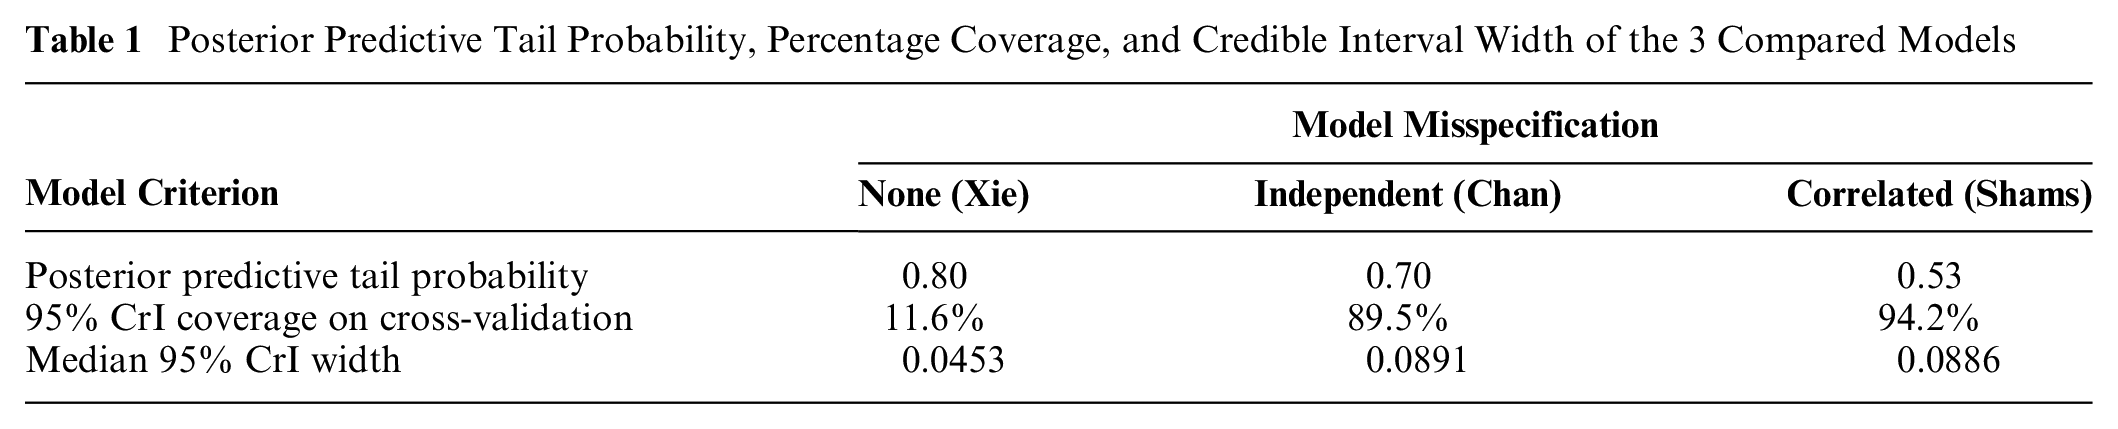
The Shams model performed better than the other 2 models based on our model assessment criteria. None of the posterior predictive tail probabilities suggested that the assumed models were a poor fit to the data (Table 1). The Shams model achieved 94% coverage of the 95% CrIs, while the original model had 12% coverage. As seen in Figure 1, the original model has narrower CrIs and undercoverage compared with the Shams model. The Chan model had 90% coverage of the 95% CrIs (Table 1). In addition to achieving adequate CrI coverage, the median 95% CrI width for the Shams model was smaller than for the Chan model (0.0886 v. 0.0891; Table 1).
Posterior Predictive Tail Probability, Percentage Coverage, and Credible Interval Width of the 3 Compared Models
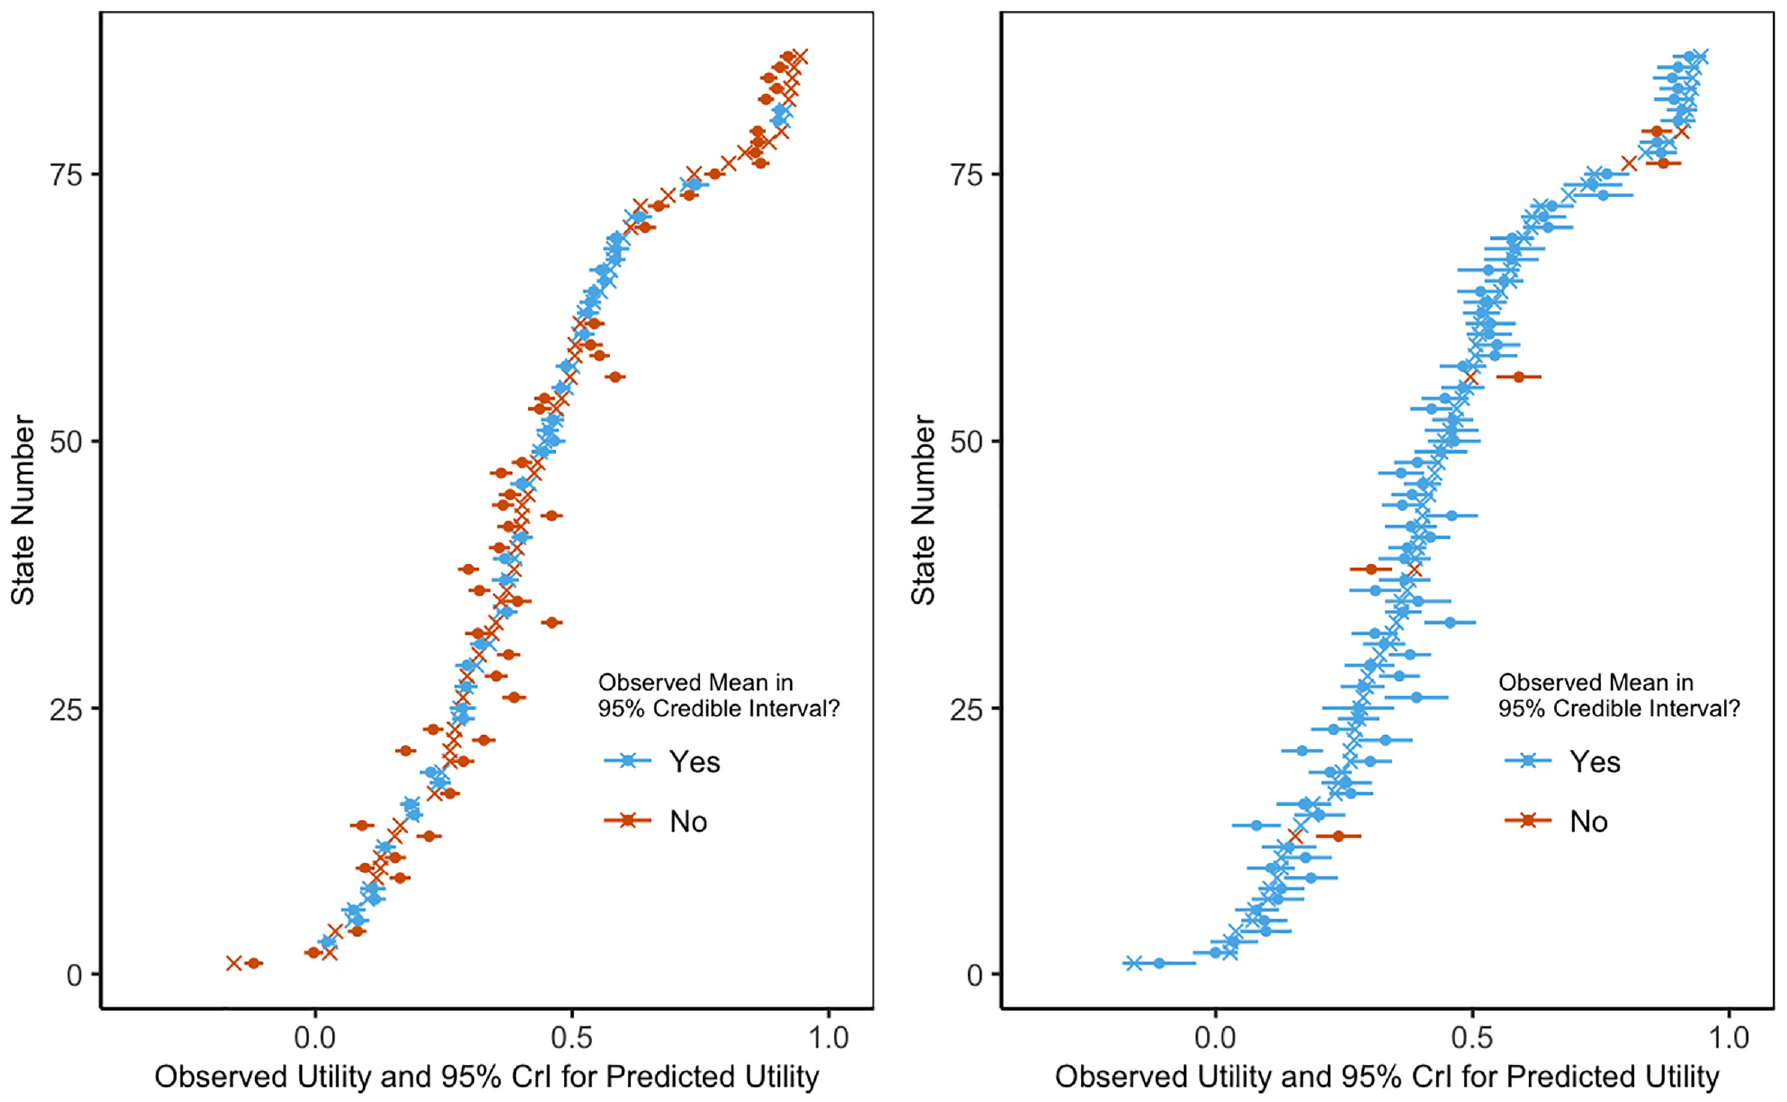
Coverage confidence intervals.
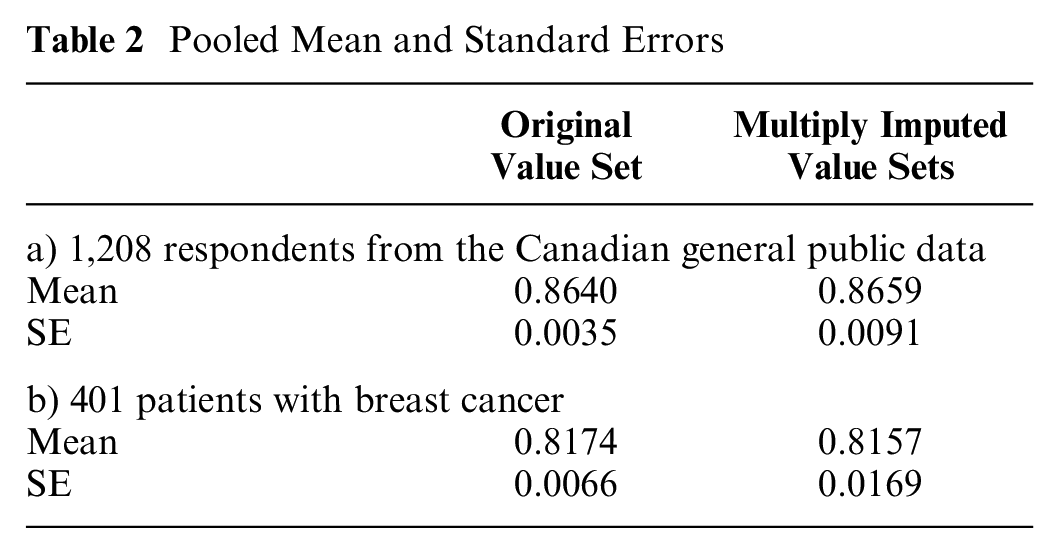
We therefore used the Shams model to create 100 imputed value sets. For both the Canadian general public and patients with breast cancer, the multiply imputed value set yielded a larger SE than the originally published value set did (Table 2): a 2.60-fold increase in the SE for the Canadian general public data set and a 2.56-fold increase for the breast cancer data set.
Pooled Mean and Standard Errors
A table of the parameters of each of the models is found in Appendix 6.
Discussion
Value sets are estimated subject to parameter uncertainty, which is typically ignored. We created the first multiply imputed value set for the EQ-5D-5L, allowing users of the instrument in Canada to account for parameter uncertainty in the value set. When applied to 2 data sets collecting the EQ-5D-5L, using multiple imputation led to larger SE estimates, illustrating that the current practice of ignoring parameter uncertainty in the value set underestimates SEs.
We demonstrated that incorporating spatially correlated model misspecification terms correctly captures parameter uncertainty, whereas omitting model misspecification terms results in poor CrI coverage. This explains why our findings are in contrast to the previous work of Gray et al., 28 which suggested that parameter uncertainty in value sets was not important; this previous work assumed that there was no model misspecification. 28 Our study found that without the misspecification terms, SEs are indeed much smaller; however, this results in 95% CrIs with inadequate coverage (12% instead of 95%). Coverage becomes 94% when misspecification terms are added, and the 95% CrI width increases from a median of 0.0453 to 0.0886. Consequently, we suggest that researchers investigating parameter uncertainty in their value sets should assess the adequacy of their credible/confidence interval coverage on out-of-sample health states and also consider model misspecification terms if this is found to be inadequate.
As noted in previous work,3–5 the width of the 95% CrIs for state-specific mean utilities in the value set exceeds the MID. The EQ-5D-5L valuation protocol includes direct valuation of 86 of 3,125 (2.8%) states captured by the instrument. 18 Shams and Pullenayegum 20 found that health states that were directly valued could be estimated with a higher degree of precision than health states that were not. Future EQ-5D-5L valuation studies and emerging EQ-5D-Y (youth) instruments could consider valuing a larger proportion of health states as another strategy to reduce the SEs in estimated health state utility values.
There are several limitations to this study. The Canadian EQ-5D-5L valuation study was in the first wave of valuation studies conducted by the EuroQol Group. The functional form of the EQ-5D-5L value set may affect the predictive performance of the model, dependent on the method of omitting health states. The Canadian value set has 11 parameters, different than the common functional form, and the newer cross-attribute-level effects (CALE) model. The common functional form is a 21-parameter model, 29 and the CALE model has 8 parameters. 30 Despite these different functional forms, Che et al. 21 found that the MAEs for the published model were similar among the 7 countries studied, ranging from 0.031 for Japan to 0.070 for the Netherlands, with Canada having an MAE of 0.040. Che et al. also found that modeling the spatial correlation reduced the MAE in all 7 countries studied. We thus believe that despite the different functional form used in Canada, we would find a similar need to account for uncertainty in the value set in other countries.
There were concerns about the validity of the methodology for negative cTTO data, and this was one reason why the original Canadian EQ-5D-5L valuation study censored cTTO values at 0, 18 relying on tTTO values to estimate the distribution below zero. We applied the same modeling decision in our analysis. Valuation studies in other countries either did not censor at all or chose to censor at −1. 31 Decisions to censor data can affect the parameter uncertainty of the scoring model, which is beyond the scope of this study and therefore warrants investigation.
Logic dictates that for any 2 health states where 1 dominates the other, the utility of the dominated health state should be lower than that of the dominating health state. This is particularly relevant for adjacent health states, which differ in just 1 dimension by just 1 level. Given that incorporating state-level uncertainty results in wider 95% CrIs for mean health state utilities, it is reasonable to wonder whether the posterior distribution of incremental mean utilities for some pairs of adjacent health states includes logically inconsistent values. Of 756,250 dominant pairs, there were 2 pairs of health states for which the posterior means were logically inconsistent: 21515 and 21415, with posterior means of 0.4455 and 0.4443 respectively, and 22515 and 22415, with posterior means of 0.4089 and 0.4082, respectively. Since these logical inconsistencies occur in the third decimal place, we do not consider them to be practically important. Differences between utilities of adjacent health states are used to establish MIDs and minimal clinically important differences (MCIDs); given that these have larger uncertainties than previously believed, reevaluation of reported MIDs/MCIDs is warranted.
Our methodology is suitable for value sets generated with TTO (cTTO or tTTO) or SG utilities, but the models would need further development to be used with DCE data. Given that many of the EQ-5D-5L and EQ-5D-3L-Y value sets have used a hybrid model, extension of the modeling approach to joint estimation using cTTO and DCE data is an important area for future research. Furthermore, with increasing interest in DCE with duration as a standalone approach to valuation,32,33 methods that account for state-level model misspecification using DCE data alone are needed.
Although we have focused exclusively on parameter uncertainty in the value set, other sources of uncertainty exist, for example, uncertainty due to poor data quality, uncertainty due to valuation task (TTO, SG, and DCE typically give different answers), uncertainty around the correct population (e.g., general public v. patient v. experience-based value sets), or modeling a large number of health states worse than dead. 34 We argue that all of these aspects of uncertainty are important to consider. In some cases, these other sources can be addressed, for example, the EuroQol Group introduced a quality control program 35 that substantially reduced protocol violations and interviewer effects. We argue that data quality and parameter uncertainty should be considered to ensure methodological rigor of future valuation studies; the 2 are not mutually exclusive.
Future research could use our imputed value sets to assess the impact of accounting for parameter uncertainty in the value set on cost-utility analyses that use the EQ-5D-5L to elicit utilities. Of particular interest would be to assess whether parameter uncertainty in the value set could have implications on the sensitivity analyses of economic models that inform the approval of new drugs and reevaluation of existing drugs. By capturing the full range of uncertainty of health state utilities with our multiply imputed value set, sensitivity analyses will test whether the ICER is affected by these wider ranges. If the ICER is affected, quantifying the expected value of partial perfect information 36 on the value set vis-à-vis other parameters in the economic model would be helpful in determining whether investment in more precise value sets is worthwhile.
While we created an imputed value set for the EQ-5D-5L in Canada, imputed value sets are still required for other countries and other instruments. We have provided our code in Appendix 3 to assist other researchers in creating these.
To facilitate the use of our imputed value sets, we have provided an R package to score the EQ-5D-5L using each imputed value set. This function allows users to fit their data to a model of their choice to derive health utilities from the EQ-5D-5L and to pool the results using Rubin’s rules. We provide the code and an example of how to install and use the package in the Appendix. This function is only slightly more complex to use than the
In summary, we have shown that the current practice of ignoring parameter uncertainty in EQ-5D-5L value sets leads to an underestimation of uncertainty in analyses that use the EQ-5D-5L to elicit utilities. Our analysis showed that correctly quantifying the extent of uncertainty in the Canadian EQ-5D-5L value set requires explicit incorporation of state-level model misspecification terms when producing a multiply imputed value set. In creating the first multiply imputed value set, we have made it possible for users of the EQ-5D-5L in Canada to account for parameter uncertainty in the value set. Our contribution to the literature provides a practical example and code to enable researchers and decision makers to better account for this uncertainty.
We thus recommend that 1) users of the EQ-5D-5L in Canada use multiple imputation to account for parameter uncertainty in the value set and 2) multiple imputed value sets be developed for other countries and for other MAUIs.
Supplemental Material
sj-docx-1-mdm-10.1177_0272989X241241328 – Supplemental material for Creating a Multiply Imputed Value Set for the EQ-5D-5L in Canada: State-Level Misspecification Terms Are Needed to Characterize Parameter Uncertainty Correctly
Supplemental material, sj-docx-1-mdm-10.1177_0272989X241241328 for Creating a Multiply Imputed Value Set for the EQ-5D-5L in Canada: State-Level Misspecification Terms Are Needed to Characterize Parameter Uncertainty Correctly by Teresa C. O. Tsui, Kelvin K. W. Chan, Feng Xie and Eleanor M. Pullenayegum in Medical Decision Making
Footnotes
The authors declared no potential conflicts of interest with respect to the research, authorship, and/or publication of this article. The authors disclosed receipt of the following financial support for the research, authorship, and/or publication of this article: Financial support for this study was provided in part by the Mitacs Accelerate Postdoctoral Fellowship, the Canadian Statistical Science Institute (Ontario) Top-up Award for Postdoctoral Fellows in Data Science, and the Canadian Centre for Applied Research in Cancer Control (ARCC). The funding agreement ensured the authors’ independence in designing the study, interpreting the data, writing, and publishing the report.
References
Supplementary Material
Please find the following supplemental material available below.
For Open Access articles published under a Creative Commons License, all supplemental material carries the same license as the article it is associated with.
For non-Open Access articles published, all supplemental material carries a non-exclusive license, and permission requests for re-use of supplemental material or any part of supplemental material shall be sent directly to the copyright owner as specified in the copyright notice associated with the article.