
Abstract
Previous work examined the suitability of relying on routine methods of model selection when extrapolating survival data in a health technology appraisal setting. Here we explore solutions to improve reliability of restricted mean survival time (RMST) estimates from trial data by assessing model plausibility and implementing model averaging. We compare our previous methods of selecting a model for extrapolation using the Akaike information criterion (AIC) and Bayesian information criterion (BIC). Our methods of model averaging include using equal weighting across models falling within established threshold ranges for AIC and BIC and using BIC-based weighted averages. We apply our plausibility assessment and implement model averaging to the output of our previous simulations, where 10,000 runs of 12 trial-based scenarios were examined. We demonstrate that removing implausible models from consideration reduces the mean squared error associated with the restricted mean survival time (RMST) estimate from each selection method and increases the percentage of RMST estimates that were within 10% of the RMST from the parameters of the sampling distribution. The methods of averaging were superior to selecting a single optimal extrapolation, aside from some of the exponential scenarios where BIC already selected the exponential model. The averaging methods with wide criterion-based thresholds outperformed BIC-weighted averaging in the majority of scenarios. We conclude that model averaging approaches should feature more widely in the appraisal of health technologies where extrapolation is influential and considerable uncertainty is present. Where data demonstrate complicated underlying hazard rates, funders should account for the additional uncertainty associated with these extrapolations in their decision making. Extended follow-up from trials should be encouraged and used to review prices of therapies to ensure a fair price is paid.
It is common for institutions responsible for selecting interventions for reimbursement within a public health care system, such as the National Institute for Health and Care Excellence (NICE) in England and Wales, to request an economic assessment of the intervention across the lifetime of patients eligible for the indication to establish whether it is likely to offer cost-effective benefits. Depending on disease type and stage, patients may be expected to live for decades after beginning their course of therapy. Hence, to model the benefits of a treatment across the patient lifetime, it is necessary to make predictions of treatment efficacy across periods where there are no observed data, as it is not in anyone’s interest to wait years before these treatments become part of routine care. This is more common as diseases are detected earlier and medical technologies advance, meaning phase III trials are becoming decreasingly informative to the decision maker who is interested in this lifetime benefit. Since the price that NICE is willing to pay for an intervention depends on the expected benefit to patients, it is imperative to estimate these benefits fairly across appraisals before proceeding with pricing negotiations. This increases the importance of accurately predicting patients’ future health as these predictions become increasingly influential in the decision making process, relative to periods where there are observed data.
For many diseases, time-to-event outcomes, such as death, are of critical interest to the decision maker, affecting both the clinical and cost-effectiveness conclusions. Time-to-event outcomes are routinely modeled in health technology appraisals by fitting parametric models to observed data and extrapolating until no patients are predicted to remain at risk of an event.1,2 These models are commonly used to predict the amount of time patients spend in particular health states, either through the estimation of transition probabilities or mean survival times, depending on the type of economic model. The time in each health state is combined with a health-related quality-of-life utility value and the costs of factors including therapy, disease management, and adverse events to produce an overall estimate of the cost-effectiveness of a treatment relative to a comparator.
Previously, we have published a detailed simulation study, which demonstrated the unreliability of extrapolation with parametric models when estimating restricted mean survival time (RMST) and the dangers of selecting an incorrect model. 3 Briefly, our simulation study replicated time-to-event data from 4 phase III trials that were pivotal in their relevant NICE technology appraisals. Based on each trial, we simulated time-to-event data from 3 source distributions and then fitted 8 parametric curves and compared the RMST of models preferred by the Akaike information criterion (AIC), Bayesian information criterion (BIC), and log-likelihood. We showed how overreliance on information criterion or the log-likelihood for the selection of a single parametric model is associated with bias and high uncertainty. However, this work did not consider the plausibility of candidate models and did not explore solutions to improve current practice. AIC and BIC do not describe absolute goodness of fit but relative goodness of fit between the group of candidate models. They cannot describe whether a model fits well but that it is the best-fitting model from those considered after accounting for model complexity.
Here we explore solutions to improve the reliability of RMST estimates using model averaging, after first considering the plausibility of models, to increase the applicability of our results.
The appropriateness of model averaging has been discussed. 4 Previous work has extrapolated survival models using Bayesian model averaging (BMA). Studies have either considered averaging across candidate models weighted using posterior model probabilities 5 or also included external data into the modeling.6,7 Model averaging has not been considered in the specific setting of RMST estimation, and we are unaware of any NICE technology appraisals that used BMA. While the reasons for this are unclear, we believe there may be resistance or reluctance due to the perceived complexity of BMA. We contrast the performance of BMA against our proposed approach using evenly weighted estimates from the best-fitting models. We chose our method of averaging as it avoids the limitation of BMA where the best-fitting models can be given a very high weighting in comparison to the candidate models and dominate the model averaging. For example, applying BMA to 2 candidate models with a difference in BIC of 5 units would result in the better-fitting model receiving a weighting of 92.4%. If the best-fitting model is not representative of the true behavior, then this approach would result in an inaccurate extrapolation. Our proposed approach of using equal weighting reduces the chance of this happening. While still focusing on the best-fitting models, this approach acknowledges that among these models, it is often unclear which provides the most accurate prediction. This approach has previously been described as “Occam’s window,” 8 or “forecast pooling,” 9 and applied in other areas, but we believe this to be a novel application focused on the estimation of RMST.
Methods
Our simulation study is described in more detail in our previous publication. 3 Briefly, an exponential, a Weibull, and a generalized gamma model were each fitted to re-created patient-level data from clinical trials of 4 novel therapies (dacomitinib, pembrolizumab, pertuzumab, and venetoclax) that were pivotal in their respective NICE technology appraisals for specific indications10–14 to estimate a total of 12 sets of parameters, each corresponding to a distinct scenario. The data were digitized using the Guyot method. 15 Random sampling using each set of parameters and their corresponding distribution generated a complete set of event time data for each of the 12 scenarios. The follow-up of the dacomitinib and pembrolizumab trials could be considered mature, with the studies achieving their median event time, while the pertuzumab and venetoclax trials were considerably less mature. To replicate the follow-up of each trial at their initial appraisal, censoring was modeled using trial-specific parameters. Each scenario was simulated 10,000 times and models were fitted using the flexsurv package in R. 16
We sought to explore alternative approaches to selecting a single extrapolation and considered methods of model averaging. However, it was important to consider the role of model plausibility to increase the applicability of our study.
In a technology appraisal, the plausibility of models is usually assessed by examination of the proportions of patients predicted event free at certain milestones of follow-up by each model, for example, the number of patients remaining alive at 5 or 10 years from the beginning of the trial. These predictions are compared to relevant external studies with longer follow-up or to the opinions of clinical experts, which may be presented as point estimates or plausible ranges. As such information was unobtainable for each of our 12 plausible yet hypothetical scenarios, we replicated the assessment of plausibility through comparison of the estimated RMST from each model to the RMST calculated from the underlying distribution used to generate the data. Three thresholds of percentage difference from the underlying RMST were used to capture varying degrees of certainty that an investigator may have in their prediction of unobserved treatment efficacy. All models that produced RMST estimates outside of these thresholds were excluded from consideration by the methods of model selection. If all 8 models for a single run were deemed implausible, then that run was excluded from all analyses. A threshold of ±50% reflected scenarios where there is high uncertainty in the long term efficacy of a treatment. A threshold of ±25% represented moderate uncertainty and ±15% of where there is quite strong certainty. We compared AIC and BIC of all “plausible” models and selected the optimal model according to each criterion. The outcome of interest was the RMST of the preferred models in each simulation. We compared the methods of single model selection following the application of each plausibility threshold.
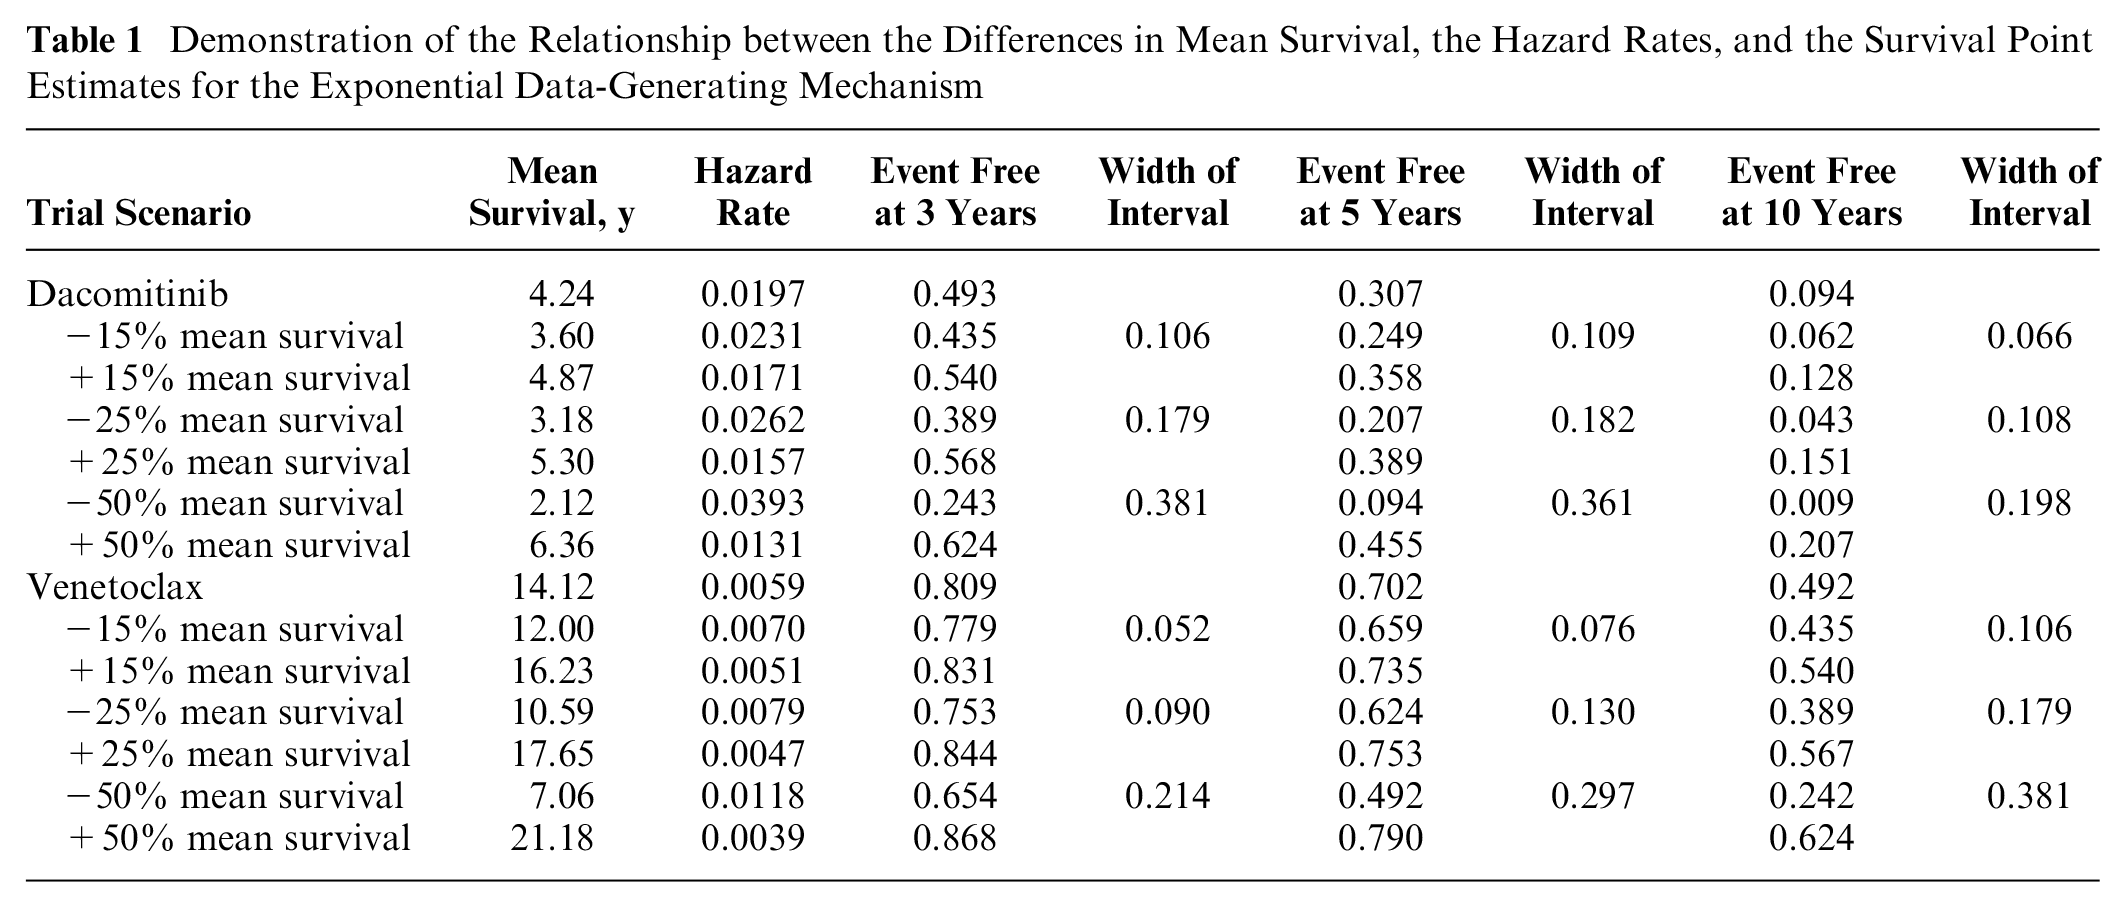
In seeking an alternative to relying on an RMST estimate from a single curve, we considered different approaches to combining estimates from multiple models. We chose to carry forward 2 sets of models to apply our averaging methods: the first without any plausibility assessment and the second using the 25% plausibility threshold. The 25% threshold was chosen through a comparison of the 4 scenarios generated by exponential data-generating mechanisms. We compared the hazard rates and survival predictions corresponding to each of the RSMTs and their corresponding ±15%/25%/50% RMST estimates (Table 1). The 25% RMST threshold was most consistent with the level of clinical certainty and variation in survival predictions in NICE technology appraisals from the authors’ years of experience of working alongside clinical experts in providing independent critique on company submissions to NICE.
Demonstration of the Relationship between the Differences in Mean Survival, the Hazard Rates, and the Survival Point Estimates for the Exponential Data-Generating Mechanism
Our novel application of averaging involved averaging across the best-fitting models as identified by AIC and BIC. We used established thresholds for AIC and BIC, which are described as either including or ruling out models with substantial support/considerably less support/no support (AIC)
17
or positive/strong/very strong differences from the best-fitting model (BIC). The corresponding unit differences from the model with the lowest criterion were <2, <7, and <10 units for AIC
17
and <2, <6, and <10 units for BIC.
18
For each difference, we identified all models whose criterion scores fell outside the range and excluded them from the RMST estimation. All included models were given equal weighting as we calculated their mean average RMST from their estimates. The 2 methods of model selection combined with the 3 unit differences yielded 6 averaging methods. The general form of the weights, where
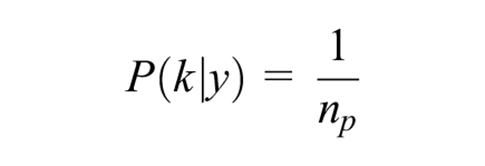
where
An alternative approach is to use weights based on the BIC, instead of using equal weights. We generated the weight of model
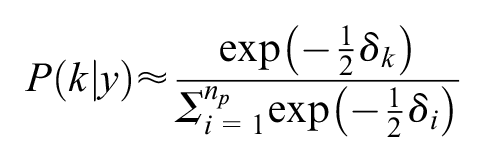
where
The performance of each method was assessed through the mean RMST estimate. Mean squared error (MSE), Monte Carlo standard error (MCSE) and mean empirical standard errors (EmpSE) were also measured. We also captured the percentage of estimates that fell within 10% of the RMST of the source distribution for each scenario.
Finally, we tested the performance of the novel averaging methods and BMA when the prediction for RMST on which we then verified plausibility was either 10% under or over the actual RMST.
Our methods are summarized in Table 2 following ADEMP (aims, data-generating mechanisms, estimands, methods and performance measures) guidelines for reporting of simulations. 21
Trial Summary According to ADEMP Guidelines 21
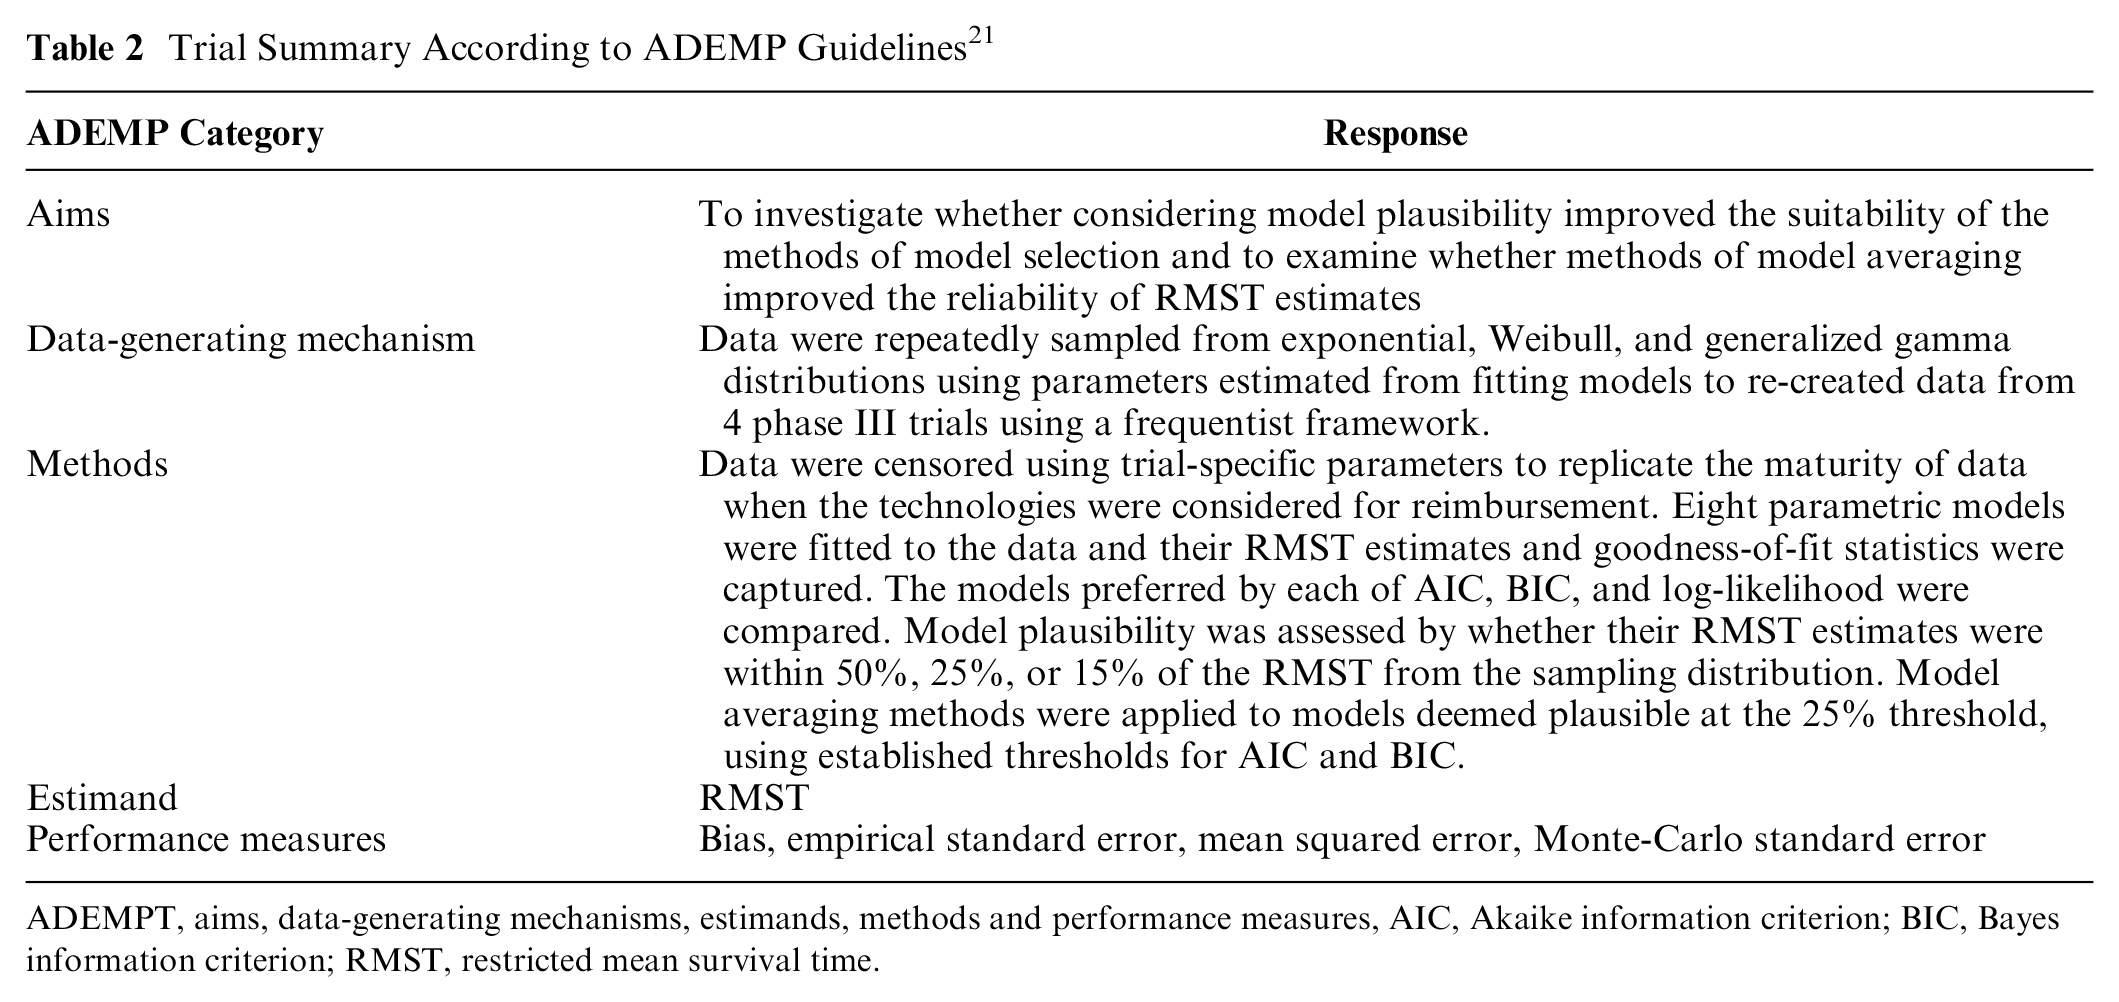
ADEMPT, aims, data-generating mechanisms, estimands, methods and performance measures, AIC, Akaike information criterion; BIC, Bayes information criterion; RMST, restricted mean survival time.
Results
The relationship between the RMST plausibility threshold and the exponential rate parameters and survival rate point estimates at 3, 5, and 10 years for the exponential dacomitinib and venetoclax scenarios is shown in Table 1. The 25% threshold was associated with an interval of width 13 and 18 percentage units around the target survival rates at 5 years, and an interval of 11 to 18 percentage units at 10 years. The estimates coming from the ±50% difference in RMST yielded implausibly wide intervals.
Supplementary Table S1 shows the number of model fits excluded at each of the plausibility thresholds, where some model fits were excluded a large number of times in certain scenarios. The log-logistic and log-normal models especially struggled to provide estimates of RMST that were consistent with the underlying distributions in the scenarios considered, but all models faced high exclusion rates in certain scenarios. Despite the occasional large number of excluded models, only the pembrolizumab generalized gamma scenario with the 25% and 15% thresholds had more than 5% of simulation runs with no plausible models included, with ∼25% and ∼50% of respective runs excluded. In the generalized gamma scenarios, selecting a generalized gamma extrapolation produced estimates within 15% of the true RMST value in 30% (pertuzumab) to 73% (dacomitinib) of simulations and within 25% of the true RMST value in 52% (pertuzumab) to 86% (dacomitinib) of simulations.
Supplementary Table S2 shows the results for the methods of single model selection at each plausibility threshold. The MSE, MCSE, and EmpSE associated with each selection method decreased as the threshold became tighter. In all scenarios that used an exponential source distribution, models preferred by BIC were associated with the lowest MSE regardless of the plausibility threshold used. Weibull and generalized gamma-based scenarios with thresholds applied were more varied, with each of the 3 methods having the lowest MSE on multiple occasions. However, BIC was most commonly associated with the lowest MSE in 10 of 24 nonexponential scenarios, compared to 8 for AIC and 5 for log-likelihood, with AIC and BIC having the same MSE for 1 scenario.
Across each scenario, applying the 50% threshold had a very small or even no impact on the percentage of RMST estimates that fell within 10% of the true RMST, despite large numbers of particular curves being excluded. Larger impacts were seen when the tighter thresholds were applied.
The results of the different approaches to model averaging without any assessment of plausibility are shown in Figure 1 and Supplementary Table S3. A comparison of the best-performing method of averaging from Supplementary Table S3 to the best-performing method of selecting a single model without considering plausibility suggested that model averaging without considering plausibility did not reduce bias in any scenarios and noticeably increased it on 2 occasions (Figure 1E,F). The optimal method of averaging was almost always superior to the optimal method of single model selection when assessing MSE and EmpSE and never inferior. Interestingly, when comparing the percentage of estimates falling within 10% of the true RMST, averaging was superior in 4 scenarios (all venetoclax or pertuzumab scenarios; Figure 1H,I,K,L), inferior in 4 scenarios (Figure 1C,D,E,J), and with no meaningful difference in 4 scenarios (Figure 1A,B,F,G), suggesting the benefits of model averaging are stronger when data are immature and demonstrate a nonconstant hazard rate.
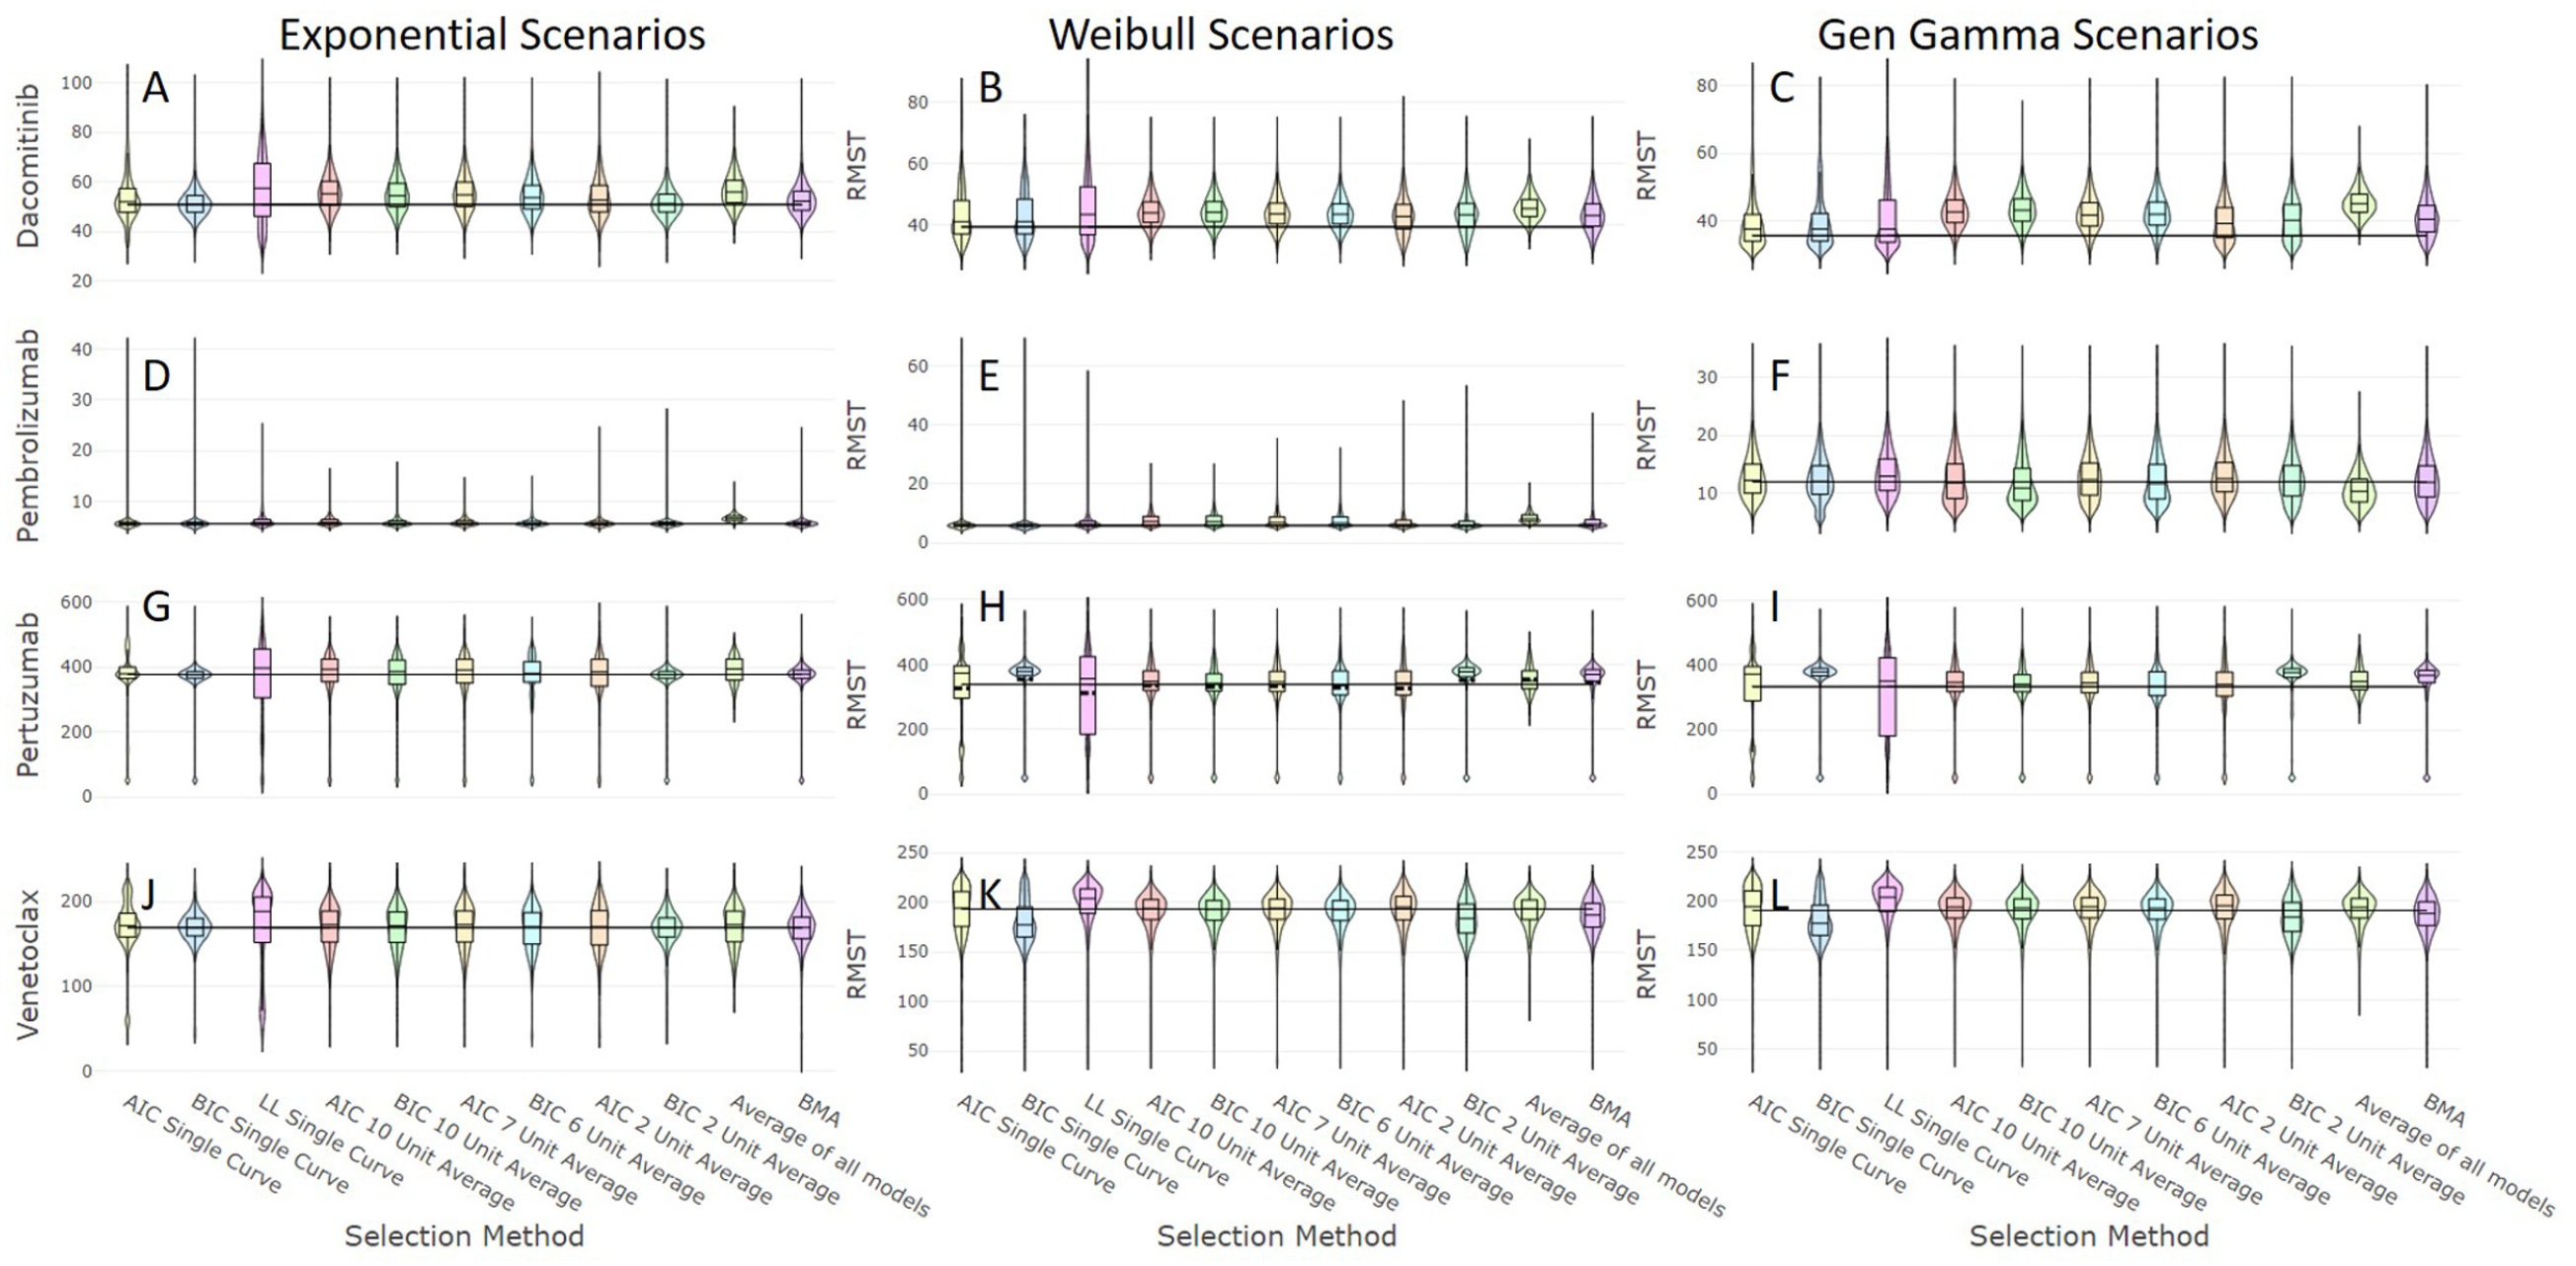
The distributions of restricted mean survival time (RMST) estimates of the methods applied without assessing plausibility for the 12 simulated scenarios defined by the combinations of the 3 underlying survival distributions with parameters informed by data on 4 distinct therapies, where the horizonal line represents the true RMST value for each scenario.
Comparing the performance of the nonoptimal methods of single model selection to their associated methods of averaging methods found that averaging across a range of models either reduced or had no impact on bias and improved MSE and EmpSE estimates. The effect of averaging on the percentage of estimates falling within 10% of the true RMST was again mixed.
Within the methods of averaging without considering plausibility, information criterion–based averaging had the lowest MSE in 6 scenarios (Figure 1A–E,J), with all but one of these coming from pembrolizumab and dacomitinib scenarios. In all other scenarios, averaging equally across all models was associated with the lowest MSE (Figure 1F–I,K,L). BMA did not have the lowest MSE in any of these scenarios.
The outcomes of the averaging methods after the assessment for plausibility are presented in Figure 2 and Supplementary Table S4. Contrasting the performance of the best averaging method to the optimal method of selecting a single model with considering plausibility suggested that model averaging had no effect on bias. However, in most scenarios, the best averaging method was associated with lower MSE, lower EmpSE, and a higher percentage of models falling within 10% of the true RMST compared to the optimal method of single model selection. The nonoptimal methods of single model selection were all either equaled or outperformed by their associated methods of model averaging, in terms reducing each of bias, MSE, and EmpSE and increasing the percentage of estimates falling within 10% of the true RMST.
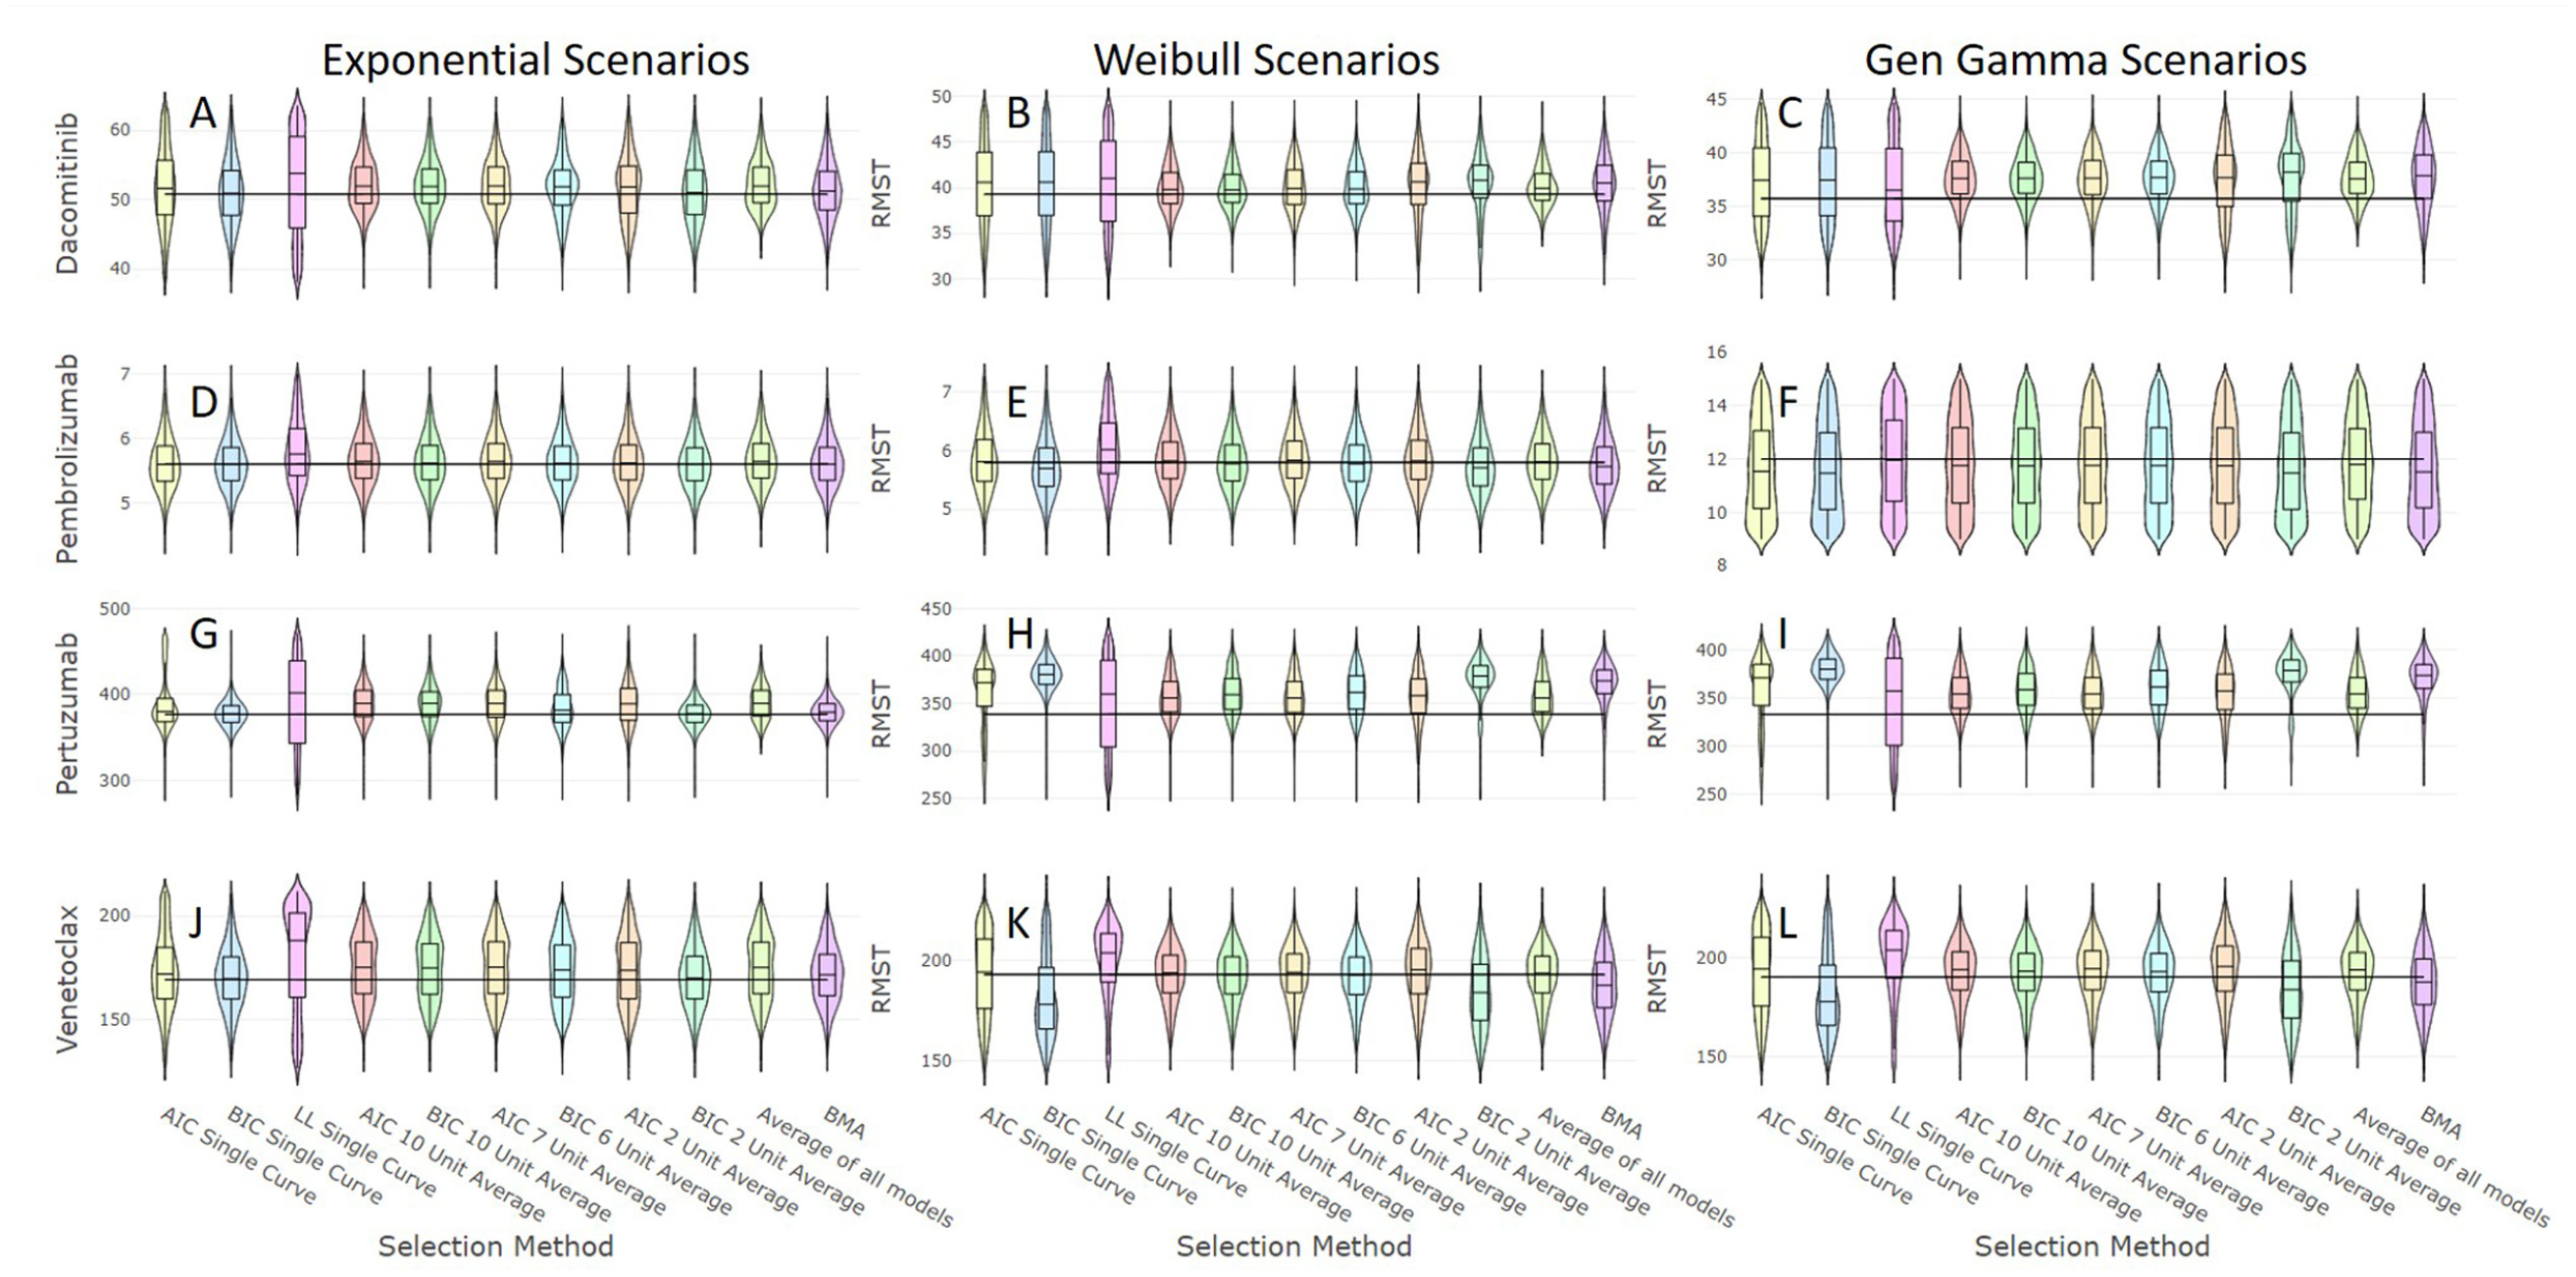
The distributions of restricted mean survival time (RMST) estimates of the methods applied once plausibility has been assessed for the 12 simulated scenarios defined by the combinations of the 3 underlying survival distributions with parameters informed by data on 4 distinct therapies, where the horizonal line represents the true RMST value for each scenario.
The scenarios with the lowest percentage of estimates falling within 10% of the true RMST when choosing a single model were the generalized gamma scenarios of pembrolizumab (39%) (Figure 2F) and pertuzumab (34%) (Figure 2I). Averaging across all plausible models increased these to 45% and 69%, respectively.
Examination of the different approaches to averaging following the removal of implausible models suggests that taking the mean RMST of all plausible models produced estimates that had the least bias and lowest MSE and EmpSE, although these were often all similar to the averaging methods based on AIC and BIC when using the widest margins of inclusivity. Averaging across all plausible models was associated with the lowest MSE in 9 of 12 scenarios (Figure 2A–C,E,F,H,I,K,L), even including the methods of single model selection.
In 3 of the 4 exponential scenarios, both BMA and averaging across models with the smallest BIC margin were associated with RMST estimates that had the lowest MSE (Figure 2D,G,J) and 2 of these also with the lowest EmpSE and the highest percentage of estimates falling within 10% of the true RMST (Figure 2G,J). Across the 12 scenarios, the wider AIC and BIC (7, 6, 10, and 10 units) threshold-based methods had a lower MSE than BMA in 9, 8, 9, and 9 scenarios, respectively.
The optimal single model selection method for the pembrolizumab generalized gamma scenario (Figure 2I) had the lowest percentage of RMST estimates that fell within 10% of the target RMST of all scenarios (15%). The optimal averaging approach raised this to 58%. The scenario with the highest percentage of estimates falling within 10% from the best single model selection method was 93% in the exponential pertuzumab scenario (Figure 2G), whereas the corresponding estimate for the optimal averaging method was 91%.
Our analyses of scenarios where the 25% plausibility threshold was based on an incorrect estimate of the underlying RMST showed that the methods of averaging were equivalent or superior to the optimal method of single model selection across all Weibull and generalized gamma scenarios but worse for the exponential scenarios (Supplementary Tables S5–S7). Averaging across all plausible models was robust to underestimation of RMST, but this method was usually outperformed by an averaging method based on information criterion when RMST was overestimated.
Discussion
In this study, we have implemented solutions that improve reliability and accuracy when estimating RMST than relying on single model methods, comparing different approaches to model averaging after first removing implausible models. We have presented results for a range of scenarios that capture combinations of varying sample sizes, hazard rates, hazard shapes, and durations of follow-up. The scenarios replicate the data considered by decision makers such as NICE and capture the associated challenges these decision makers face, ensuring our findings are relevant to current practice.
Considering first model plausibility, the high exclusion rate of the log-normal and log-logistic models emphasizes the clear difference in characteristics between the models, reinforcing the findings from our previous study. 3 Similarly, the models with the most parameters (generalized gamma and generalized F) also showed high exclusion rates, suggesting these more flexible models are prone to overfit to data and cannot be relied upon to provide accurate extrapolations in all circumstances. If we instead used the log-normal or log-logistic models as source distributions, then we would anticipate a similar degree of exclusion for the some of the other parametric models.
While it is reassuring to see that in almost all scenarios, it was rare for a whole simulation run to be excluded for a lack of plausible extrapolations, the pembrolizumab generalized gamma scenario demonstrated that there are times when the observed data are not sufficient to allow a model to reliably capture the intricate hazard rate behavior. If hazard rate behavior is expected to be more complicated than that of a 2-parameter model (i.e., all 2-parameter models fit poorly), the decision maker should account for the increased uncertainty associated with the extrapolations of 3- and 4-parameter models.
Removing implausible models often had a considerable impact on reducing the MSE of models preferred by each of the selection methods, even under our widest plausibility threshold. However, the impact on the percentage of extrapolations falling within 10% of the underlying RMST was minimal, suggesting that the most implausible curves were rarely favored by the selection methods. After excluding at the 50% and 25% plausibility thresholds, this percentage varied greatly across the different scenarios and remained as low as 34% in the pertuzumab generalized gamma scenario after the 25% threshold was applied. Hence, relying on the exclusion of the most implausible models would not guarantee a reliable RMST estimate, and we continued to investigate the potential benefits of model averaging.
Methods of model averaging do not feature regularly in NICE technology appraisals, perhaps due to the perceived complexity in their implementation and in communicating their technical details to an appraisal committee. This led to our consideration of simpler alternatives, which we aligned with the established thresholds for AIC and BIC.
We showed that averaging across plausible models never increased bias or MSE and did not decrease the percentage of estimates falling within 10% of the underlying RMST compared to when just a single model is selected, suggesting that model averaging can improve the quality of extrapolations in technology assessments. Implementation of this approach assumes there is no disagreement over the identification of plausible models.
There remain occasions, such as the generalized gamma pembrolizumab scenario, where no methods reliably produced an accurate estimate of RMST. It raises the question of whether it is right to base funding decisions on extrapolations in cases where there is an apparent change in hazard rate behavior in the tail of the data, perhaps supported by clinical plausibility, which is unlikely to be accurately captured by a statistical model. The methods generally performed worse when the data were either immature or coming from a more complicated underlying distribution. Certainly, stakeholders should be aware of which scenarios are associated with increased uncertainty, and pharmaceutical companies should consider these uncertainties when entering pricing negotiations. The more complex the underlying distribution, the less likely it is to be accurately captured by the models. In the scenarios using a generalized gamma–based data-generating mechanism, the variation in the fitted generalized gamma models was very high. If data are immature or the company is putting forward a multiparameter model, it cannot expect the health care provider to bear all the risks and should anticipate more caution from the decision maker.
An alternative approach could be based only on observed benefits, perhaps combined with pricing revisions once longer follow-up is achieved, which may result in better value for the healthcare provider. If both the buyer and the seller accepted that these revisions could shift the price in either direction, then the risks are effectively shared and ensure that the price is based on the efficacy of a treatment. It is vital that long-term follow-up and routine data such as registries are available to those involved in the decision making process. The Cancer Drugs Fund in England is an example of a scheme where patients are granted access to therapy for treatments that have the potential to be cost-effective, while more data are collected prior to a concluding appraisal.
The benefit gained from excluding implausible models was meaningful, which demonstrates that the plausibility of models is an important consideration and that the weighting applied by BMA was insufficient at reducing the influence of inappropriate models. BMA was generally outperformed by the simpler approaches to averages, using the established margins around the AIC and BIC of the models with the lowest criteria for each measure. This simpler approach may be welcomed more readily by appraisal committees when there is uncertainty over the optimal extrapolation. The general superiority of the wider intervals suggests a most inclusive approach should be taken when averaging, once implausible models have been removed. Of course, in practice, it is often difficult to reach a consensus on what should be considered plausible. It would be difficult to give general guidance as it is important to capture input from relevant clinical experts.
The efficacy of all averaging methods depends on the suitability of the candidate models across which the average is estimated. The set of candidate models being considered could be thought of as a prior, that is, the belief that the truth lies within or between this set of models. Considering 8 parametric models gives us a range of options but does not guarantee that any of the models will accurately capture observed behavior or yield a plausible prediction.
It is difficult to compare our assessment of extrapolation plausibility, which is using differences from the underlying RMST, to a real-world assessment of plausibility. Every technology appraisal would have a different combination of trial follow-up, patient prognosis, and external points of reference to compare extrapolations. Predictions from clinical experts have no guarantee over their accuracy. Our widest threshold would be representative of occasions when there is only little to no evidence of what a plausible extrapolation might be, with only plainly wrong extrapolations being excluded, whereas the smallest threshold would be more representative of when relevant evidence is available.
All scenarios considered were generated from a single underlying parametric model. These results may not be generalizable to occasions when models fit poorly to data, where either modeling of distinct subgroups or flexible parametric approaches may be necessary. Further studies should aim to generate survival data with more complex hazard rates, perhaps sampling from a combination of parametric distributions, to investigate how the parametric models, the methods of model selection, and the methods of model averaging all perform when the underlying distribution is not necessarily present in the candidate models.
We have considered data only from single arms of studies and not included comparators or investigated how these findings might influence a subsequent cost-effectiveness analysis. Additional work is needed to investigate whether the bias and uncertainty detected in these simulations may work in favor of a novel intervention and the pharmaceutical company. Only 4 combinations of sample size, event rate, and follow-up length were considered in this simulation study. It is possible our findings may not extend to different combinations of these factors affecting extrapolations. Parametric extrapolations, even with averaging, will never be a substitute for mature follow-up, which only extended follow-up beyond achievement of primary outcomes of clinical trials will provide. While institutions such as NICE continue to assess cost-effectiveness based on the lifetime efficacy, it is important for all stakeholders that uncertainty is minimized in these predictions without relying on statistical predictions. This will ensure fair pricing and access to treatments.
Conclusion
We conclude that it is helpful to assess plausibility of extrapolations when selecting a model. We recommend that methods of model averaging should be considered more widely in health technology appraisals given their clear benefit in most cases. The optimal method in the majority of our scenarios was to take the mean average of RMST predictions across all plausible models, without using weights based on information criteria, but plausibility in the real world will be subjective. There is no guidance to decide on plausibility or on the most suitable margin should averaging using information criterion–based averaging be used. Averaging is not necessary where the survival data are expected to resemble an exponential distribution, and using averaging in these occasions may reduce accuracy. Scenarios with complex hazard behavior or immature data are associated with greater uncertainty, which should be accounted for in the decision making process. Funders should avoid committing to paying prices for treatments that are deemed cost-effective from immature follow-up and should review prices once extended follow-up is available, with initial approval conditional on pharmaceutical companies providing access to these data.
Supplemental Material
sj-doc-1-mdm-10.1177_0272989X21992297 – Supplemental material for Extrapolating Parametric Survival Models in Health Technology Assessment Using Model Averaging
Supplemental material, sj-doc-1-mdm-10.1177_0272989X21992297 for Extrapolating Parametric Survival Models in Health Technology Assessment Using Model Averaging by Daniel Gallacher, Peter Kimani and Nigel Stallard in Medical Decision Making
Footnotes
The author(s) declared no potential conflicts of interest with respect to the research, authorship, and/or publication of this article.
The author(s) received no financial support for the research, authorship, and/or publication of this article.
References
Supplementary Material
Please find the following supplemental material available below.
For Open Access articles published under a Creative Commons License, all supplemental material carries the same license as the article it is associated with.
For non-Open Access articles published, all supplemental material carries a non-exclusive license, and permission requests for re-use of supplemental material or any part of supplemental material shall be sent directly to the copyright owner as specified in the copyright notice associated with the article.