
Abstract
Background
Structural uncertainty can affect model-based economic simulation estimates and study conclusions. Unfortunately, unlike parameter uncertainty, relatively little is known about its magnitude of impact on life-years (LYs) and quality-adjusted life-years (QALYs) in modeling of diabetes. We leveraged the Mount Hood Diabetes Challenge Network, a biennial conference attended by international diabetes modeling groups, to assess structural uncertainty in simulating QALYs in type 2 diabetes simulation models.
Methods
Eleven type 2 diabetes simulation modeling groups participated in the 9th Mount Hood Diabetes Challenge. Modeling groups simulated 5 diabetes-related intervention profiles using predefined baseline characteristics and a standard utility value set for diabetes-related complications. LYs and QALYs were reported. Simulations were repeated using lower and upper limits of the 95% confidence intervals of utility inputs. Changes in LYs and QALYs from tested interventions were compared across models. Additional analyses were conducted postchallenge to investigate drivers of cross-model differences.
Results
Substantial cross-model variability in incremental LYs and QALYs was observed, particularly for HbA1c and body mass index (BMI) intervention profiles. For a 0.5%-point permanent HbA1c reduction, LY gains ranged from 0.050 to 0.750. For a 1-unit permanent BMI reduction, incremental QALYs varied from a small decrease in QALYs (−0.024) to an increase of 0.203. Changes in utility values of health states had a much smaller impact (to the hundredth of a decimal place) on incremental QALYs. Microsimulation models were found to generate a mean of 3.41 more LYs than cohort simulation models (P = 0.049).
Conclusions
Variations in utility values contribute to a lesser extent than uncertainty captured as structural uncertainty. These findings reinforce the importance of assessing structural uncertainty thoroughly because the choice of model (or models) can influence study results, which can serve as evidence for resource allocation decisions.
Highlights
The findings indicate substantial cross-model variability in QALY predictions for a standardized set of simulation scenarios and is considerably larger than within model variability to alternative health state utility values (e.g., lower and upper limits of the 95% confidence intervals of utility inputs).
There is a need to understand and assess structural uncertainty, as the choice of model to inform resource allocation decisions can matter more than the choice of health state utility values.
Keywords
Introduction
Simulation models that are built to analyze the same problem often produce different results, primarily because the models use different data or different model designs even when using the same data. Economic modelers make different choices when designing their model structures and selecting risk equations and other parameter values. These different choices lead to uncertainty in model results, known in the modeling community as structural or model uncertainty.1,2 Sources that can lead to differences between models could be many, including 1) the type of model (e.g., Markov, statistical, discrete event simulation, decision tree), 2) choices for implicit and explicit data assumptions with a specific model, and 3) technical/methodological differences in implementing the given model (e.g., inclusion or exclusion of potentially relevant events, statistical models used to estimate specific parameters, in which different shape properties can affect extrapolation into the future).
Substantial effort has been put into understanding and capturing 3 of the 4 leadings forms of uncertainty in health economic modeling (i.e., parameter, heterogeneity, and methodological uncertainty3–9), which are commonly addressed using probabilistic sensitivity analysis, reference cases, and prescribed guidelines.1,10–12 Addressing structural uncertainty is relatively uncommon, 2 despite numerous recommendations1,13–15 and recognition that its potential impact on results may be greater than other types of uncertainty.16,17 This may be because, in part, it can be more difficult to assess than other forms of uncertainties, and there is relatively little guidance for addressing structural uncertainty formally.
Type 2 diabetes mellitus (T2DM) is a chronic and progressive disease characterized by hyperglycemia. Chronic hyperglycemia is associated with a number of debilitating and life-threatening long-term macro- and microvascular complications. Many of these complications share common risk factors, and the presence of one can also increase risks for developing the others.18,19 Given its complex and interdependent pathophysiology, modeling T2DM is particularly challenging. For this reason, diabetes simulation models tend to be complex and sometimes opaque.20–22 These models play an important role in allowing health care policy makers to make informed decisions when selecting between alternative health interventions. Given the important role of these models in resource allocation considerations, it is important that those responsible for model development understand how structural uncertainty affects the results they produce.
There are various ways to evaluate structural uncertainty, including examining the response of model results to changes in a structural assumption (e.g., altering the parametric form of an important risk equation, use of static or dynamic transition rates, disease states to include), presenting alternative results from scenario analyses or through model averaging where multiple structural changes are considered simultaneously.2,3,23 Although uncommon in the literature, these approaches provide an indication of the impact of alternative choices made during the model development process and structural uncertainties arising from the model(s) considered by the same analyst(s). An alternative approach to capturing structural uncertainty would be to compare the different ways groups of analysts may differ in their approach to the same problem. 4 Such a comparison would have a natural advantage in assessing the robustness of results of an individual study problem (e.g., confidence should be high when a treatment is cost-effective under all reasonable combinations of structural assumptions).
One way to pragmatically perform this multiway evaluation of structural uncertainty (while simultaneously minimizing risks that the individual results will still be correlated) is to bring many independent simulation models to bear on the same decision problem (i.e., with simulation of the same standardized scenario). For modeling diabetes treatments, use of a dedicated network such as the Mount Hood Diabetes Challenge (www.mthooddiabeteschallenge.com) is both an effective and efficient option. The Mount Hood Diabetes Challenge has regularly held conferences in which up to 10 or more diabetes modeling groups have met biennially since 2000 to cross-validate the models by running standardized simulation scenarios.22,24–26 A key aspect of diabetes simulation models is to capture the impact of the progression of diabetes and its complication on quality-adjusted life-years (QALYs). Economic evaluations of antidiabetes treatments often show relatively small incremental differences in QALYs between treatment arms. For example, a recent systematic review of 124 model evaluations of blood glucose–lowering interventions reported an average incremental difference of 0.409 QALYs. 27 Structural uncertainty is likely to be important, as small absolute variations in QALYs can have outsized impacts on incremental cost-effectiveness ratios.
As part of the 2018 Mount Hood Diabetes Challenge, 11 diabetes models simulated a set of standardized scenarios designed to inform our knowledge of how model estimates respond to different health state utility value assumptions and how model estimates vary across models with different structures, something that cannot generally be examined without such a large and diverse group. The aim of this article is to leverage these cross-model estimates for a standardized set of simulation scenarios to 1) assess the magnitude of structural uncertainty by comparing outputs of a large number of diabetes models, 2) compare outputs related to parameter uncertainty by varying health state utility values to quantify the degree of uncertainty generated, and 3) investigate the drivers of cross-model differences.
Methods
The results provided by the 11 diabetes modeling groups that participated in the 9th Mount Hood Diabetes Challenge (see below) were pooled and analyzed to address the 3 objectives. All modeling groups approved the use of their results and contributed to this article.
9th Mount Hood Diabetes Challenge
The 9th Mount Hood Diabetes Challenge ran over 2 days in October 2018, during which modeling groups gathered to compare and discuss methodologies, data, and developments in diabetes simulation modeling. Instructions on the modeling challenges were posted in advance on the Mount Hood Diabetes Challenge website (https://www.mthooddiabeteschallenge.com/), and all registered modeling groups were invited to participate. Although the conference featured 3 challenges, 26 this article focuses on the Quality-of-Life Challenge only. Participation in the challenge required submission in advance of results and model and methods documentation. Results were discussed among participating modeling groups at an allocated congress session.
Quality-of-Life Challenge
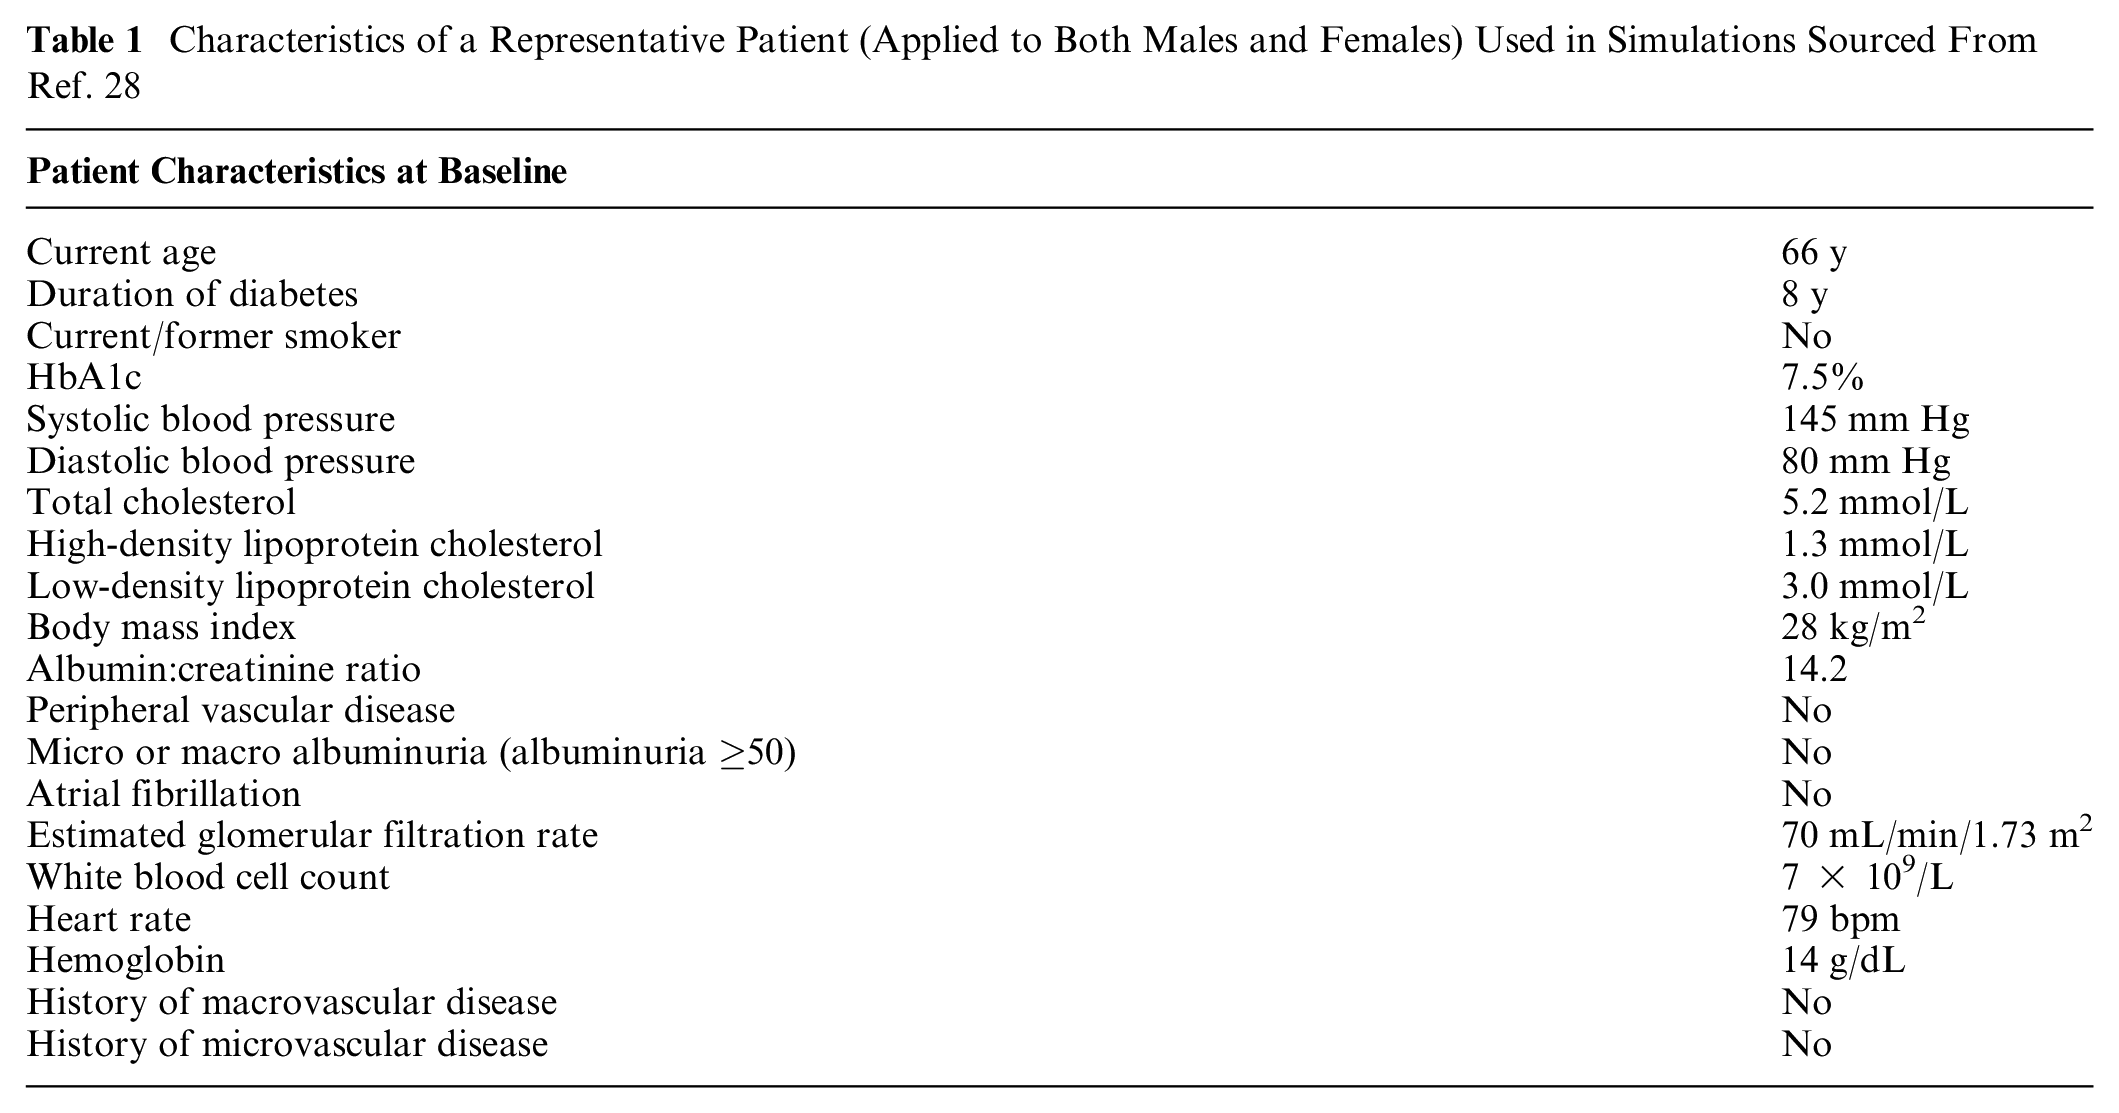
The instructions for the Quality-of-Life Challenge can be found in Supplementary Material 1. Briefly, the challenge instructions included a set of standard patient baseline characteristics and a set of utility values for a wide range of likely health states and model features, which all modeling groups were asked to use (reference case). The baseline characteristics (Table 1) were chosen to reflect a typical patient with diabetes enrolled in a randomized controlled trial for diabetes and sourced from the Action in Diabetes and Vascular Disease-PreterAx and DiamicroN Controlled Evaluation (ADVANCE) trial. 28 In the event that a model required input values not included in the instructions, the groups were asked to source their assumptions from published literature and to submit documentation with the results.
Characteristics of a Representative Patient (Applied to Both Males and Females) Used in Simulations Sourced From Ref. 28
The modeling groups were asked to populate their models using a standard (and widely used) set of utility values (Table 2) for diabetes-related complications from a published systematic review 29 and to document health states within their models that have a utility value attached to them. All modeling groups were asked to apply utility decrement values additively (where feasible). Modeling groups were asked to source utility values for health states not included in the challenge instructions from published literature and to add to the documentation.
Standard Set of Utility and Disutility Values Used to Populate Health-States Sourced from Ref. 29
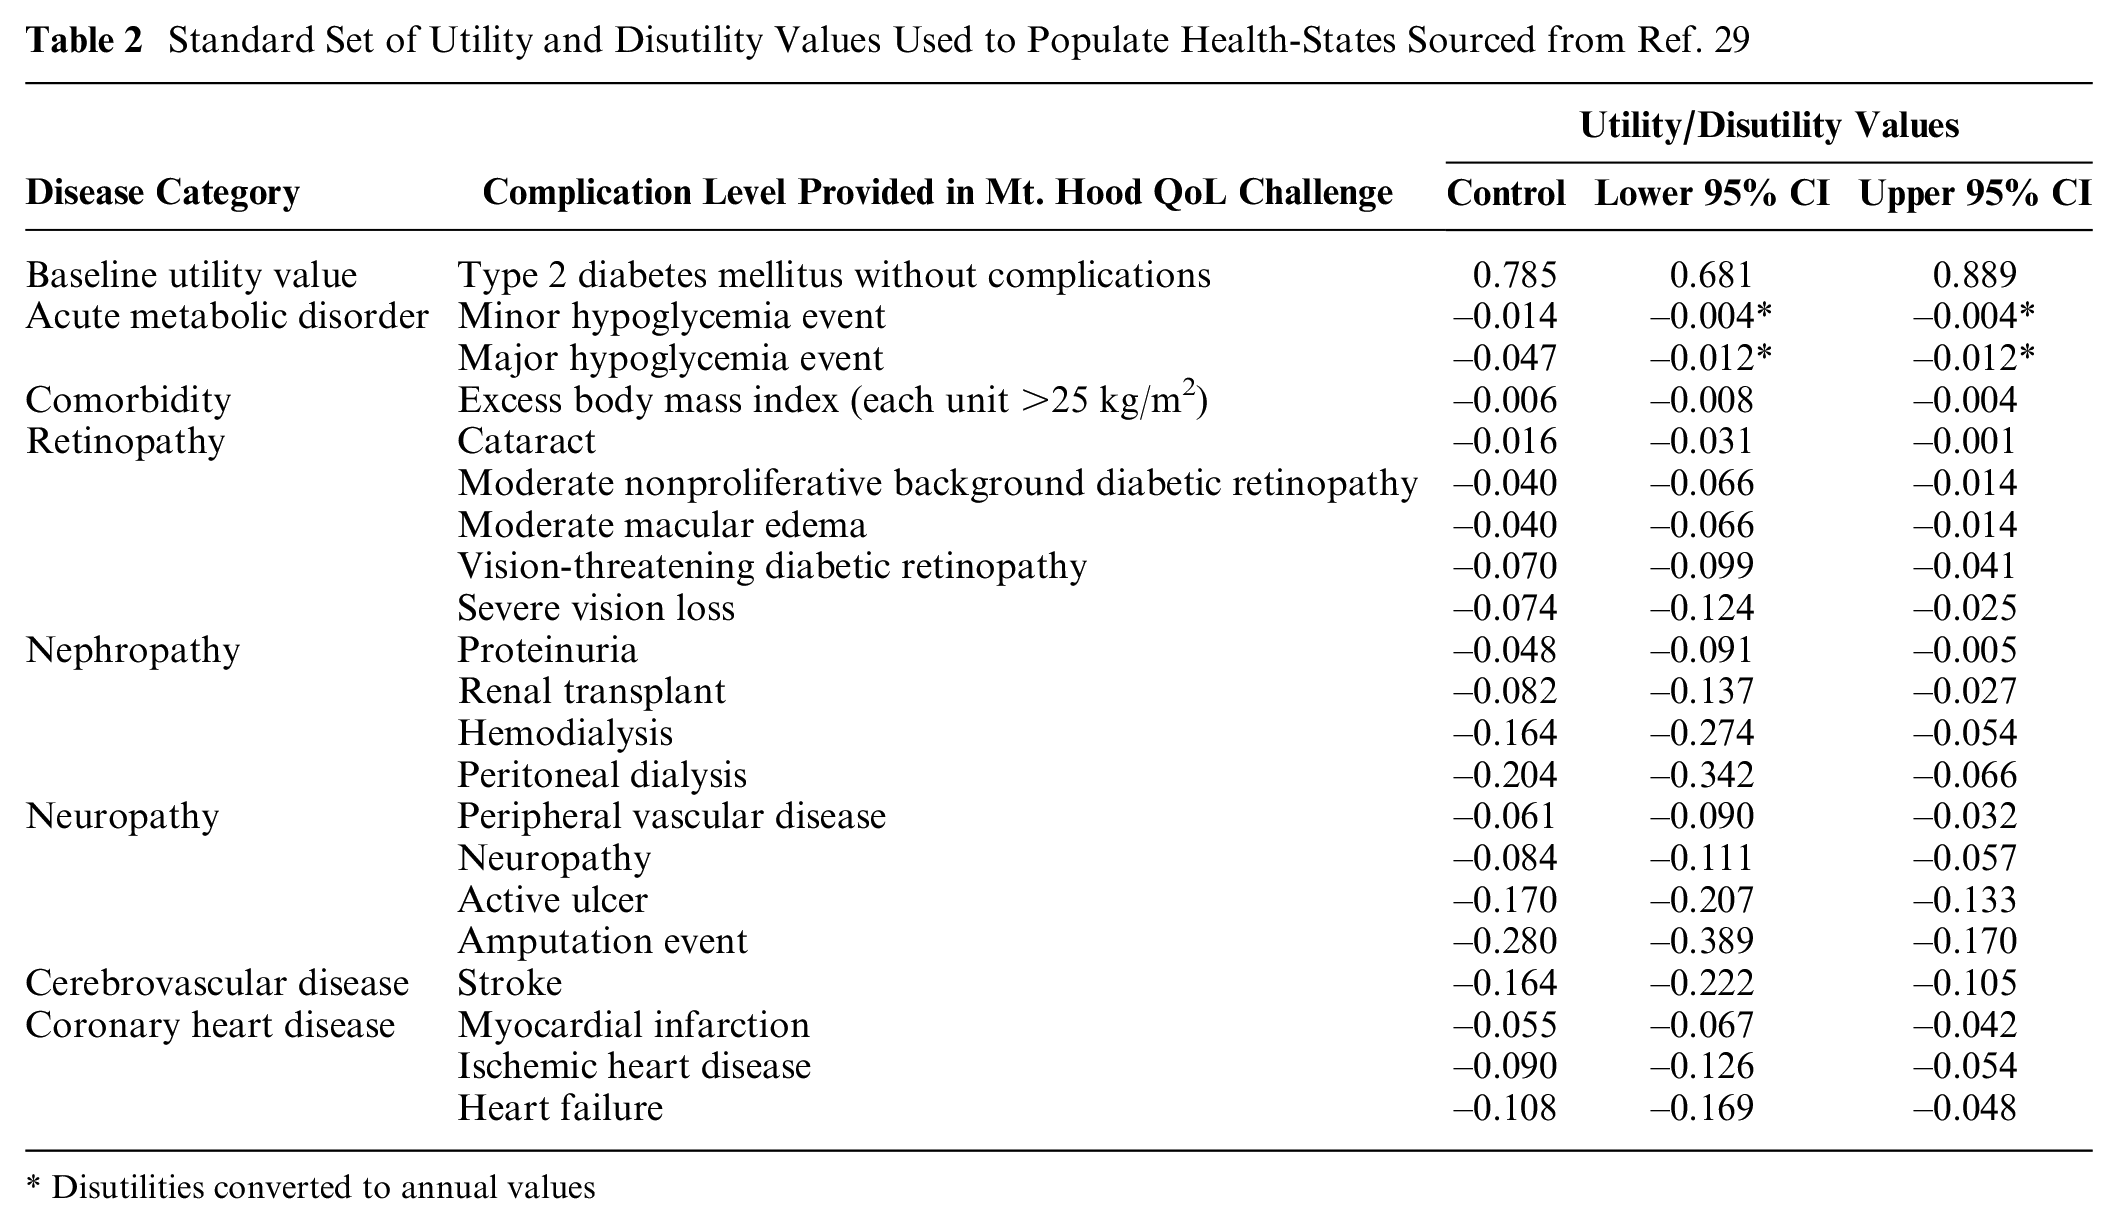
Disutilities converted to annual values
The challenge consisted of multiple simulations to examine the impact of utility values on QALYs. First, modeling groups were requested to simulate the reference case as specified over a 40-year time horizon, separately for males and females, without an initial impact on biomarkers (the control group) and for 5 different intervention profiles common in the management of patients with T2DM:
0.5%-point permanent reduction in HbA1c
10 mm Hg permanent reduction in systolic blood pressure
0.5 mmol/L (19.33 mg/dL) permanent reduction in low-density lipoprotein cholesterol
1-unit permanent reduction in body mass index (BMI; kg/m2)
All above interventions combined
Modeling groups were requested to standardize model assumptions around biomarker evolution; for instance, HbA1c and systolic blood pressure to be kept constant over time and not allow for evolution (increase or decrease over time). A 0% discount rate for both life years (LYs) and QALYs was stipulated.
The simulation was repeated using all the lower limit of the 95% confidence interval of the standardized set of utility values (Table 2) and then with the upper limit of the 95% confidence interval. To further examine the impact of varying individual health state utility values on incremental QALYs, modeling groups were asked to vary the utility value for each health state one at a time with the lower and upper 95% confidence intervals and report incremental QALYs (all others assuming the mean value) for the control group and for the 0.5%-point reduction in HbA1c profile.
The modeling groups were requested to submit detailed results for each treatment profile for each simulation, including estimated LYs and QALYs, and cumulative event rates for each health state, in advance of the congress. Modeling groups that submitted their challenge results prior to the congress and participated in the event were included in this article. All modeling groups agreed to include their simulation results in a peer-reviewed publication prior to the meeting. Resimulation was not allowed; however, modeling groups were given the opportunity to check their submitted results post-challenge, and where applicable, updated results can be added to the appendix.
Post-challenge Statistical Analysis
Estimating structural uncertainty
Submitted results were collated, and the variability across different models was assessed by calculating the mean and standard deviations of reported outputs (LYs, QALYs, incremental LYs, and incremental QALYs). Incremental outcomes in LYs and QALYs across different models were ordered from lowest to highest, ranked, and plotted to facilitate comparisons between models and by intervention profiles. The Spearman’s rank-order correlation test was used to assess the strength and direction of association between the rankings of incremental LYs and QALYs across all models.
Impact and contribution of health state utility values
Results (incremental LYs and QALYs) from repeated simulations using the lower and upper limit of the 95% confidence intervals of utility values were also collated. These were compared with the reference case simulation results to provide an illustration of the relative magnitude of structural uncertainty in comparison with parameter uncertainty. Results were presented in figures to facilitate visualizing the impact of utility values within and across different models.
Investigate potential drivers for variations in reported outcomes
Each model application was characterized for a set of key characteristics of the model and how the modelers simulated the reference simulations, which included microsimulation methodology, number of health states with utility implications, the use of the UK Prospective Diabetes Study (UKPDS) cardiovascular and mortality risk equations, the use of additive utilities, and the inclusion of BMI disutility. The individual groups were consulted to ensure the models were correctly classified. LYs and incremental QALYs results were then plotted to facilitate comparison, and differences in mean life expectancies and incremental QALYs were compared across each of the subgroups. Regression analyses were conducted to test for associations between model characteristics and modeling approaches and model outcomes, using a 2-step approach. First, a 2-way fixed effect regression analysis was conducted to identify which models consistently produce higher or lower estimates across the intervention profiles simulated. Predicted average model effects across all 5 intervention profiles were then regressed against characteristics and modeling approaches to identify possible associations with outcomes.
Results
Eleven modeling groups participated in the Quality-of-Life Challenge (Table 3). The Cardiff Model submitted 2 sets of results, one using UKPDS 68 risk equations and the other using UKPDS 82 risk equations, yielding 12 sets of model results. Brief descriptions of participating groups can be found in Supplementary Material 2. Model-specific documentation of health states with utility values and a description of the utility approach used for handling multiple complications can be found in Supplementary Material 3.
Participating Modeling Groups
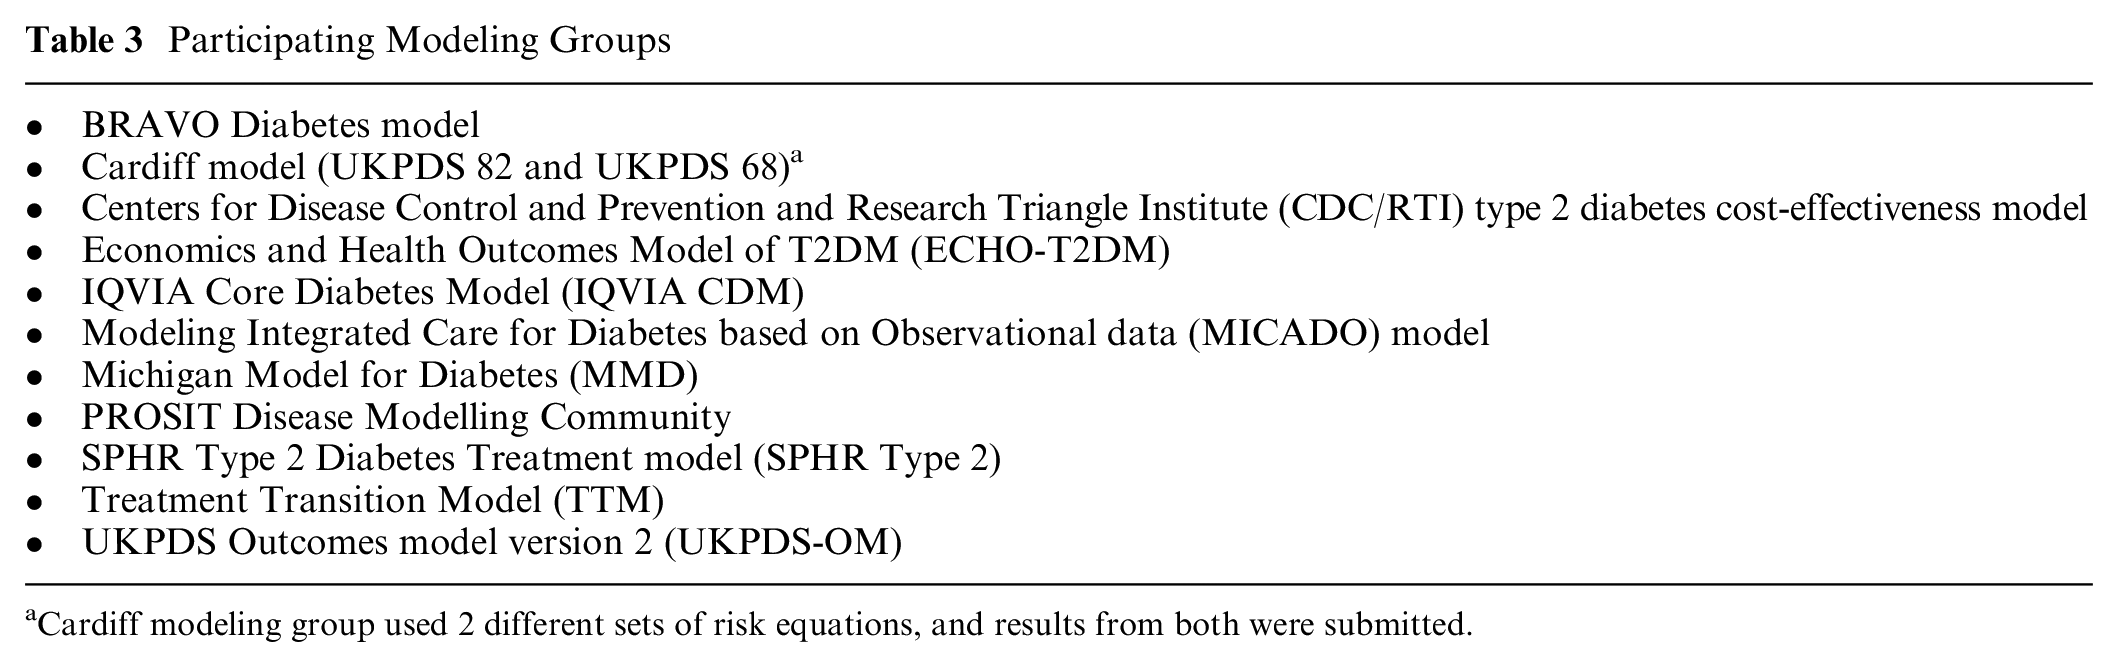
Cardiff modeling group used 2 different sets of risk equations, and results from both were submitted.
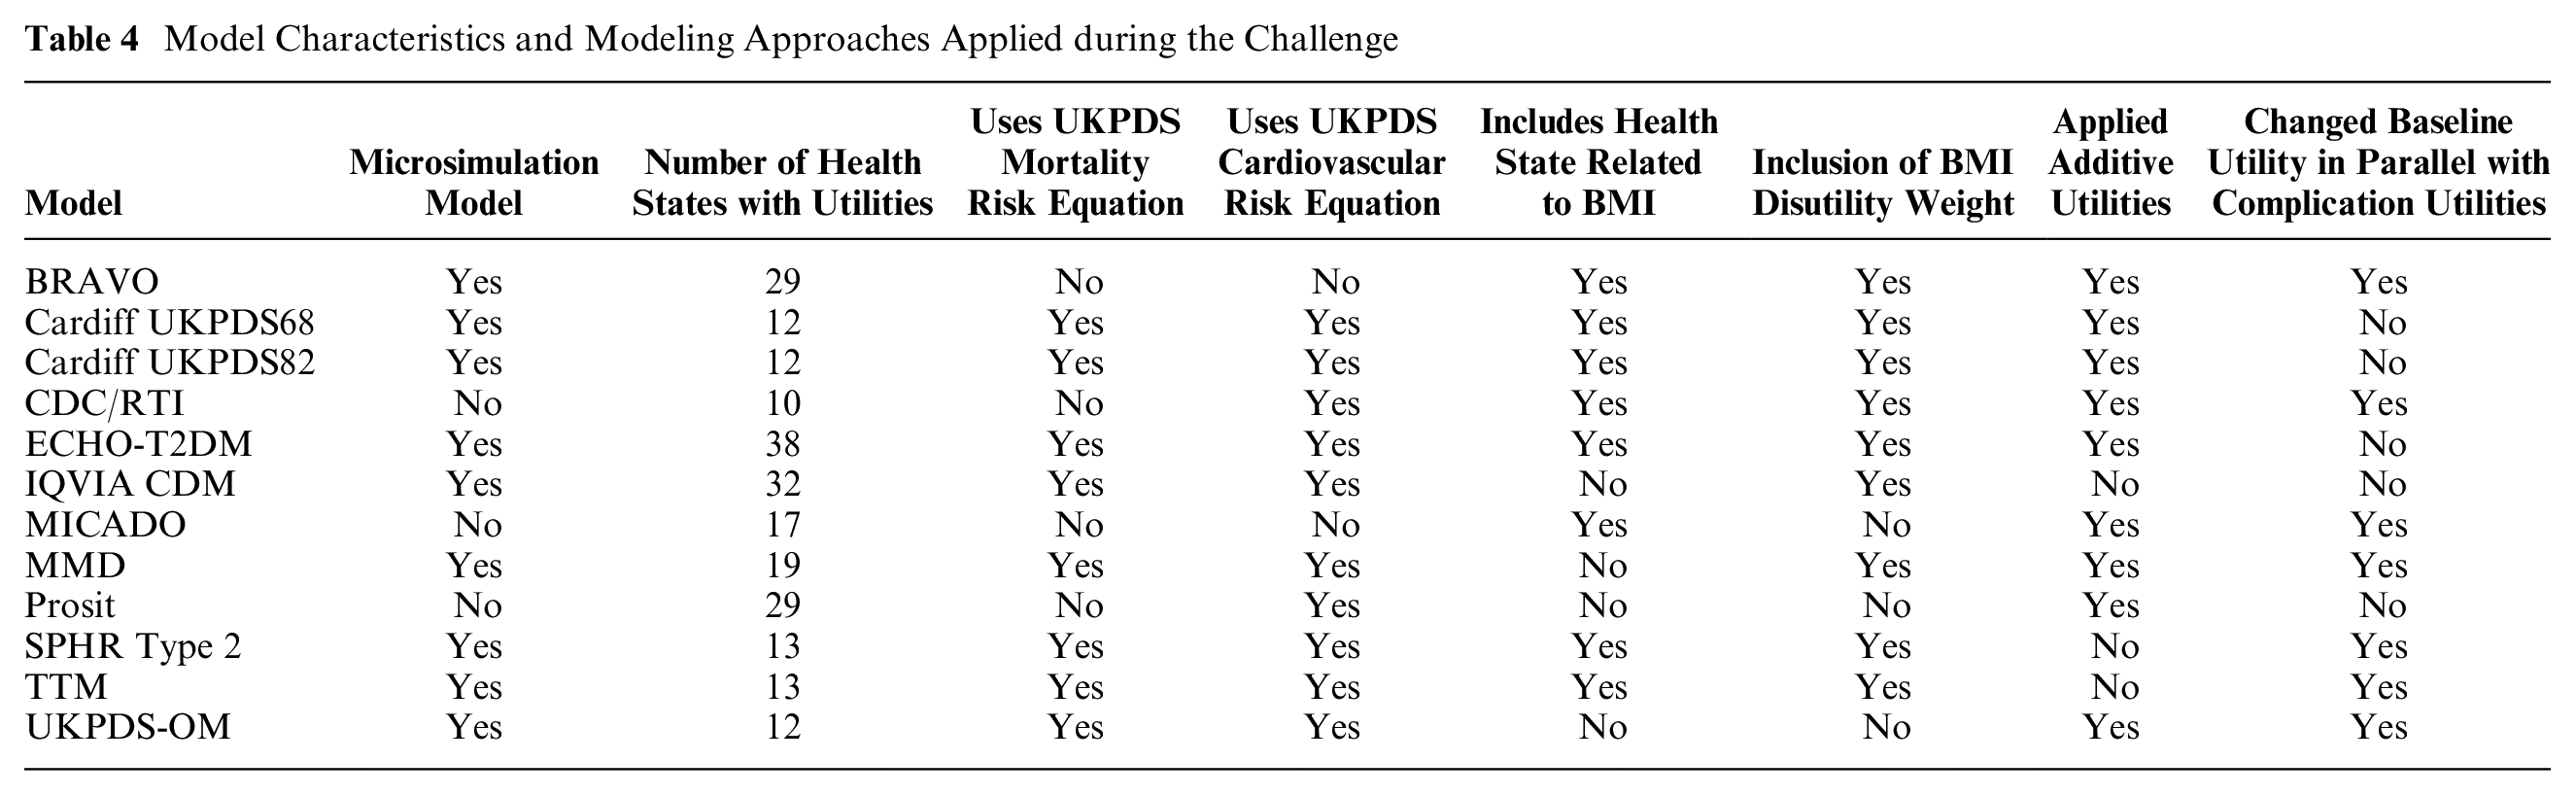
The number of health states with assigned utilities in the different models ranged from 10 to 38. Most models employed the additive approach to incorporate (dis-)utility values for comorbidities, but this was not possible for all models. IQVIA-CDM used the minimum approach per health state but added disutility for BMI, hypoglycemia events, and new events such as myocardial infarction and stroke; the Treatment Transition Model (TTM) used the minimum approach; and SPHR applied a multiplicative effect. Model characteristics and modeling approaches applied during the challenge are presented in Table 4.
Model Characteristics and Modeling Approaches Applied during the Challenge
The results reported at the congress are presented in this article. Results for TTM reported in this article were reported in error because of incorrect input values. The spirit of the Mount Hood Challenges is to explore all modeling groups’ results as they were originally presented to maintain the fidelity of discussions and conclusions that occurred at the conference. Corrected TTM results are therefore presented in the supplementary materials.
Cross-Model Variations in Reported Outcomes
Reported outcomes (LYs and QALYs) for the reference case simulation (control group) were compared across models (Figure 1). Mean estimated LYs and QALYs were 17.69 years (SD, 2.82) and 12.26 (SD, 1.51), respectively. LYs ranged from 11.7 to 19.6 years for males and 14.1 to 23.8 years for females, with a difference of 7.9 and 9.8 years between the lowest and highest reported values, respectively. QALYs ranged from 8.7 to 12.6 for males and 10.4 to 15.0 for females, with a difference of 4.0 and 4.6 QALYs, respectively.
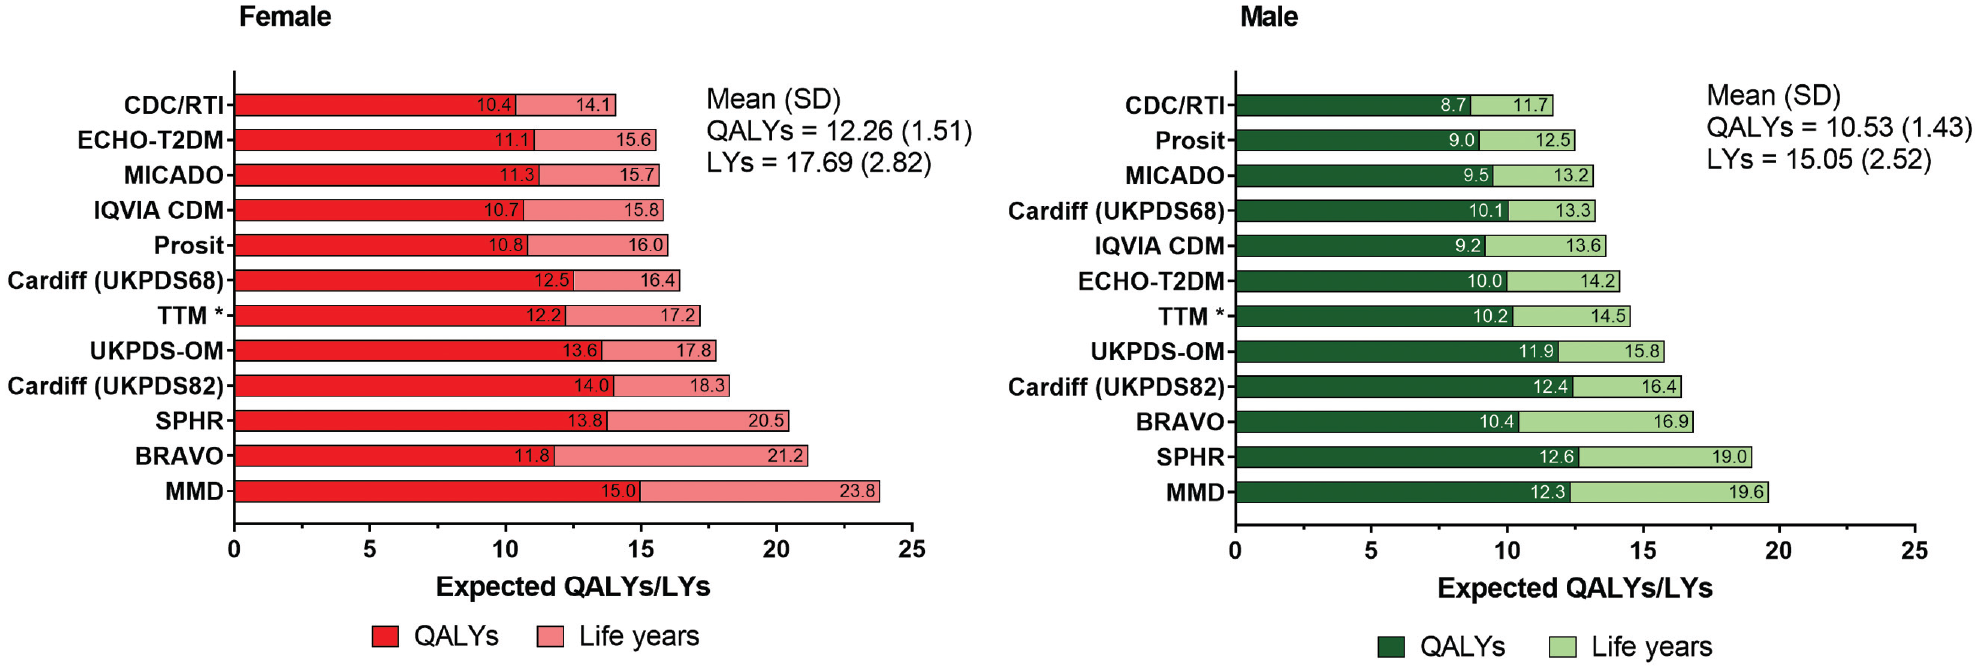
Comparison of life-years (LYs) and quality-adjusted life-years (QALYs) across all modeling groups (control). *The results for the Treatment Transition Model include simulations with incorrect input values, resulting in volatile interactions between interventions and changes in utilities. Corrected values (postchallenge) are reported in the supplementary materials.
Incremental LYs and QALYs for each model and intervention (males and females combined) are presented are Figure 2 (full results can be found in Supplementary Materials 4 and 5), showing substantial variability in outcomes. This was particularly apparent for the HbA1c and BMI intervention profiles, where there was a 15-fold difference between the lowest and highest reported incremental LYs for the HbA1c intervention profile and at least a 10-fold difference for incremental QALYs for the BMI intervention. The Spearman’s rank-order correlation test indicated a non–statistically significant association between the rankings of reported LYs and QALYs for both of these intervention profiles. When the Prosit, MMD, TTM, BRAVO, and MICADO models were excluded, less variation in incremental outcomes was observed.
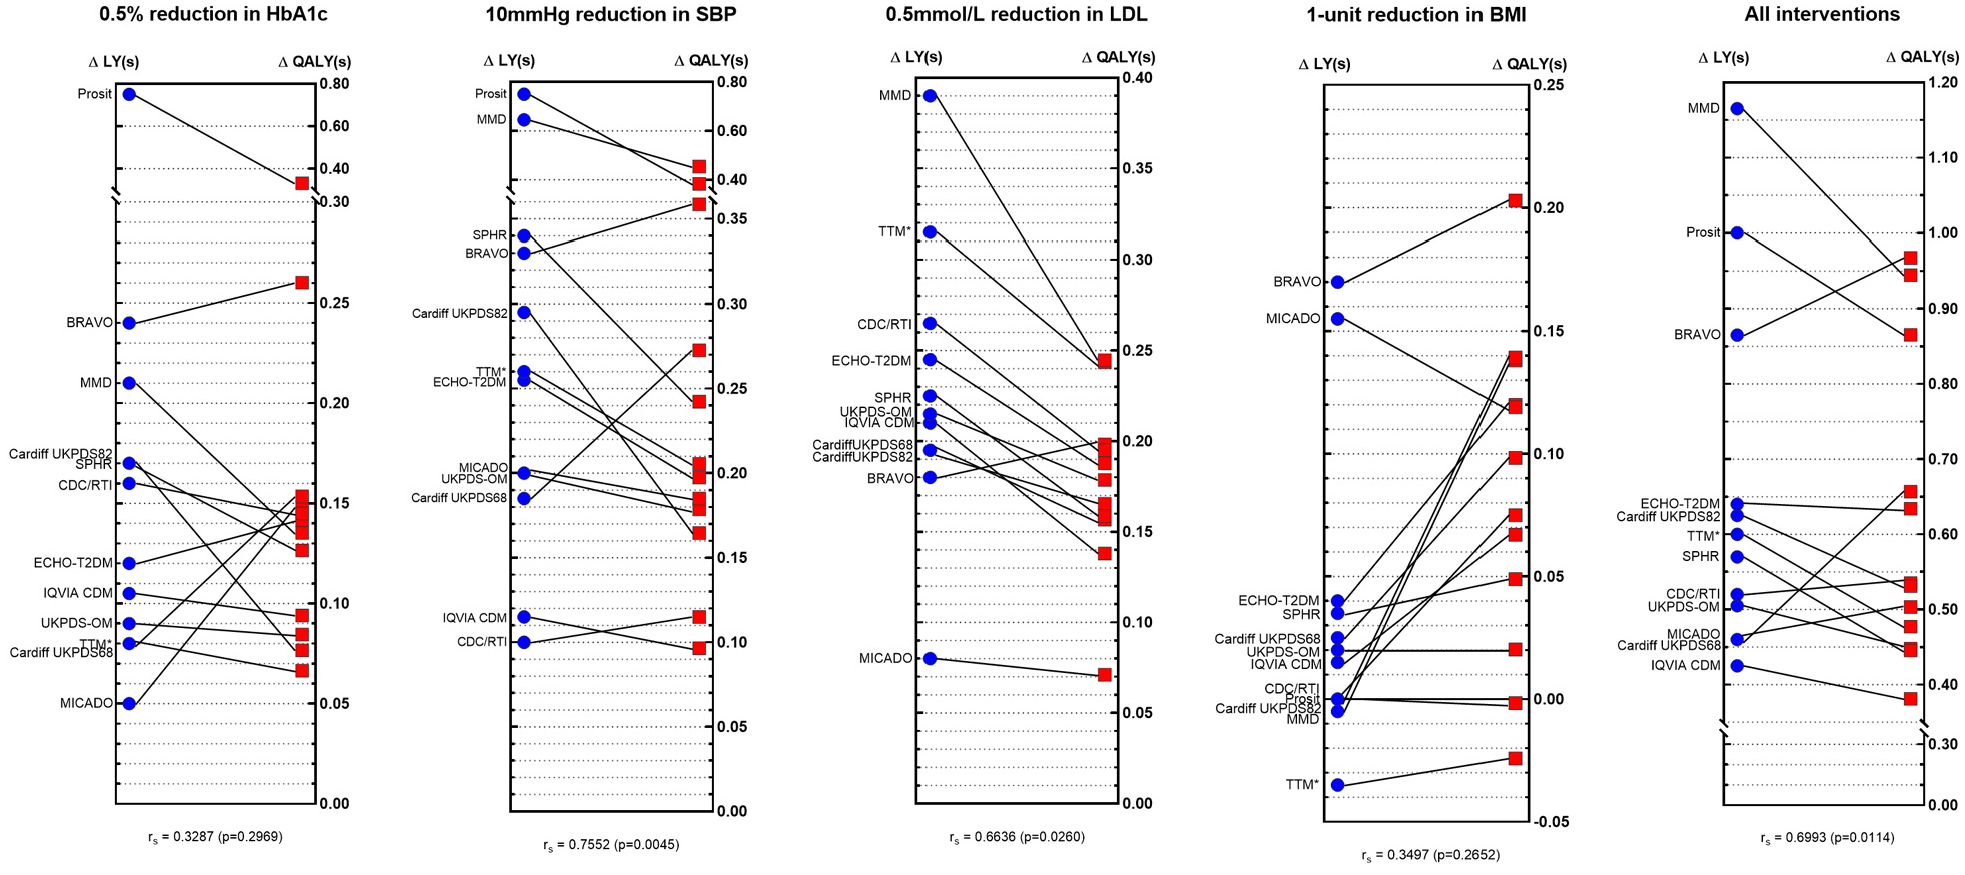
Comparisons of incremental life-years (ΔLYs) and incremental QALYs (ΔQALYs) across different models by intervention profile. *The results for Treatment Transition Model (TTM) include simulations with incorrect input values, resulting in volatile interactions between interventions and changes in utilities. Corrected values (postchallenge) are reported in the following Supplementary Materials.
Impact of Health State Utility Values on Lifetime Outcomes
Changing utility values to the lower or upper limits of the 95% confidence intervals resulted in a decrease and increase in QALYs, respectively. Within each model, reported QALYs were similar across interventions and by sex. However, comparisons across models indicate considerable cross-model variability. The Cardiff models (both UKPDS 68 and 82) reported the smallest change (±0.16 QALYs, 1.5% change), and a change of up to ±3.52 QALYs (31% change) was reported by the BRAVO modeling group. Eight of the 12 models showed a greater than 15% change in reported QALYs when changing utility values to the lower and upper limits (results presented in Supplementary Material 6).
Figure 3 shows the effect of utility changes (error bars representing the lower and upper limits of the 95% confidence interval) on incremental QALYs for the “All interventions combined” profile. Although varying utility values had an impact on incremental QALYs within each of the models, the observed variation across models was much more prominent. This was similarly observed across the other intervention profiles (full results and figures presented in Supplementary Materials 7 and 8).
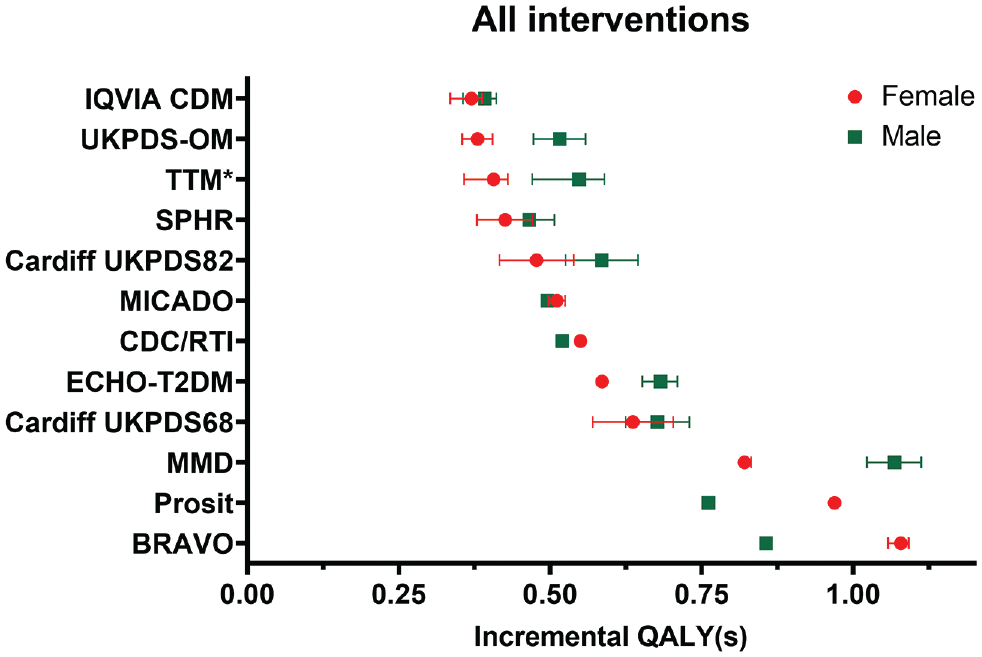
Impact of utility values on incremental quality-adjusted life-years (QALYs) within and across the different models for the “All interventions” combined profile. The error bars indicate the impact of change in all utility values (to the lower and upper limits of the 95% confidence interval). *The Treatment Transition Model (TTM) reported a large change in incremental QALYs for the upper limit due to input error; therefore the upper limit error bars were omitted for TTM. The results for TTM include simulations with incorrect input values resulting in volatile interactions between interventions and changes in utilities. Corrected values (postchallenge) are reported in the following Supplementary Materials. ^No error bars were shown for ^Prosit, as these results were unavailable.
In comparison with the observed cross-model variability, the effect of changing the utility value associated with each health state was of a much smaller magnitude. These changes resulted in very small changes to the incremental QALYs (to the hundredth of a decimal place) and are presented in Supplementary Material 9. However, this effect was highly variable across models. For example, changing the utilities for stroke to the lower 95% CI limit resulted in a 10.5% change in incremental QALYs reported by BRAVO, while CDC/RTI and IQVIA reported a negligible change. It was also observed that the relative change in incremental QALYs due to utility change of certain health states such as ischemic heart disease and myocardial infarction are generally consistent across models, but for rarer outcomes such as blindness and amputation, a greater variation was observed.
It was found postchallenge that some modeling groups (e.g., BRAVO, SPHR, CDC/RTI, MICADO, MMD) varied their baseline utility value (without complications) in parallel with varying utility values associated with complications, whereas others kept this constant using the base value. The potential for systematic differences in reported outcomes by modeling groups’ approach was tested, and we found no difference (Supplementary Materials 10).
Impact of Model Characteristics and Modeling Approaches on Reported Outcomes
Models were subgrouped based on model characteristics and modeling approaches applied during the challenge (Table 4). Of the 12 participating models (including the 2 versions of the Cardiff Model), 9 were microsimulation models, 4 had more than 20 health states with utility implications, 8 models used the UKPDS mortality risk equation, 10 incorporated UKPDS cardiovascular risk equations, and 9 were able to apply additive disutility weights as per the challenge instructions. For the LYs outcome, microsimulation models appear to report more LYs than nonmicrosimulation (cohort) models (by at least 3.30 years) across all 5 intervention profiles. Greater LYs were also reported in models with <20 health states with utilities and among models that incorporated the UKPDS mortality risk equation. However, these differences were small (ranging from 0.04 to 1.92), and none were statistically significant. For the incremental QALYs outcome, there were no obvious patterns as to how outcomes differed by model characteristics and modeling approaches across the intervention profiles. Full results and figures are presented in Supplementary Materials 11.
The regression analyses identified BRAVO and MMD models as consistently producing larger estimates across the intervention profiles, whereas CDC/RTI, MICADO, IQVIA CDM, and TTM produced smaller estimates (Supplementary Material 12). Similar to the subgroup analysis, microsimulation models appear to report more LYs than cohort simulation models (by 3.41 years, P = 0.049). No significant associations were observed with any other characteristics or modeling approaches for both outcomes.
Discussion
The results of the 9th Mount Hood Diabetes Quality-of-Life Challenge provide a unique opportunity to examine the importance of structural uncertainty using the reported outcomes of 11 different diabetes simulation models (reporting 12 sets of model results). This challenge provided valuable insights into variation in outcomes produced by different diabetes models and for different intervention profiles, despite controlling for baseline patient characteristics and, to a certain extent, simulation assumptions. The findings indicate substantial cross-model variability in QALY predictions for a standardized set of simulation scenarios, despite the long familiarity between modeling groups (some relationships going back 20 years) and the development of guidelines to enhance model comparability.20,22 Interestingly, the observed cross-model variations were considerably larger than within-model variability to alternative health state utility values (e.g., lower and upper limits of the 95% confidence intervals of utility inputs). Cross-model differences may conceivably be even larger in other disease areas, which have not developed this type of shared modeling community. The potential importance of underlying model assumptions, structure, and data sources may consequently affect important decisions regarding funding/reimbursements and research priorities. This reinforces the need to look critically beyond just parameter uncertainty and to integrate tests of structural uncertainty in model-based analysis.
Although uncertainties due to utility values are routinely assessed through sensitivity analyses,30,31 it is much more difficult to ascertain the impact of using different models to inform such decisions. The findings from this challenge indicate that variations in utility values of diabetes-related complications had a smaller impact on incremental outcomes than cross-model variability. For example, the incremental QALYs associated with a 0.5% reduction in HbA1c ranged from 0.066 for the TTM model to 0.331 for the Prosit model, which represents a 5-fold change in outcomes. To put this variation into context, the change is of a larger magnitude compared with the probabilistic uncertainty reported in the evaluation of the blood glucose–lowering intervention in the UKPDS study. 32 Ideally, all sources of uncertainty (not just parameter uncertainty) should be considered.
Despite attempts to identify specific factors that drive the differences observed across models, it was difficult to identify a particular contributing factor (a downside to our pragmatic use of multiway structural uncertainty analysis). Our results indicated that differences across models overshadowed differences between subgroups of models organized by key structural assumptions (Appendix 11 and 12 in the Supplementary Materials), although there were some regularities. For example, we found that microsimulation models generated more mean LYs than cohort simulation models did, and this difference was statistically significant (P = 0.049), despite the small sample size. This is consistent with the convexity of most mortality risk equations (i.e., with risks that increase and at increasing rate). But much of the cross-model differences are likely attributable to combinations of differences in many structural assumptions in the 11 unique diabetes models (12 sets of results). It may also be the correlation between model characteristics and modeling approaches drives the differences observed.
We acknowledge the clear limitation of the current analysis, in particular, that it provides only an initial exploration as to why results vary across models. However, it does illustrate the difficulties of teasing out specific factors as key drivers. An alternative approach to testing structural uncertainty (as mentioned in the introduction) is to assess the impact of changing aspects of a model design (and to document this as per current practice with 1-way sensitivity analyses on key parameters). However, such practices are uncommon, as results (e.g., from the omission of a particular health state) may not be meaningful to consider for decision making, and there is currently a lack of guidance for addressing structural uncertainty formally. This lack of clarity further highlights the need for greater model transparency and a better understanding of the structural elements of a model. These are important considerations and should be an area of focus for future research. These can also inform the design of future Mount Hood Challenges, including specification of more detailed model reporting and outcomes collection and perhaps even greater model transparency to support deeper analyses of the observed variations across models, for example, the extent and number of diabetes-related complications evaluated and the approach of integrating these complications and changes to cumulative complication events across models. There were also differences in how models incorporated the impact of possible interventions; for instance, not all models use BMI as an independent determinant of disease progression, which may explain the large variations in outcomes observed for the BMI intervention profile. A model registry is a way of routinely capturing additional information that would enable future investigation of underlying factors that produce differences in outcomes across models.
A potentially concerning aspect of structural uncertainty is that models used in health technology assessments are often judged in relation to an incremental cost per QALYs gained threshold. Given the wide variation observed, there is scope to achieve a desired outcome by choosing a particular model structure. One way to ensure greater model consistency is to institute model registries, which require a model to run a standard set of reference simulations. Leveraging the cooperative effort and participation of the Mount Hood Diabetes Challenge Network, the group has already taken a step down this road by initiating a diabetes model registry and running simulation challenges to promote transparency in diabetes simulation modeling. Challenge results from registered models such as those presented in this article are made available22,24–26,33 in an effort toward improving consistency in simulation modeling. In a similar fashion to randomized controlled trials, requiring all models to register and report results for simulated reference case outcomes would be one way to increase model transparency but could also provide an opportunity to quantify the level of structural uncertainty (as presented in this article). It may also be possible to capture uncertainty by parameterizing variation observed within the registry for interventions that have an impact on particular risk factors (e.g., interventions that affect body weight could draw on the variation in uncertainty from the simulations for the change in BMI; see Figure 2).
Although there have been suggestions to address the issue of structural uncertainty (for example, through model averaging, parameterization, model discrepancy, or scenario analyses), these approaches are not commonly applied to health economic decision modeling,2,23,34 and there is little guidance on how structural uncertainty can be reduced. One potential way would be to place more weight on results of models that have been shown through external validation to be reliable in reproducing observed outcomes. While the Mount Hood Diabetes Challenge Network has promoted such external validation through challenges,25,26,33 external validation is the exception rather than the norm for health economic models. Addressing structural uncertainty is increasingly pertinent as the number of diabetes simulation models have grown substantially since the publication of the first model by Eastman et al. more than 2 decades ago. 35 At least 33 diabetes models have been identified since 2000, and simulation models have evolved in complexity and vary in important ways. Therefore, validations should be redone each time the model structure is modified. Again, there may be a role for registries such as the Mount Hood Diabetes Model Registry to report the results of models undertaking specified external validations and to produce metrics that could be used to give greater weight to those models that are better able to replicate relevant real-world results.
Our results also provide some indications of the relative magnitude of structural uncertainty in comparison with parameter uncertainty. We examined the impact of varying levels of utility for key complications. The measurement of quality of life in health economics and in its application to diabetes has been a key focus of research.29,36–41 Although varying utility values had an impact on incremental QALYs within each of the models, the observed variation across models was much more substantial (Figure 3). This indicates that variations in the utility values (often tested in sensitivity analyses) contribute to a lesser degree compared with other aspects of model uncertainty captured as structural uncertainty. Importantly, there is limited investment in the development of transparent publicly available disease-specific models. For example, in diabetes, the overwhelming majority of diabetes models use risk equations from the UKPDS Outcomes Model. 42 While there are requirements in health technology assessment process to use evidence from large clinicals trials, there has not been the same focus on investing in simulation models that can translate the results of randomized controlled trials into QALYs to facilitate evaluation and generate evidence for reimbursement and/or pricing decisions and research priorities. A value-of-information analysis may be a useful way to guide prioritization in research and development of future diabetes simulation models.
This study is subject to a number of limitations. First, as the challenge involved the participation of many modeling groups, simplification of the challenge instructions was needed to ensure all groups ran their simulations under the same challenge conditions. This included simplifications such as not allowing for biomarker evolution. This may have affected some models more than others, particularly those that link biomarker changes and health state transitions. In such models (ECHO-T2DM, MMD, and UKPDS-OM), if biomarker evolution was left active, it could result in greater changes to the incremental QALYs. In addition, the rates of hypoglycemia were not explicitly defined in the challenge instructions, and in some models (e.g., ECHO-T2DM and the Cardiff Model), this was an important driver. Second, not all modeling groups ran their simulations identically because of different interpretations of the challenge instructions. For instance, some groups (BRAVO, SPHR, CDC-RTI, MICADO, and MMD) varied their baseline utility value (without complications) in parallel with varying utility values associated with complications, while others kept this constant using the base value. These discrepancies did not appear to affect results systematically (Supplementary Material 10). Third, modeling groups were instructed to report only mean outcomes, and standard errors were not captured. Results across models may have substantial overlap, and this can be further investigated with future challenges. Fourth, the results presented here for the TTM modeling group are those presented at the challenge, which were based on incorrect input values. This preserves the spirit of the Mount Hood Challenges in exploring model results as they were originally presented and maintains the fidelity of discussions and conclusions as they occurred. In the interest of fairness, TTM was provided an opportunity to correct the simulations, and the results and corrected analysis are presented in the appendix (Supplementary Material 4). Although rankings for some models were affected, this difference was small, and it did not alter the conclusion that there is large variation across models.
Conclusion
This Quality-of-life Mount Hood Diabetes Challenge highlights the substantial variability in reported outcomes across 11 different diabetes simulation models. While much research has focused on obtaining appropriate sets of utility values to adequately describe health states, the results from this challenge demonstrated a greater need to understand and assess structural uncertainty, as the choice of models used to inform resource allocation decisions can matter. These are important considerations and should be an area of focus for future research. Finally, the choice of a specific model or model type alone does not reduce structural uncertainty or guarantee the most accurate model result for a specific analysis. Similar models (e.g., Markov) using the same data may produce vastly different results. Technical implementation of how the model is executed within a specific analysis will always be critical; the devil is in the details.
Supplemental Material
sj-docx-1-mdm-10.1177_0272989X211065479 – Supplemental material for Exploring Structural Uncertainty and Impact of Health State Utility Values on Lifetime Outcomes in Diabetes Economic Simulation Models: Findings from the Ninth Mount Hood Diabetes Quality-of-Life Challenge
Supplemental material, sj-docx-1-mdm-10.1177_0272989X211065479 for Exploring Structural Uncertainty and Impact of Health State Utility Values on Lifetime Outcomes in Diabetes Economic Simulation Models: Findings from the Ninth Mount Hood Diabetes Quality-of-Life Challenge by Michelle Tew, Michael Willis, Christian Asseburg, Hayley Bennett, Alan Brennan, Talitha Feenstra, James Gahn, Alastair Gray, Laura Heathcote, William H. Herman, Deanna Isaman, Shihchen Kuo, Mark Lamotte, José Leal, Phil McEwan, Andreas Nilsson, Andrew J. Palmer, Rishi Patel, Daniel Pollard, Mafalda Ramos, Fabian Sailer, Wendelin Schramm, Hui Shao, Lizheng Shi, Lei Si, Harry J. Smolen, Chloe Thomas, An Tran-Duy, Chunting Yang, Wen Ye, Xueting Yu, Ping Zhang and Philip Clarke in Medical Decision Making
Footnotes
Authors’ Note
This work has been presented at the 2018 Mount Hood Diabetes Challenge Congress held in Dusseldorf, Germany.
The authors declared the following potential conflicts of interest with respect to the research, authorship, and/or publication of this article: MW is employed by the Swedish Institute for Health Economics, which created and owns the ECHO-T2DM model and provides consulting services for its use. CA was previously employed by the Swedish Institute for Health Economics, which created and owns the ECHO-T2DM model and provides consulting services for its use.
AG is partly funded by the NIHR Biomedical Research Centre, Oxford, UK. ML and MR are employed by IQVIA, which created and owns the IQVIA Core Diabetes Model and provide consulting services for its use. HS and L Shi have ownership of the BRAVO diabetes model. L Si received grants from the National Health and Medical Research Council outside the submitted work. PC is partly funded by the NIHR Biomedical Research Centre, Oxford. UK. The authors received no financial support for the research, authorship, and/or publication of this article.
References
Supplementary Material
Please find the following supplemental material available below.
For Open Access articles published under a Creative Commons License, all supplemental material carries the same license as the article it is associated with.
For non-Open Access articles published, all supplemental material carries a non-exclusive license, and permission requests for re-use of supplemental material or any part of supplemental material shall be sent directly to the copyright owner as specified in the copyright notice associated with the article.