
Abstract
Background
The performance of risk prediction models is often characterized in terms of discrimination and calibration. The receiver-operating characteristic (ROC) curve is widely used for evaluating model discrimination. However, when comparing ROC curves across different samples, the effect of case mix makes the interpretation of discrepancies difficult. Further, compared with model discrimination, evaluating model calibration has not received the same level of attention. Current methods for examining model calibration require specification of smoothing or grouping factors.
Methods
We introduce the “model-based” ROC curve (mROC) to assess model calibration and the effect of case mix during external validation. The mROC curve is the ROC curve that should be observed if the prediction model is calibrated in the external population. We show that calibration-in-the-large and the equivalence of mROC and ROC curves are together sufficient conditions for the model to be calibrated. Based on this, we propose a novel statistical test for calibration that, unlike current methods, does not require any subjective specification of smoothing or grouping factors.
Results
Through a stylized example, we demonstrate how mROC separates the effect of case mix and model miscalibration when externally validating a risk prediction model. We present the results of simulation studies that confirm the properties of the new calibration test. A case study on predicting the risk of acute exacerbations of chronic obstructive pulmonary disease puts the developments in a practical context. R code for the implementation of this method is provided.
Conclusion
mROC can easily be constructed and used to interpret the effect of case mix and calibration on the ROC plot. Given the popularity of ROC curves among applied investigators, this framework can further promote assessment of model calibration.
Highlights
Compared with examining model discrimination, examining model calibration has not received the same level of attention among investigators who develop or examine risk prediction models.
This article introduces the model-based ROC (mROC) curve as the basis for graphical and statistical examination of model calibration on the ROC plot.
This article introduces a formal statistical test based on mROC for examining model calibration that does not require arbitrary smoothing or grouping factors.
Investigators who develop or validate risk prediction models can now also use the popular ROC plot for examining model calibration, as a critical but often neglected component in predictive analytics.
Keywords
Background
Risk prediction models that objectively quantify the probability of clinically important events based on observable characteristics are critical tools for efficient patient care. A risk prediction model is typically constructed using a development (or training) sample, but before it is adopted for use in a target population, its performance needs to be assessed in an independent (external) validation sample drawn from that population. In examining the appropriateness of a risk model, 2 fundamental aspects are discrimination and calibration. The former refers to the capacity of the model to properly stratify individuals with different risk profiles, and the latter refers to the degree to which predicted risks are close to the true risks. 1
The receiver-operating characteristic (ROC) curve and the area under the ROC curve (AUC, or the c-statistic) are classical examples of tools for assessing model discrimination. 2 When evaluating a risk prediction model in a sample, the discriminatory performance of the model can be affected by both the distribution of predictor variables (case mix) and the validity of the model in that sample. 3 Consequently, when comparing the performance of a model between development and validation samples, differences in the case mix between the 2 samples can make comparisons difficult. One area of interest in the present work is to untangle these 2 sources of discrepancy. Early progress in this area was made by Vergouwe et al. 3 who proposed benchmarks based on simulating responses from predicted risks and fitting the model in the validation sample. More recent work has largely focused on the AUC, an overall summary measure of the ROC curve.4–6
Compared with model discrimination, examining model calibration has not received the same level of attention.7,8 Model calibration is often neglected in the evaluation of the overall performance of risk prediction models, so much so that it is referred to as “the Achilles’ heel of predictive analytics.” 9 In the context of a logistic model for binary responses, Van Calster et al. 10 proposed a hierarchy of definitions for model calibration. In particular, a model is “moderately calibrated” if the average observed risk across all subjects with a given predicted risk is equal to the predicted risk. Moderate calibration is contrasted with mean calibration when the expected values of predicted and true risks are equal, with “weak” calibration when a linear calibration plot has an intercept of 0 and slope of 1, and with “strong” calibration when the predicted and observed risks are equal for all covariate patterns (an unrealistic condition in practical situations). 10 Moderate calibration is typically assessed using the calibration plot, which shows the average value of the observed risk as a function of the predicted risk after grouping or smoothing response values.
In this work, we propose a model-based ROC (mROC) analysis. We show that the mROC connects ROC analysis, a classical means of evaluating model discrimination, to model calibration. With the help of a stylized example, we demonstrate how the mROC enables investigators to disentangle the effect of case mix and model validity on the shape of the ROC curve. We propose a novel statistical test for the assessment of model calibration that does not require specification of smoothing or grouping factors and evaluate its performance through simulation studies. Through a case study, we put the developments in a practical context.
Notation and Context
Our main interest is in the “external validation” context, in which a previously developed risk prediction model for a binary outcome is applied to a new independent (external) sample to examine its performance in that sample’s target population. The risk prediction model is given by the deterministic function
Empirical ROC Curve
Two fundamental probability distributions underlie the ROC curve: the distribution of predicted risks among individuals who experience the event (positive individuals, or cases) and among individuals who do not experience the event (negative individuals, or controls). Let

The true-positive and false-positive probabilities are closely linked with the distribution of risk among the positive and negative individuals, respectively:

where
With the external data set, consistent estimators for

and

mROC Curve
The ith subject in the external sample is a random draw from the set of all individuals in the target population whose predicted risk is
Let

and

The application of Bayes’s rule leads to the following estimators in the external sample:

and

Hence, one can generate a “model-based” ROC or
Connection Between the mROC Curve, Case Mix, and Model Calibration
The limiting forms (population equations) of the estimated CDFs
Unlike in the expression of
Consider the mROC and empirical ROC curves in the validation sample when examining the external validity of a model. The former carries the association between the predictors and outcome from the development sample through the prediction model, whereas the latter captures such association in the validation sample. However, both are based on the case mix in the validation sample. Because of the shared case mix, discrepancies between these curves point toward model miscalibration in the validation sample. This can be demonstrated using a stylized example: Consider a single predictor
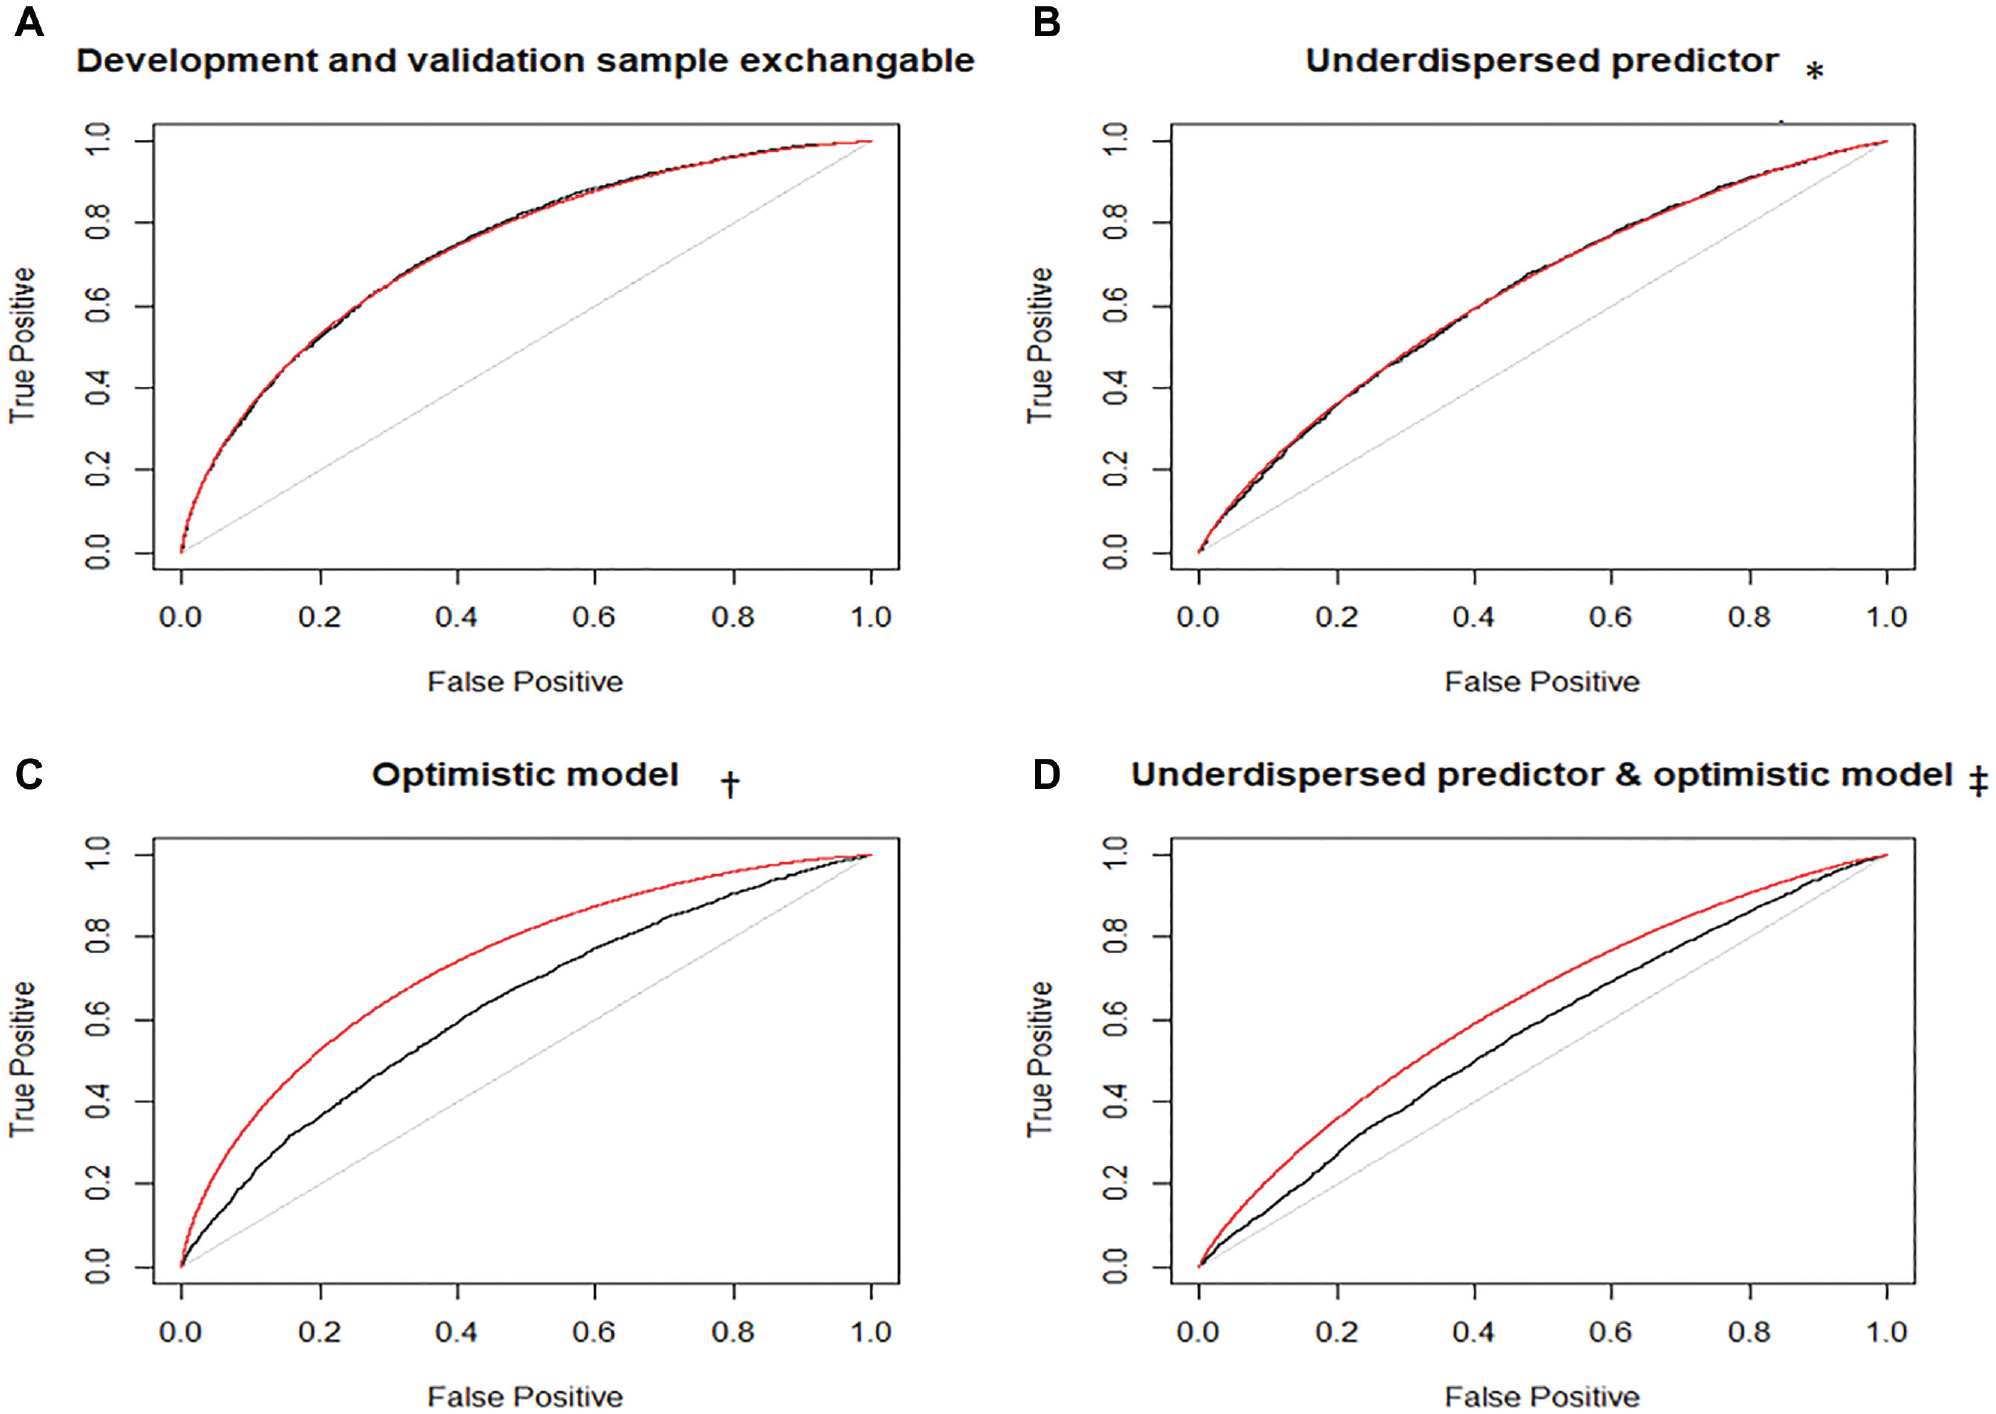
Empirical receiver-operating characteristic (ROC; black) and model-based ROC (mROC; red) curves for the stylized example. *Distribution of the single predictor in the validation population: X∼Normal(µ= 0, σ = 0.5). †Association model in the validation population: P(Y = 1) = 1/(1 + exp(−X/2)). ‡Predictor distribution same as in panel B, and association model same as in panel C.
mROC as the Basis of a Novel Statistical Test for Model Calibration
Although moderate calibration is a sufficient condition for the convergence at all points of the empirical ROC and mROC curves, moderate calibration on its own might not be a necessary condition for such convergence. To progress, in Supplementary Material section 4 we show that at the population level, the equivalence of ROC and mROC curves guarantees moderate calibration if an additional condition is imposed. This condition is mean calibration, i.e.,
Based on this finding, we propose a statistical inference procedure. We define the null hypothesis (
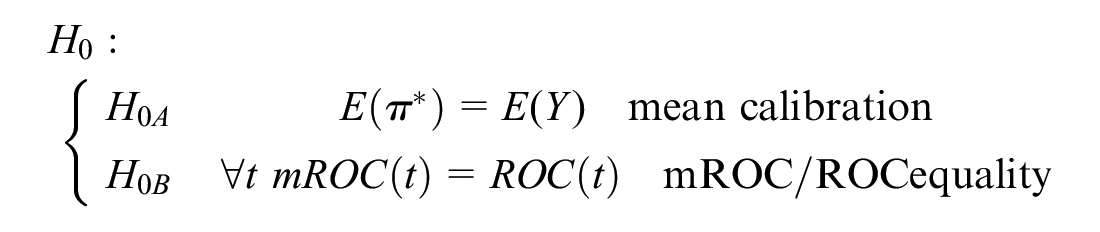
These hypotheses jointly provide the necessary and sufficient conditions for the risk prediction model to be calibrated.
For

For
Given that both
The null distributions of both

where

where
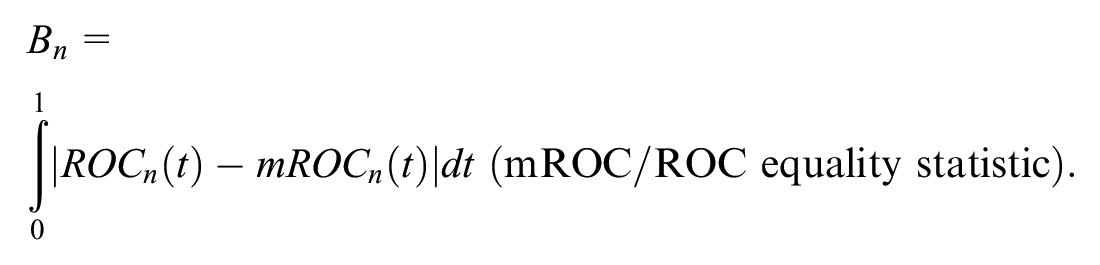
Individually, the 2 statistics provide insight about the performance of the model. However, it is more desirable to obtain a single overall P value for

would have a chi-square distribution with 4 degrees of freedom. However, as the 2 statistics are generated from the same data, they are dependent. An adaptation of Fisher’s method for dependent P values (based on matching the moments of the test statistic to that of a chi-square distribution) can be used. 16 The steps for generating a unified P value are outlined in the algorithm provided in Supplementary Material section 5.
Simulation Studies
We performed simulation studies to evaluate the finite-sample properties of the proposed test and compare its performance against the conventional Hosmer-Lemeshow and likelihood ratio tests of model calibration. We modeled a single predictor
In the second set, the true risk model remained the same as above, and we modeled nonlinear miscalibrations as
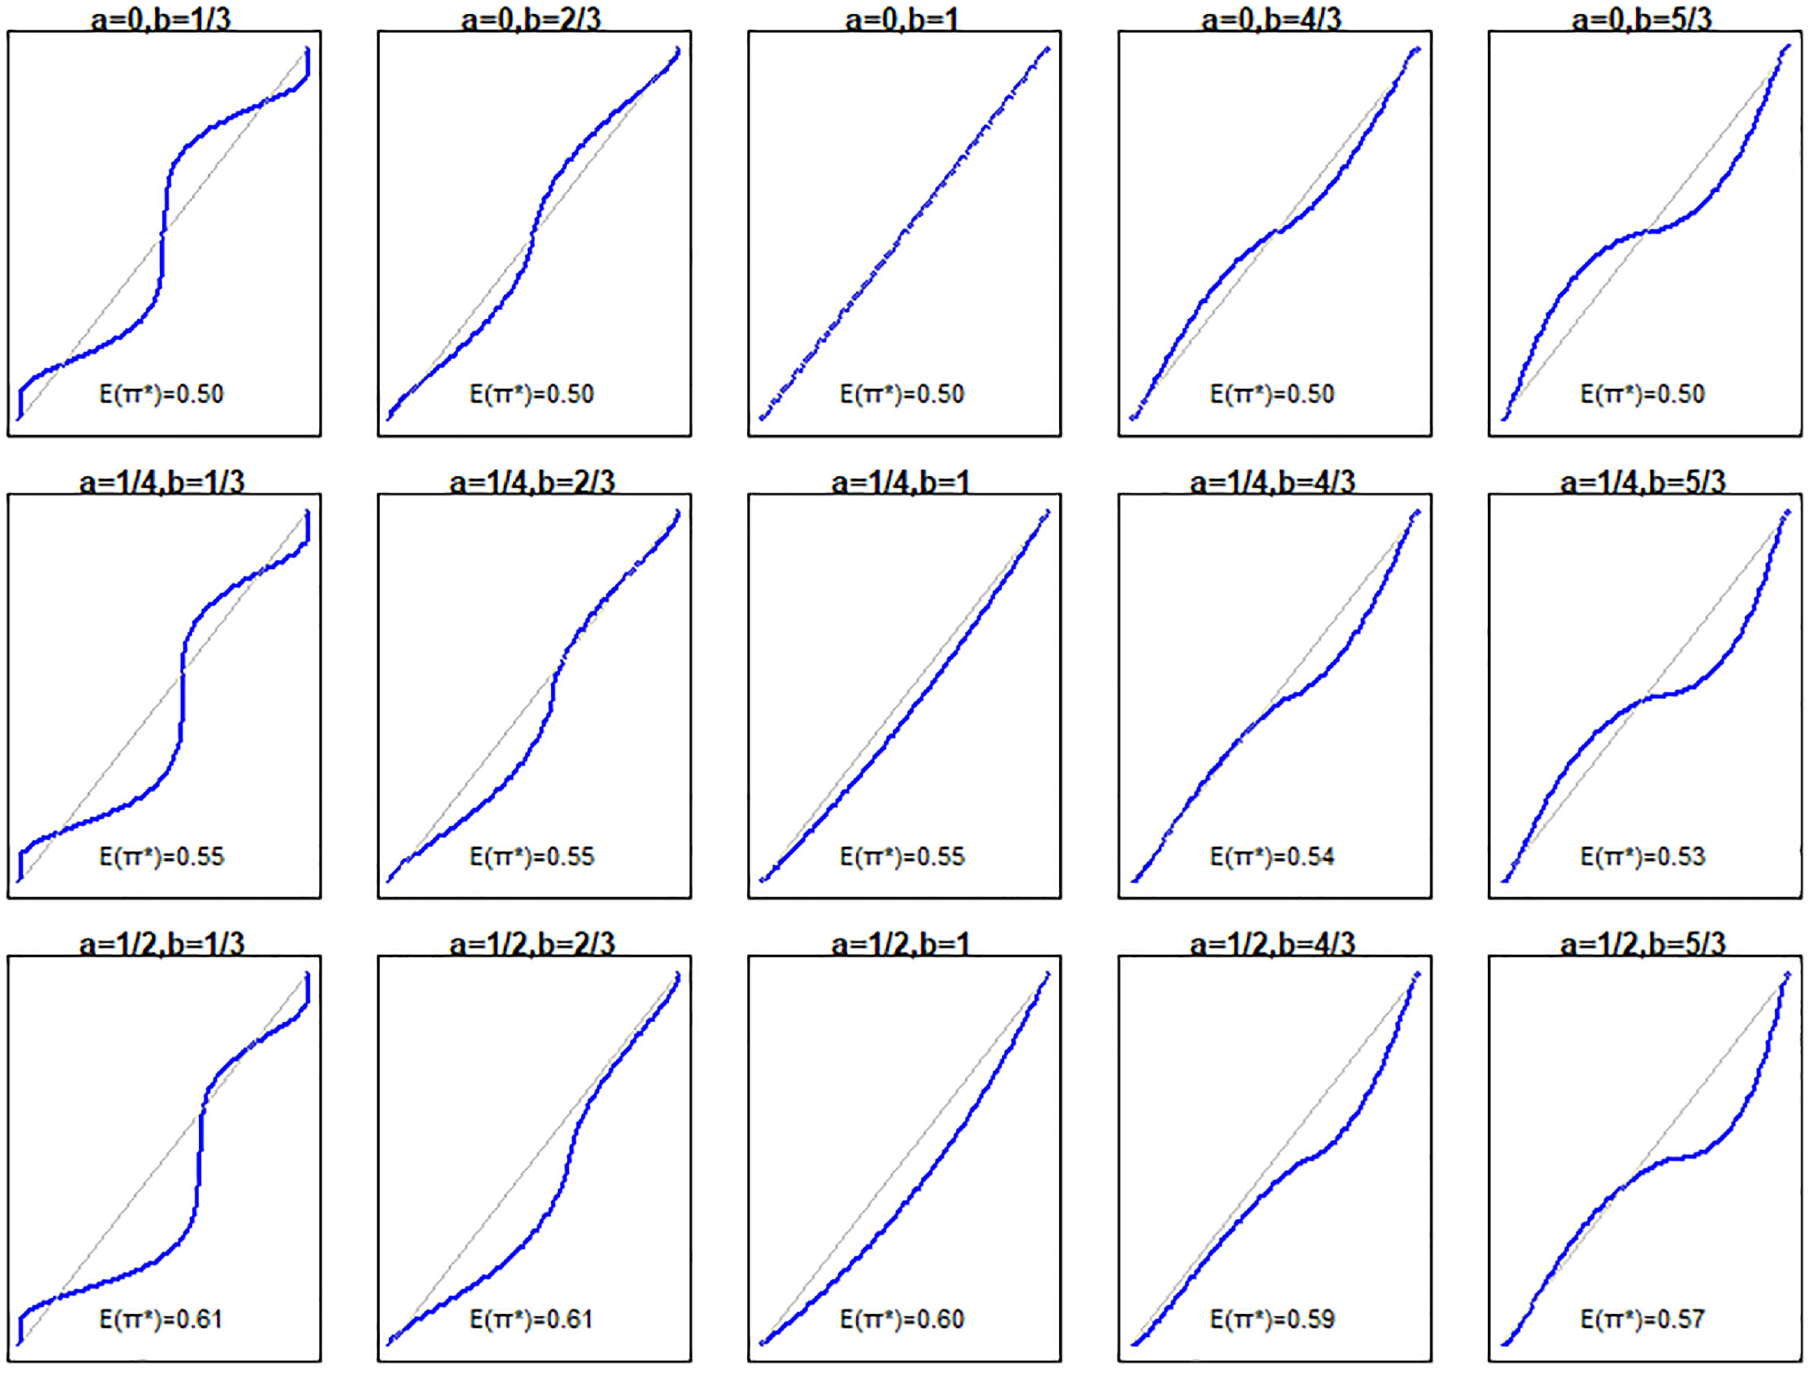
Relationship between predicted (x axis) and true (y axis) risks for the simulation scenarios.
We calculated the power of the mean calibration test, the mROC/ROC equality test, the unified test, the Hosmer-Lemeshow test (based on decile groups), and the likelihood ratio test in detecting miscalibration at the 0.05 significance level. Following recommendations on objectively deciding on the number of simulations,
17
we obtained the results through 2500 Monte Carlo iterations such that the maximum SE around the probability of rejecting H0 would be 0.01. Within each iteration, P values were calculated from
Results of the first set of simulations are provided in Supplementary Material section 6. The power of the unified test was very close to that of the likelihood ratio test across all scenarios examined. Figure 3 provides the empirical ROC and mROC curves for the second set of simulations. As all the mappings from
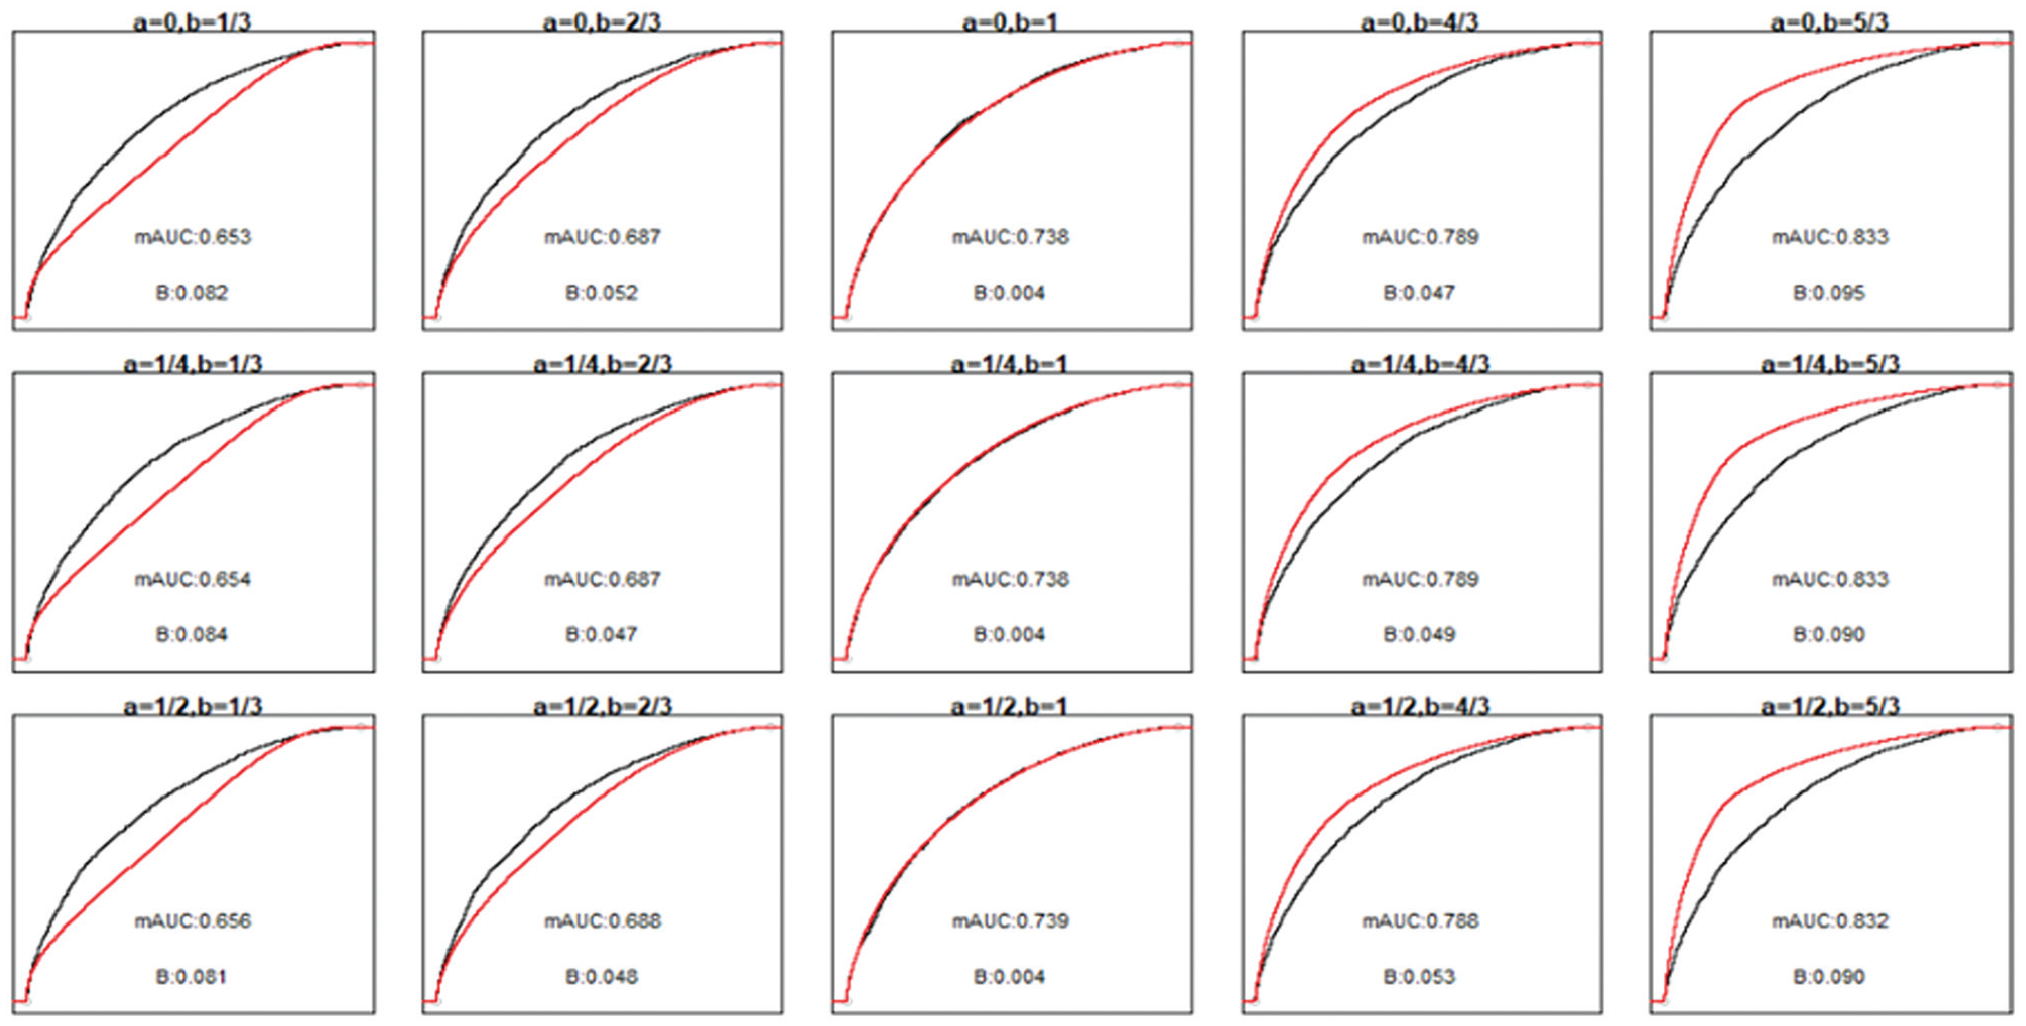
Receiver-operating characteristic (ROC; black) and model-based ROC (mROC; red) curves for the second simulation scenario. The panels positionally correspond to the calibration plots and simulation parameters presented in Figure 2. The ROC curves approximate the population-level curves as they are based on a large sample size (10,000 simulated observations). The area under the ROC curve is 0.740 in all scenarios. ROC, receiver operating characteristic; B, ROC equality statistic; mAUC, area under the model-based ROC curve.
The performances of all tests are summarized in Figure 4. The middle panel on the top row, where
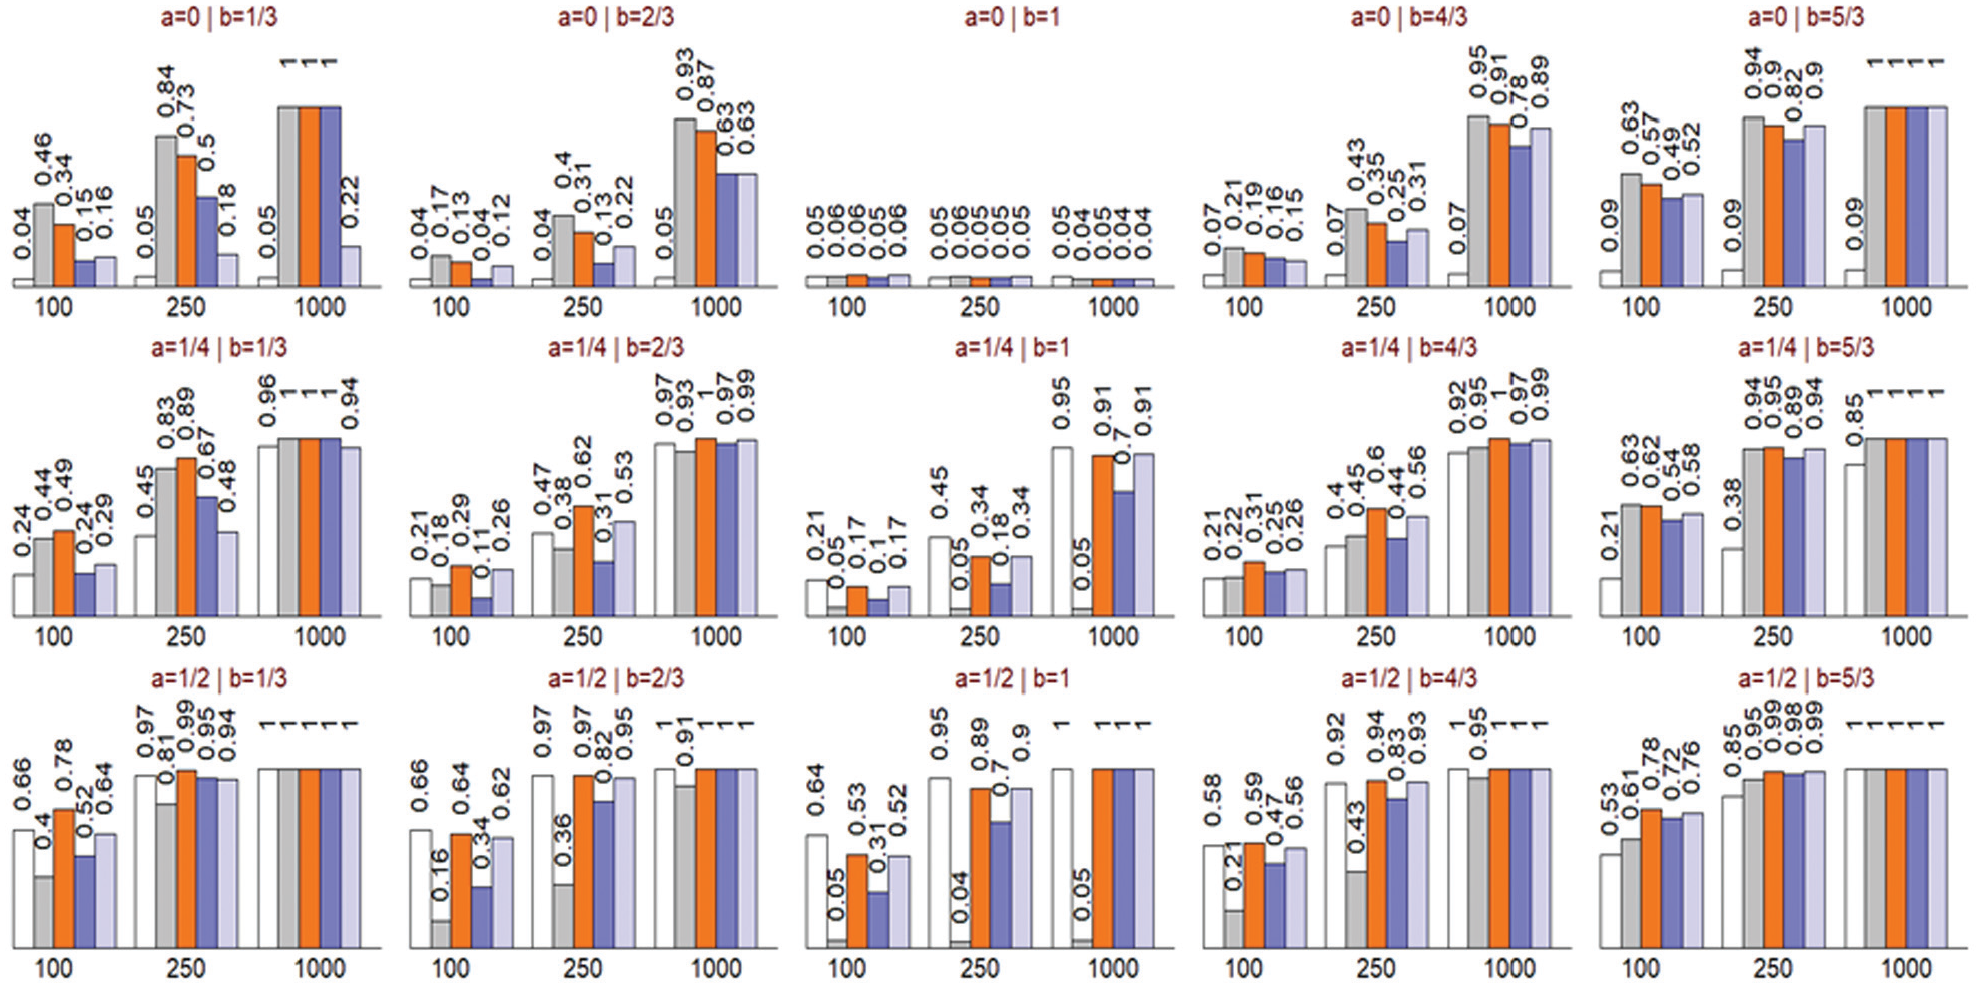
Probability of rejecting the null hypothesis for the mean calibration (white bar), receiver-operating characteristic (ROC) equality (gray bar), unified (orange bar), Hosmer-Lemeshow (dark blue bar), and likelihood ratio (light blue bar) tests. The panels positionally correspond to the calibration plots and simulation parameters presented in Figure 2. Results are based on 2,500 simulations for each scenario.
Application
Chronic obstructive pulmonary disease (COPD) is a common chronic disease of the airways. Periods of intensified disease activity, referred to as exacerbations, are an important feature of the disease. Individuals vary widely in their tendency to exacerbate. 19 Predicting who is likely to experience an exacerbation, especially a severe one that will require hospital admission, will provide opportunities for preventive interventions. 20
We used data from the MACRO 21 and STATCOPE, 22 two clinical trials in COPD patients with exacerbations as the primary outcome, to, respectively, develop and validate a risk prediction model for the occurrence of COPD exacerbations in the first 6 mo of follow-up. Baseline characteristics of both samples are provided in Table 1.
Baseline Characteristics and Outcomes for MACRO and STATCOPE Samples
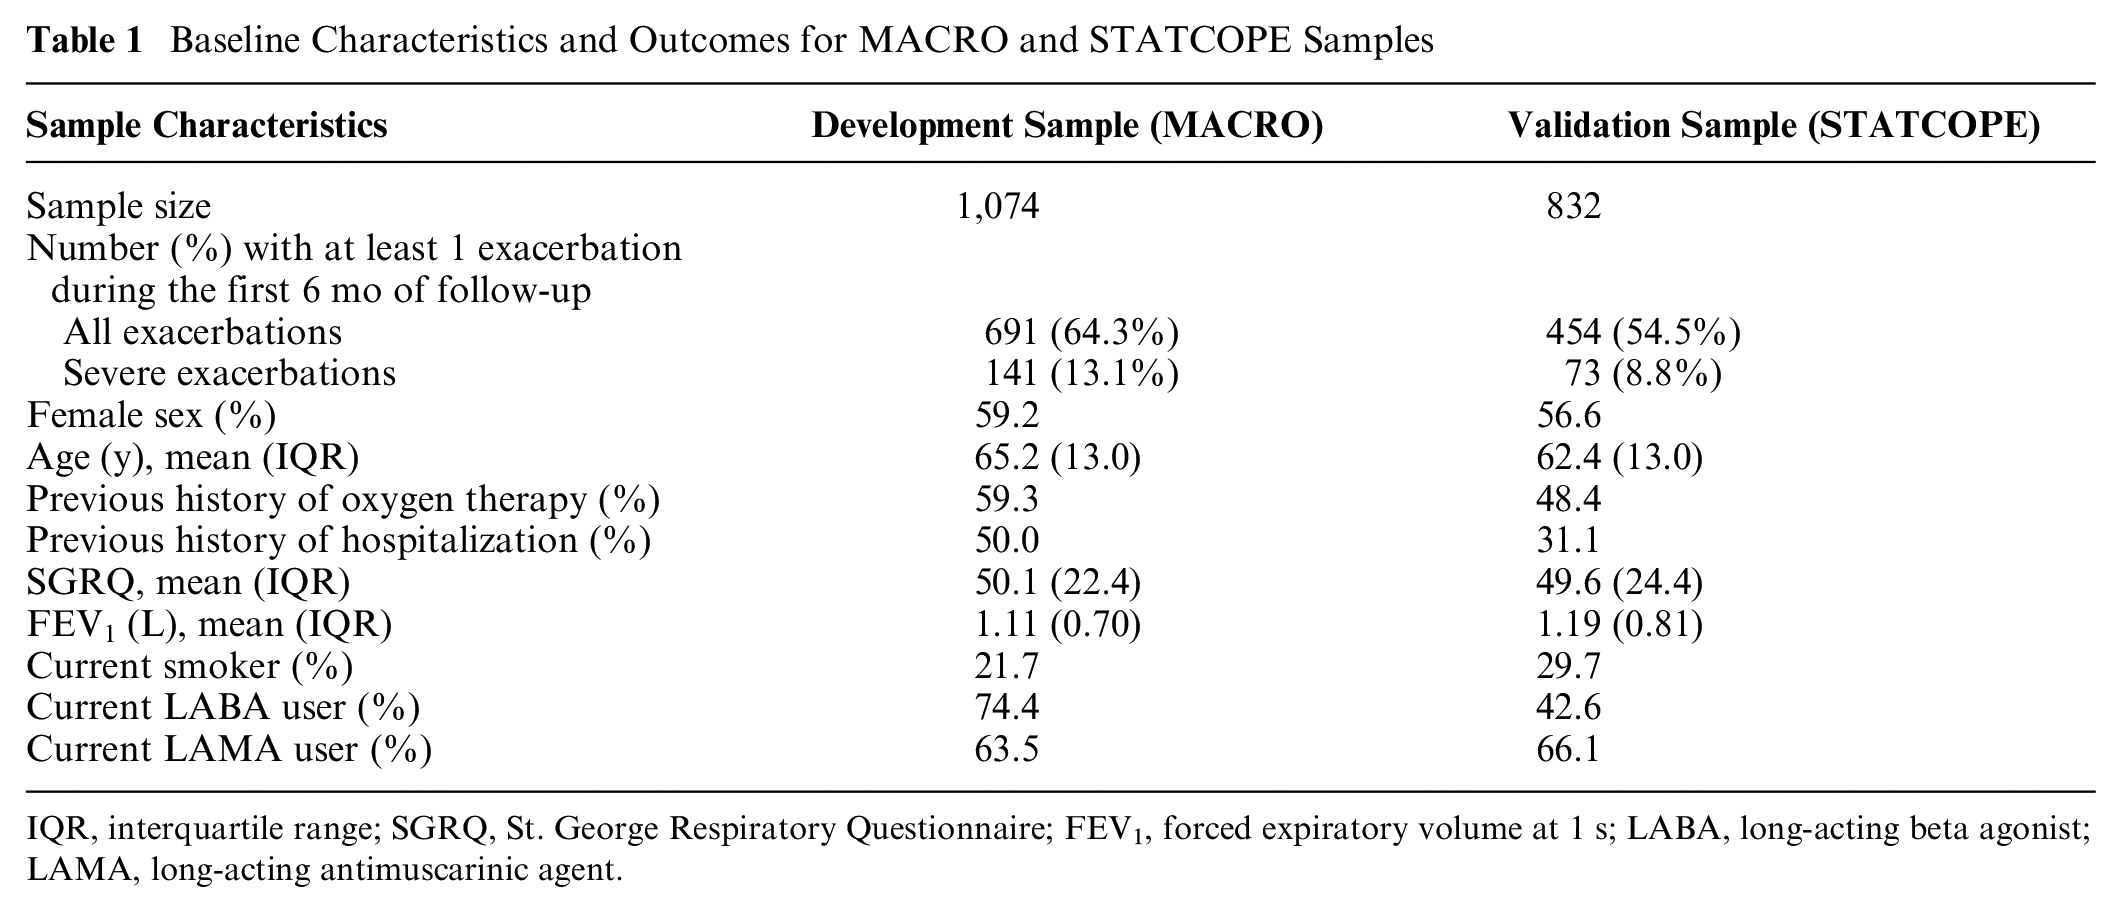
IQR, interquartile range; SGRQ, St. George Respiratory Questionnaire; FEV1, forced expiratory volume at 1 s; LABA, long-acting beta agonist; LAMA, long-acting antimuscarinic agent.
Of note, these data have previously been used for a more sophisticated prediction model. 23 Here, we focus on a simpler approach as the nuances of model development are beyond the scope of this work. We used a logistic regression model based on the data from the MACRO trial that included the predictors as listed in Table 1 based on an a priori list of covariates generated from prior knowledge of possible association with the outcome. We considered 2 outcomes: all exacerbations and severe exacerbations, and we developed 2 distinct models. The regression coefficients for both models are provided in Table 2. The study was approved by the University of British Columbia and Providence Health Research Ethics Board (H11–00786).
Regression Coefficients for the Risk Prediction Models (Based on the MACRO Sample) for All and Severe Exacerbations
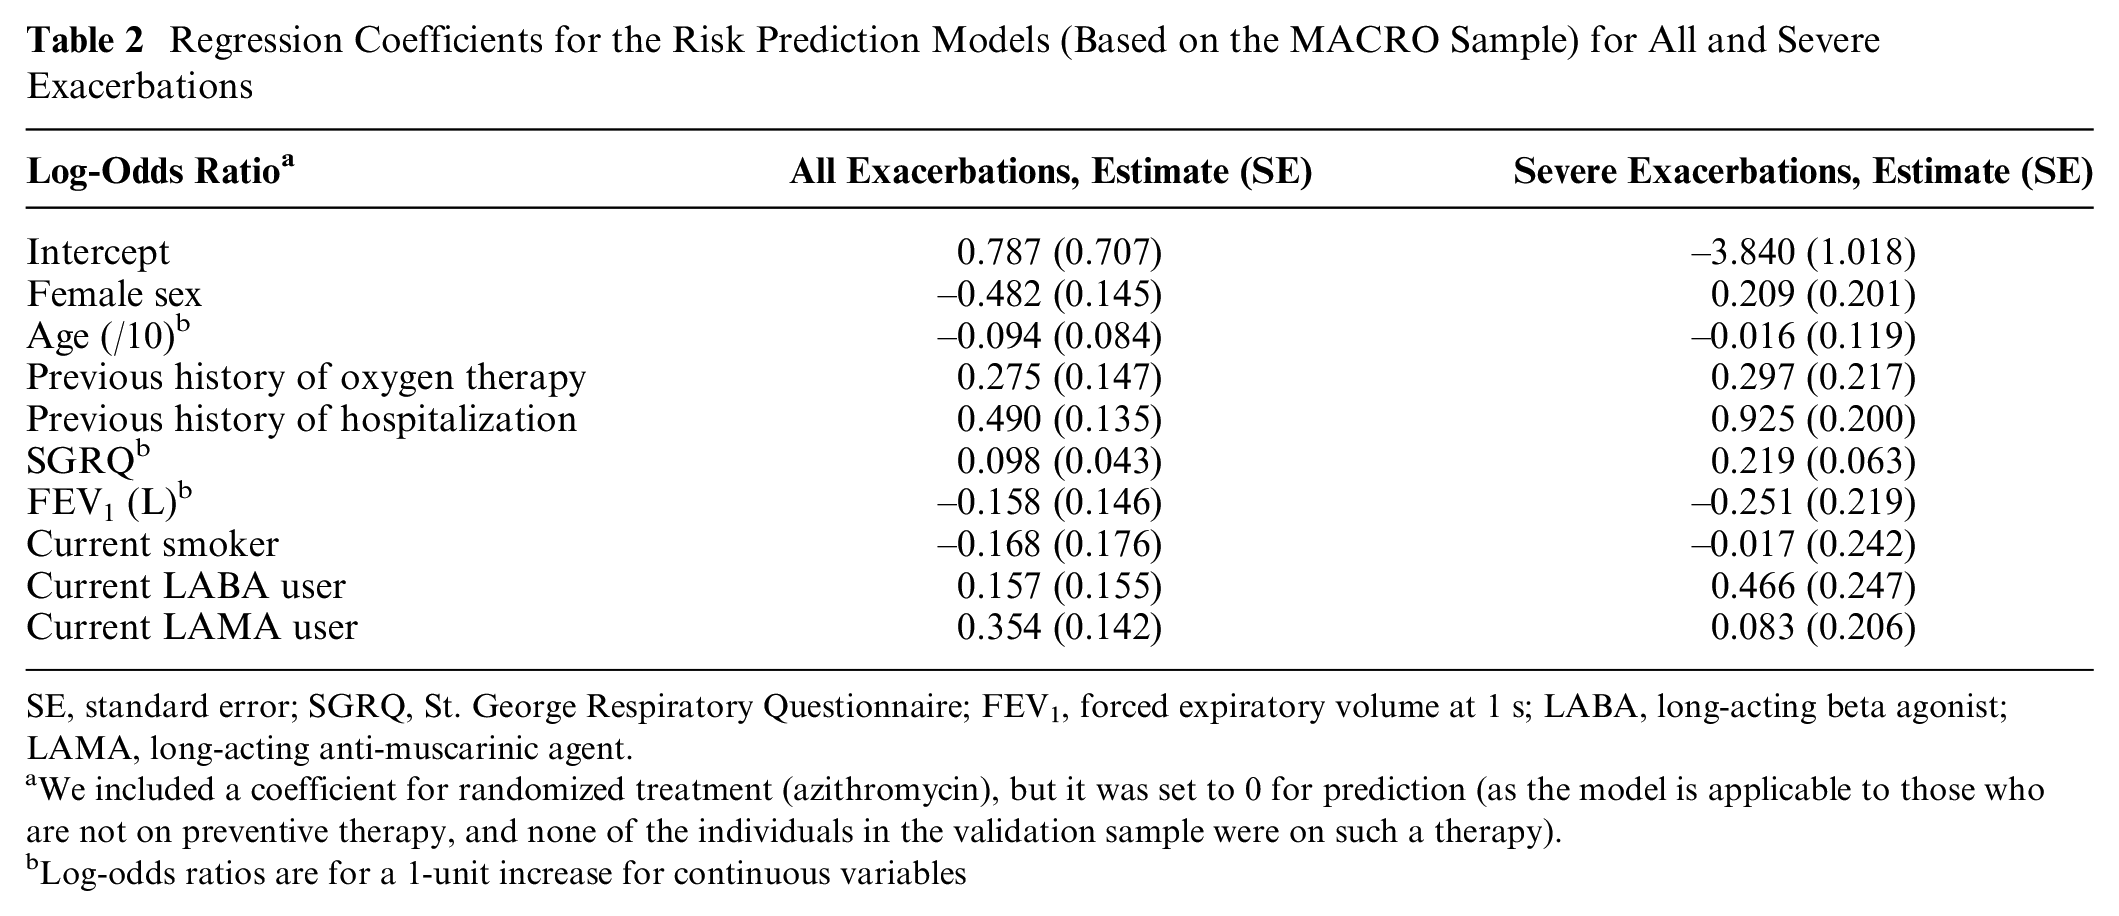
SE, standard error; SGRQ, St. George Respiratory Questionnaire; FEV1, forced expiratory volume at 1 s; LABA, long-acting beta agonist; LAMA, long-acting anti-muscarinic agent.
We included a coefficient for randomized treatment (azithromycin), but it was set to 0 for prediction (as the model is applicable to those who are not on preventive therapy, and none of the individuals in the validation sample were on such a therapy).
Log-odds ratios are for a 1-unit increase for continuous variables
Figure 5 provides the empirical ROC curve from the development sample (MACRO) as well as the empirical ROC and mROC curves from the validation sample (STATCOPE) and the calibration plot for both outcomes. For all exacerbations, the mROC curve was very close to the development empirical ROC curve but not to the external empirical ROC curve. This indicates that the reduction in the discriminatory performance of the model in the validation sample is due to miscalibration. Indeed, both components of the proposed test indicated a departure from calibration. The mean calibration test produced
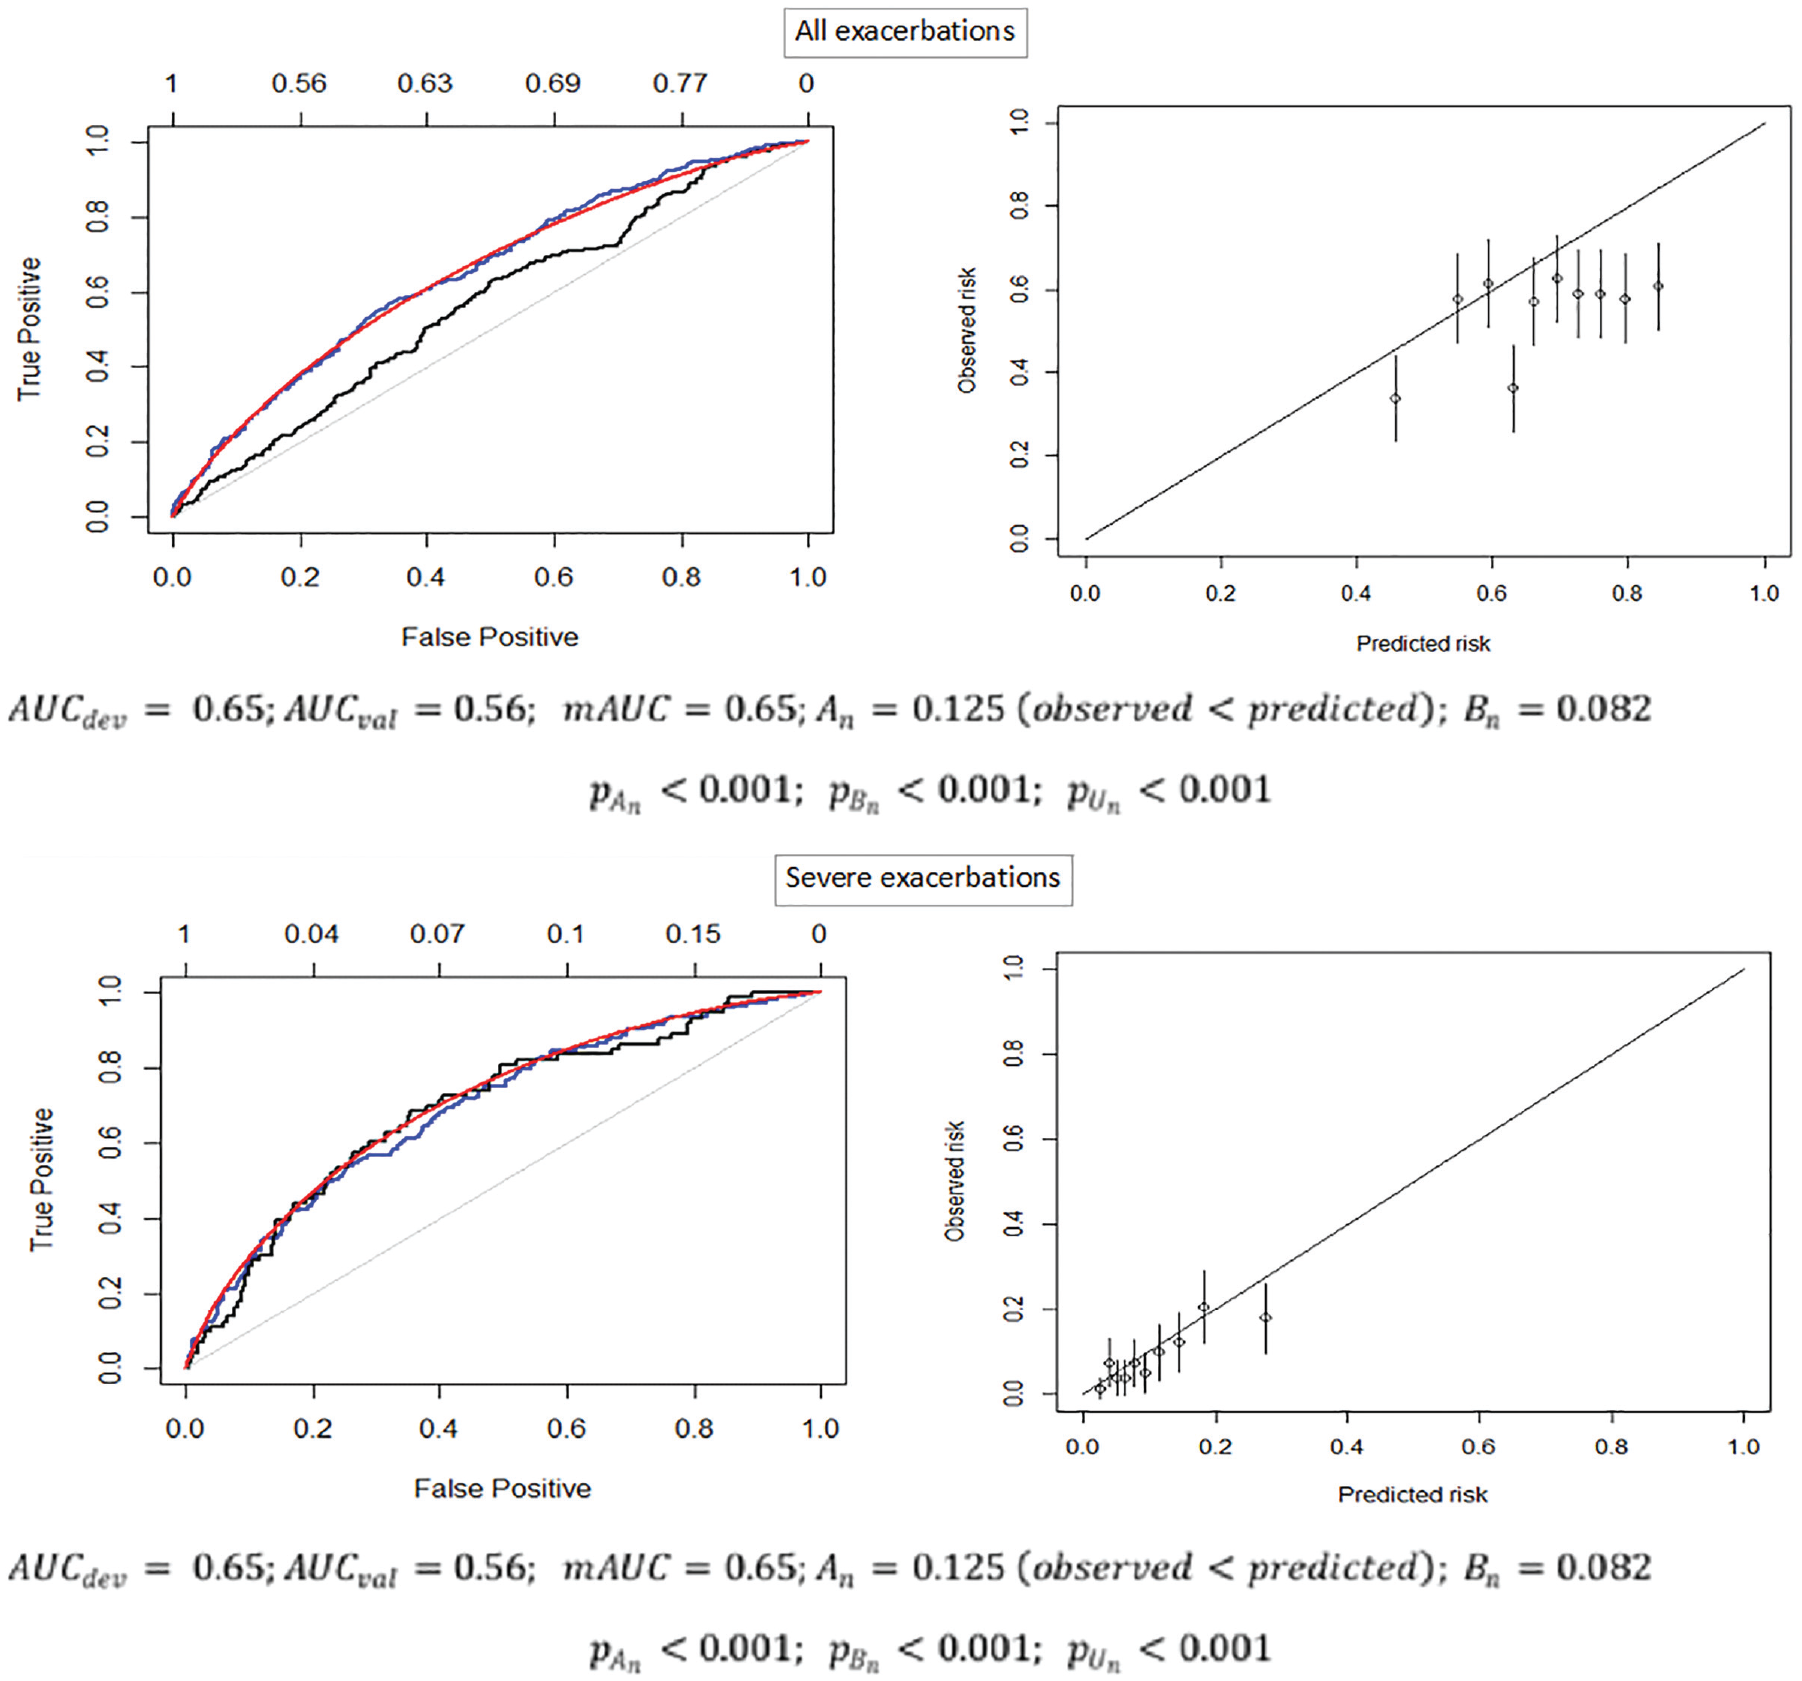
The empirical ROC curves from the MACRO development (blue) and STATCOPE validation (black) samples, the mROC curve from the STATCOPE validation sample (red; left panels), and the calibration plot (right panels). AUCdev, area under the curve (c-statistic) in the development sample; AUCval, area under the curve (c-statistic) in the validation sample; mAUC, area under the model-based ROC curve An, mean calibration statistic; Bn, ROC equality statistic; pAn): p value of the mean calibration test; p(Bn), p value for the ROC equality test; p(Un), p value of the unified test.
The model for severe exacerbations had higher discriminatory power. All 3 ROC curves were generally aligned with each other. The mean calibration test produced
Discussion
This article provides an introduction of the model-based ROC (mROC) curve, the ROC curve that should be expected if the model is at least moderately calibrated in an external validation sample. We showed that moderate calibration is a sufficient condition for the convergence of empirical ROC and mROC curves. We extended these results by proving that, together, the mean calibration and the equivalence of mROC and ROC curves in the population are sufficient conditions for the model to be moderately calibrated. To test for such equivalences within a sample, we suggested a simulation-based test. Our simulations empirically verified the postulated properties of this novel test. To the best of our knowledge, this is the first time that the ROC plot, a classical means of communicating model discrimination, has been connected to model calibration. We have implemented the proposed methodology in an R package, which is available from https://github.com/resplab/predtools/.
Previous investigators have suggested using case mix–corrected performance metrics in judging the external validation of a model. Vergouwe et al. 3 proposed a general approach for calculating different model-based metrics by simulating responses from predicted risks in the validation sample and comparing the resulting metrics with the empirical ones in the validation sample. Van Klaveren et al 5 focused on one such metric, the c-statistic, and developed closed-form estimators that would quantify the expected change in a model’s discriminative ability due to case-mix heterogeneity. Our methodology extends such work to the entire ROC curve and in doing so establishes a connection between mROC/ROC equality and model calibration that enables formal statistical inference on moderate calibration. The test that is classically associated with calibration plots is the Hosmer-Lemeshow test, which is criticized because of its sensitivity to the grouping of the data and lack of information about direction of miscalibration. 24 Our proposed test is free from arbitrary grouping of the data or the choice of smoothing factors. Given the shortcomings of the Hosmer-Lemeshow test, alternative inferential techniques for evaluating model calibration have been proposed. Allison 24 reviewed the measures of fit of logistic regression models and categorized them as indices of predictive power (such as R2) and goodness of fit. In their comprehensive review of goodness-of-fit tests for logistic models, 25 Hosmer et al. defined goodness-of-fit as the adequacy of a model on 3 fronts: the link function, the probability distribution, and the linear predictor. This is a distinctly different pursuit than examining moderate calibration. Consequently, none of the tests examined by Allison and Hosmer et al. can be considered a test for moderate calibration. Our proposed test seems to be the first alternative to the Hosmer-Lemeshow test that strictly examines moderate calibration.
These developments can be used in practice in different ways. Steyerberg and Vergouwe 14 have proposed an “ABCD” approach for external validation of a model (where A is the mean calibration; B, calibration slope; C, c-statistic; and D, decision curve analysis). 14 The B step in their approach can be replaced with the mROC’s B statistic, which, together with the A step (which is the same as the A step in the unified test), will test moderate calibration, the most desired form of calibration, as opposed to weak calibration tested via calibration slope. 10 Further, if the research involves simultaneous model development and external validation, drawing the empirical ROC curves from both samples alongside the mROC curve in the validation sample will provide visual information on the causes of difference in the performance of the model between the 2 samples (as demonstrated in our case study). Incompatibility between mROC and empirical ROC in the validation sample will rule out moderate calibration. Conversely, while agreement between the 2 curves does not rule in moderate calibration per se, it does so provided that mean calibration (calibration-in-the-large) is achieved. This visual interpretation can be augmented with formal hypothesis testing using the proposed unified statistic. Such comparisons can also be made for subgroups within the sample, although multiple hypothesis testing should be controlled for in such circumstances. Even when the investigators are not planning to produce ROC curves, the proposed test for moderate calibration can be reported independently. This can complement the scalar metrics that measure the degree of miscalibration but are not based on formal hypothesis testing, such as Harrell’s Emax, 26 Austin and Steyerberg’s Integrated Calibration Index, 27 and Van Hoorde et al.’s Estimated Calibration Index. 28
There are several ways the proposed methodology can be extended. The ROC curve has been extended to categorical 29 as well as to time-to-event data,30,31 and similar developments can also be pursued for the mROC methodology. Development of inferential methods that would not require Monte Carlo simulations can also be of potential value. As the ROC curve can be interpreted as a CDF, 11 nonparametric statistics based on the distance between CDFs can conceivably be developed to test the equivalence of mROC and ROC curves. However, the calculation of the simulation-based P value for the ROC equality test is computationally efficient (except for very large data sets). Thus, Monte Carlo error can be made smaller than the error generated from applying asymptotic methods to a finite sample. Further, although we have shown that mROC/ROC compatibility per se does not guarantee model calibration, our simulations suggest that such compatibility occurs when predicted and calibrated risks are proportional on the odds scale. As such, mROC/ROC compatibility might mean one should adjust the intercept term in a logistic regression model only to achieve moderate calibration. In this sense, our proposed approach has some similarities with the stepwise approach proposed by Vergouwe et al. 32 for examining which aspect of a risk prediction model (mean calibration, calibration slope, or individual regression coefficients) needs to be updated to improve the performance of the model in a new sample. However, our simulations were proof of concept, and this observation should be further corroborated by theoretical developments or more extensive simulations.
One of the promises of precision medicine is to empower patients in making informed decisions based on their specific risk of outcomes. 33 Basing medical decisions on miscalibrated predictions can be harmful. Our contribution is the development of mROC analysis, a simple method for separating the effect of case mix and model miscalibration on the ROC curve and for inference on model calibration. Recent arguments and counterarguments indicate that the methodological research community is divided in its opinion on the utility of ROC curves in the assessment of risk prediction models.34,35 ROC curves, however, remain a widely adopted tool among applied researchers in understanding and communicating the discriminatory performance of such models. The mROC methodology adds to the utility of ROC curves by enabling the examination of model calibration using the ROC plot. These developments can result in more attention to model calibration as an often-neglected but crucial aspect in the development of risk prediction models.
Supplemental Material
sj-docx-1-mdm-10.1177_0272989X211050909 – Supplemental material for Model-Based ROC Curve: Examining the Effect of Case Mix and Model Calibration on the ROC Plot
Supplemental material, sj-docx-1-mdm-10.1177_0272989X211050909 for Model-Based ROC Curve: Examining the Effect of Case Mix and Model Calibration on the ROC Plot by Mohsen Sadatsafavi, Paramita Saha-Chaudhuri and John Petkau in Medical Decision Making
Footnotes
Acknowledgements
We would like to thank Drs. David van Klaveren (Erasmus University and Tufts Medical Center) and Abdollah Safari (University of British Columbia) for their insightful comments on earlier drafts.
The authors declared no potential conflicts of interest with respect to the research, authorship, and/or publication of this article.
The authors disclosed receipt of the following financial support for the research, authorship, and/or publication of this article: This study was funded by a catalyst grant from The Canadian Institutes of Health Research (#155554). The funder did not have any role in any aspects of this study.
Supplemental Material
Data availability
All the computing code generating the results included in this work is publicly accessible from https://github.com/msadatsafavi/mROC/. One section of this work (“application”) relies on data from 2 clinical trials. Such data are available upon request from the COPD Clinical Research Network (![]() ). Restrictions apply to the availability of these data, which were used under license for this study.
). Restrictions apply to the availability of these data, which were used under license for this study.
References
Supplementary Material
Please find the following supplemental material available below.
For Open Access articles published under a Creative Commons License, all supplemental material carries the same license as the article it is associated with.
For non-Open Access articles published, all supplemental material carries a non-exclusive license, and permission requests for re-use of supplemental material or any part of supplemental material shall be sent directly to the copyright owner as specified in the copyright notice associated with the article.