
Abstract
Background
Few simulation models have incorporated the interplay of diabetes, obesity, and cardiovascular disease (CVD); their upstream lifestyle and biological risk factors; and their downstream effects on health disparities and economic consequences.
Methods
We developed and validated a US Diabetes, Obesity, Cardiovascular Disease Microsimulation (DOC-M) model that incorporates demographic, clinical, and lifestyle risk factors to jointly predict overall and racial-ethnic groups-specific obesity, diabetes, CVD, and cause-specific mortality for the US adult population aged 40 to 79 y at baseline. An individualized health care cost prediction model was further developed and integrated. This model incorporates nationally representative data on baseline demographics, lifestyle, health, and cause-specific mortality; dynamic changes in modifiable risk factors over time; and parameter uncertainty using probabilistic distributions. Validation analyses included assessment of 1) population-level risk calibration and 2) individual-level risk discrimination. To illustrate the application of the DOC-M model, we evaluated the long-term cost-effectiveness of a national produce prescription program.
Results
Comparing the 15-y model-predicted population risk of primary outcomes among the 2001–2002 National Health and Nutrition Examination Survey (NHANES) cohort with the observed prevalence from age-matched cross-sectional 2003–2016 NHANES cohorts, calibration performance was strong based on observed-to-expected ratio and calibration plot analysis. In most cases, Brier scores fell below 0.0004, indicating a low overall prediction error. Using the Multi-Ethnic Study of Atherosclerosis cohorts, the c-statistics for assessing individual-level risk discrimination were 0.85 to 0.88 for diabetes, 0.93 to 0.95 for obesity, 0.74 to 0.76 for CVD history, and 0.78 to 0.81 for all-cause mortality, both overall and in three racial-ethnic groups. Open-source code for the model was posted at https://github.com/food-price/DOC-M-Model-Development-and-Validation.
Conclusions
The validated DOC-M model can be used to examine health, equity, and the economic impact of health policies and interventions on behavioral and clinical risk factors for obesity, diabetes, and CVD.
Highlights
We developed a novel microsimula’tion model for obesity, diabetes, and CVD, which intersect together and – critically for prevention and treatment interventions – share common lifestyle, biologic, and demographic risk factors.
Validation analyses, including assessment of (1) population-level risk calibration and (2) individual-level risk discrimination, showed strong performance across the overall population and three major racial-ethnic groups for 6 outcomes (obesity, diabetes, CVD, and all-cause mortality, CVD- and DM-cause mortality)
This paper provides a thorough explanation and documentation of the development and validation process of a novel microsimulation model, along with the open-source code (https://github.com/food-price/ DOCM_validation) for public use, to serve as a guide for future simulation model assessments, validation, and implementation.
Introduction
Decision-analytic simulation modeling has helped advance understanding of the contributions and comparative impacts of risk factors, prevention strategies, and treatment interventions for guiding clinical and health policy decisions, for example, in public health crises such as the COVID-19 pandemic.1–3 By integrating multiple data sources, extrapolating population outcomes, and assessing critical assumptions, simulation modeling can inform health policy decision making, but most disease simulation models focus on a single disease (e.g., diabetes,4–6 hypertension, 7 coronary heart disease [CHD] and stroke,8–10 and cancers11–14). Yet, some chronic conditions often share risk factors with prognostic implications in individuals that affect overall population health. This is particularly salient for diet-related diseases, including obesity, diabetes, and cardiovascular disease (CVD), which share demographic, lifestyle, and clinical risk factors and cluster in high-risk individuals.
In addition, despite advancements in managing and treating obesity, diabetes, and CVD,15–20 individuals from racial-ethnic underrepresented populations and lower socioeconomic backgrounds remain disproportionately affected by these conditions, creating systematic preventable differences in disease burdens of disease, known as health disparities. 21 The persistent health disparities require additional data collection and analyses to understand how racial and ethnic demographic vulnerability is distributed in the population, 22 and the National Institute of Health has issued a special interest in simulation modeling and systems science to address health disparities. 23 However, many existing simulation models do not link underlying individual-level behavior with clinical risk factors and the health consequences24,25 and, in particular, have limited capability of examining distributional impact across racial-ethnic and socioeconomic subpopulations.
To address these gaps, we developed and validated a novel microsimulation model that jointly incorporates demographic, clinical, and lifestyle risk factors (e.g., diet) to project obesity, diabetes, CVD, and cause-specific mortality as interrelated health outcomes for the US population, overall and by racial-ethnic groups. We further developed and integrated an individualized health care cost prediction model. With the growing use and importance of simulation models to examine population health and disparities, this article aims to provide detailed documentation of how this model was developed and validated. We illustrate the application of our novel microsimulation model to evaluate the long-term cost-effectiveness of a national produce prescription program. We additionally provide the open-source code for public use to serve as a guide for future simulation model assessments, validation, and implementation.
Methods
Model Overview
The Diabetes, Obesity, Cardiovascular Disease Microsimulation (DOC-M) model is a probabilistic, dynamic, individual-level, health-state transition model, programmed in R-4.1.0, 26 that projects obesity, diabetes, CVD, and their associated complications for population health and health policy decision making. The DOC-M simulates individuals and their individual characteristics to project their health trajectories. For example, each simulated person in the DOC-M model could develop a health event and move to a new health state (or not) each year: no CVD or diabetes, diabetes without CVD, CVD without diabetes, both CVD and diabetes, and death, plus 4 CVD-related events (first or recurrent stroke or CHD, with an option for revascularization for each; Figure 1). The model also captures the incidence and prevalence of overweight (body mass index [BMI] ≥ 25 and <30 kg/m2) and obesity (BMI ≥30 kg/m2), based on each individual’s dynamic BMI influenced by their lifestyle behaviors and underlying secular age-sex-race/ethnicity-specific national trends. In sum, the model tracks a person’s annual likelihood of experiencing health events (e.g., developing diabetes and CVD) and death based on individual factors. The source code is freely available at https://github.com/food-price/DOC-M-Model-Development-and-Validation. Figure 2 describes major model components (i.e., modules) in the DOC-M model, explained in detail in subsequent sections along with key input parameters listed in Table 1.
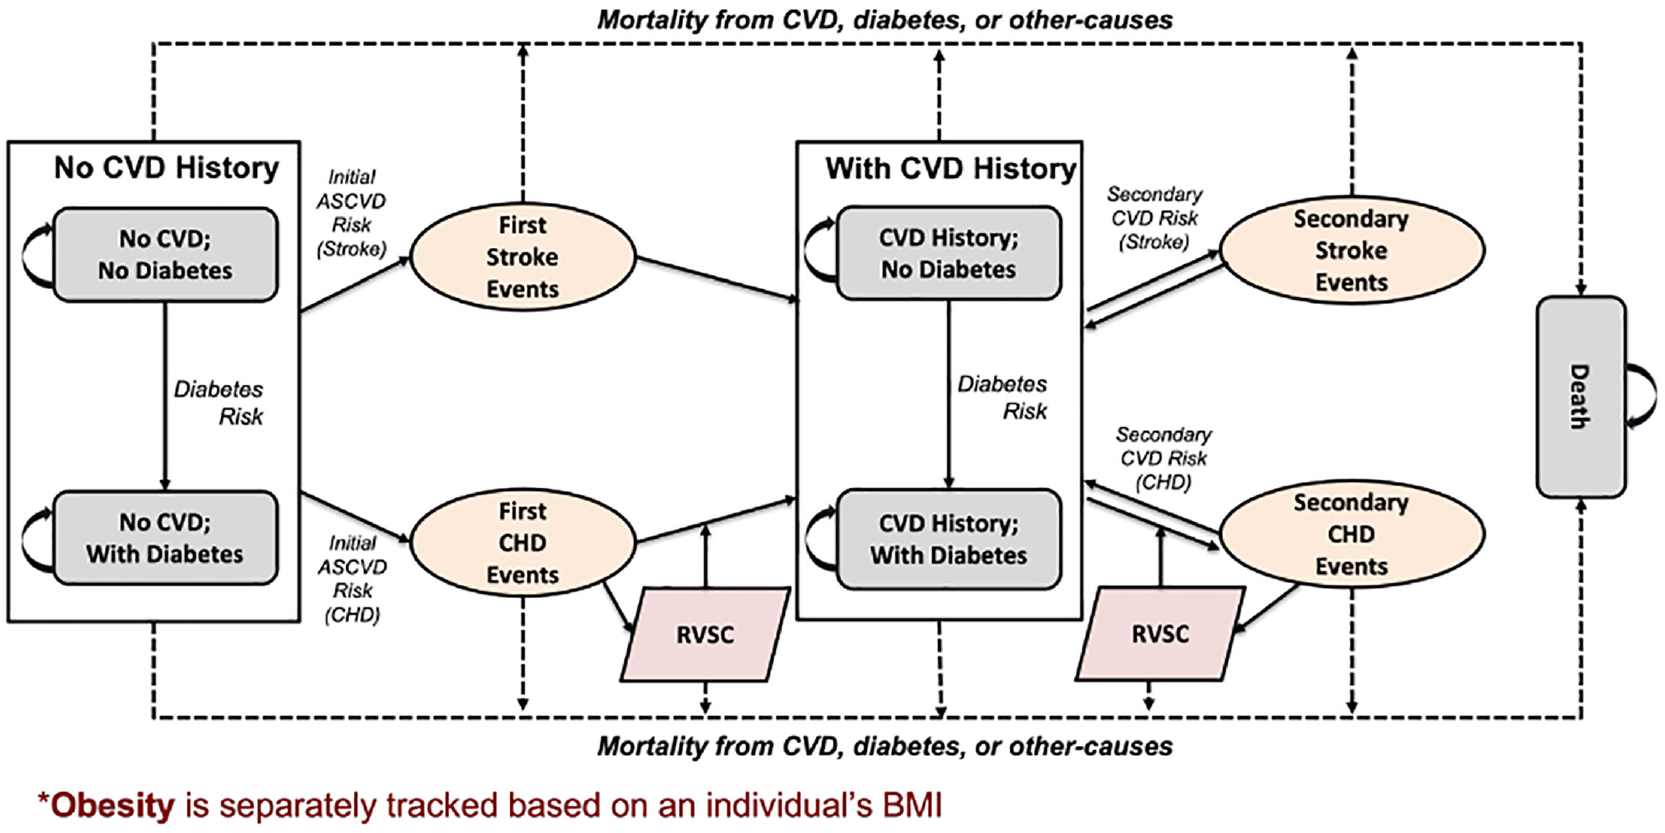
Conceptual diagram of the model structure.
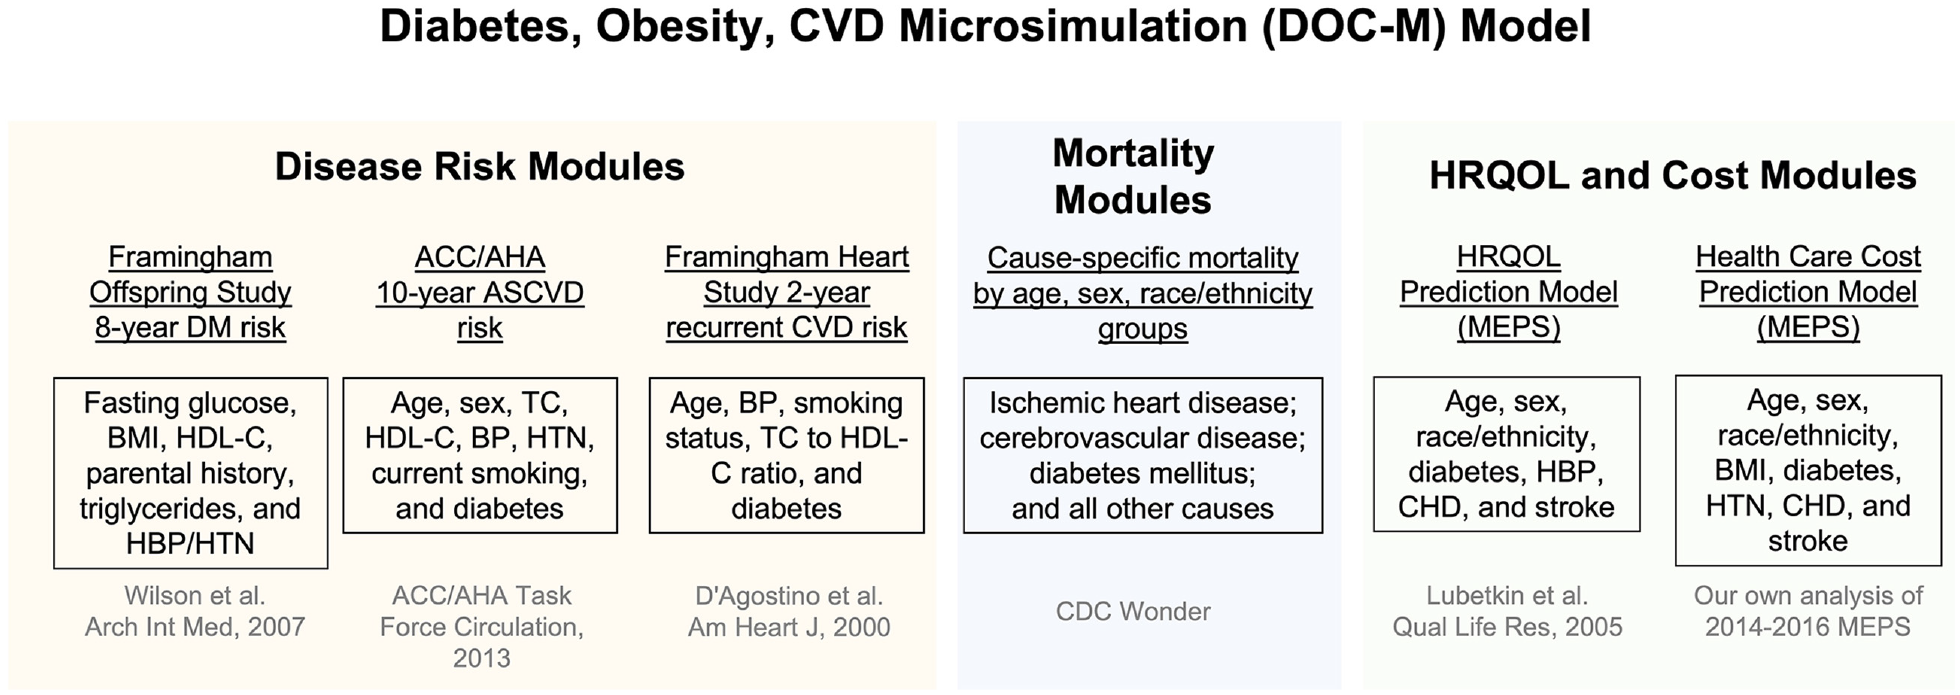
Major components of the Diabetes, Obesity, CVD Microsimulation (DOC-M) model.
Key Model Parameters and Data Sources
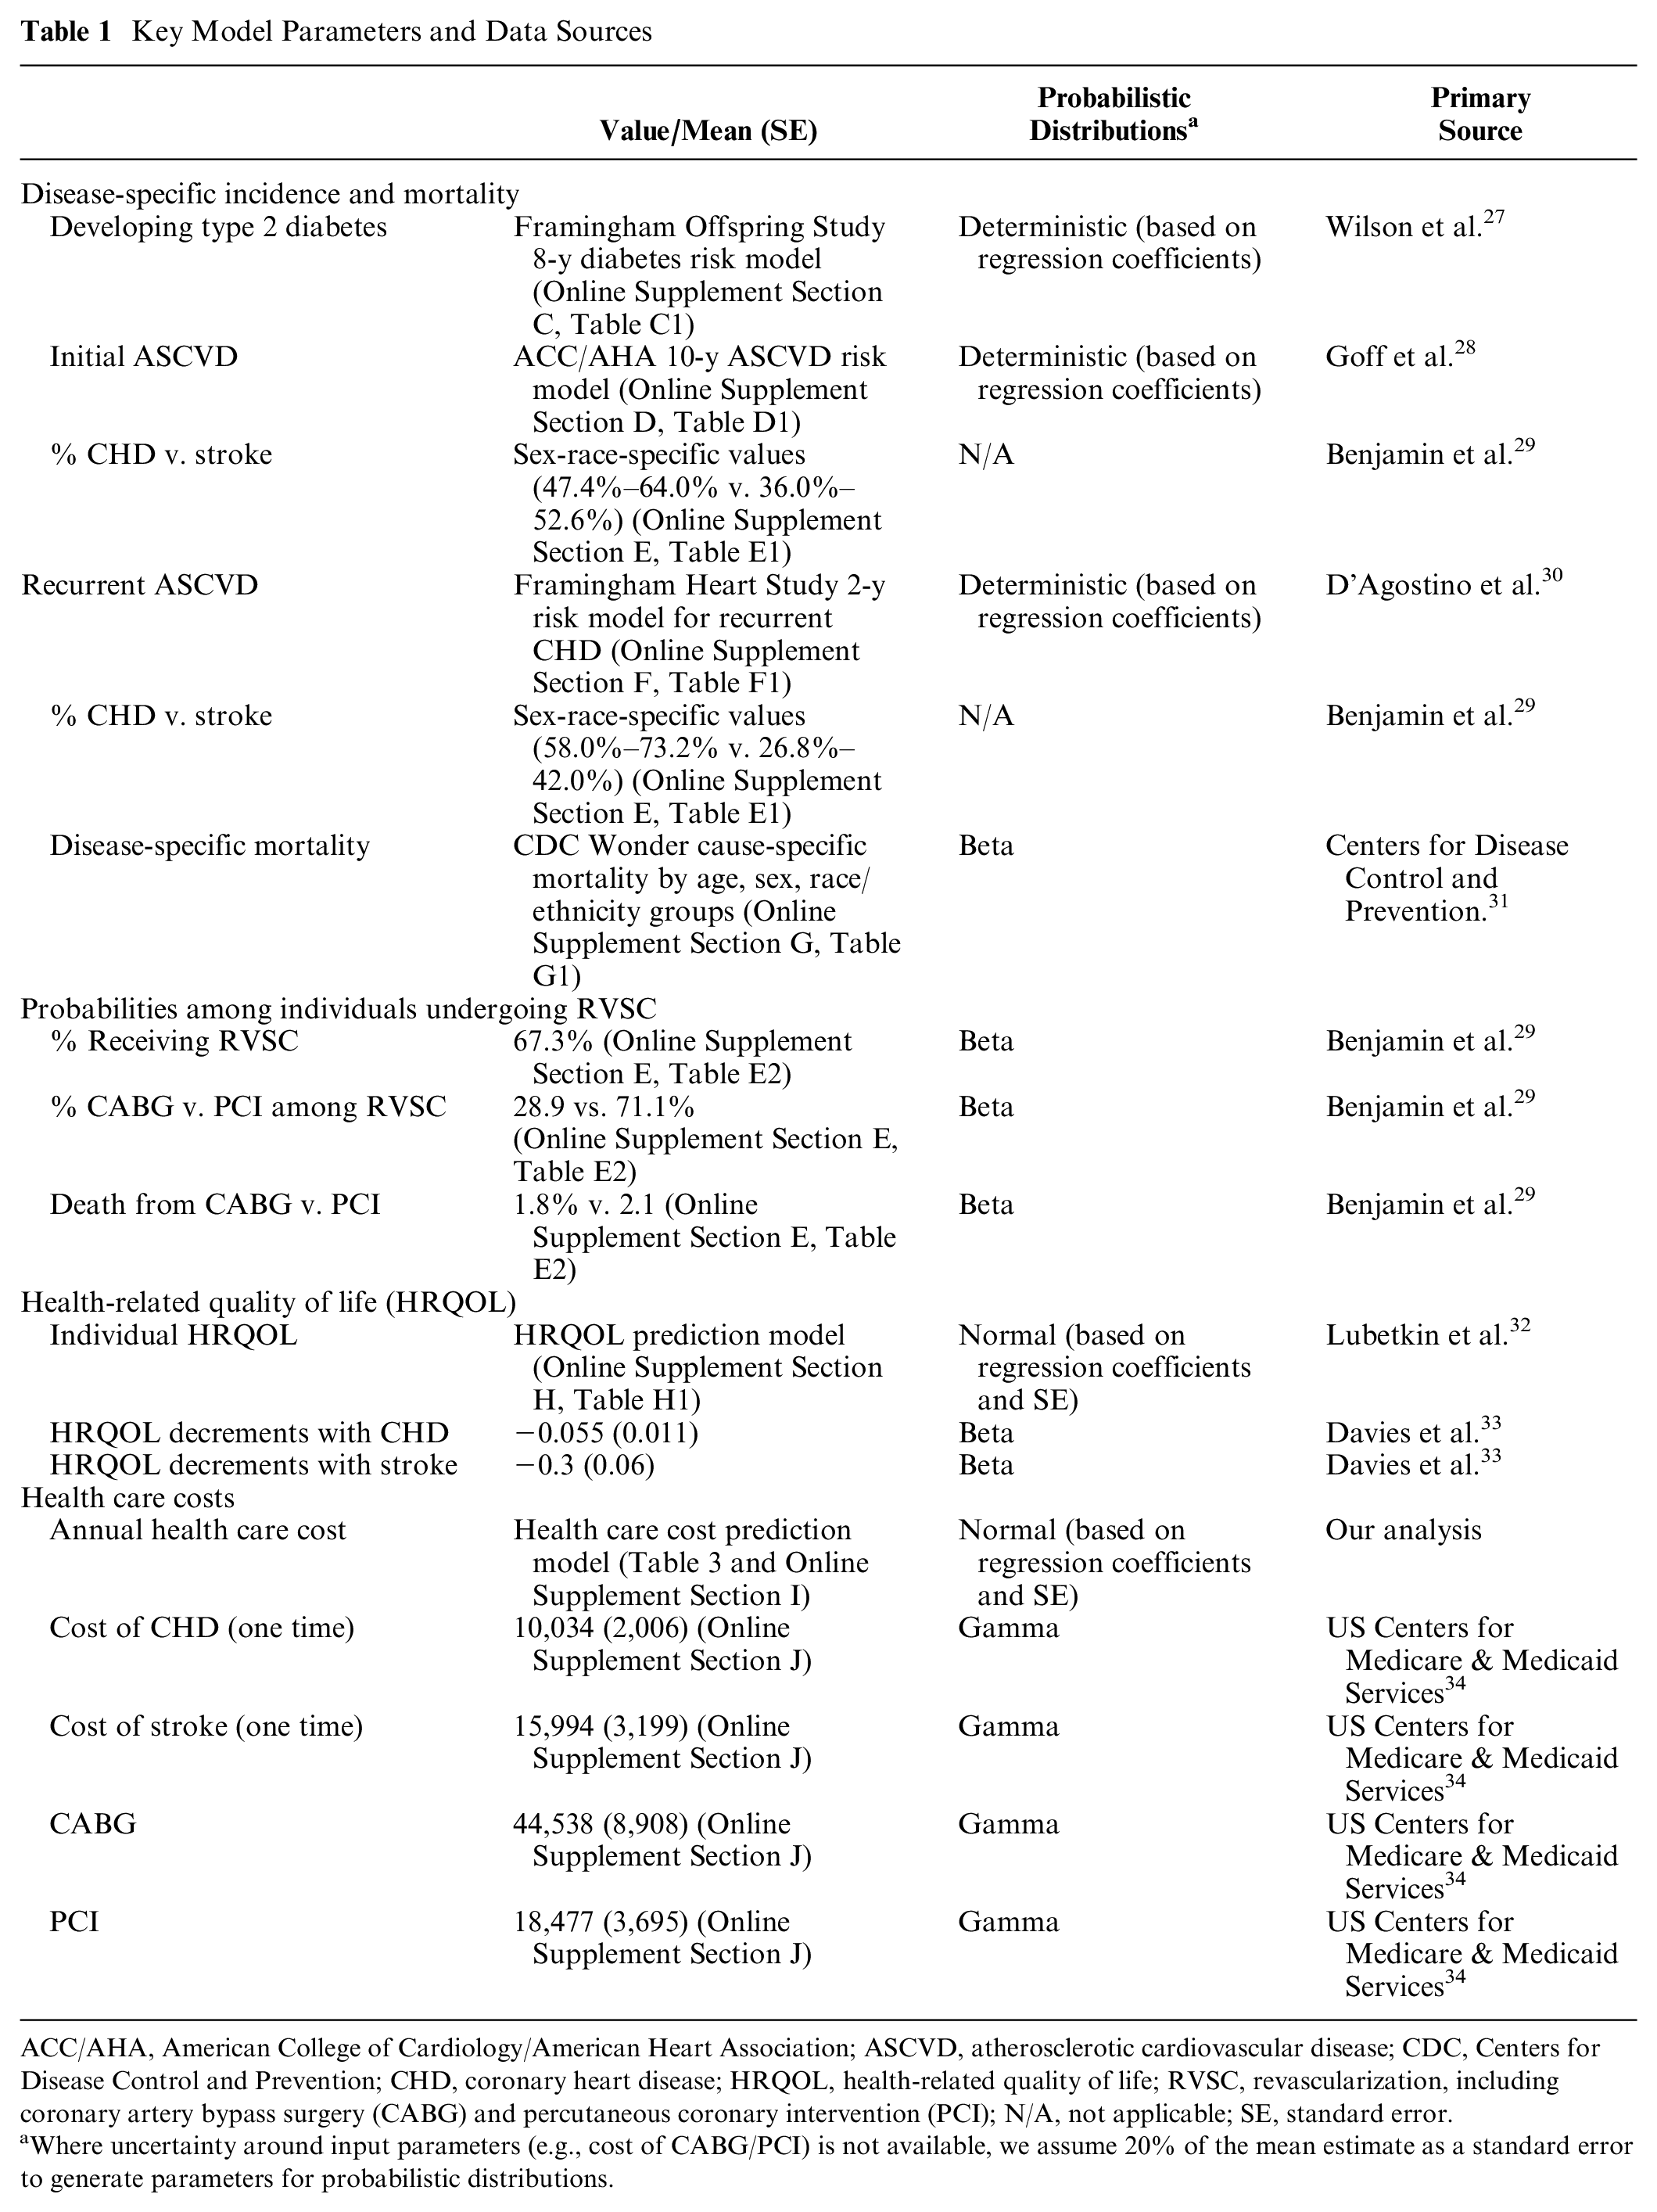
ACC/AHA, American College of Cardiology/American Heart Association; ASCVD, atherosclerotic cardiovascular disease; CDC, Centers for Disease Control and Prevention; CHD, coronary heart disease; HRQOL, health-related quality of life; RVSC, revascularization, including coronary artery bypass surgery (CABG) and percutaneous coronary intervention (PCI); N/A, not applicable; SE, standard error.
Where uncertainty around input parameters (e.g., cost of CABG/PCI) is not available, we assume 20% of the mean estimate as a standard error to generate parameters for probabilistic distributions.
Primary Data
The model is populated with individual-level data from the National Health and Nutrition Examination Survey (NHANES), which is nationally representative of the US noninstitutionalized civilian population. By appropriately weighting each simulated individual, the model provides US population estimates. At baseline, the model considers only adults aged 40 to 79 y, based on the availability of validated diabetes and CVD risk prediction models in this age range, who then age as the model propagates each year. For the purpose of model validation, the DOC-M model used a closed cohort design, although open cohorts (i.e., new 40-y-olds entering each year) are also possible. The NHANES data sets, available in their current form since 1999, include detailed information on self-reported sociodemographics (e.g., age, sex, race and ethnicity, income, education), self-reported baseline health conditions, lifestyle risk factors (e.g., diet, physical activity, adiposity, and smoking), and clinical risk factors from physical examination, laboratory measures, and health and medication questionnaires. 35 Because the NHANES contains a single variable, including race and ethnicity constructs, we use the term race/ethnicity for this study. Based on survey participants’ responses on race/ethnicity categories, we classified individuals into 4 categories: non-Hispanic White, non-Hispanic Black, Hispanic (including Mexican American and other Hispanic), and others (including non-Hispanic Asian and multiracial individuals). Missing data (generally ∼10% for the relevant variables) were handled using multiple imputations, generating 10 sets of imputed values assuming data missing at random.
Obesity and Cardiometabolic Risk Factors
From each individual in the NHANES data, BMI was calculated from measured height and weight. Systolic/diastolic blood pressure was measured by averaging multiple readings from a single visit (available up to 4 readings). 36 Fasting glucose and total blood cholesterol data were measured at the NHANES mobile exam center. Diabetes was defined from self-report or any 1 of 4 clinical criteria (i.e., fasting plasma glucose ≥ 126 mg/dL, 2-h postprandial plasma glucose ≥ 200 mg/dL, hemoglobin A1c ≥ 6.5%, or use of diabetic medications). 37 A prior history of CVD was based on self-reported history of stroke, heart attack, and CHD. Angina was defined based on the Rose questionnaire criteria or the use of anti-angina medications. 38 Online Supplement Section A provides additional details in defining diabetes and CVD history from NHANES data.
In addition, the DOC-M estimated and incorporated temporal population trends (instead of static risk factor distributions) at the individual level for BMI and 5 other major cardiometabolic risk factors, including systolic and diastolic blood pressure (SBP, DBP), fasting glucose, total cholesterol, high-density lipoprotein cholesterol (HDL-C), and triglycerides. Using NHANES data from 1999 to 2016, we estimated the average annual percentage change in these risk factors to project future trends in 16 population subgroups, jointly stratified by age (40–59, 60–79 y), sex (male and female), and race/ethnicity (non-Hispanic White, non-Hispanic Black, Hispanic, and others)14,39,40 (Online Supplement Section B). These risk factors were selected based on their use in validated risk prediction models for diabetes and CVD (Figure 2).
Disease Risk Modules
The DOC-M model applied 3 separate US-based validated risk prediction models for the incidence of diabetes, initial CVD events, and recurrent CVD events. The risk of incident diabetes was estimated using the Framingham Offspring Study 8-y risk prediction model based on the following predictors: fasting glucose, BMI, HDL-C (<40 mg/dL in men, 50 mg/dL in women), triglycerides, SBP (≥ 130/85 mm Hg) or treatment for hypertension, and parental history of diabetes 27 (Online Supplement Section C). During the initial calibration process (see the “Model Validation and Calibration” section), we recognized that the demographic population of the Framingham Offspring Study diabetes model was 99% of non-Hispanic Whites. 27 Thus, we calibrated the risk of diabetes for non-Hispanic Black and Hispanic adults because of their known higher risks for developing diabetes. 41 Based on a US-based prospective cohort study, the model inflates diabetes incidence 2.4-fold higher in non-Hispanic Black and Hispanic women and 1.5-fold higher in non-Hispanic Black and Hispanic men. 42 In a sensitivity analysis, we also examined diabetes prediction using the Atherosclerosis Risk in Communities (ARIC) study (the model with clinical variables plus fasting glucose and lipid). 43
The risk of a first atherosclerotic cardiovascular disease (ASCVD) event was estimated using the American College of Cardiology/American Heart Association (ACC/AHA) 10-y ASCVD risk equation, which provides sex- and racial-ethnic–specific risk calculations 28 based on 8 risk predictors: age, sex, total cholesterol, HDL-C, SBP, hypertension treatment, smoker status, and diabetes. We then stratified the risk of ASCVD into stroke and CHD risk using the estimated sex-race-specific proportions of incident cases of each 29 (Online Supplement Sections D and E). Finally, for recurrent ASCVD, we applied the Framingham Heart Study coronary risk model, which provides sex-specific 2-y risk models for recurrent CHD events for persons with CVD history based on age, SBP, smoking status, fasting cholesterol level, and diabetes 30 (Online Supplement Section F).
For each individual in the microsimulation model, their unique distribution of characteristics and risk factors was used to predict their annualized future risks of diabetes, initial ASCVD, recurrent ASCVD (among those with prior nonfatal ASCVD), and death, using the above risk models. Individual characteristics and corresponding disease risk were updated over time to reflect aging and changes in risk factors based on temporal population trends, with reestimation of individual annualized risk of initial ASCVD, diabetes, and recurrent ASCVD every 10, 8, and 2 y, respectively (or when an intervention occurred, for models evaluating an intervention). Each individual’s multiyear risk was converted into an annual event-specific probability. 44
Mortality Modules
We extracted the average US national cause-specific mortality between 2012 and 2016 from CDC Wonder, 31 which collects a single underlying cause of death and demographic data for US residents based on death certificates, and stratified the mortality data jointly by 5-y age groups, sex, and 4 race-ethnicity groups. Cause-specific mortality was defined using ICD-10-CM diagnosis codes for CVD-specific mortality (I20-125: ischemic heart disease [IHD], I60-I69: cerebrovascular disease) and diabetes-specific mortality (E10-I14: diabetes mellitus). All other-cause mortality represents death from non-CVD and non–diabetes-related mortality. In each year, other-cause mortality rates from CDC Wonder also held constant at their 2012 to 2016 averages are applied to individuals who are not predicted to have diabetes or CVD in that year. We adjusted the overall cause-specific mortality for a given age, sex, and race/ethnicity to cause-specific mortality conditional on disease status, with annual rates per 100,000 converted to annual probabilities (Online Supplement Section G, Table G1).
Our model assumes that all cause-specific mortalities (IHD, stroke, and diabetes) were applied to only those with conditions (CVD history, first or recurrent CVD, and diabetes), instead of the general population. Because there are no available public data on the age-sex-race–specific CVD/diabetes mellitus death rate conditional on CVD history or diabetes, we applied Bayes rule to adjust the overall cause-specific mortality to cause-specific mortality conditional on disease status for each population subgroup i, jointly defined by age, sex, and race/ethnicity.
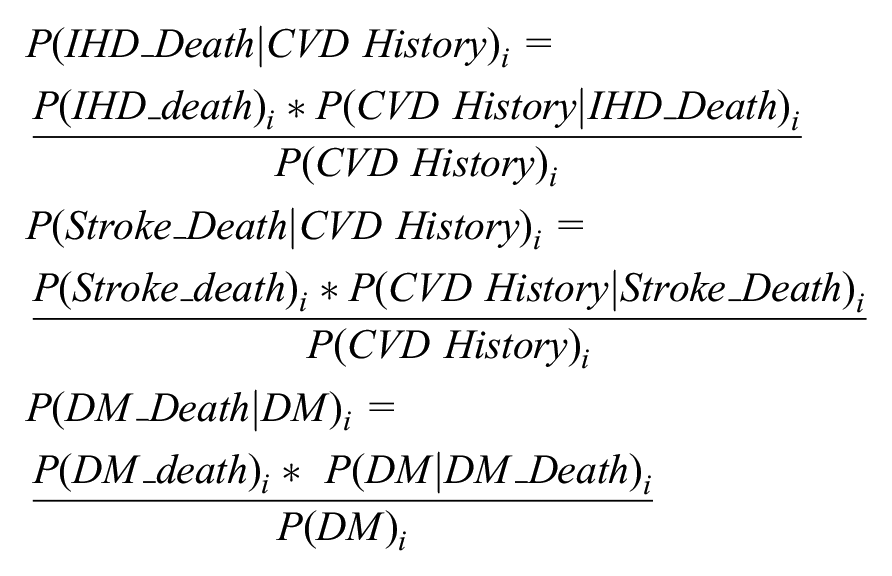
where we assume that
Finally, we also examined historical trends in CVD mortality from 1999 to 2016. We observed decreasing CVD mortality across all 4 of these subgroups (non-Hispanic Black females, non-Hispanic Black males, non-Hispanic White females, and non-Hispanic White males) over time, particularly for the older subpopulation, aged 75 to 79 y (Online Supplement Section G, Figures G1 and G2). A prior study found that half of the decline in CVD-related mortality between 1980 and 2000 may be attributable to reductions in major risk factors with the other half due to treatment advances. 45 However, our analyses found that the downward slopes have plateaued since 2010, and our model assumed that mortality remains constant. The assumption indicates that, as our model incorporated trends in risk factors, future mortality trends depend only on changes in risk factors, not technological advances.
Health-Related Quality of Life and Costs Modules
Health-related quality of life (HRQOL) was measured based on established patient-based estimates of how changes in health status alter the quality of life, from a scale of 0.0 (death) to 1.0 (perfect health). 46 The DOC-M model incorporated a previously developed HRQOL prediction model for the US nationally representative sample based on demographic, socioeconomic, and chronic disease factors 32 (Online Supplement Section H). Our model also incorporated event-specific short-term decrements in HRQOL for individuals experiencing an acute CHD (−0.055 or loss of 20 healthy days) or stroke (−0.3 or loss of 110 healthy days) in a given year. 33
Health care costs were derived from the US nationally representative 2014 to 2016 Medical Panel Expenditure Survey (MEPS) data (n = 73,174, representing 244.4 million US adults aged 18 y and older after accounting for MEPS sampling weights), a major data source on health care utilization and associated costs among the noninstitutionalized US population. 47 We modeled annual health care costs for each individual in the DOC-M based on age, sex, race/ethnicity, BMI (continuous), and diet-related clinical conditions, including diabetes, hypertension, and history of CVD. After multiple goodness-of-fit testing,48–50 we applied a 2-part model with a logit model in the first stage to estimate the probability of incurring any health care expenditures, followed by a generalized linear model with a log link and a gamma distribution to model health care expenditures among those having any expenditure. 51 MEPS survey design and weights were applied to derive nationally representative cost estimates (Online Supplement Section I).
The resulting cost model estimated average marginal effects to predict the incremental change in health care expenditures for each predictor. 52 Using the marginal effects estimates and changes in each individual’s demographic and health profile over time, the DOC-M model predicted an individual’s annual health care expenditures. In addition, for event and procedure-specific costs, we estimated weighted-average total payments based on the number of total discharges across relevant diagnosis-related groups from the Medicare Inpatient Prospective Payment data 34 (Online Supplement Section J). All costs were expressed in 2017 U.S. dollars and the Personal Health Care index was used to adjust total medical expenditures for inflation. These annual health care costs were estimated in STATA 16 53 and integrated into the main DOC-M model.
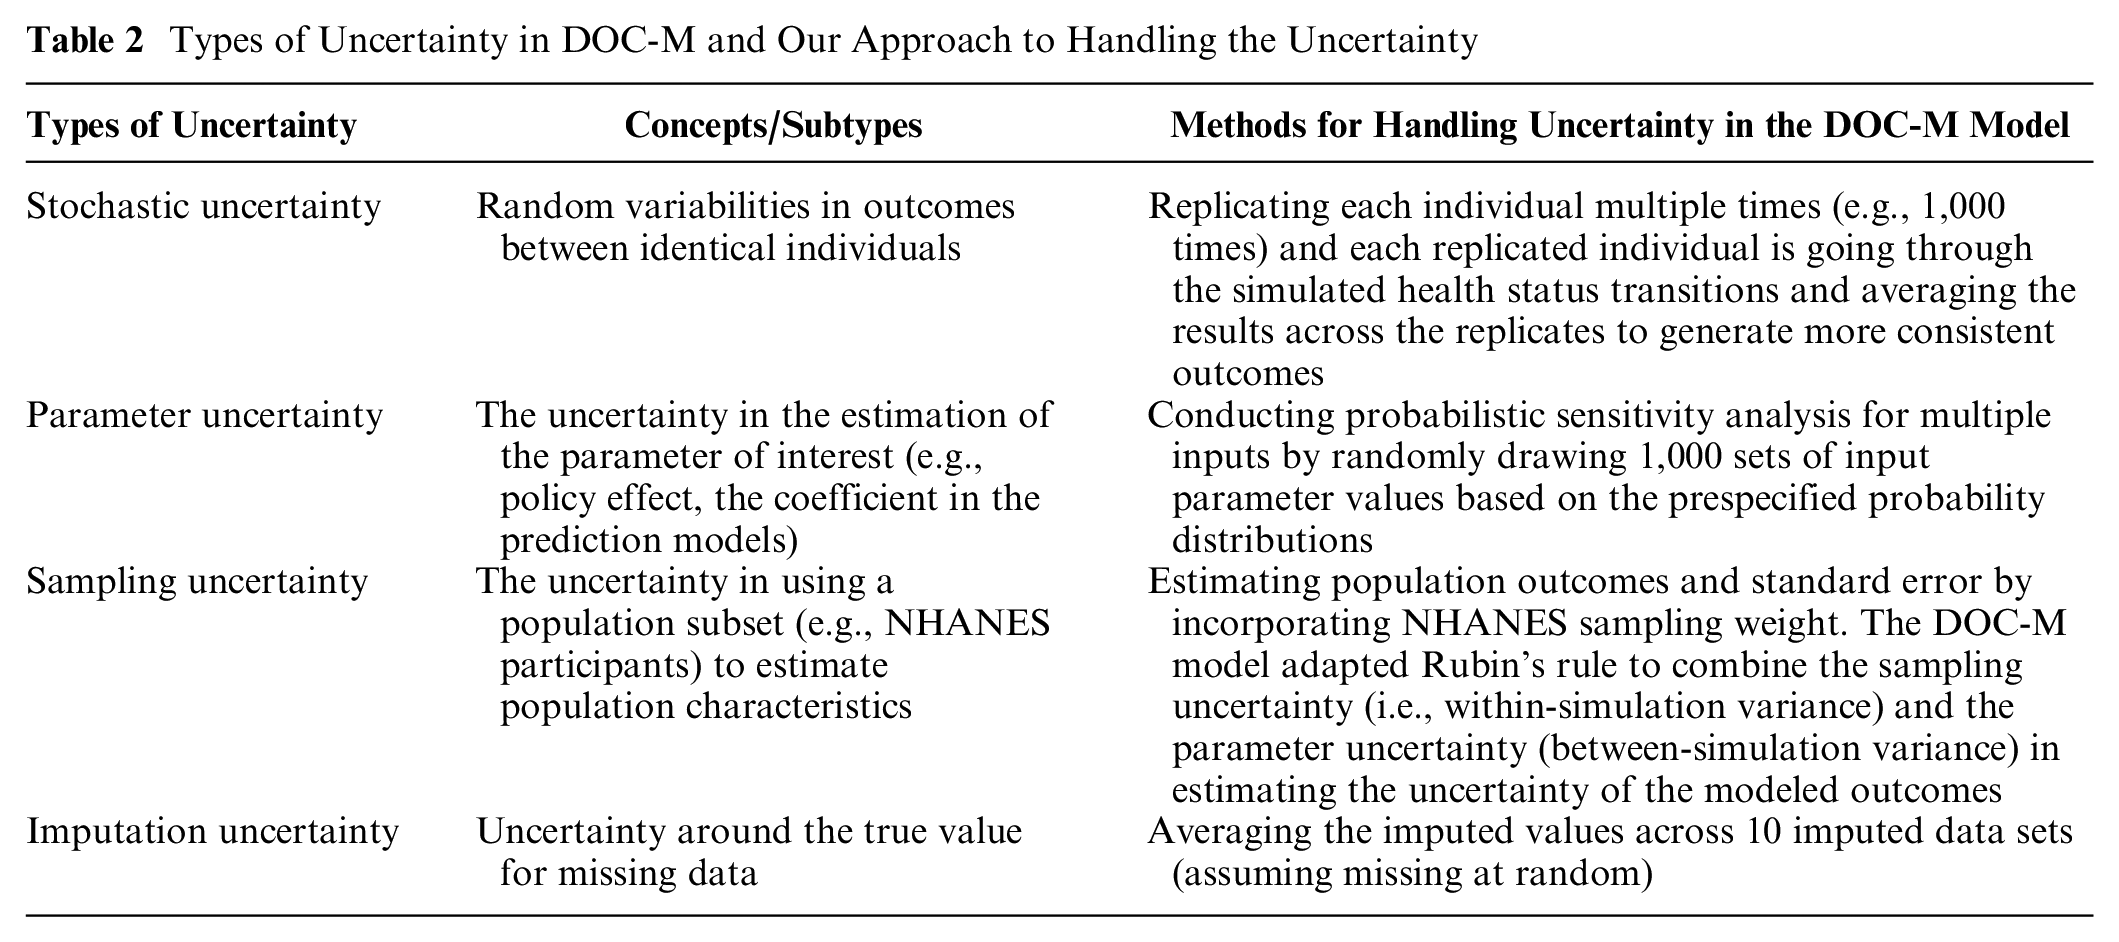
Handling Multiple Levels of Uncertainty
The DOC-M model deals with multiple levels of uncertainty, including stochastic, parameter, and sampling uncertainty. To minimize the impact of stochastic uncertainty, the DOC-M model can replicate each individual multiple times (e.g., 1,000 times) and average the results across the replications. Parameter uncertainty for input parameters is jointly incorporated by randomly drawing 1,000 sets of input parameters based on their probabilistic distribution, using 1,000 Monte Carlo simulations for each replicated individual. For example, with 1,000 individual replicates, the model could generate 1 million runs per person (=1,000 individual replicates × 1,000 simulations). Sampling uncertainty incorporated the sampling weights to estimate population outcomes and standard errors. Finally, the model combines within-simulation variance (i.e., sampling uncertainty) and between-simulation variance (i.e., parameter uncertainty) using an adaptation of Rubin’s rule to reflect integrated uncertainty in modeled outcomes.54,55 Table 2 summarizes our approach with technical details in Online Supplement Section K.
Types of Uncertainty in DOC-M and Our Approach to Handling the Uncertainty
Model Validation and Calibration
Based on a methodology report on modeling and simulation in the context of the health technology assessment, 56 we defined model calibration as “the process of determining the parameter values so that model outputs match observed empirical data” and model validation as “the process of comparing model outputs with expert judgment, observed data, or other models, without further modification of model parameters.” Through multiple iterations of model development and pressure testing, we verified the correctness of the mathematical structure and the implementation of the computational model (i.e., internal consistency). We conducted validation analyses in 2 ways, assessing 1) population-level risk calibration (i.e., comparing projected v. observed prevalence of risk factors and outcomes) and 2) individual-level risk discrimination (i.e., comparing projected v. observed occurrence of individual events) for 4 primary outcomes: obesity, diabetes, ASCVD, and all-cause mortality. Validation was done for the overall US adult population and 3 racial-ethnic groups (non-Hispanic white, non-Hispanic black, and Hispanic adults). Asians and other racial-ethnic minorities were excluded due to small sample sizes in NHANES data.
Population-risk calibration
After initial adjustment for higher risks of developing diabetes among Non-Hispanic Black and Hispanic individuals (see the “Disease Risk Module” section), we assessed population-level risk calibration by comparing the 15-y model-predicted population risk of primary outcomes among the 2001–2002 NHANES cohort aged 40 to 79 y (n = 2,944, representing 110.3 million US adults aged 40 to 79 y after accounting for NHANES sampling weights) with the observed prevalence of these outcomes in the age-matched population at each NHANES cycle from 2003 to 2016. The observed-to-expected ratio assessed whether predictions were systematically too low or too high (i.e., specifically whether the 95% confidence interval of observed outcomes included the mean predicted outcomes at year 15), and calibration plot analysis assessed whether statistically significant differences were identified from a slope of the calibration plot = 1 and intercept = 0, respectively.57–59 A slope significantly smaller than 1 reflects overprediction, handled with corresponding calibration (shrinkage) of regression coefficients or parameters of interest. In contrast, a slope larger than 1 reflects underprediction, calibrated with an augmentation. 57 Figure 3 provides a schematic diagram of our calibration process. In our methodologic development, for example, the ACC/AHA ASCVD model was found to overpredict CVD mortality among non-Hispanic Black adults (slope = 0.5502, intercept = 0.0024), which after calibration nearly perfectly predicted the observed outcome (Online Supplement Section L). Finally, we used the Brier score—the mean of squared differences between those predictions and their corresponding observed values—to summarize the overall prediction error, along with root mean square error. 60
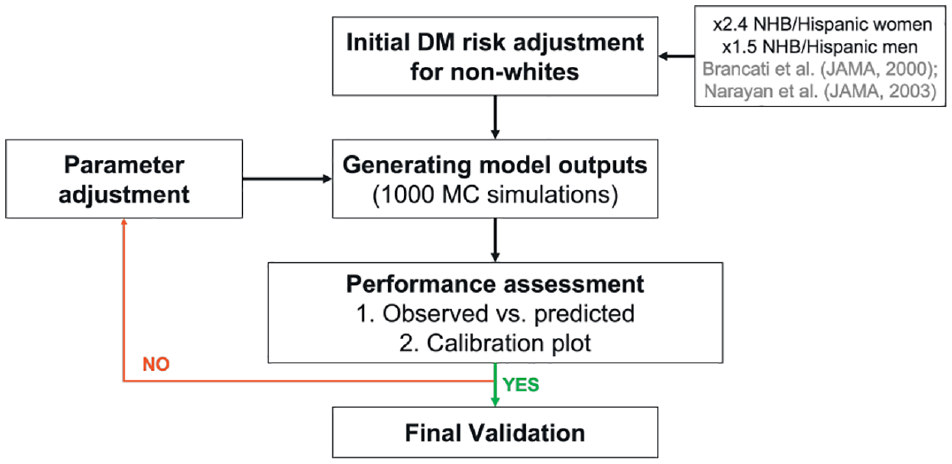
A schematic diagram of our calibration process.
Individual-risk discrimination
For additional validation, we assessed individual risk discrimination (i.e., how well the model differentiated individuals who developed diabetes, obesity, or CVD and eventually died in the Multi-Ethnic Study of Atherosclerosis (MESA) prospective cohort (data access through the NHLBI Biologic Specimen and Data Repository Information Coordinating Center). We selected MESA because it is a prospective cohort study of understanding CVD and associated risk factors among a racial-ethnic diverse, population-based sample of 6,814 asymptomatic men and women aged 45 to 84 y at baseline. Approximately 38% of the recruited participants self-identified as non-Hispanic White adults, 28% as African American, 22% as Hispanic, and 12% as Asian (note: this is the original classification according to the MESA cohort data). 61 Using MESA baseline data from 2000 to 2002, we first estimated individual predicted risk based on the proportion of simulations (out of 1,000) in which a given individual was predicted to experience obesity and diabetes at year 9 (as the data were not available beyond year 9) and CVD and all-cause mortality at year 14. Then, based on observed, individual-level events documented through follow-up, we assessed risk discrimination with receiver-operating characteristics (ROC) curves 8 and the c-statistic (i.e., area under the ROC curve). 62 We considered models reasonable when the c-statistic exceeded 0.7 and strong when exceeding 0.8. 63 The ROC analysis was based on maximum-likelihood ROC models with a binomial distribution of the latent variable and conducted in STATA 16. 53
Case Study: Cost-Effectiveness of a National Produce Prescription Program
To illustrate the application of the DOC-M model, we evaluated the long-term cost-effectiveness of a national produce prescription program. While the full study is published elsewhere, 64 we briefly explain our case study. Produce prescription is a nutrition intervention strategy that prescribes free or discounted fresh produce to patients with diet-related chronic diseases identified in the health system. Although produce prescriptions have been suggested to be effective in improving short-term food security and health outcomes, the potential impact of implementing produce prescription programs for patients with diabetes on long-term health, costs, and cost-effectiveness in the United States has not been established. Using a nationally representative US adult population aged 40 to 79 y with diabetes and food insecurity from the NHANES 2013 to 2018, our DOC-M model incorporated evidence on produce prescription programs’ effectiveness in improving diet, BMI, and HbA1c 65 and the association of diet, BMI, and HbA1c with diet-related disease risks 66 to estimate the lifetime population impact of implementing produce prescription programs on CVD outcomes, quality-adjusted life-years (QALYs), and health care costs and productivity benefits.
Results
Population Characteristics
Table 3 shows the baseline characteristics of the 2 validation cohorts in 2001 to 2002 NHANES and MESA. The average age in NHANES was 54.4 y (interquartile range: 46–62 y), with 51% females and 77% Non-Hispanic White adults. The MESA cohort was older (mean age: 62.1 y) and more diverse (39% Non-Hispanic White adults), with a greater proportion of current smokers (49%) than the NHANES cohort. Other disease profiles were similar between the 2 populations (hypertension: 40% v. 41%, diabetes: 13.2% v. 13.8%, obesity: 33.8% v. 32.2%), except that the MESA cohort, by design, excluded prevalent CVD (10.6% of the NHANES sample).
Characteristics of the 2001–2002 NHANES Cohort Aged 40–79 y at Baseline and the MESA Cohort at Baseline
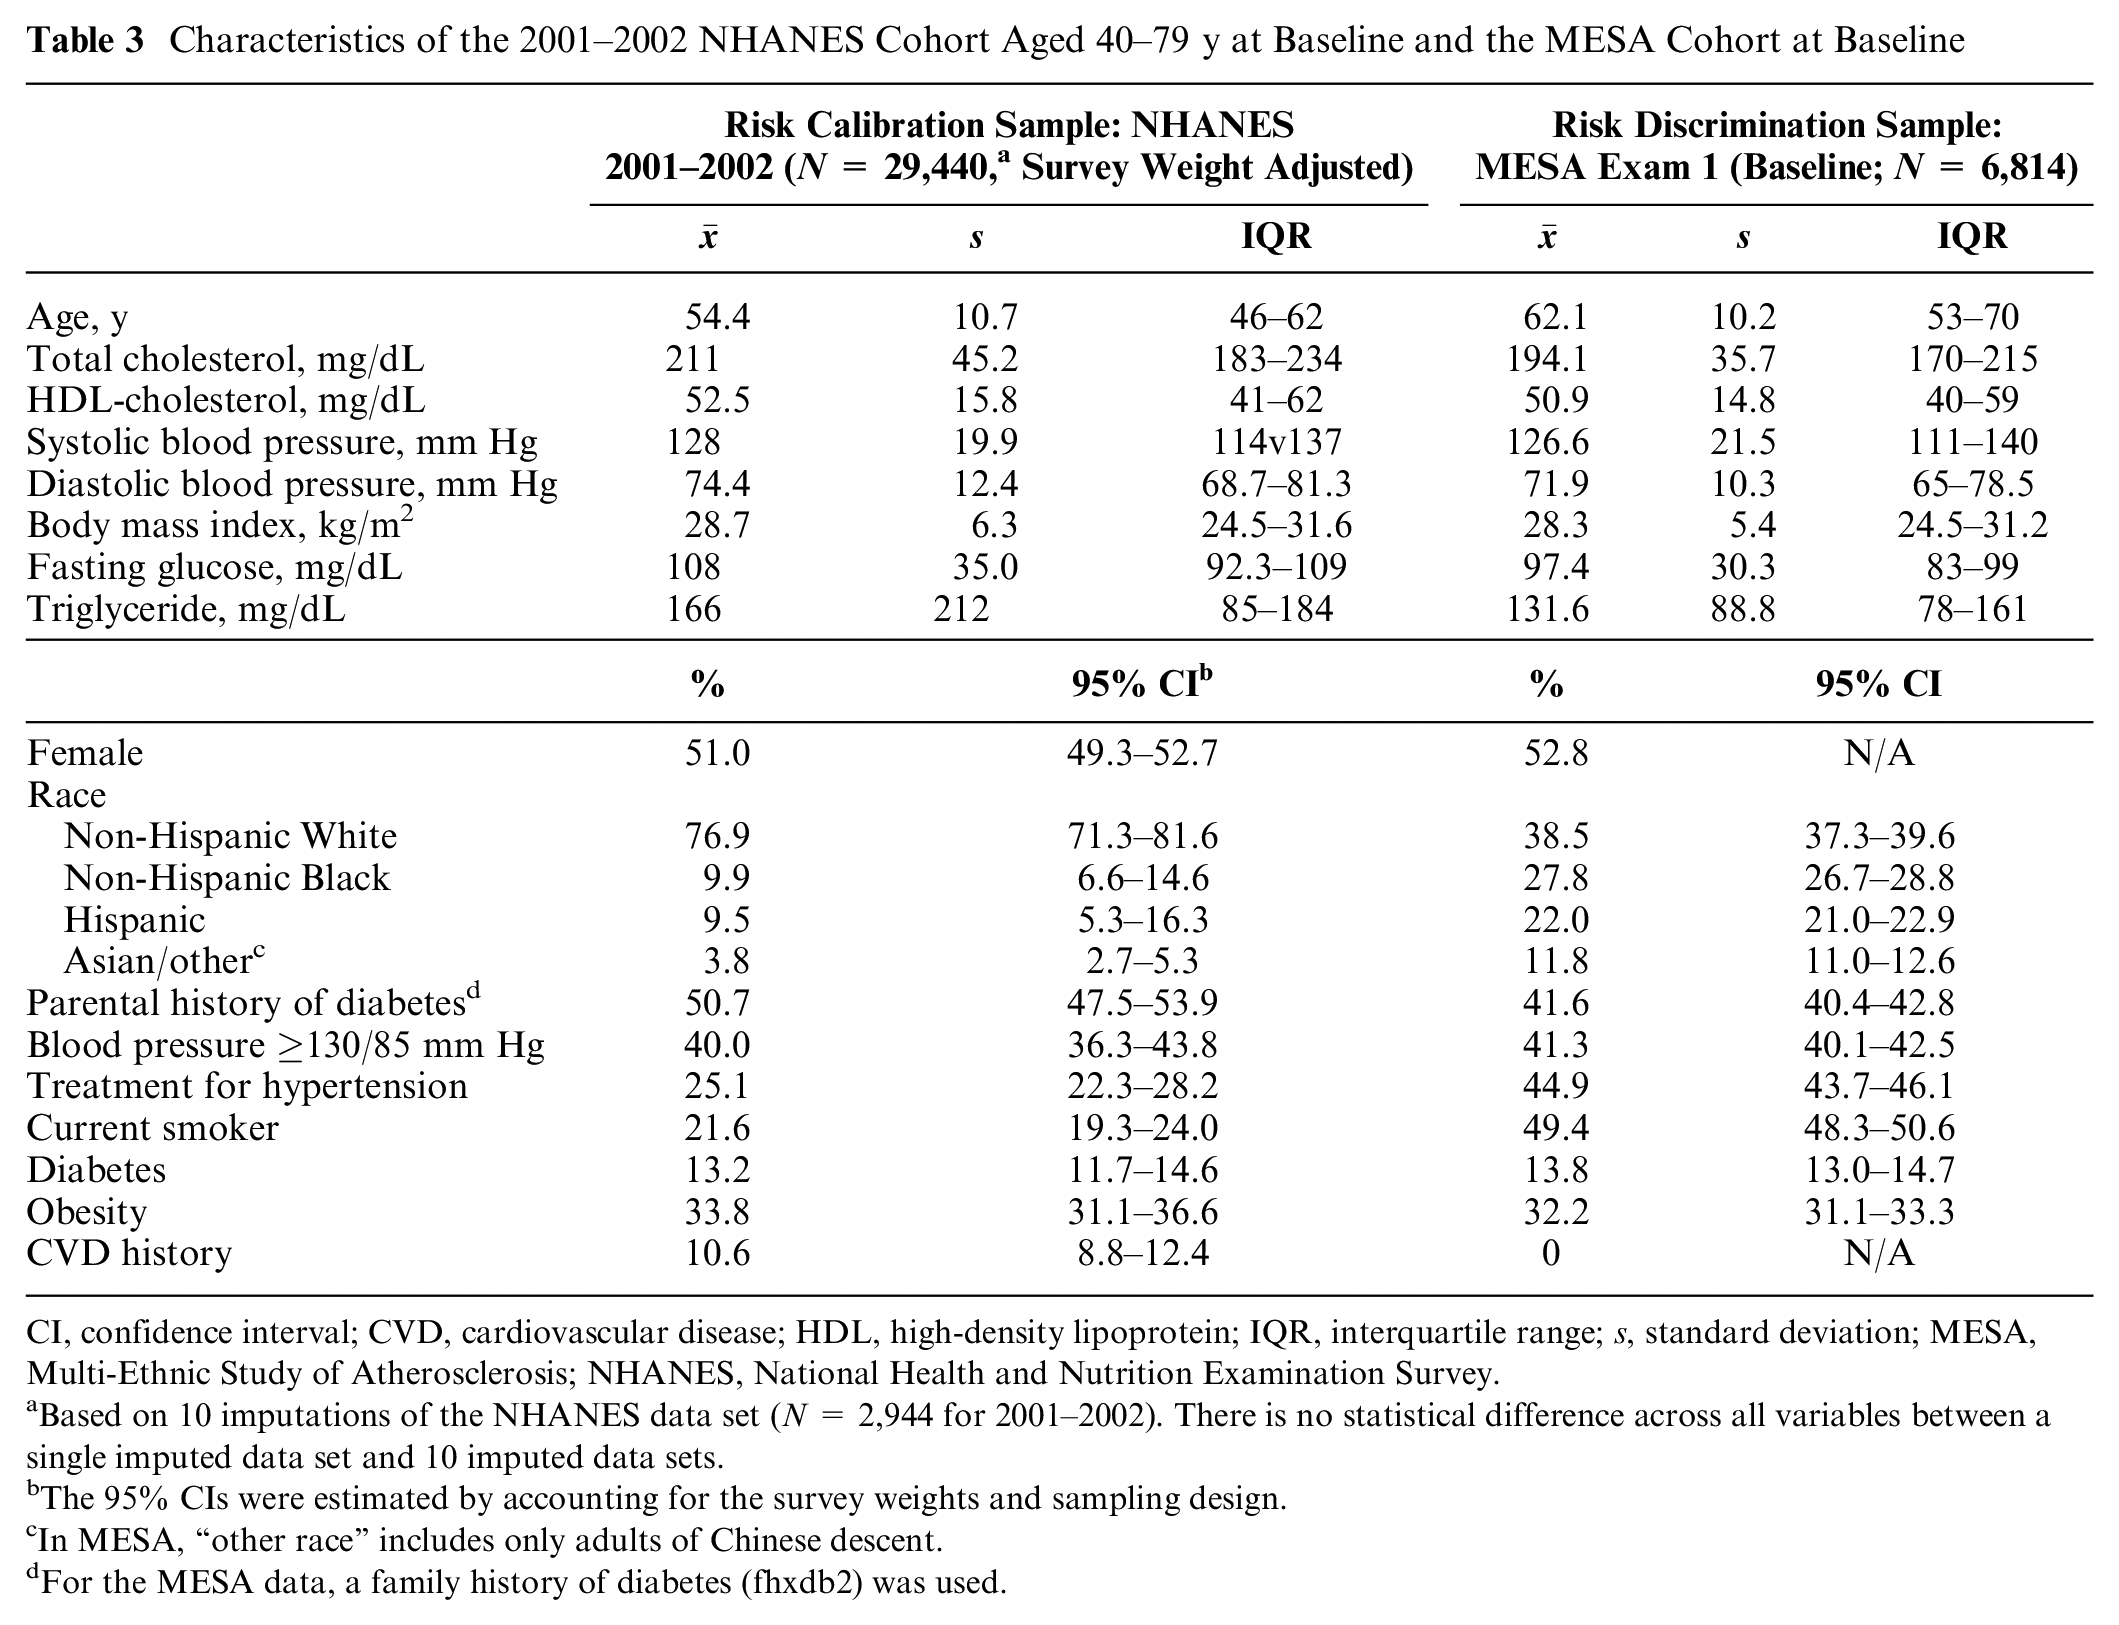
CI, confidence interval; CVD, cardiovascular disease; HDL, high-density lipoprotein; IQR, interquartile range; s, standard deviation; MESA, Multi-Ethnic Study of Atherosclerosis; NHANES, National Health and Nutrition Examination Survey.
Based on 10 imputations of the NHANES data set (N = 2,944 for 2001–2002). There is no statistical difference across all variables between a single imputed data set and 10 imputed data sets.
The 95% CIs were estimated by accounting for the survey weights and sampling design.
In MESA, “other race” includes only adults of Chinese descent.
For the MESA data, a family history of diabetes (fhxdb2) was used.
Model Performance and Validation: Population-Risk calibration
Based on 1,000 Monte Carlo simulations, our 15-y mean prediction from the NHANES 2001 to 2002 cohort fell within the 95% confidence interval (CI) of the actual observed national prevalence in future years for all primary (obesity, diabetes, ASCVD, and all-cause mortality) and secondary outcomes (CVD- and diabetes-cause mortality), both overall and among the 3 racial-ethnic groups (Table 4, Online Supplement Section M). Of 24 specific calibration targets (6 primary and secondary outcomes for 4 groups [overall and 3 racial-ethnic groups]), the only exceptions were the prevalence of CVD among Hispanic adults and CVD-cause mortality among non-Hispanic Black adults, for which the 15-y mean predictions met the criteria for all prior years except at 2015 to 2016 (year 15). Online Supplement Section M shows the calibration plot analyses for all 4 primary and 2 secondary outcomes, both overall and within each racial-ethnic group. The slopes of the calibration plots were not statistically different from 1 in all predictions. The intercepts were statistically significantly different from 0 for only 3 predictions (of 24), but even in these cases, the intercept estimates were very close to zero: 0.016 (95% CI: 0.006, 0.026) for all-cause mortality among Hispanic adults, 0.008 (0.005, 0.011) for CVD-cause mortality among Non-Hispanic White adults, and 0.004 (0.001, 0.006) for diabetes-cause mortality among the overall population. In most cases, Brier scores (i.e., mean squared error) fell below 0.0004, with the largest Brier score being 0.0012 for obesity among Hispanic adults.
Risk Calibration Performance across Primary and Secondary Outcomes by Racial-Ethnic Groups
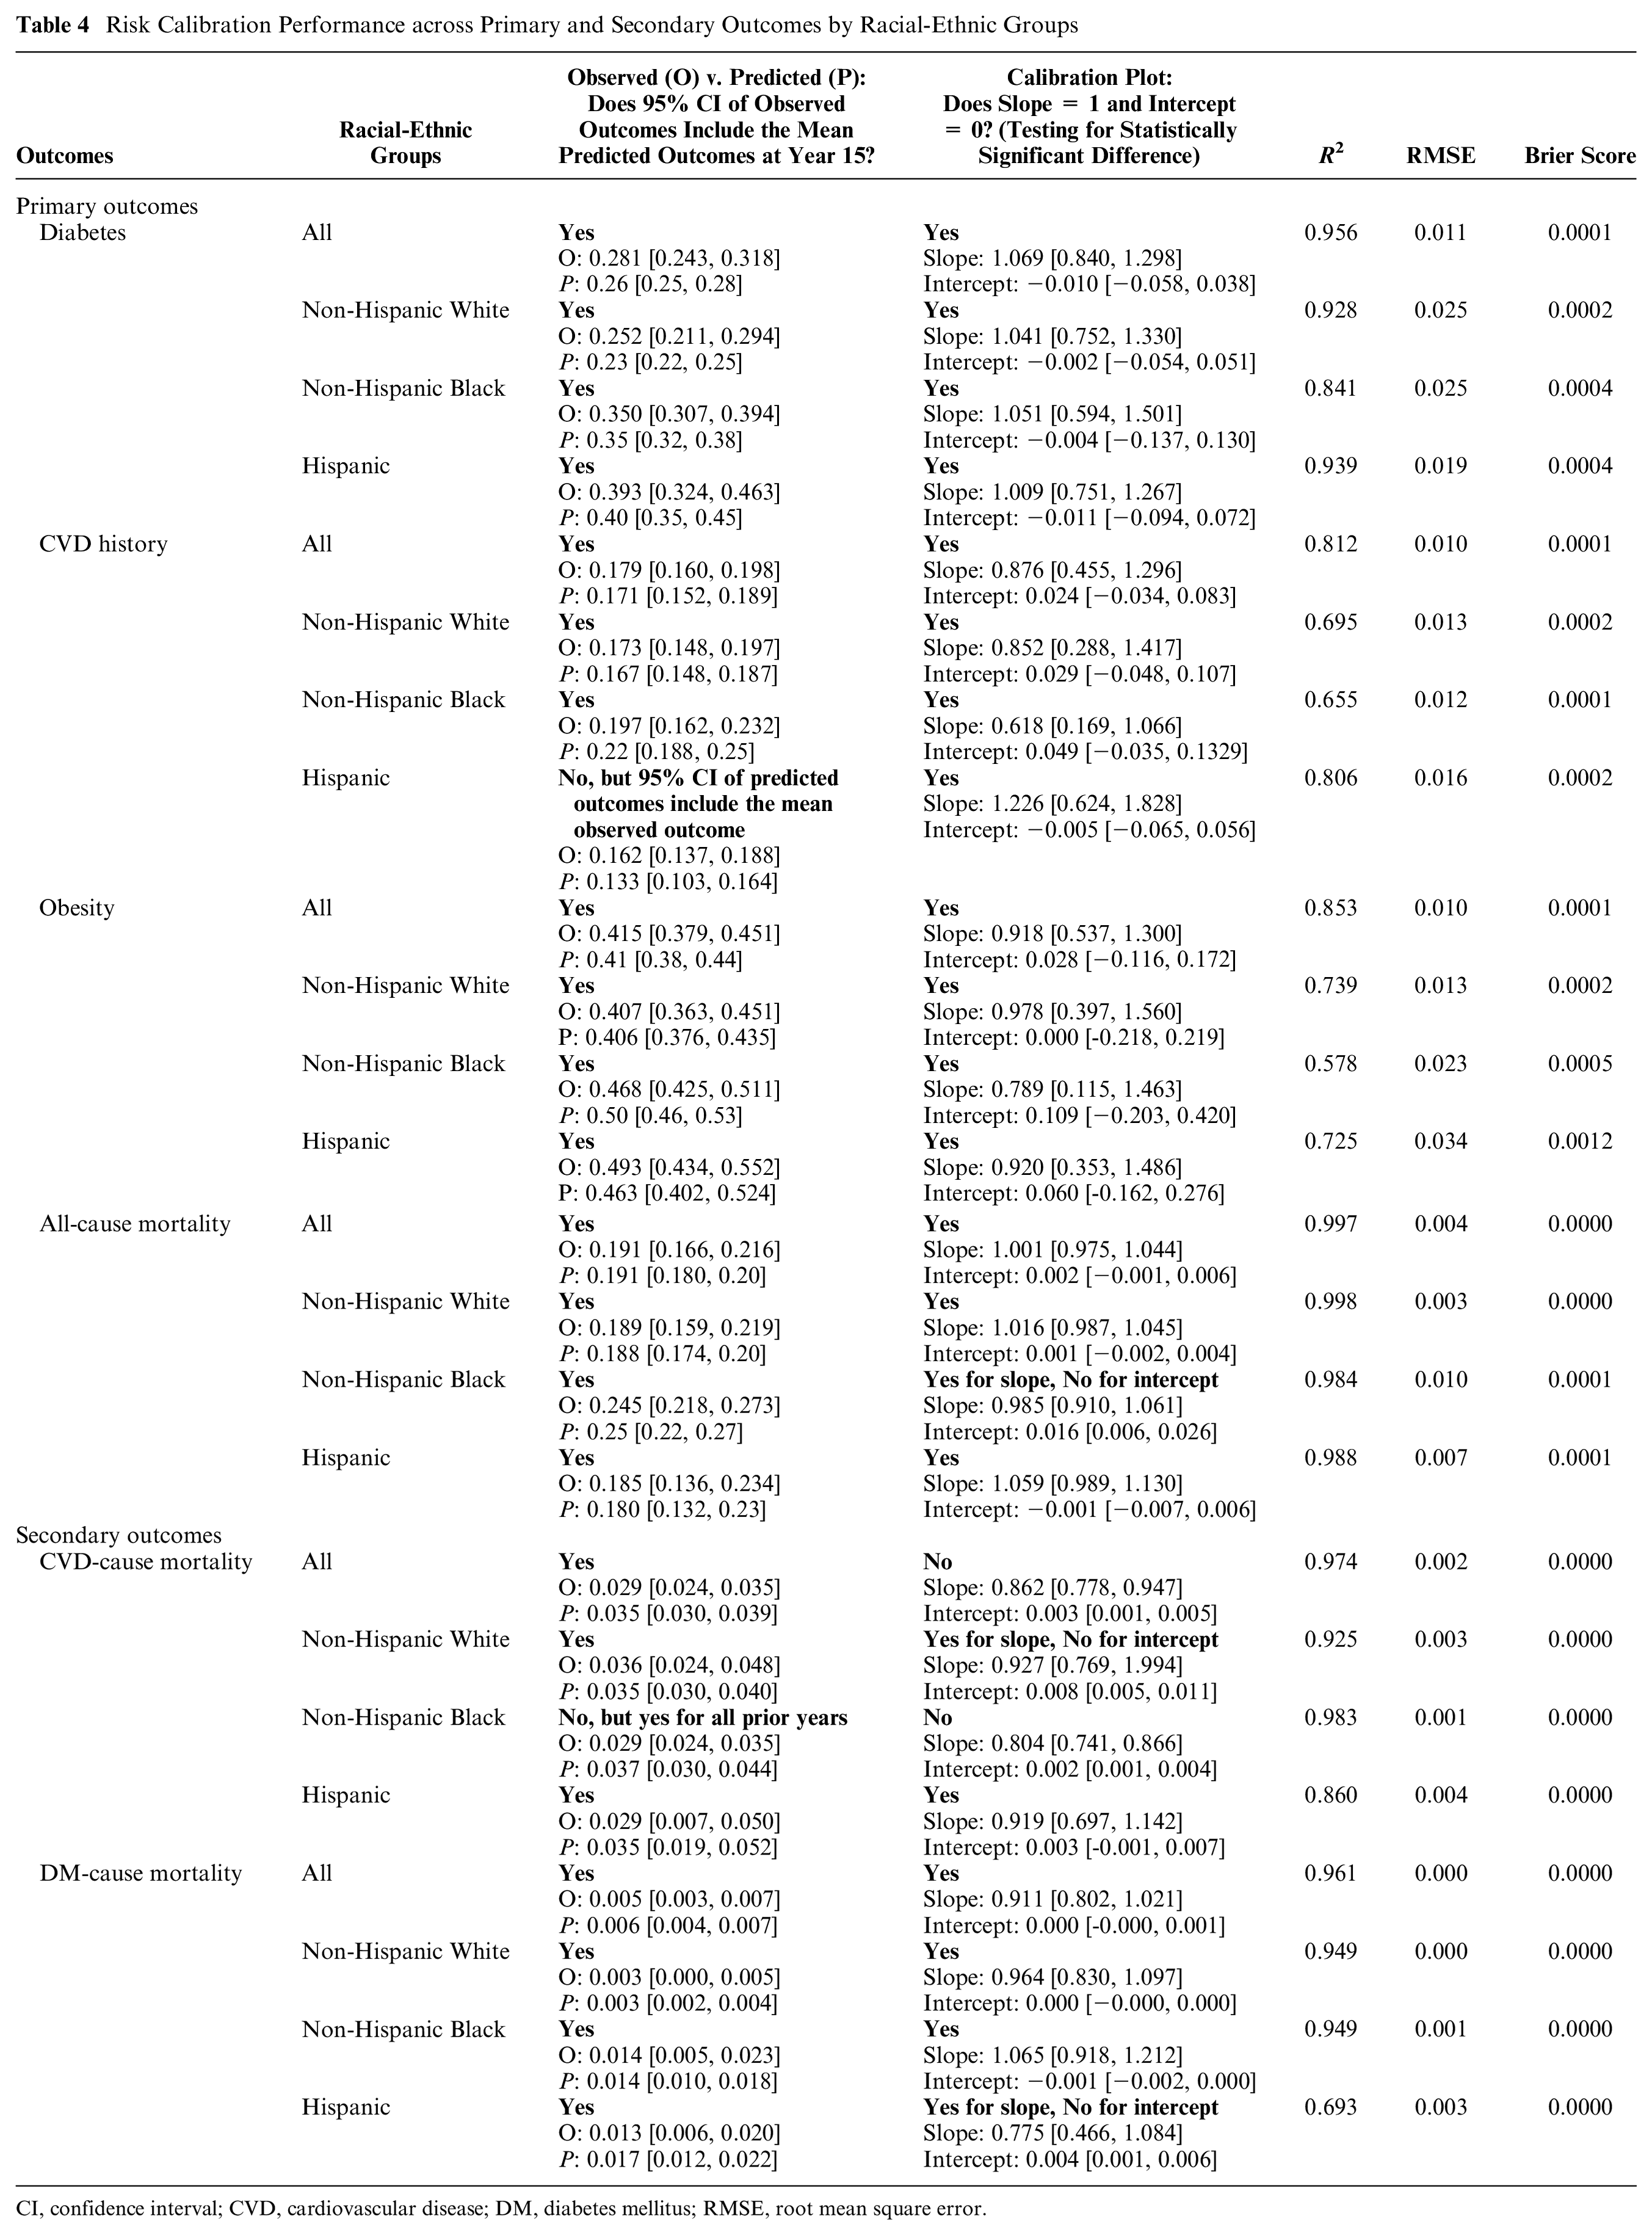
CI, confidence interval; CVD, cardiovascular disease; DM, diabetes mellitus; RMSE, root mean square error.
In sensitivity analyses using the ARIC diabetes risk equation, performance was less robust than when using the Framingham Offspring Study risk model, with adjustment for increased lifetime diabetes risk among non-Hispanic Black and Hispanic adults (Online Supplement Section N).
Model Performance and Validation: Individual-Risk Discrimination
In the prospective MESA cohort, the DOC-M model accurately predicted the occurrence of primary outcomes in individual participants, with similar performance across racial-ethnic groups (Figure 4, Online Supplement Section O). The c-statistics were 0.85 to 0.88 for diabetes, 0.93 to 0.95 for obesity, 0.74 to 0.76 for CVD history, and 0.78 to 0.81 for all-cause mortality.
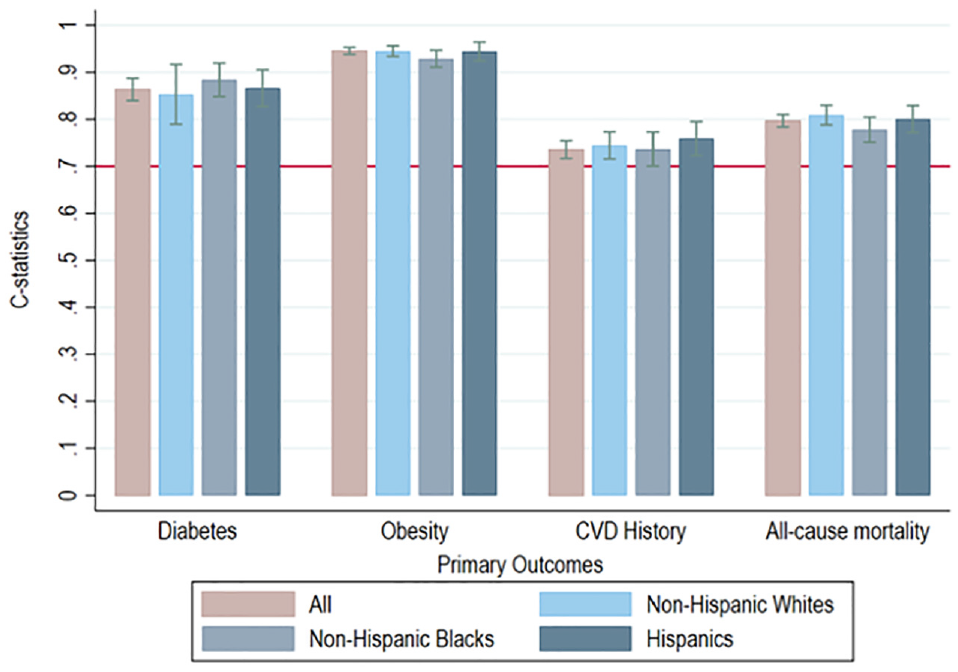
Receiver-operating characteristic analysis of the Multi-Ethnic Study of Atherosclerosis cohort for risk discrimination.
Model Estimates for Individual Health Care Spending Associated with Cardiometabolic Diseases
Among US adults aged 40 to 79 y at baseline (2001–2002), the DOC-M estimated mean individual annual health care cost to be $5,730 (95% CI: $5,530–5,930). For the 83% of individuals without prevalent diabetes or CVD at baseline, the baseline annual health care cost was $4,090 (95% CI: $3,910–4,270). For those with diabetes and no CVD (6.9%), baseline annual costs were 2.5-fold higher, at $10,460 (95% CI: $9,620–11,300), whereas for those with CVD and no diabetes (6.9%), baseline annual costs were more than 3-fold higher, at $14,050 (95% CI: $12,990–15,120). For adults with both CVD and diabetes at baseline (3.0%), annual health care costs were more than 5-fold higher than for adults with neither at baseline, at $21,340 (95% CI: $19,030–23,650).
Table 5 shows the marginal differences in individual health care expenditure based on changes in demographics, risk factors, and disease conditions. Each characteristic predicted significant differences in cost, compared with the base cost for a 40-y-old, non-Hispanic White man without diabetes or CVD at baseline. For example, estimated baseline annual health expenditures for a 40-y-old White man with a BMI of 25 kg/m2 and no chronic cardiomebolic diseases were $2,832 (95% CI: $2,618–3,045), compared with $7,764 (95% CI: $6,984–8,545) for a 40-y-old White man with a BMI of 31, diabetes, and hypertension and $36,500 (95% CI: 31,525–41,473) for a 65-year-old White man with a BMI of 31, diabetes, hypertension, CHD, and prior stroke.
Marginal Effects of Individual Characteristics on Estimated Annual Health Care Expenditures among US Adults Aged 40–79 y, Based on 73,174 Individuals in MEPS 2014–2016 (2017 USD)
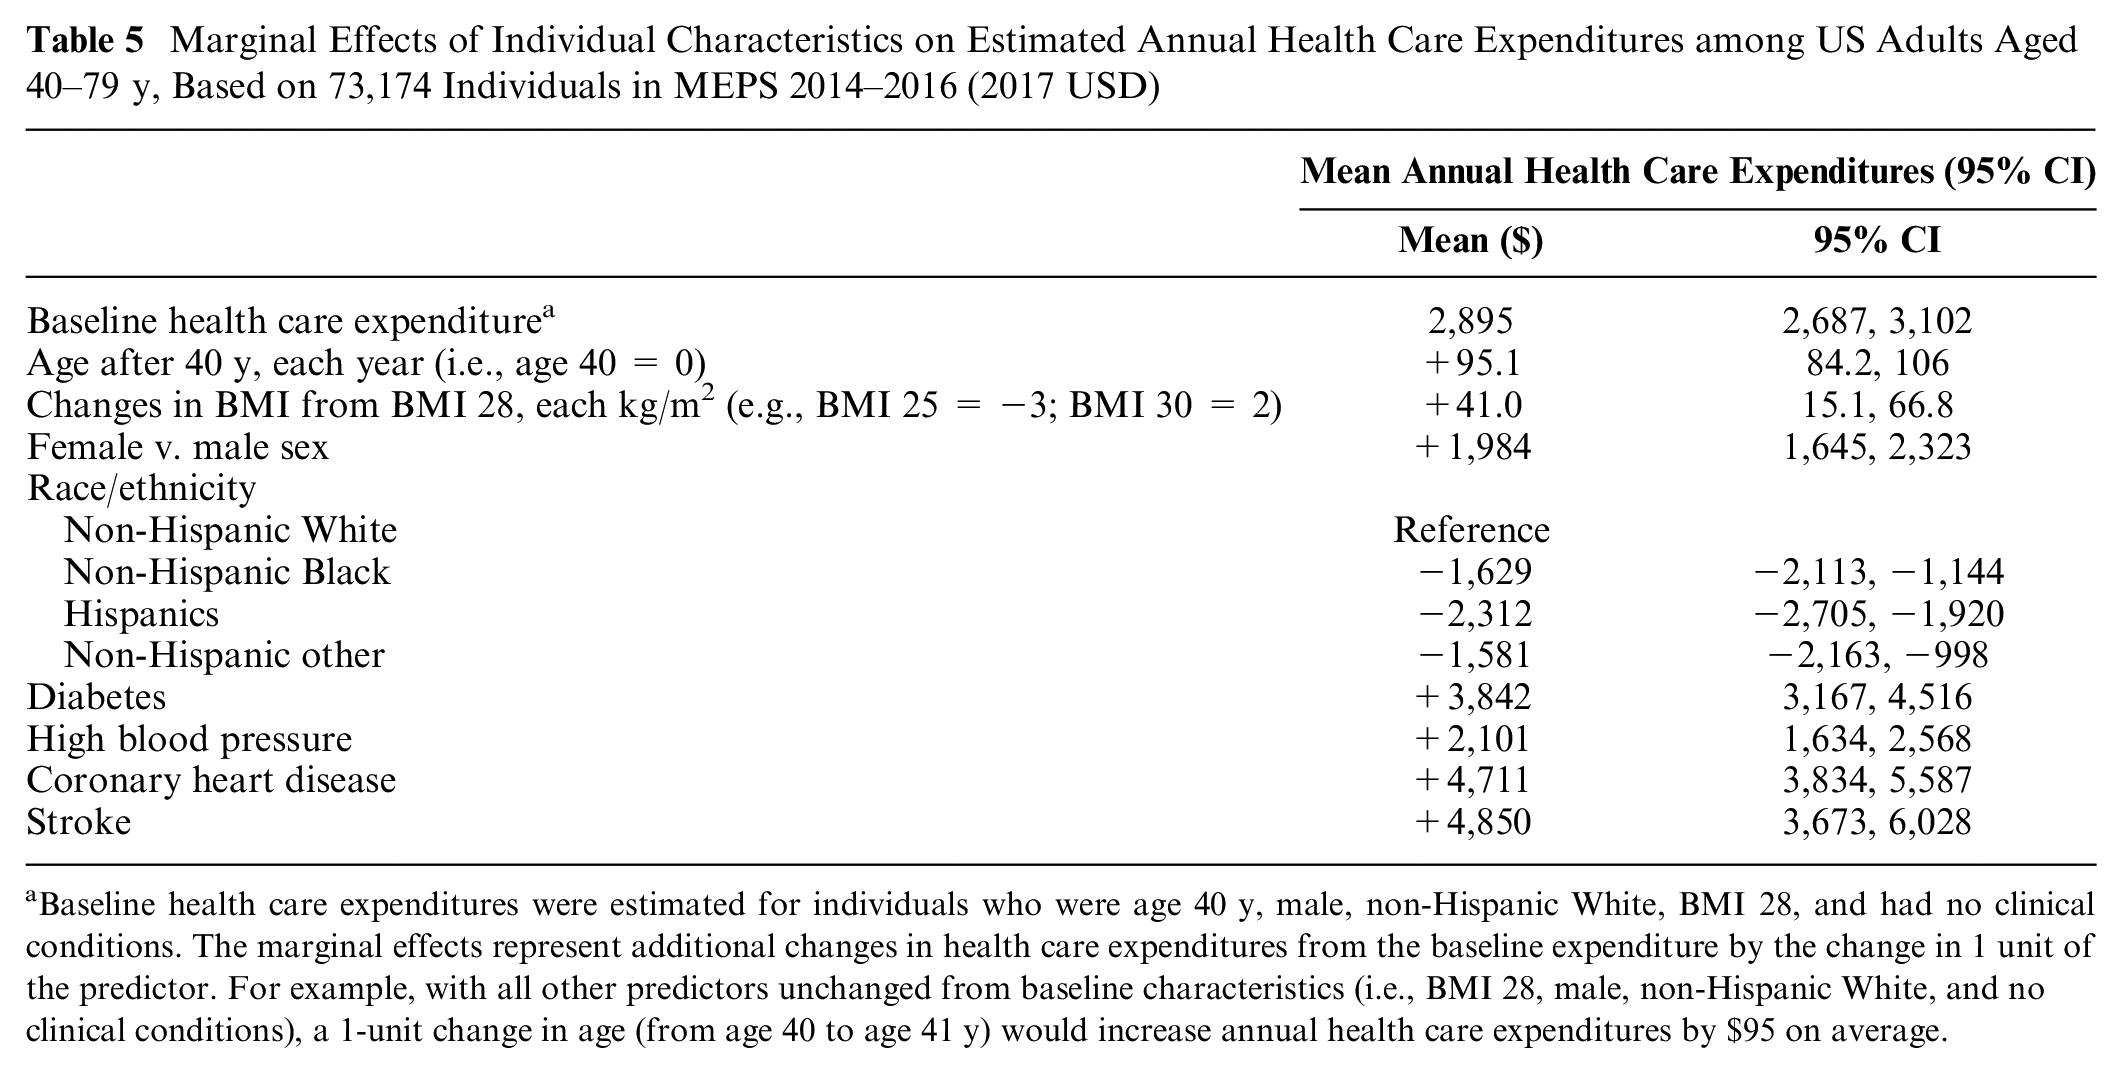
Baseline health care expenditures were estimated for individuals who were age 40 y, male, non-Hispanic White, BMI 28, and had no clinical conditions. The marginal effects represent additional changes in health care expenditures from the baseline expenditure by the change in 1 unit of the predictor. For example, with all other predictors unchanged from baseline characteristics (i.e., BMI 28, male, non-Hispanic White, and no clinical conditions), a 1-unit change in age (from age 40 to age 41 y) would increase annual health care expenditures by $95 on average.
Lifetime Cost-Effectiveness of a National Produce Prescription Program
Over the lifetimes of the current US adult population with diabetes and food insecurity (about 6.5 million), the DOC-M model estimated that implementing produce prescriptions would prevent 292,000 (95% uncertainty interval: 143,000–440,000) CVD events, generate 260,000 (110,200–411,000) QALYs, cost $44.3 billion in implementation costs, and save $39.6 billion (20.5–58.6) in health care costs and $4.8 billion (1.8–7.7) in productivity costs. The program was highly cost-effective from a health care perspective (incremental cost-effectiveness ratio: $18,100/QALY) and health-improving and cost-saving from a societal perspective (net savings of $ 0.1 billion; Table 6). Importantly, the programs would provide greater health benefits and result in more favorable cost-effectiveness ratios among non-Hispanic Black and Hispanic patients than non-Hispanic White patients, primarily due to higher baseline cardiometabolic and mortality risk among non-Hispanic Black and Hispanic patients (data are not shown, and the complete analyses are available elsewhere 64 ).
Lifetime Population Health Impact, Economic Impact, and Cost-Effectiveness of Produce Prescription among US Adults with Diabetes and Food Insecurity (Population Size: 5.74 million)
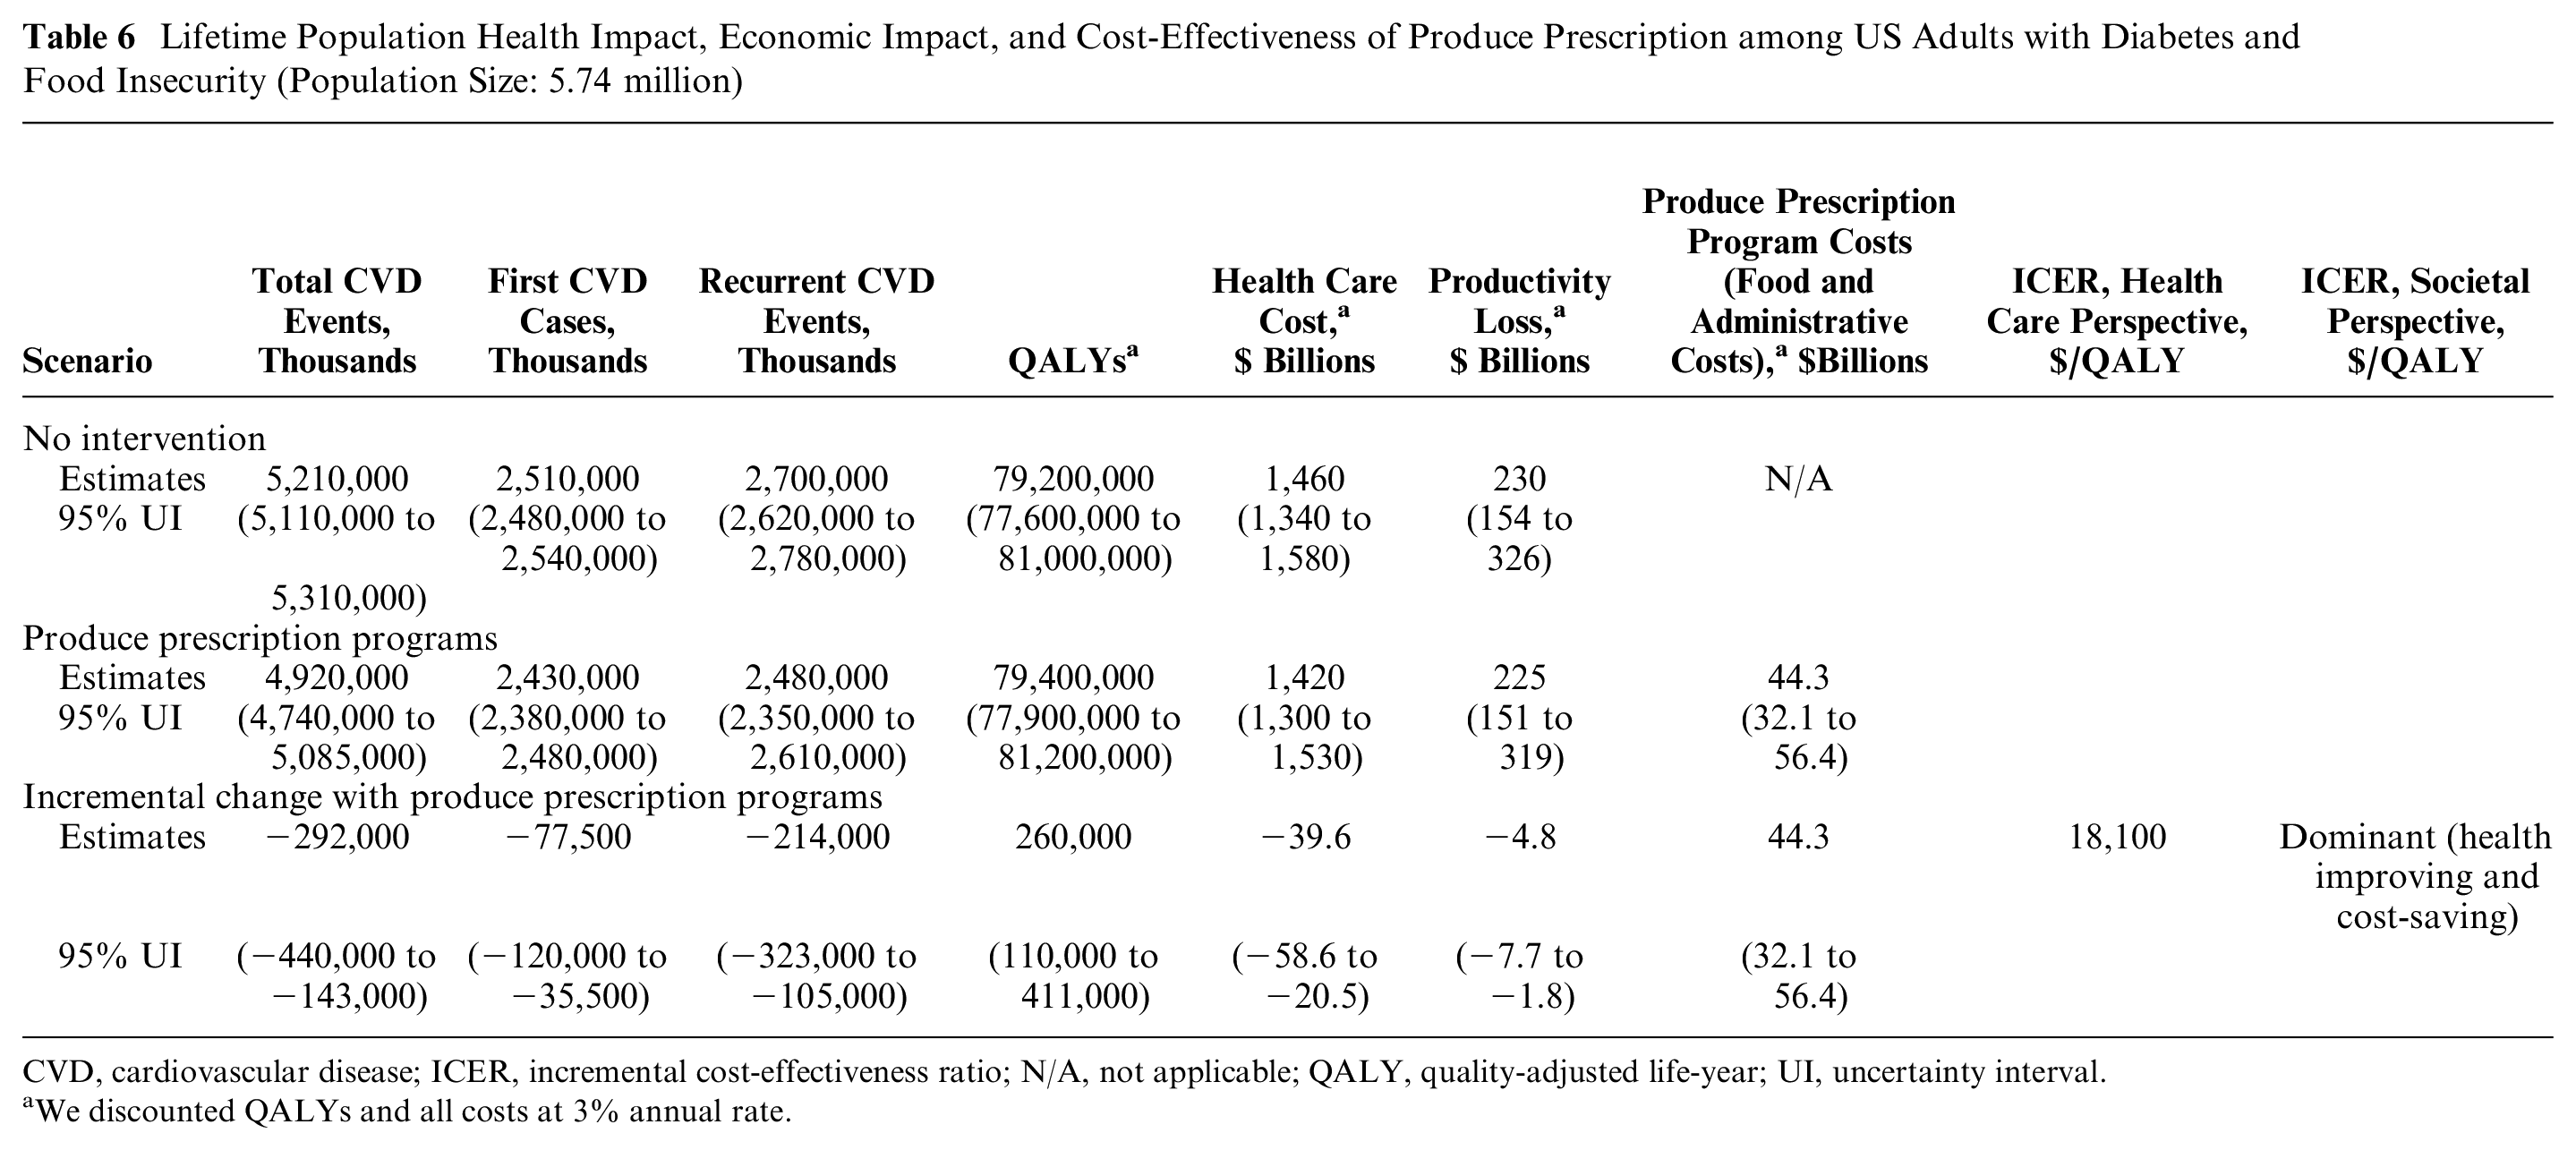
CVD, cardiovascular disease; ICER, incremental cost-effectiveness ratio; N/A, not applicable; QALY, quality-adjusted life-year; UI, uncertainty interval.
We discounted QALYs and all costs at 3% annual rate.
Discussion
By combining clinical and epidemiological studies of risk factors, disease burden, health disparities, and health care utilization, simulation modeling objectively synthesizes these disparate evidence sources and their uncertainty to inform population health policy decisions. Demonstrating model development and testing their validity is an important process that could improve public and scientific trust. For transparency in reporting and documentation, we describe a novel DOC-M model’s development and validation process, along with the publicly available source code (https://github.com/food-price/DOCM_validation).
Clnical importance of the DOC-M model includes joint predictions of the onset and complications from diet-related diseases (i.e., obesity, diabetes, CVD) and cause-specific mortality. This is an improvement over some simulation models that focus on a single disease (e.g., obesity,67,68 diabetes,4–6 hypertension, 7 CHD, and stroke8–10,69,70 or an organ-specific cancer11–14). Chronic conditions often share common risk factors with health implications for affected individuals. This is particularly true for diet-related diseases, for which demographic, lifestyle, and clinical risk factors have strong positive correlations and cluster in high-risk individuals. By accounting for these correlations, the DOC-M model accounts for risk heterogeneity across individuals to better assess the population effects of clinical, behavioral, and policy interventions across risk factors and disease pathways relevant to diet-related diseases.
Methodologically, our validation analyses applied both population-risk calibrations (using serial cross-sectional national data) and individual-risk discriminations (using a diverse community-based prospective cohort) for the overall US population and three racial-ethnic groups. The former population-risk calibrations are necessary for a model’s face validity when seeking to inform health policy decisions. The latter individual-risk discrimination is especially important for clinicians and patients as individual health outcomes matter. However, assessing both calibration and discrimination has rarely been conducted together. 71 Based on standard metrics, the validation analyses of our model demonstrated strong performance for both population-risk calibration and individual-risk discrimination for all primary and secondary outcomes for the adult US population overall and by racial-ethnic groups, although certain outcomes among non-Hispanic Black and Hispanic adults had greater uncertainty. However, as acknowledged by the pooled cohort ASCVD risk equation developers used in our model, 37 the sample population contained a relatively low number of non-Hispanic Black adults that contributed to greater uncertainty in their disease predictions. Still, the pooled cohort ASCVD risk equation has reasonable calibration in many populations and remains the most commonly used CVD risk prediction model. 72 In addition, our ROC analyses using the prospective MESA cohort showed excellent risk discrimination. Future updates and calibration of DOC-M could strengthen racial-ethnic-specific predictions as new evidence and data emerge.
The DOC-M model’s other innovative feature is the ability to forecast health trajectories across racial-ethnic and socioeconomic status groups in the nationally representative NHANES data set. Unlike other popular approaches using “simulated” individuals created from population-level summary statistics in microsimulation models8,10,25,73 our approach preserves correlations between individual-level characteristics (e.g., insurance status, household size, geographic region, education level, household income, food security status). Other features include incorporating age-related and secular trends in underlying risk factors and developing probabilistic models to reflect both sampling and parameter uncertainty. In comparison, the Real-World Progression in Diabetes (RAPIDS) model also preserves correlations across individual-level characteristics and predicts the individual trajectory of biomarkers. 74 However, it focuses only on individuals with diabetes, is based on the US Veterans Affairs data, and does not currently account for parameter uncertainty. Along with the independently developed and integrated individualized health care cost prediction model, the DOC-M model allows us to investigate the long-term distributional health and economic impacts of interventions to address upstream shared risk drivers, such as social determinants of health, for the US adult population. For example, our case study of evaluating the long-term cost-effectiveness of a national produce prescription program illustrates the application of the DOC-M model for US adults with diabetes and food insecurity. Our publication details our approach with additional subgroup analyses by age, race/ethnicity, educational attainment, and insurance status. 64
Finally, this article includes the publicly available source code for the DOC-M model (https://github.com/food-price/DOCM_validation). A recognized gap for many cutting-edge research studies is the failure to reach end users in a clear and timely fashion. 75 This problem is particularly notable for simulation modeling studies as they require integrating multiple data sources and extrapolating with certain assumptions, making results harder to interpret, less accessible to nontechnical audiences, and prone to undetectable errors.76,77 Despite some concerns about intellectual property rights and potential misuse of the open-source code, 78 we believe the open-source DOC-M model—a product of federally funded research grants—can help enhance model transparency, usability, and adaptability to foster collaboration across international research communities.
We view our racial-ethnic group-level validation approach as our best attempt to make credible group-level projections with existing data. Our model incorporated the established evidence on distributional differences in baseline risk factors, disease incidence, and mortality across racial/ethnic groups to facilitate the accurate prediction of long-term health and economic outcomes among population subgroups, including racial-ethnic ones, and to guide relevant policy decisions concerned about health inequities. Importantly, racial-ethnic subgroups are social constructs and not biological risk factors, so their associations with risk contain inherent heterogeneity and confounding due to structural racism and may change over time.
Our study has limitations. NHANES is representative of the US civilian noninstitutionalized resident population, whereas the CDC data source for mortality is based on deaths for all US residents. Differences between these populations might contribute to some discrepancy between observed and predicted outcomes during the initial (precalibration) assessment. Similarly, MEPS, used to generate our individual health care cost prediction model, excludes persons in nursing homes and assisted living facilities, representing a particularly high-expenditure group. As medical conditions and utilization data in MEPS may also be subject to underreporting due to response and recall biases, 79 our model’s health care expenditure could underestimate health care expenditures by 10% to 20%80–83 and should be considered conservative estimates.
For predicting trends for each obesity and cardiometabolic risk factor, we estimated temporal trends (i.e., average annual percentage change) in 16 population subgroups (based on age and race/ethnicity) from the historical cross-sectional NHANES data in the absence of nationally representative longitudinal follow-up data. Thus, we could not incorporate cardiometabolic risk factor trends at the individual level. Nonetheless, our validation analyses showed strong model performance with population-risk calibration and individual-risk discrimination. Should such individual-level data become available, future work could more precisely incorporate the longitudinal correlation among cardiometabolic risk factors (e.g., the approach used in the RAPID model 74 ). Also, we did not incorporate a trend in mortality based on the fact that downward slopes in CVD-related mortality have plateaued since 2010. As our model incorporated trends in risk factors, we implicitly assumed that no substantial mortality reduction would occur due to technological advances in our future prediction of CVD or other-cause mortality. Because model validation should be considered only partially complete, it is essential to continuously update and refine the model to reflect new data on cause-specific mortality, underlying trends in risk factors, and observed outcomes.
Conclusion
This study presents the development and validation of a novel US microsimulation model that incorporates demographic, lifestyle, and clinical risk factors with temporal trends to predict onset and complications from obesity, diabetes, CVD, and all-cause mortality as primary outcomes and CVD- and diabetes-cause specific mortality as secondary outcomes, for both the US adult population and within racial-ethnic groups. The DOC-M model can be used to examine health, equity, and the economic impact of health policies and interventions on clinical and behavioral risk factors for obesity, diabetes, and CVD. We also report our model’s development and validation process and provide publicly available source code for others to use, adapt, and enhance, with the hope of fostering future simulation model development and validation.
Supplemental Material
sj-docx-1-mdm-10.1177_0272989X231196916 – Supplemental material for Development and Validation of the US Diabetes, Obesity, Cardiovascular Disease Microsimulation (DOC-M) Model: Health Disparity and Economic Impact Model
Supplemental material, sj-docx-1-mdm-10.1177_0272989X231196916 for Development and Validation of the US Diabetes, Obesity, Cardiovascular Disease Microsimulation (DOC-M) Model: Health Disparity and Economic Impact Model by David D. Kim, Lu Wang, Brianna N. Lauren, Junxiu Liu, Matti Marklund, Yujin Lee, Renata Micha, Dariush Mozaffarian and John B. Wong in Medical Decision Making
Footnotes
The authors declared no potential conflicts of interest with respect to the research, authorship, and/or publication of this article. The authors disclosed receipt of the following financial support for the research, authorship, and/or publication of this article: Financial support for this study was provided entirely by a grant from NIH/NHLBI R01HL130735 and R01HL115189. The funding agreement ensured the authors’ independence in designing the study, interpreting the data, writing, and publishing the report.
References
Supplementary Material
Please find the following supplemental material available below.
For Open Access articles published under a Creative Commons License, all supplemental material carries the same license as the article it is associated with.
For non-Open Access articles published, all supplemental material carries a non-exclusive license, and permission requests for re-use of supplemental material or any part of supplemental material shall be sent directly to the copyright owner as specified in the copyright notice associated with the article.