
Abstract
Introduction
Our aim was to describe the development and validation of an obesity model representing the cardiovascular risks associated with different body mass index (BMI) categories, through simulation, designed to evaluate the epidemiological and economic impact of population policies for obesity.
Methods
A discrete event simulation model was built in R considering the risk of cardiovascular events (heart failure, stroke, coronary heart disease, and diabetes) associated with BMI categories in the Spanish population. The main parameters included in the model were estimated from Spanish hospital discharge records and the Spanish Health Survey and allowed both first-order and second-order (probabilistic sensitivity analysis) uncertainty to be programmed into the model. The simulation yielded the incidence and prevalence of cardiovascular events as validation outputs. To illustrate the capacity of the model, we estimated the reduction in cardiovascular events and cost-utility (incremental cost/incremental quality-adjusted life-years [QALYs]) of a hypothetical intervention that fully eliminated the cardiovascular risks associated with obesity and overweight.
Results
The Validation Status of Health-Economic decision models (AdViSHE) tool was applied. Internal validation plots showed adequate goodness of fit for the Spanish population. External validation was achieved by comparing the simulated and real incidence by age group for stroke, acute myocardial infarction, and heart failure. The intervention reduced the population hazard ratios of stroke, acute myocardial infarction, and heart failure to 0.81, 0.74, and 0.78, respectively, and added 0.74 QALYs to the whole population.
Conclusions
This obesity simulation model evidenced good properties for estimating the long-term epidemiological and economic impact of policies to tackle obesity in Spain. The conceptual model could be implemented for other counties using country-specific input data.
Keywords
Obesity has become a worldwide global public health challenge. 1 In Spain, more than 50% of the adult population and almost 30% of children and adolescents are overweight or obese.2,3 In this context, there is an urgent need for strategies to prevent noncommunicable diseases by reducing associated risk factors, among them obesity. 4 They involve a range of policies, such as health education and agricultural or food taxes, that have an impact not only on individuals but also on population health. 5 Childhood obesity is a leading preventable cause of death worldwide, but tackling it has been described as a complex problem because of the difficulties of ascertaining which interventions are effective in changing behavior.5,6 Moreover, measuring the preventive effect of behavior change in childhood poses a challenge, because final outcomes are reflected in excess cardiovascular risk many years after an intervention. 7
As with other public health interventions, using a simulation model can facilitate our understanding of the impact of interventions to tackle obesity by predicting future events according to the risk associated with different body mass index (BMI) categories. 8 To date, however, there are no obesity simulation models adapted to the epidemiological characteristics of the Spanish population capable of representing the cardiovascular risks associated with different BMI categories in a stratified way. Such a tool should calculate changes in final events, namely, stroke, angina and acute myocardial infarction (AMI), heart failure, and diabetes mellitus (DM), as a function of the effectiveness of each policy. To be useful for decision makers, the model would need to demonstrate accuracy, validity, and transparency. 9 Specifically, the validation process of a public health model entails evidencing how well the model reproduces the features of the target population in the base-case scenario (in terms of epidemiological indicators) and its sensitivity to translate the change associated with the interventions on surrogate outcomes (risks) into final outcomes (events),9,10 while transparency means that other researchers and stakeholders can understand the construction of the model and reproduce it. 9
Our objective was to describe the development and validation process of a flexible obesity model simulating the current cardiovascular risk scenario in Spain and capable of measuring the epidemiological impact on cardiovascular events and cost-utility in Euros per quality-adjusted life-year (QALY) of a wide variety of interventions.
Methods (Model Development)
A discrete event simulation model11,12 was built to reproduce the natural history of individuals according to their BMI category in the base-case scenario; that is, the model predicted future cardiovascular events and related deaths in the Spanish population following the current BMI distribution. Discrete event simulation is “a flexible modelling method characterized by the ability to represent complex behavior within, and interactions between individuals, populations and their environments.” 11 The model was built using the free software for statistical analysis R (version 3.6.2, https://www.R-project.org/.).
All authors were independent of the funders; that is, the funders played no role in the study design or conduct, or the interpretation of the results.
Conceptual Model
A schematic view of the model is presented in Figure 1. To start with, each individual, or entity in the model, was assigned base attributes: birth year, sex, BMI category, and socioeconomic status. These attributes were later entered in the mathematical functions used for estimating the time until events (e.g., the higher the initial BMI, the sooner a cardiovascular event might occur). Supplementary Figure SM1 presents an example of an entity with the assigned times until events. Experts involved in obesity research, clinical endocrinology, or public health interventions were asked whether the conceptual model adequately reflected the cardiovascular risks associated with obesity, and their answers supported the relevance of the approach applied.
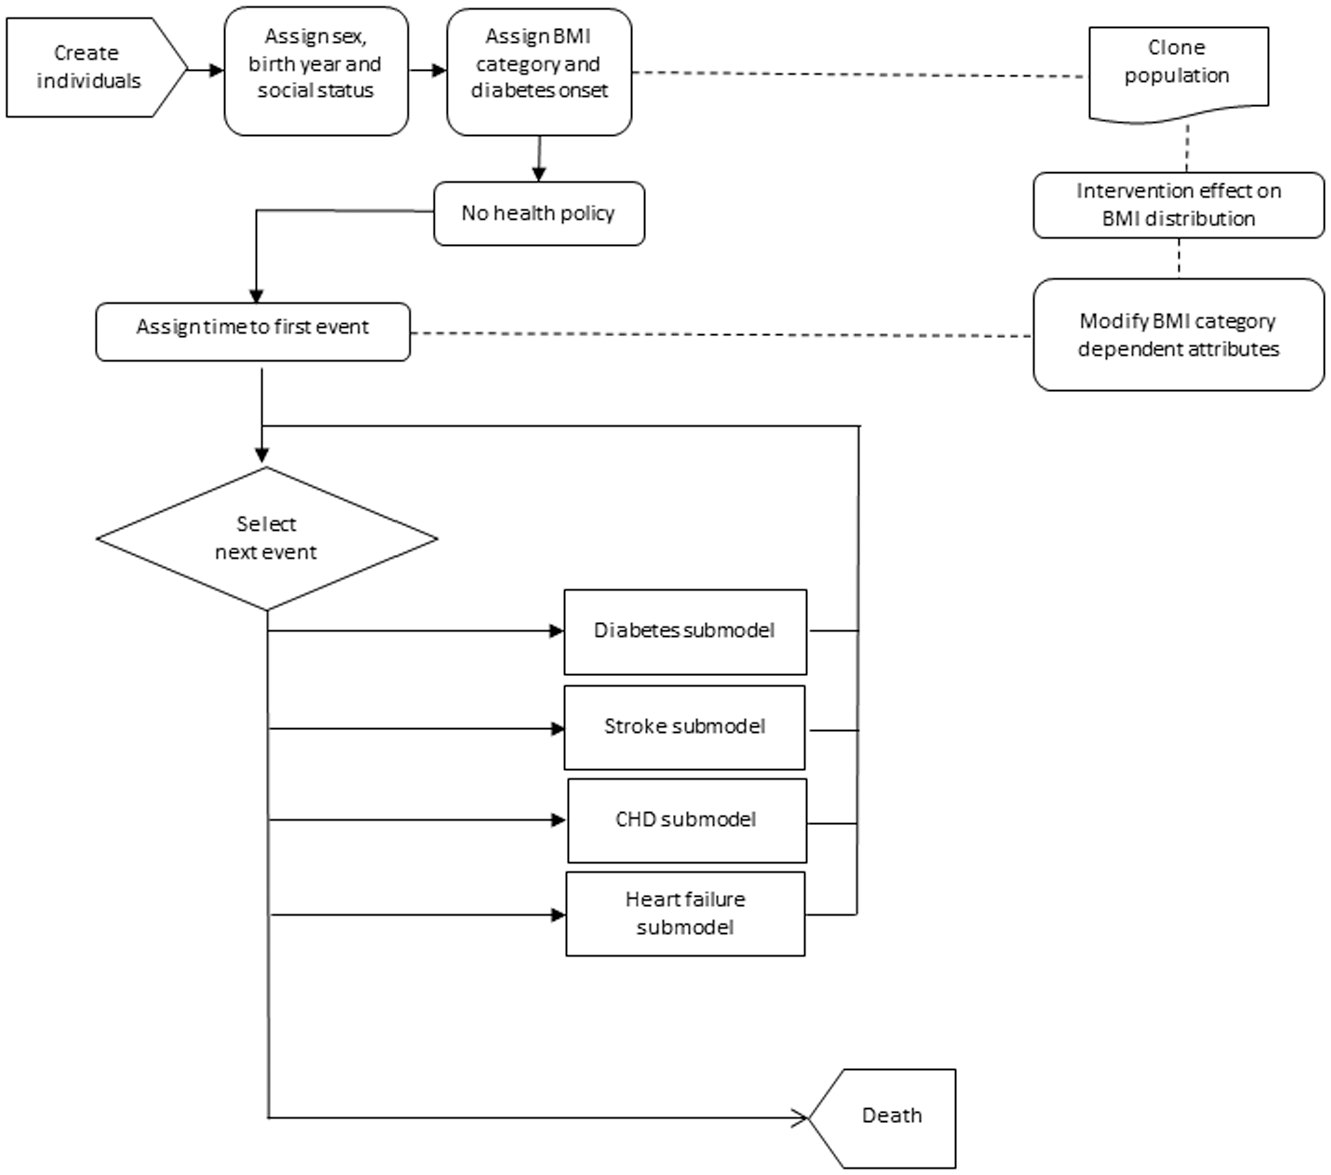
Flow diagram of the discrete event simulation model.
The most commonly used anthropometric index to make a diagnosis of obesity is the BMI (expressed as weight in kg/[height in m] 2 ), due to its demonstrated relationship with body fat content and associated comorbidities. 4 Assuming that underweight and normal weight individuals together constitute the low-cardiovascular-risk category, just 3 categories of BMI were considered: non-overweight (BMI <25 kg/m2), overweight (BMI 25–29.9 kg/m2), and obese (BMI ≥30 kg/m2).4,6 The model assumes that the current distribution of BMI categories is a valid estimator of the distribution of long-term cardiovascular risk (heart failure, diabetes, stroke, and AMI).1,4,13 The probability of being in each risk group of the BMI categories, depending on age, sex, and socioeconomic status, was deduced from the Spanish National Health Survey carried out in 2011 to 2012 in the adult population (≥18 y of age), 14 and it was considered unmodifiable during lifetime follow-up.
The excess risk of death for the conditions of overweight and obesity was incorporated in 2 ways. On one hand, mortality was higher because of their higher probability of the cardiovascular events considered,13,15 and on the other hand, mortality due to other causes was adjusted in line with the literature for obese individuals with a hazard ratio (HR) of 1.18. 15
Model Inputs
Among the model inputs, we distinguish between generic and country-specific parameters as shown in Table 1. In the model, the former translate the effect of BMI categories to cardiovascular risk, whereas the latter include population characteristics, BMI distribution, and baseline cardiovascular risk data as well as quality-of-life and cost parameters, that is, the data that would need to be changed to adapt the model for other countries.
Discrete Event Simulation Model Base-Case Input Parameters and Their Sources
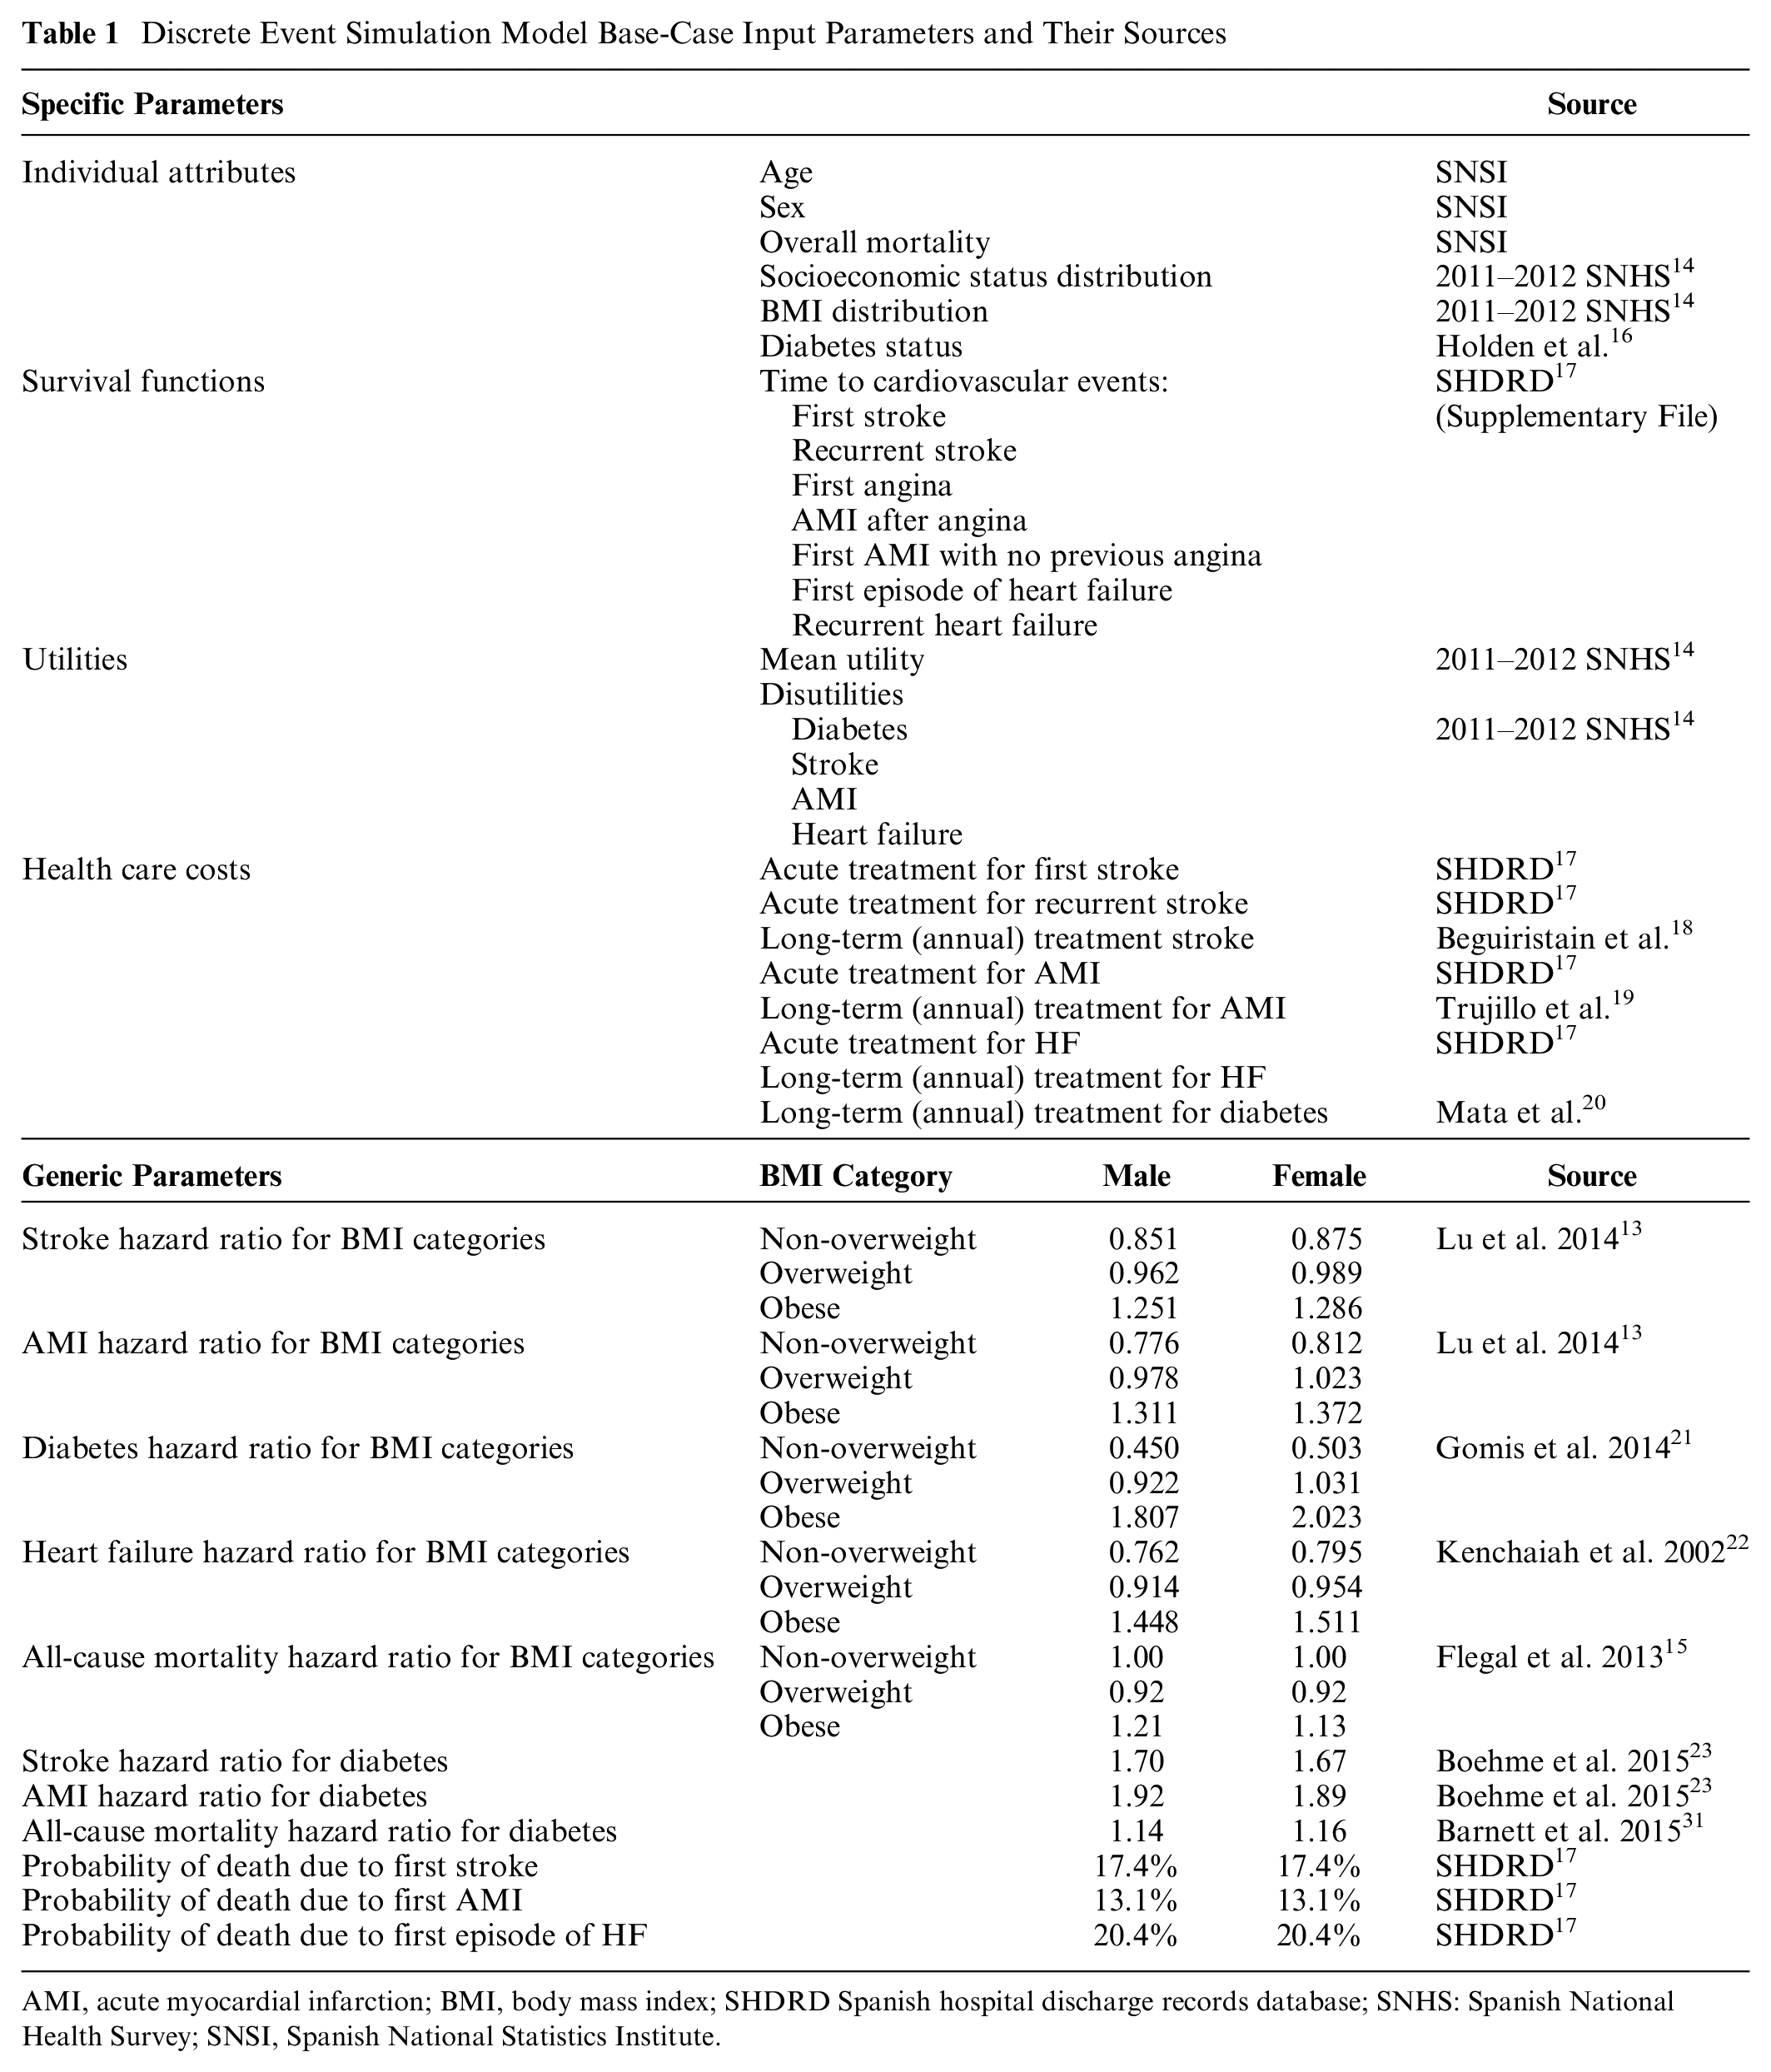
AMI, acute myocardial infarction; BMI, body mass index; SHDRD Spanish hospital discharge records database; SNHS: Spanish National Health Survey; SNSI, Spanish National Statistics Institute.
Study population
The Spanish population in 2013 was represented in the model. The whole population was introduced at the beginning of the simulation based on their birth year cohort; the number of individuals alive in each cohort was estimated by reproducing the initial size of the cohort (at birth) and applying mortality rates to the age distribution data for the reference year in the model (2013 Spanish National Statistics Institute). 24 This approach was adopted to take into account that cardiovascular events had occurred in each cohort before the reference year (2013) by incorporating a warming-up time. Notably, the more aged the cohort, the more probable it was that the individuals’ history was meaningful, and in this way, we were able to reproduce their history. Taking this into account, the cohorts included in the 2013 Spanish population were entered into the model with their background of cardiovascular events and DM status because they were assigned events across their whole life, beginning from birth.
The time horizon estimates for the population model were made until completion of the lifetime follow-up of the cohorts included in the 2013 population. Due to computational memory constraints and the time-consuming nature of these calculations, the model was run in parallel, involving a total of 935,000 entities that represent 2% of the Spanish population. With the sample size adopted, the range of the 95% confidence intervals obtained from including first-order uncertainty (Monte Carlo error)25,26 for life expectancy was less than 0.01 years.
Baseline functions
The main attributes assigned to individuals were times until events (cardiovascular, DM, and death), and these were defined from risk functions based on parametric survival analysis. Incidence data were obtained from the hospital discharge records in the Spanish national health information system. 17 The following International Classification of Diseases, Ninth Revision, Clinical Modification (ICD-9-CM) codes were used for estimating incidence rates: ICD-9-CM 428 (heart failure), ICD-9-CM 430-438 (stroke), ICD-9-CM 410 (AMI), and ICD-9-CM 413 and 411 (angina). Among all the hospitalizations from 2009 to 2013, we differentiated between first and recurrent cases. Those recorded in 2013 that were not preceded by any event during the period 2009 to 2013 were defined as “first cases.” Only first cases (42,150 cases of stroke, 30,849 of AMI,and 27,434 of HF) were used to calculate age- and sex-specific incidence rates. For recurrent case analysis, we analyzed the whole period (2009–2013; 63,172 cases of recurrent stroke, 22,608 of recurrent AMI, and 146,636 of recurrent HF). Following the method described by Roman et al., age-specific first incidence rates were modeled using a continuous hazard approach to calculate the lifetime density function.27,28 Specifically, we applied regression analysis for survival function parameter estimation in 2 different ways. For the time to first event, the R 2 was used to select the type of parametric survival distribution with the best fit to reproduce population incidence rates (Supplementary File, Tables SM1A and SM1B).27,28 In the case of recurrent events, the Akaike information criterion (AIC) was used for this purpose, as individual data including censored cases were considered (Supplementary File, Tables SM2A, SM2B, and SM2C). 29 The type of parametric distribution used for each event and their parameters are listed in the Supplementary Material Tables SM1–SM2. As no Spanish age- or sex-specific incidence rates of new cases of diabetes were available, for this condition, the survival function was based on UK data. 16
Effect of BMI category on cardiovascular risks
Assuming the proportional hazard approach, the probability of a cardiovascular event for an individual was based on the absolute risk according to age and sex, adjusted for the HR, incorporating the excess risk associated with DM and BMI category. Since individual features determined event risks, the assignment of attributes followed a specific sequence. First, individuals were assigned an age and sex according to the Spanish population characteristics in 2013, followed by a socioeconomic status, taking into account the correlation between these variables. 14 Based on the Spanish Health Survey, we estimated the probability of being in each BMI category depending on sex, age, and socioeconomic status using multinomial regression analysis as described by Arrospide et al. 30 DM status and onset age were assigned following an empirical distribution, which also incorporated an HR for diabetes by sex and BMI (Table 1).16,21 Second, the time until stroke, angina, and AMI established the day of occurrence of these events (Supplementary File). As we classified individuals by sex, diabetes status, and BMI category, the corresponding HRs for stroke, HF, angina, and AMI were also incorporated before assigning these times.13,15,25,26 AMI was preceded by angina in some cases. 17 Time until heart failure was assumed not to be influenced by DM (Supplementary File).17,22
All studies used presented the risks using nonoverweight as the reference category. To avoid overestimating population risks, we recalculated each risk consistent with the prevalence of each group to produce weighted risks that summed to 1 across the whole population. This takes into account that, in our model, the general population was taken as the reference (HR = 1), meaning that the values were less than 1 for nonoverweight individuals and more than 1 for overweight and obese individuals. All-cause mortality for DM was also adjusted. 31 Deaths after the first and recurrent events were obtained from the same Spanish hospital discharge record database. 17 Table 1 lists the obesity-related excess cardiovascular risks and the sources of these data.
Utilities
Utilities were estimated with data from the 2011 to 2012 Spanish National Health Survey.14,30 In this survey, the health-related quality of life of the Spanish population was measured by using the EQ-5D-5L. 32 EQ-5D-5L health states were converted into a single index value. For estimating mean utilities for each category, we divided the process into 2 steps: first, a logistic regression to estimate the percentage (p) of the utilities that were equal to 1 and, second, a generalized linear model to estimate the mean value of w = 1 − u for u < 1. In this way, a 2-step regression model was applied to assign utilities to individuals, based on their sex, age, socioeconomic status, and obesity status (BMI >30 kg/m2). 30 Specifically, utility was assigned to each individual, according to his or her sex (male or female), age (5 groups: 30–50, 50–60, 60–70, 70–80, and >80 y), BMI category, and socioeconomic status (low, medium, or high). The effects of having diabetes, stroke, AMI, and/or heart failure were modeled as disutilities. 30 The model applied a 3% discount rate for QALYs.
Costs
The model adopted the perspective of the Spanish Health System. Data from the hospital discharge records in the Spanish national health information system 17 were used to obtain hospital health care costs (Table 1). The following costs were then included in the model: costs for acute treatment for a first stroke, acute treatment for recurrent stroke, long-term annual treatment for stroke, acute treatment for a first episode of heart failure, acute treatment for recurrent heart failure, long-term annual treatment for stroke, 18 long-term annual treatment for AMI, 19 and long-term annual treatment for diabetes. 20 The model also applied a discount rate of 3% for costs.
Model Uncertainty
Three types of uncertainty (first order, second order, and heterogeneity) were distinguished in the simulation model design. 25 To incorporate stochastic (first-order) uncertainty (random variability in outcomes between identical individuals), the functions used to assign attributes and times until events to individuals included a random parameter. In this way, different ages of occurrence of events were assigned to individuals even if they had the same sex, age, and BMI category. In addition, to vary the regression coefficients in each simulation for the probabilistic sensitivity analysis (PSA), to represent parameter (second-order) uncertainty, the model was run using Cholesky decomposition of the variance-covariance matrix formed from the estimated coefficients (Supplementary File, Tables SM1 and SM2).25,33 Third, the statistical analysis phase also allowed heterogeneity analysis. As Briggs et al. 25 point out “its relevance lies in the identification of subgroups for whom separate cost-effectiveness analyses should be undertaken.” In our case, alternative decisions for obesity interventions could be made regarding the service provision to people living in deprived areas or with a low socioeconomic status.30,34
Model Computation
The PSA was carried out in 2 steps. After the application of parallel processing, each simulation took 1.5 hours. First, using 10 personal computers (Intel i5-85000T 2.11 GHz CPU, 8 GB RAM), we achieved the 1000 simulations running the script for 7 d to store the 1000 outputs. Second, the events and time until the event occurrence calculated by the model were used to estimate, on one hand, the population incidence and prevalence of cardiovascular events and, on the other, the QALYs and costs for each individual. We considered the costs of both events themselves and follow-up from events to death. The disutility caused by each event was considered in ascending order. That is, each individual was assigned the greatest event disutility between periods. Furthermore, we analyzed the PSA results statistically using R to obtain means and confidence intervals for outcomes comparing the two scenarios. On one hand, the model calculated the incidence and prevalence of cardiovascular events to assess the epidemiological impact of the policy for obesity and, on the other, costs and QALYs to assess its economic impact. The second step took 48 h.
Model Results
The following outputs were obtained from the model simulation: incidence and prevalence of heart failure, stroke, angina, AMI, and DM; life expectancy; and discounted health care costs, QALYs, and incremental cost-utility ratio. Given the large data set, we present only a selection of the most interesting results herein and provide the complete results in the Supplementary Material separated by type (validation and evaluation).
Model Validation
The Assessment of the Validation Status of Health-Economic decision models (AdViSHE) tool developed by Vemer et al. 35 was applied in the validation process. This tool covers 4 main areas: the conceptual model, the input data, the computerized model or internal validation, and external validation.
Model Application
The model was built to carry out cost-consequence analysis measuring the epidemiological impact and a full economic evaluation.10,36 To illustrate this, we applied the model to assess a hypothetical intervention that completely eliminated obesity and overweight. To measure the impact of the policy, the model was run in the base-case scenario, 36 and a new scenario including a cloned population (i.e., one with the same distribution of sex, birth year, and socioeconomic status) but characterized by a 100% of nonoverweight entities (i.e., no members of the population being overweight or obese). Finally, outcomes for the 2 scenarios (base case and policy) were compared to calculate, first, the benefits in terms of morbidity and mortality and, second, the cost-utility ratios (Euro/QALY).
Validation Results
Validation of the Conceptual Model
Our conceptual model followed the same approach as that adopted by Barton et al. 37 We included exactly the same cardiovascular events; in addition, however, recurrent events and event-specific mortality were taken into account in our model. The main difference was the use of BMI categories for risk stratification, rather than blood pressure and total cholesterol levels. 37 Recently published models have also included other obesity-related events, such as cancers or cirrhosis 38 ; however, at this stage of our research, we decided to focus on cardiovascular consequences.
Input Data Validation
The same experts as those consulted concerning the conceptual model were asked about the appropriateness of the input data. Notably, most of the parameters used for the model were estimated using data from the Spanish Health Survey database or the hospital discharge records in the Spanish national health information system. In addition, as regression models were used for parameter estimation, this allowed correlated parameter uncertainty to be easily included in the model using Cholesky decomposition.33,39 Other model inputs obtained from the literature, such as relative risk values, were also considered acceptable by the experts consulted.
Validation of the Computerized Model (Internal Validation)
The computer model in R was built from several submodels. Each submodel was reviewed by at least 2 different researchers in our research group before continuing with the next step. In each submodel, the trajectory of various individuals through the model was evaluated; that is, we recorded all the attributes assigned to specific individuals and checked whether the path followed by them was logical. We did not conduct specific testing for extreme input values; however, in the stochastic version of the model, no errors were reported with the parameters taking values across all their corresponding range and the model calculating final outcomes. In Supplementary Table SM3, we compare the life expectancy of the Spanish population according to the Spanish National Statistics Institute and the mean survival time with confidence intervals of the simulated population. Supplementary Figure SM2 shows the comparison of the actual Spanish population in 2013 by birth-year distribution and the simulated population in 2013 resulting from the simulated birth cohorts and their corresponding overall and event-specific mortality rates. As we introduced individuals of all cohorts at birth and assigned them a risk of death, the good fit shown in Supplementary Figure SM2 demonstrates that mortality is well reproduced by the model. The simulation phase recorded all events that occur to the simulated individual from birth to death in a specific database, and hence, the final model outcomes were obtained from statistical analysis of the data in this database.
Operational Validation (External Validation)
The experts consulted were mainly interested in the incidence, prevalence of events, and mortality rates. Further, following the literature, our model considered hospitalization and long-term treatment costs as well as QALYs for the cost-effectiveness analysis.10,36,37 Although we did not use extreme input data values in the simulation to check the model results, the use of second-order uncertainty allowed parameters taking values across the entire range of the assigned distribution.
We implemented a calibration process that consisted of repeatedly checking the goodness of fit of the simulated outcomes and reprograming the mathematical functions when the differences were significant, to reproduce the Spanish general population incidence rates for each event. The calibration process was performed using a 10-simulation model. Survival matched general population life expectancy calculated by the Spanish Statistics Institute using life tables. The excess risk associated with each BMI category in the simulated total population is shown in Supplementary Table SM4. Moreover, simulated outcomes for the age distribution of first events were compared with real data in 2013. Figure 2 compares the current and simulated number of first events for stroke, AMI, and, finally, heart failure. The external validation of recurrent events was achieved by calculating the rates of successive events. For stroke, the simulated rates, 25.3% for males and 27.1% for females, lie in the range reported by Hankey, 40 namely, 25% to 30%. In the case of AMI, the simulated rates were 18.9% for males and 19.3% for females, somewhat lower than the 23% obtained by Löwel et al. 41 for the period 2000 to 2002. We also validated the incidence of DM by comparing the simulated outcomes with rates from Holden et al. 16 (Supplementary Figure SM3).
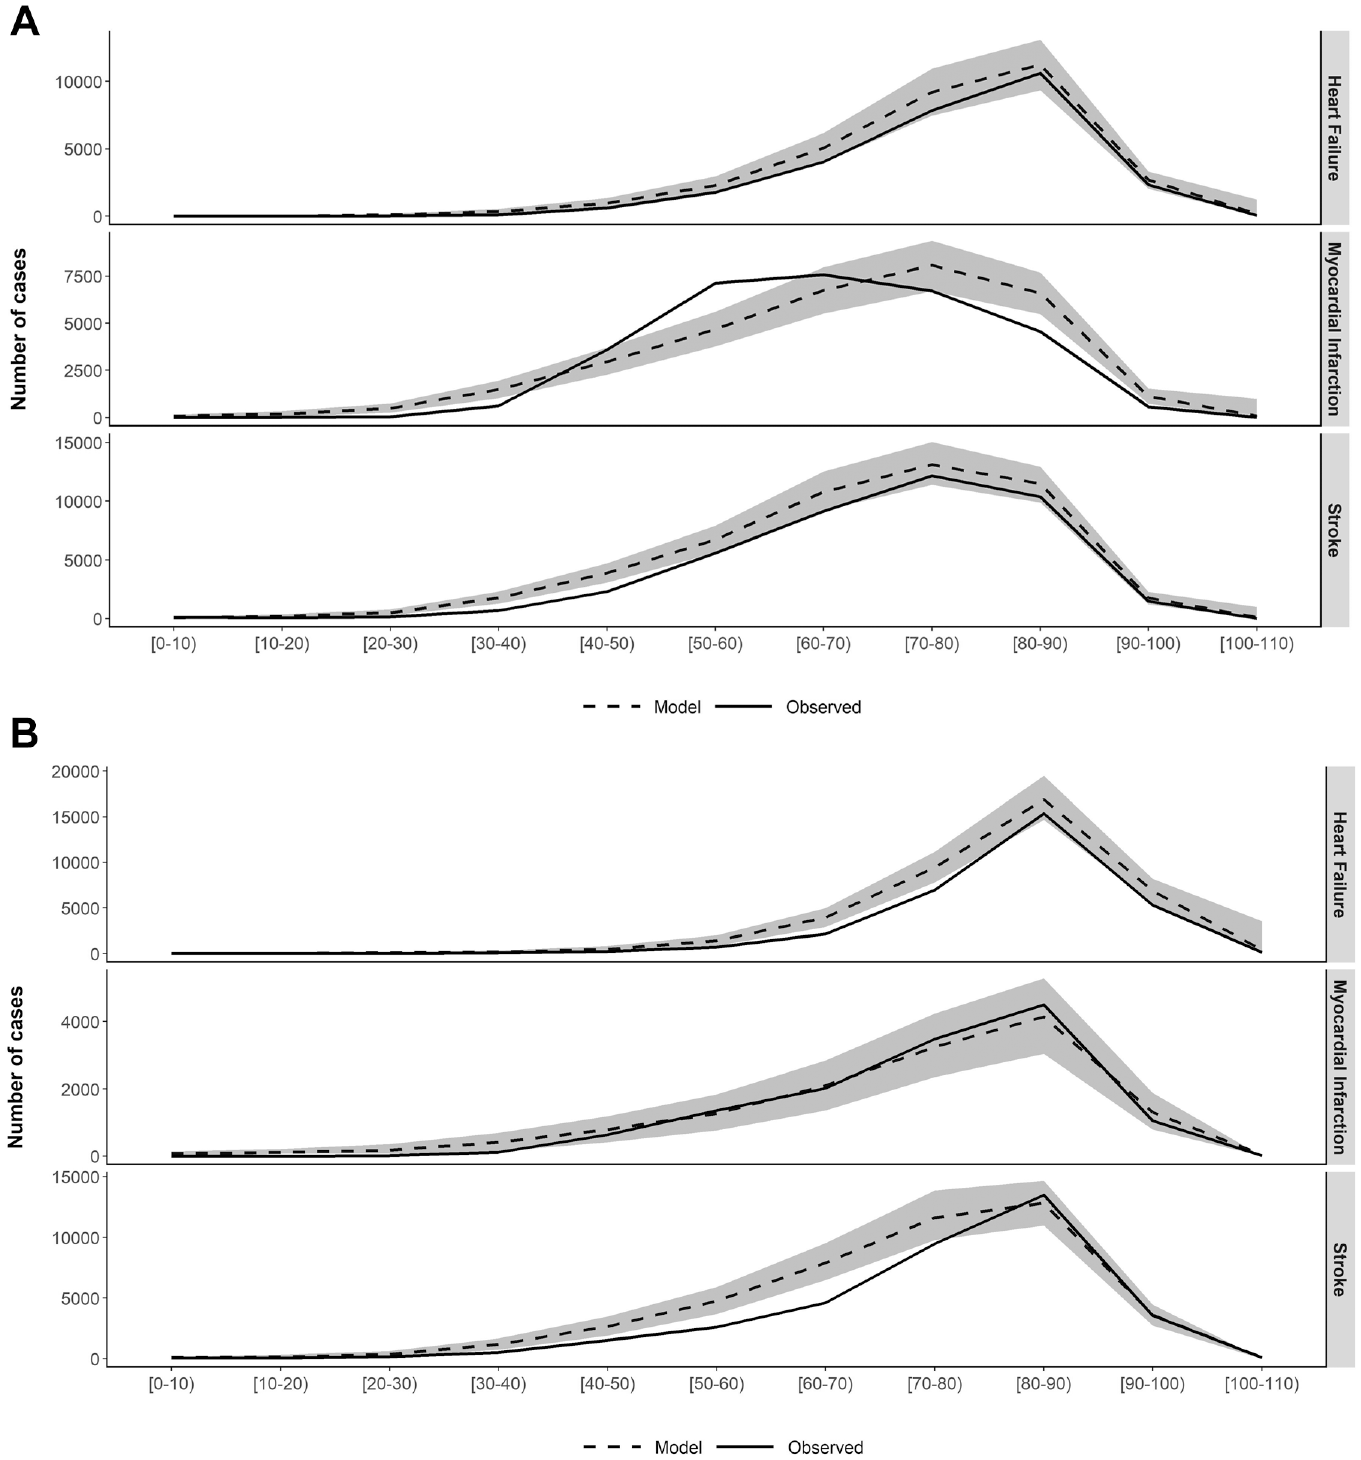
(A) External validation of the number of first events in 2013 in males by age group. (B) External validation of the number of first stroke events in 2013 in females by age group.
Note that we have used 2 terms (calibration and external validation) for the same process of comparing simulated incident cases (HF, DM, stroke, and MI) with observed ones. The calibration was carried out only to select the most appropriate distribution for the survival functions and adjust the corresponding parameters using 10 simulations. Having finished this calibration process, the final model run for 1000 simulations, the comparison of these results with observed rates was considered “external validation.” It is true that if the computing had taken less time, the 2 processes would have been the same. We distinguish between them as we wanted to highlight the importance of obtaining the confidence intervals of the simulated values in the comparison with the observed data (external validation).
Other Validation Techniques
Other validation techniques such as, for example, double programming 9 have not been used, but the model was built using a free software environment for statistical computing (R); therefore, it will be possible to share the model code with researchers interested in collaboration projects. Further, in the model-building process, we followed the guidelines described by Eddy et al. 9 in the report of the ISPOR-SMDM Modeling Good Research Practices Task Force, with some elements from the specific review for population model validation of Kopec et al. 8
Evaluation Results
Epidemiological Impact
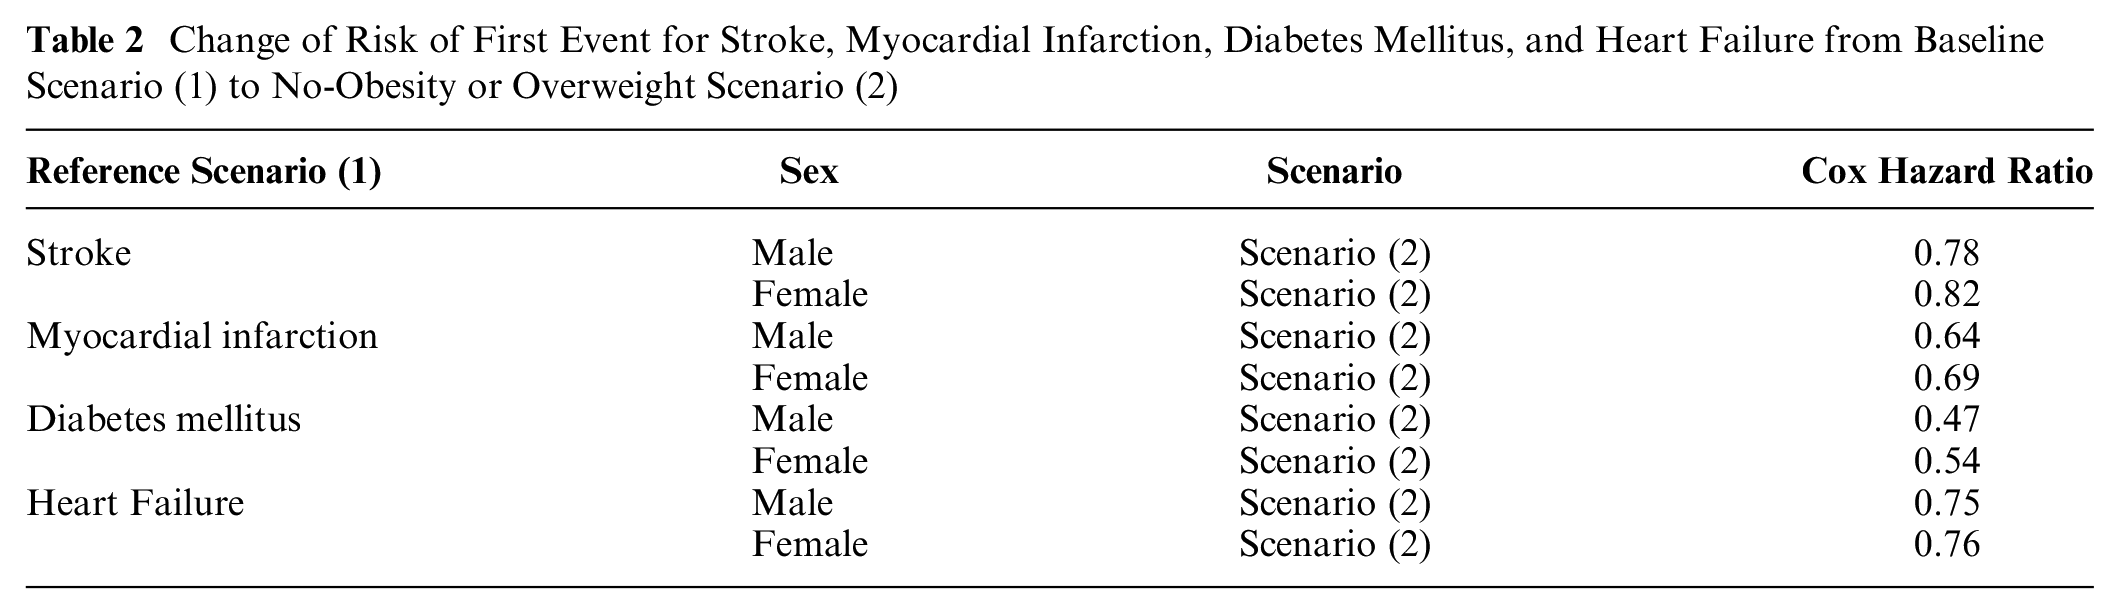
The comparison of stroke, AMI, heart failure, and DM incidence by age group in both scenarios is shown in Figure 3A (number of events), Figure 3B (rates), and Supplementary Figure SM4 (DM). The risk differences between the 2 scenarios (base case and no obesity or overweight) for first events for stroke, DM, AMI, and heart failure are shown in Table 2.
Change of Risk of First Event for Stroke, Myocardial Infarction, Diabetes Mellitus, and Heart Failure from Baseline Scenario (1) to No-Obesity or Overweight Scenario (2)
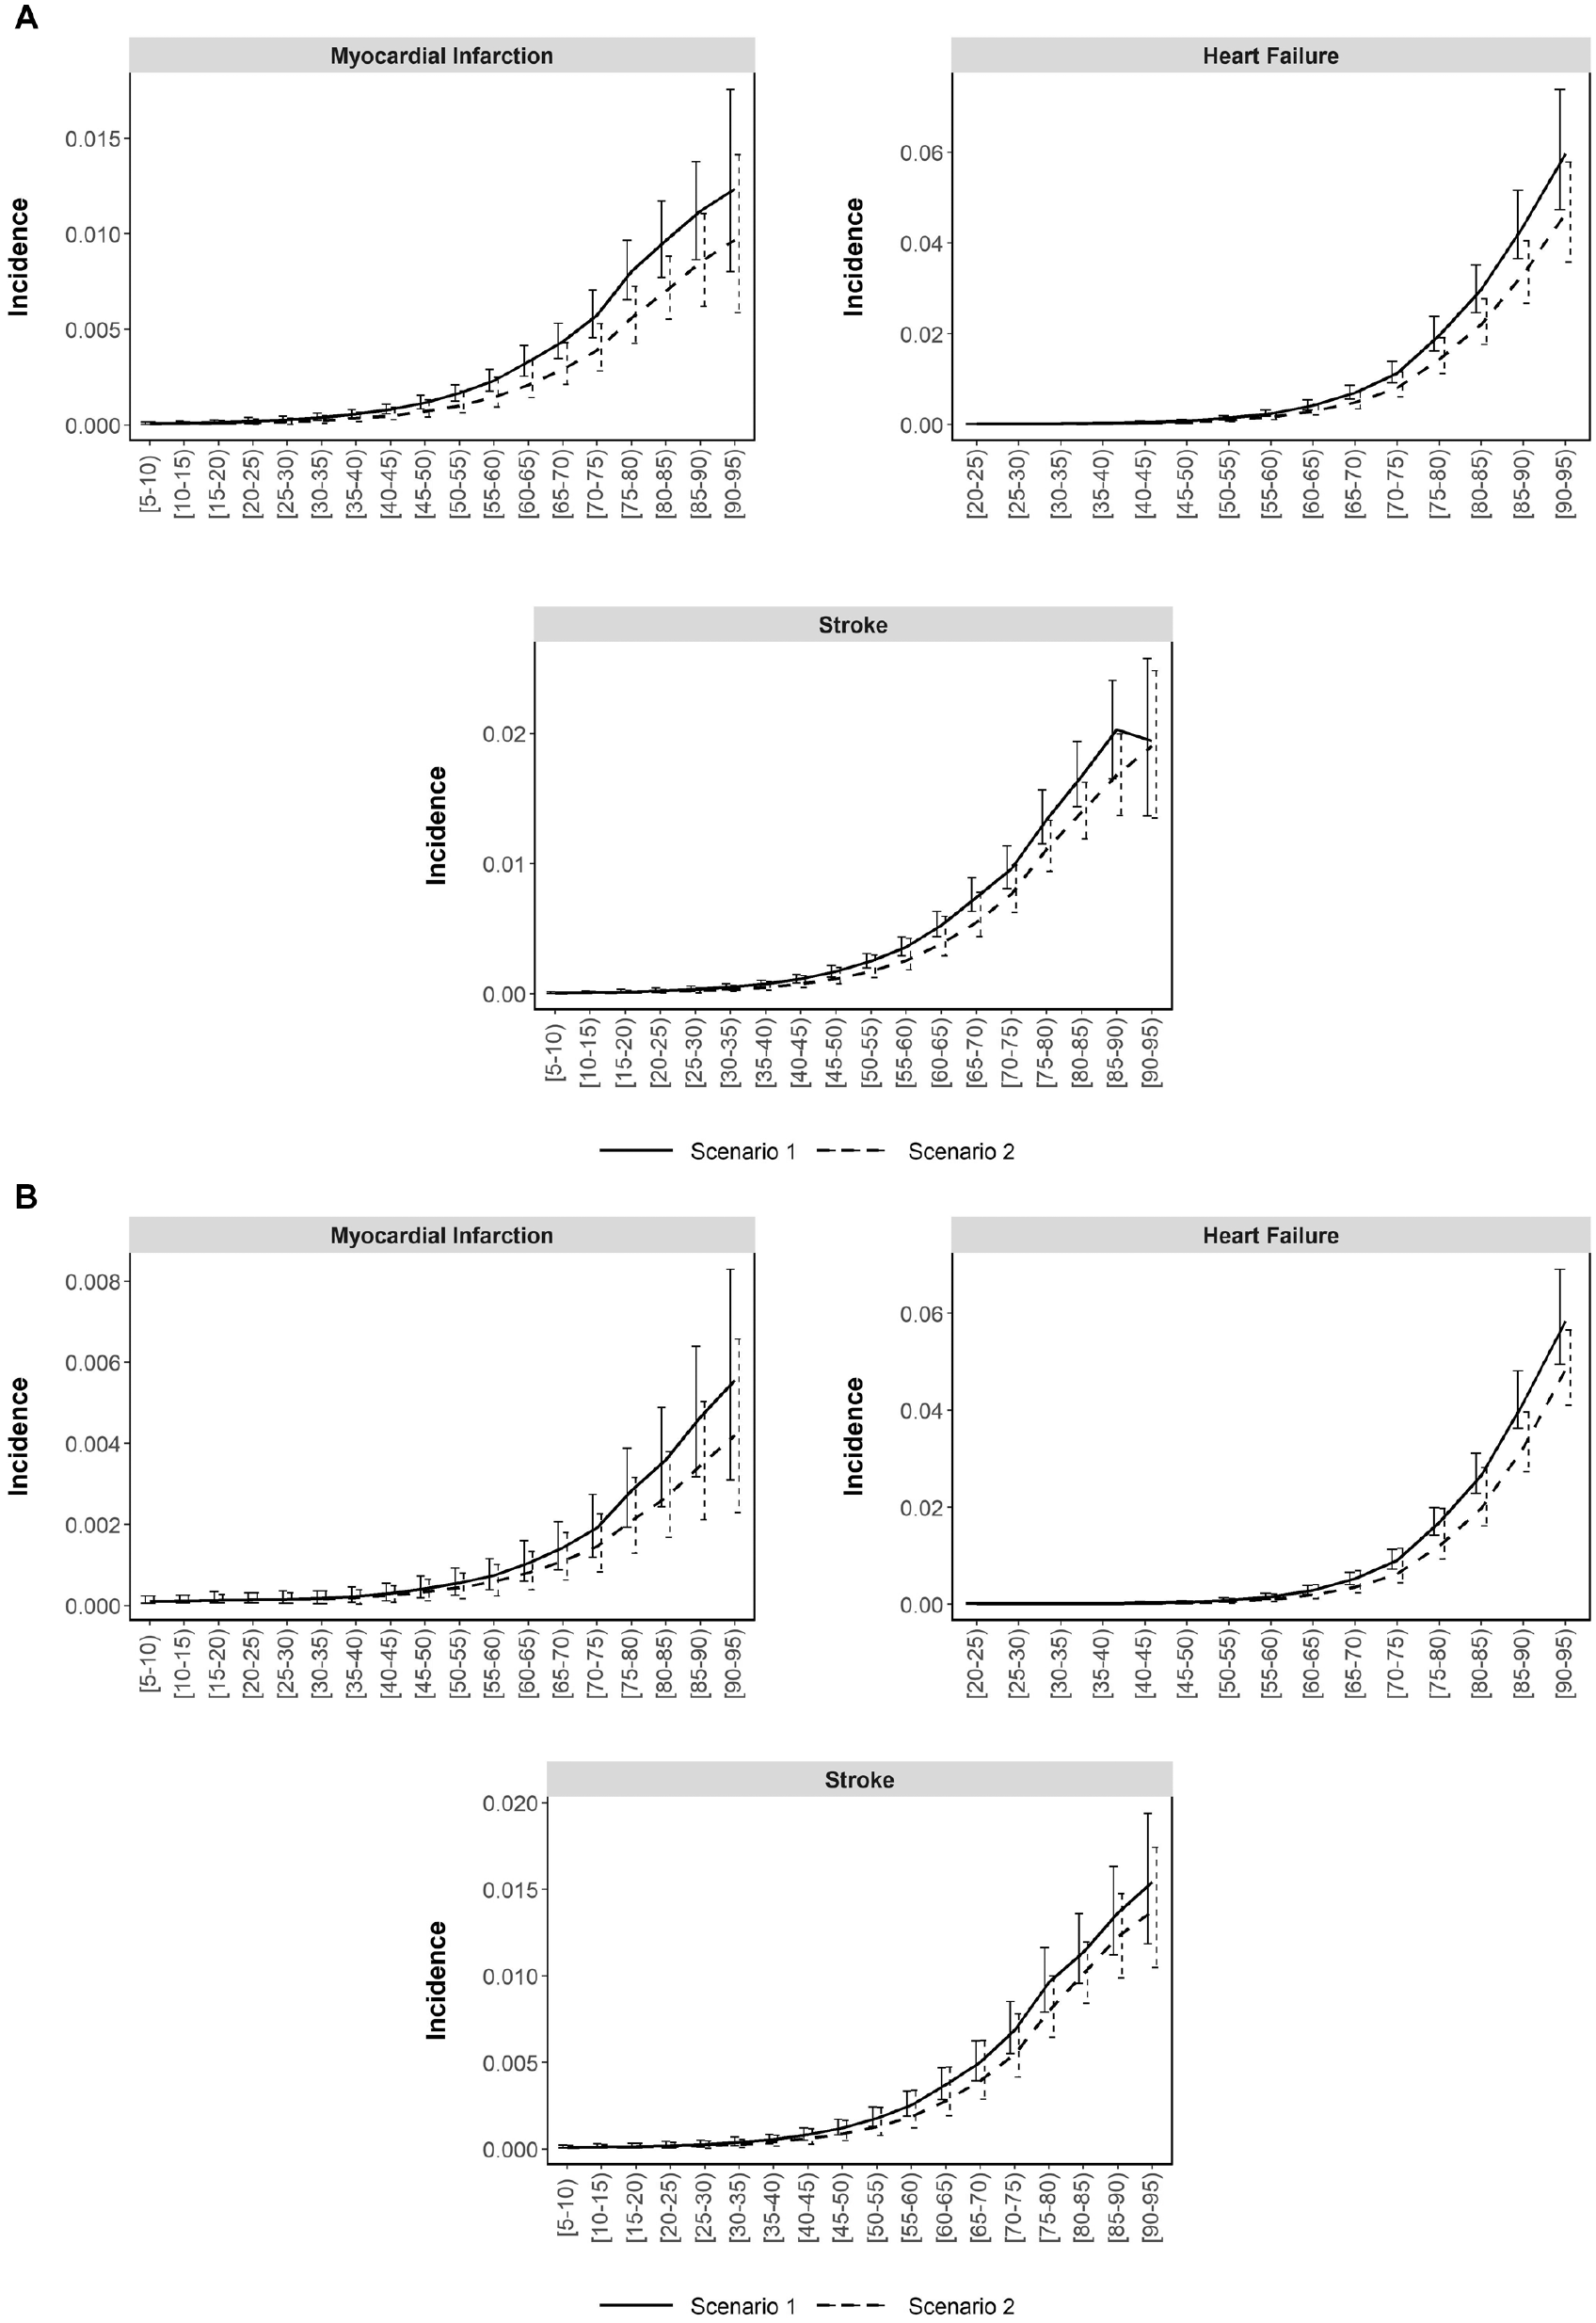
(A) Comparison of number of events and incidence by age group in the base-case scenario and in the no-obesity or overweight scenario in males. Scenario 1: base-case scenario; scenario 2: no obesity or overweight scenario. (B) Comparison of the incidence rates with confidence intervals by age group in the base-case scenario and the no-obesity or overweight scenario in females. Scenario 1: base-case scenario; scenario 2: no obesity or overweight scenario.
Cost-Utility Analysis
The cost-utility analysis with mean and confidence intervals for discounted and undiscounted costs and QALYs for each individual in each scenario are listed in Supplementary Tables SM5, SM6, and SM7. The cost-effectiveness plane is shown in Figure 4.
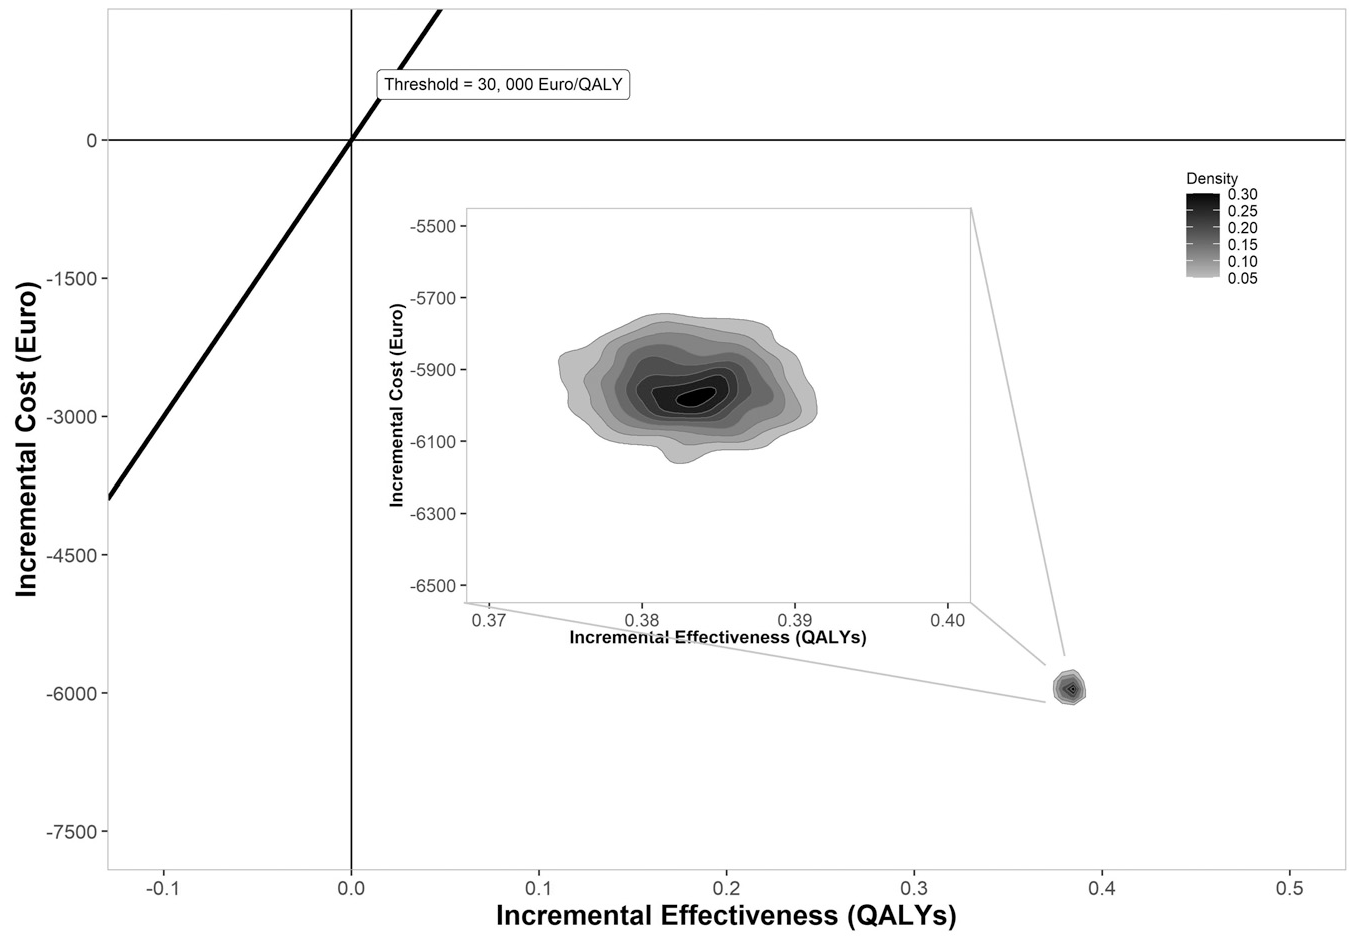
Cost-effectiveness plane for a hypothetical intervention that eliminates obesity and overweight. QALYs, quality-adjusted life-years.
Discussion
This study demonstrates, in a structured way, the robustness and validity of our model reproducing the level of cardiovascular risk in the Spanish population by BMI, this being considered the main driver, but also taking into account sex, age, and socioeconomic status. Although development and validation were carried out for the Spanish population, the model could be used for other populations by entering country-specific input data.
We focused on cardiovascular risk and DM because they are the main drivers of the life expectancy gap between overweight or obese and nonoverweight people. The disaggregation of cardiovascular risk by socioeconomic status and sex, as well as age, was a key element of our analysis, given the considerable inequalities by sex and socioeconomic status in the prevalence of obesity.34,42 In this way, we have been able to take into account the impact of interventions on a specific subgroup as a function of risk, as has been shown in the case of imposing taxes on sugary drinks. 34 So far, we have assumed that other risk factors such as blood pressure or cholesterol levels were not modified, and hence, they were not included in the predictive functions for cardiovascular events. Further, although some models have included other events associated with obesity, such as osteoarthritis, cancers (kidney, endometrial, breast, and colorectal) and dementia,43–46 we decided not to include them, as their impact on mortality has a smaller effect size. On the other hand, the disutility associated with osteoarthritis and other diseases reducing health-related quality of life was indirectly included in the model through the utility values from the Spanish Health Survey by BMI category.
The conceptual model used in this study relies on the idea that the health of elderly individuals depends on exposure to various determinants at younger ages, that is, the life course approach to chronic disease epidemiology. 47 The so-called life course approach refers to the analysis of long-term effects of physical and social exposure during pregnancy, childhood, and adulthood on chronic disease risk.47–49 Applying it to obesity means that individuals with higher BMI are characterized by an excess risk of certain events, such as stroke or coronary heart disease, over the course of their life. In theory, obesity exposure could be calculated as the area under the lifetime BMI curve, in other words, weighting the time that each individual is in each BMI category; however, implementing this in a mathematical function is not currently feasible at an individual level because of the lack of data. In our model, the mathematical functions obtained from incidence data incorporated the whole-life exposure to obesity of individuals distributed by BMI category. This approach assumed that stroke and coronary heart disease incidence in 2013 resulted from the exposure of the 2013 Spanish population to obesity and various other determinants during people’s lifetime.
Once the base-case scenario had been validated by comparison with the real incidence, the only change incorporated into the no-obesity or overweight scenario was the distribution of BMI, which propagated a different exposure to obesity within the population model. That is, in this study, we have not measured the impact of different policies on the prevalence of obesity; rather, the model translates the change in the distribution of BMI of the population achieved by an intervention into a reduction in cardiovascular risk. In this way, the evaluation of a policy, or policies, is achieved by comparing results by exposure to the lifetime risk factors. The prevalence of obesity is likely to increase in the future, owing to past trends, yet that of hypertension has remained relatively stable since approximately 2000.48,49 As achieving an accurate prediction for these trends in the future is not feasible, we can evaluate the impact on the results considering different scenarios characterized by fixed levels of risk factors. In other words, the situation in 2013 reproduces the base-case scenario that is compared with a scenario in which obesity prevalence could be lower or higher. By taking into account individual risk, the model translates the associated changes in risk factors (BMI) into population rates. It also provides an estimate of the overall burden of obesity as a challenge to health service budgets and public health.
This discrete event simulation model was developed following a framework distinguishing between first and second order in the analysis of uncertainty in the modeling. 25 Specifically, a random parameter was included in all the functions to reflect first-order uncertainty. Nonetheless, dealing with stochastic uncertainty is challenging because of the high computational effort required to run multicohort models. 50 Second-order uncertainty was achieved through PSA for all parameters estimated from individual-level databases, which included the probability of being in each socioeconomic status or BMI category, survival function parameters, and utility values.24,51 PSA poses a great challenge for public health models given its computational requirements, and alternatives to avoid it have been proposed to achieve second-order uncertainty. 50 Although the long computation time was a challenge to overcome, the 2-phase approach allowed us to successfully process the PSA and obtain the results. Moreover, the use of a free tool (R software) and standard personal computers to program both phases of the PSA implementation make the process readily reproducible.
We recognize that this model has certain limitations. First, the calibration process was run in a 10-simulation model to reduce the computation time.35,50 Second, we did not take into account either the level of risk according to BMI trajectories as described by Ward et al. 52 or some of the features required to reproduce individual risks such as cholesterol level or blood pressure. Nonetheless, the conceptual model included all the key elements necessary to estimate the cardiovascular events of BMI subgroups within the Spanish population. This level of detail seems sufficient to evaluate public health policies, although not necessarily individual interventions. Third, the computation approach to achieve the PSA required a long run time. Fourth, we applied a simple model when estimating the disutilities associated with several comorbidities of individuals without taking into account that the relationship between the conditions could be additive or multiplicative.
Public health models are designed from the outset to assess different policies tackling a health population problem of interest. This multipurpose aim was achieved in our work in that the model is able to estimate the impact of any intervention modifying obesity distribution in the population. As an example, we considered a hypothetical policy that would achieve a huge effect. Although it is not realistic to believe that such a disruptive intervention for obesity that modifies the BMI distribution dramatically is going to become available, it serves to illustrate the capacity of the model to measure the impact on cardiovascular events at the population level of 2 scenarios and monitor the sensitivity of the model to changes.
Conclusion
This obesity simulation model evidenced good properties to adequately estimate the long-term epidemiological and economic impact of policies implemented to tackle obesity in the Spanish population. Nonetheless, the conceptual model could be implemented for other countries using country-specific input data.
Supplemental Material
sj-docx-1-mdm-10.1177_0272989X211032964 – Supplemental material for Development and Validation of a Discrete Event Simulation Model to Evaluate the Cardiovascular Impact of Population Policies for Obesity
Supplemental material, sj-docx-1-mdm-10.1177_0272989X211032964 for Development and Validation of a Discrete Event Simulation Model to Evaluate the Cardiovascular Impact of Population Policies for Obesity by Arantzazu Arrospide, Oliver Ibarrondo, Iván Castilla, Igor Larrañaga and Javier Mar in Medical Decision Making
Footnotes
Acknowledgements
We would like to acknowledge the help of Ideas Need Communicating Language Services in improving the use of English in the manuscript.
The authors declared no potential conflicts of interest with respect to the research, authorship, and/or publication of this article. The authors disclosed receipt of the following financial support for the research, authorship, and/or publication of this article: Financial support for this study was provided in part by a grant from Department of Health of Government of the Basque Country (file 201411107) and the Instituto de Salud Carlos III through project “PI14/01624” (co-funded by the European Regional Development Fund/European Social Fund “A way to make Europe”/”Investing in your future”). The funding agreement ensured the authors’ independence in designing the study, interpreting the data, writing, and publishing the report.
Research Ethics
It was not necessary to obtain either informed consent or ethical approval since this study does not include identifiable patient data.
References
Supplementary Material
Please find the following supplemental material available below.
For Open Access articles published under a Creative Commons License, all supplemental material carries the same license as the article it is associated with.
For non-Open Access articles published, all supplemental material carries a non-exclusive license, and permission requests for re-use of supplemental material or any part of supplemental material shall be sent directly to the copyright owner as specified in the copyright notice associated with the article.