
Abstract
Keywords
Background
Health economic evaluations compare 2 or more alternative courses of action in terms of costs and consequences. For instance, cost-effectiveness analyses can evaluate if a new health care strategy is preferred over the existing strategy (i.e., considering it cost-effective) by comparing costs and health benefits of the strategies. 1 However, the decisions are often surrounded by considerable uncertainty, which arises from insufficient information about important aspects of the disease process and the different health care strategies under study. The assessment of an uncertain decision involves expressing how confident we are about the best course of action given current information and identifying the most important targets for information gathering through new research. 2
Several methods have been developed to characterize the sensitivity and uncertainty in health care decisions. 1 Traditionally, the impact of parameter uncertainty has been explored using a deterministic approach. Input parameter values are varied one at a time, or several at a time, over plausible ranges to test a model outcome’s responsiveness to these variations. 3 A special case of deterministic sensitivity analysis is deterministic threshold analysis (DTA), which determines the input parameter value at which the preferred health care strategy changes, and is referred to as “the parameter threshold value.”1,2,4 Threshold analysis is typically used to determine the price at which a health care strategy becomes cost-effective, but it can also be used, for instance, to determine the minimum disease incidence at which a health care strategy would be cost-effective in a given setting. 5 Deterministic threshold analysis is straightforward for analysts and easily understood by decision makers. However, one of the major problems with only accounting for uncertainty in a deterministic way is that the estimated cost-effectiveness, and its associated threshold values, can be incorrect in the case of a nonlinear relationship between the input parameters and the model’s outcomes. 1
Probabilistic sensitivity analysis (PSA) can overcome this limitation.2,3 PSA accounts for the plausible values of uncertain input parameters as well as how likely each of these values are. The result of a PSA can be used to obtain an unbiased estimate of the expected value of the cost-effectiveness outcome and a quantification of the uncertainty around this outcome. In addition, the relationship between the uncertain input parameters and the corresponding uncertainty around the cost-effectiveness of a health care strategy can be assessed using a range of statistical methods, including value of information analysis. 6 McCabe et al. 7 proposed a probabilistic threshold analysis based on a 2-level Monte Carlo approach. In complex health economic evaluations, a 2-level Monte Carlo simulation can be computationally demanding.
We propose an efficient alternative to DTA, namely, a generalized additive model (GAM), that gives correct threshold values in the case of a nonlinear relationship between inputs and outputs of the health economic model while accounting for the uncertainty in all other input parameters. We evaluate the accuracy and computational efficiency of GAM in estimating threshold values by comparing it with the 2-level Monte Carlo probabilistic threshold analysis. Our working example is a recent peer-reviewed health economic evaluation of vaccination against typhoid fever. In this example, there is a nonlinear relationship between the uncertain input parameters and the corresponding cost-effectiveness of the typhoid vaccination program, which is due in part to the use of a dynamic transmission model. 8
Methods
Net Benefit as Measure for Cost-Effectiveness
A health economic evaluation compares the costs and health effects (such as deaths or disability-adjusted life-years [DALYs] averted) of alternative courses of action (including “current practice”). As such, it informs decision makers about the relative efficiency of a change in policy (e.g., the adoption of a new policy option). The relative efficiency of one policy option v. another is usually expressed as an incremental cost-effectiveness ratio (ICER) or as an incremental net monetary (or health) benefit. Throughout this article, we use incremental net monetary benefit (INB) as the measure of cost-effectiveness so that the threshold methods we propose are general applicable. Indeed, when uncertainty is accounted for in a probabilistic way, the expected ICER is only interpretable when comparing 2 decision options (e.g., new strategy v. current strategy) and when all incremental costs and effects are positive. 9 The INB is defined as
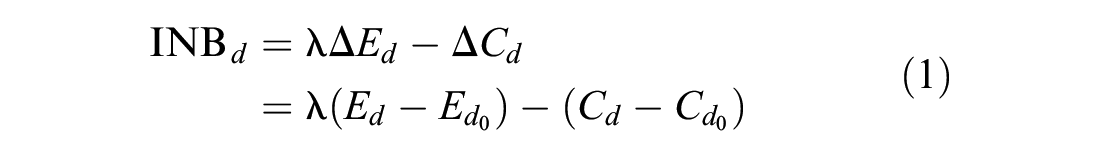
where
Usually, there is considerable uncertainty around the expected values of input parameters due to limited evidence on the expected costs and effects of a health care strategy
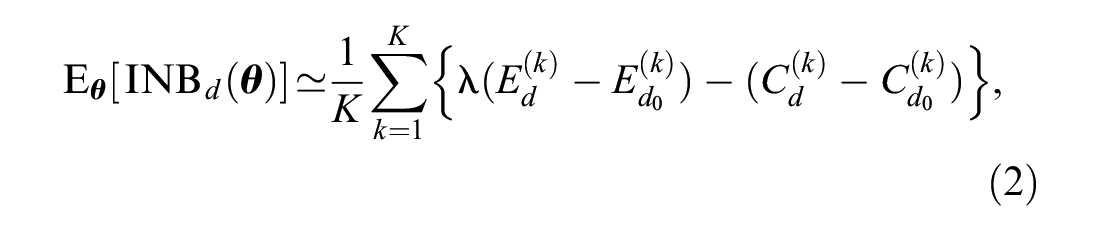
where
Definition of Threshold Value
The threshold value for a parameter
1. We can identify decision options,

2. There must be no decision option with expected net benefit, conditional on

for all
where
Deterministic Threshold Analysis
Deterministic threshold analysis seeks to identify the value of a parameter for which the optimal health care strategy changes while keeping all other input parameters constant. More formally, the deterministic parameter threshold value (
1.

2. There must be no decision option with net benefit (conditional on

for all
where
The analysis proceeds as follows11,12:
1. Define the uncertain parameter of interest,
2. Fix remaining input parameters
3. The threshold value
(a) Graphically: Vary the values
(b) Algebraically: Solve the linear system composed of 2 health economic models, one for
(c) Numerically: Vary over Sort the values of Set Determine the health care strategy with the highest Determine any value, Each
If the cost-effectiveness measure (
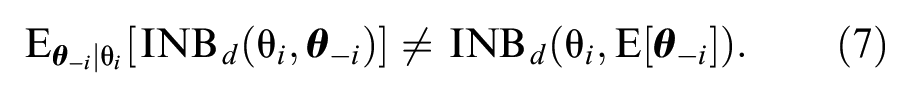
Consequently, a deterministic threshold analysis will result in an incorrect estimate of the threshold value
Probabilistic Parameter Threshold Analysis
When a deterministic threshold analysis results in incorrect estimates for
Two-Level Monte Carlo Approach
We can estimate the term
Two-Level Monte Carlo Scheme for Estimating Threshold Value
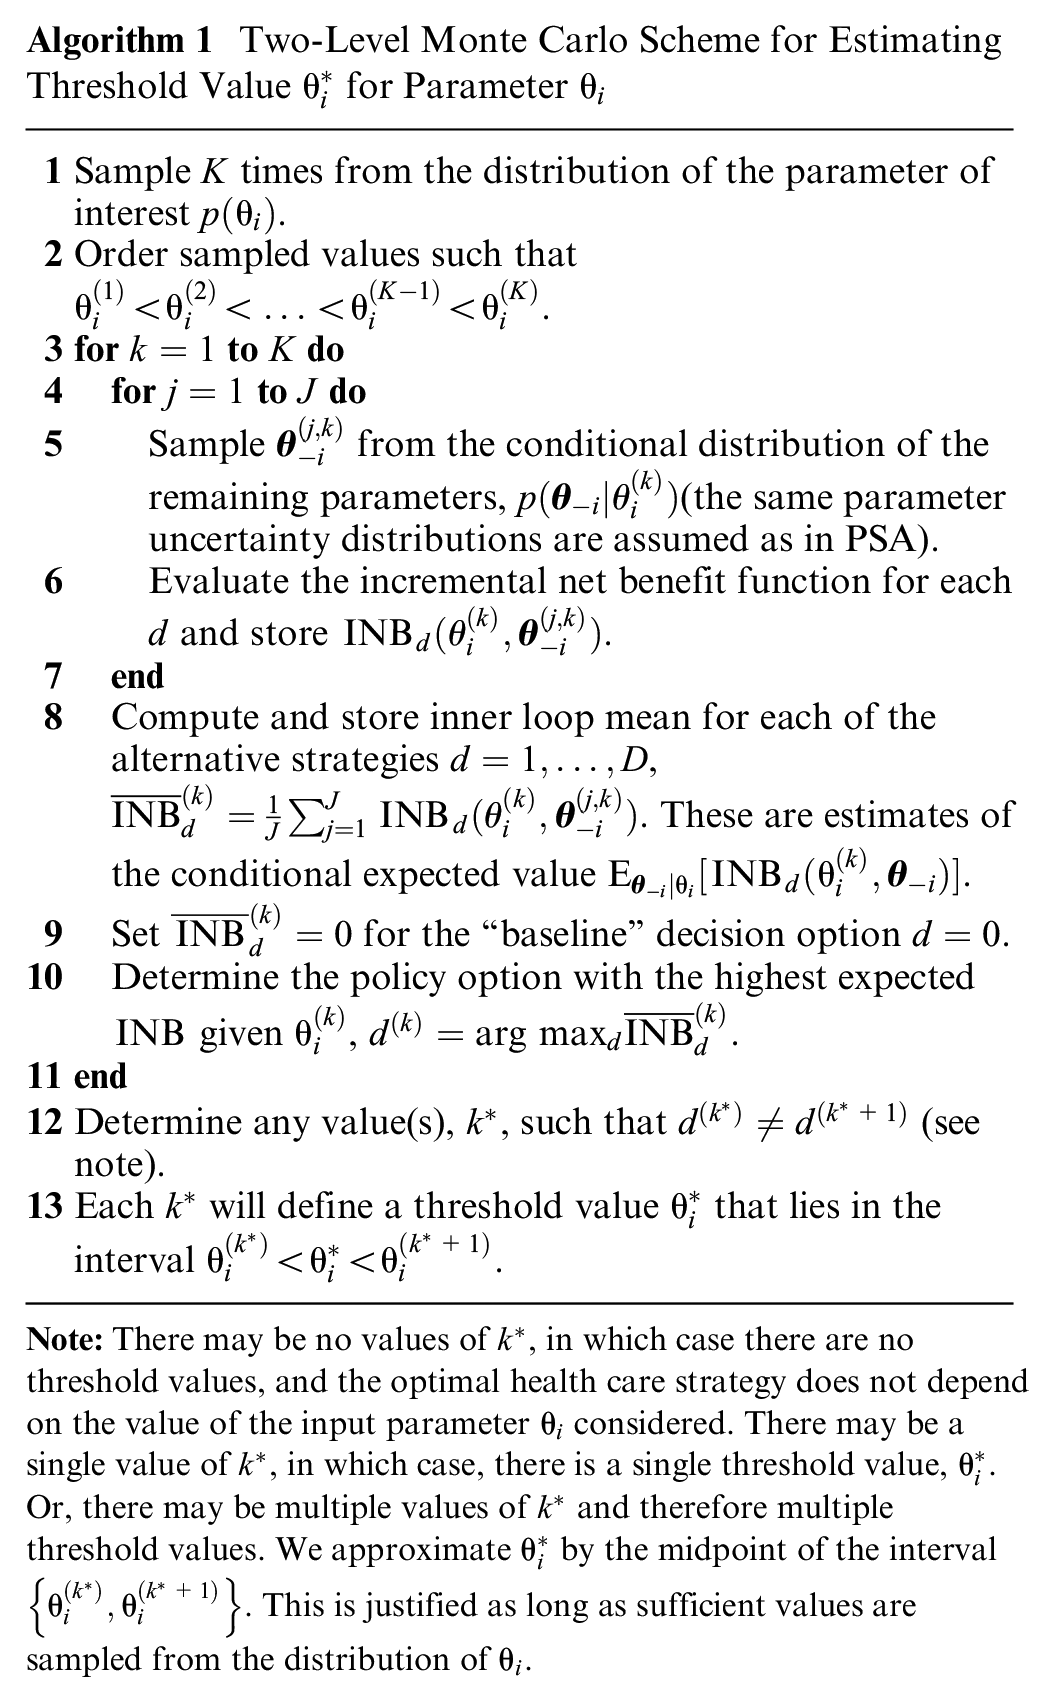
This approach is very computationally intensive for all models except for very simple models due to the need to evaluate the incremental net benefit function
Regression-Based Approach Using a Generalized Additive Model
As an alternative to the 2-level Monte Carlo approach, we propose a meta-model approach, based on a GAM, summarizing the relationship between the inputs and the outputs postsimulation. This regression-based approach only requires the PSA sample to correctly estimate
A GAM allows for flexible specification of the relationship between the


where equation (8) expresses the
We do not know the form of the unknown function

where
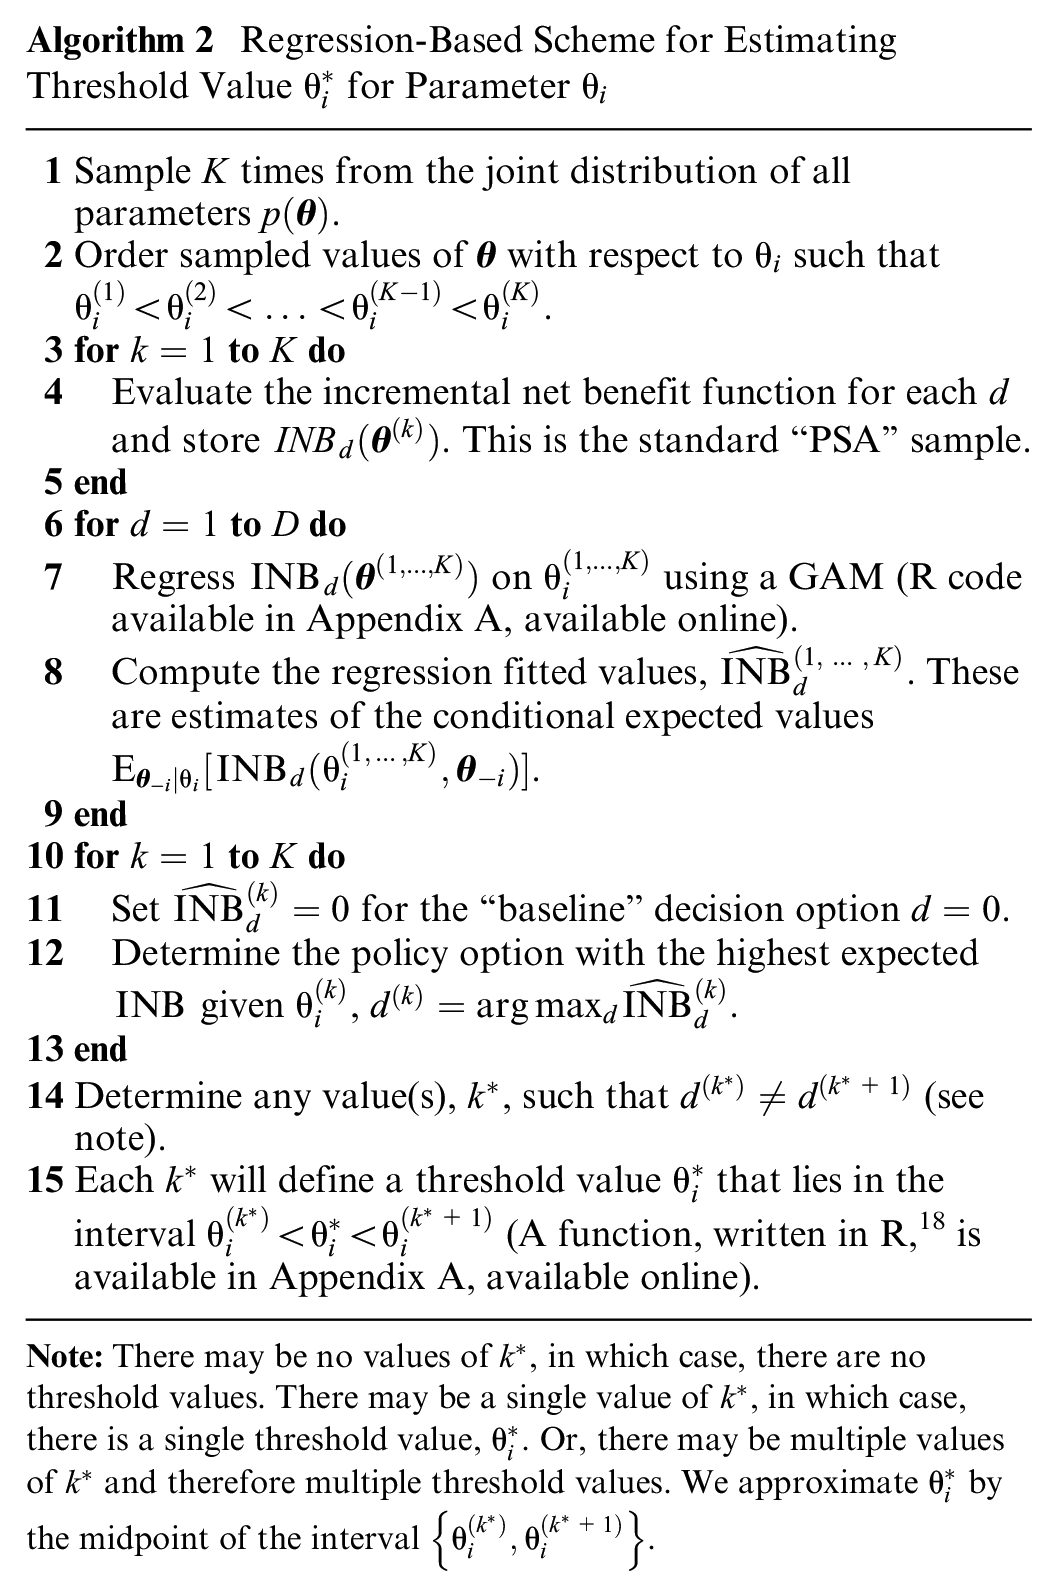
We propose algorithm 2 to obtain the parameter threshold value,
Regression-Based Scheme for Estimating Threshold Value
Quantification of Uncertainty
We use a bootstrap procedure to provide a measure of precision and accuracy of the parameter threshold value in the presence of possible model violations. We opted for a nonparametric bootstrap because it does not rely on asymptotic normality and hence will be applicable for a wider range of applications. If asymptotic normality holds, Strong et al.
14
described a method to obtain the standard errors directly from the GAM. The nonparametric bootstrap relies on sampling with replacement from the observed PSA sample
Depending on the bootstrap sample, a different number of parameter threshold values might arise compared to the original PSA sample, particularly when the input parameter does not influence the cost-effective strategy (i.e., low expected value of obtaining perfect information [EVPPI] value). To acknowledge this type of uncertainty about the number of threshold values, we denoted the number of bootstrap samples resulting in the same number of threshold values as the original PSA sample as
A Real-World Example
We chose a health economic evaluation comparing typhoid conjugate vaccination strategies in Gavi-eligible countries as a real-world example, in which there is a nonlinear and even nonmonotone relationship between some of the uncertain input parameters and the corresponding cost-effectiveness of the typhoid vaccination program. This example allowed us to illustrate the various possible outcomes of threshold analysis. The health economic evaluation aimed to inform decision makers on the cost-effectiveness of 3 different vaccination strategies compared to each other and to no vaccination (no vac;
We chose to obtain threshold values for uncertain input parameters for 3 countries (Nicaragua, Uganda, and Cambodia), assuming WTP values per DALY averted that allowed us to illustrate different possible outcomes (no threshold value, a single threshold value, and more than 1 threshold value).
We assessed parameter threshold values for 3 uncertain input parameters: typhoid case fatality risk when hospitalized (
Distributional Characteristics of the Uncertain Input Parameters
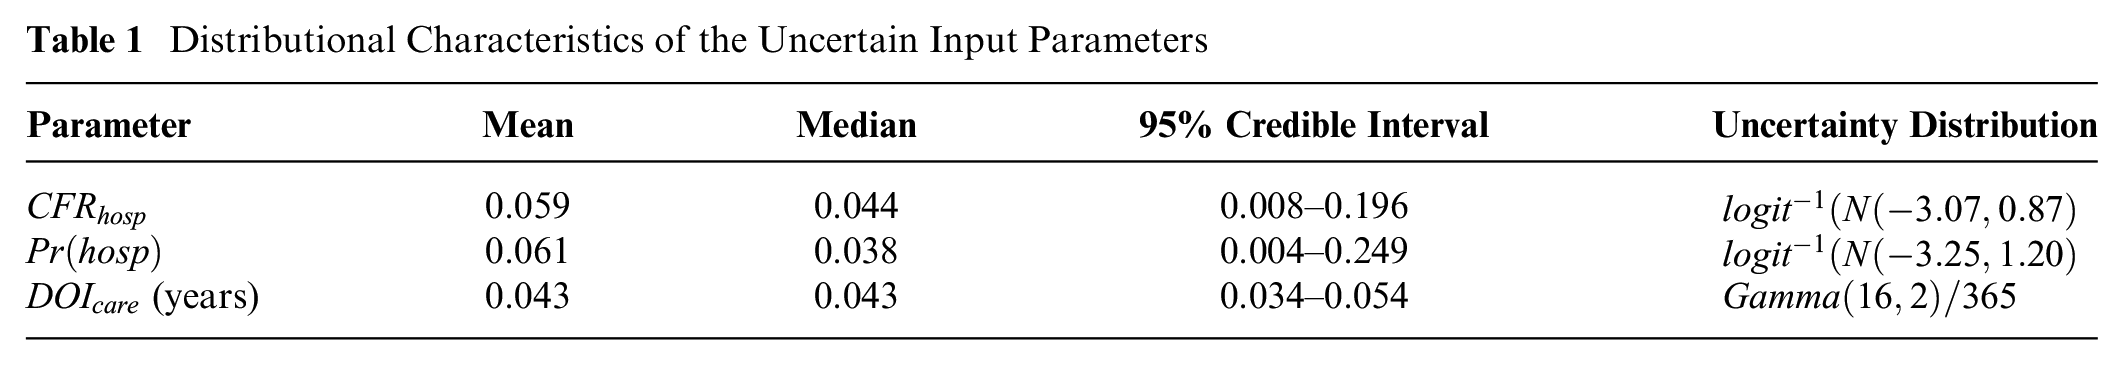
Table 1 shows the uncertainty distributions for the 3 input parameters considered in this article. The uncertainty distributions around the expected case fatality risk and probability for hospitalization are right skewed. Their means and standard errors are estimated from a random-effects meta-analysis. As a consequence of the logistic regression model, the standard errors are only available on the logit scale. After sampling from the normal distribution on the logit scale, the values are transformed to their original scale using the inverse logit (
Results
The appropriate method to perform threshold analysis depends on the features of the health economic model. Figure 1 presents a flowchart describing the most suitable method to carry out parameter threshold analysis. A GAM would be the most suitable method to obtain parameter threshold values in our example due to the nonlinear relationship between the uncertain input parameters and
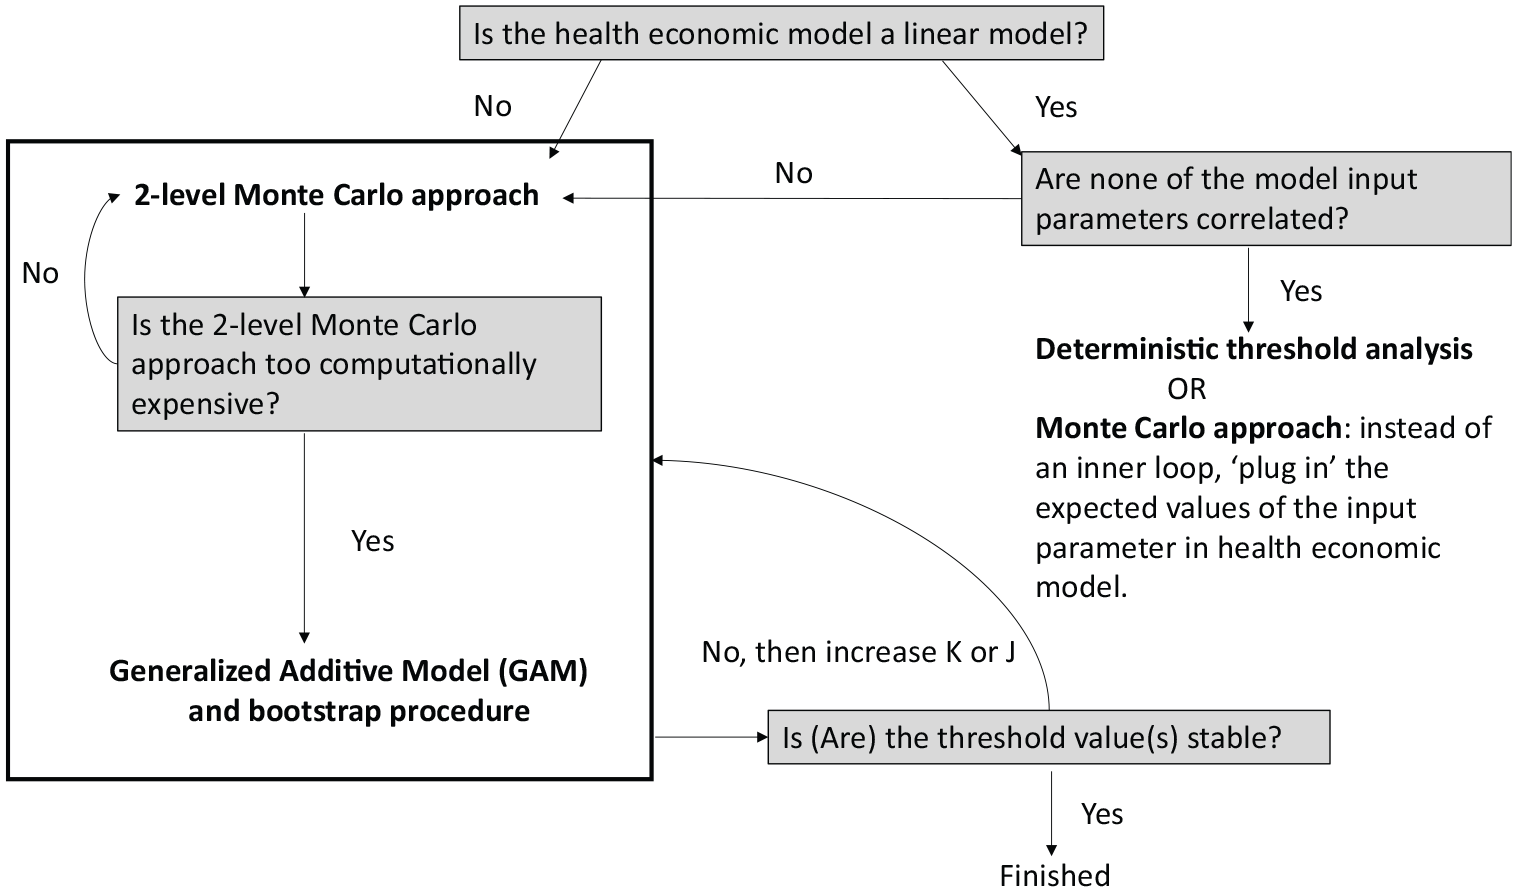
A guide for performing parameter threshold analysis.
Comparison of the Parameter Threshold Values Obtained with DTA, Adjusted 2-Level MC Approach, and GAM for Different Settings a
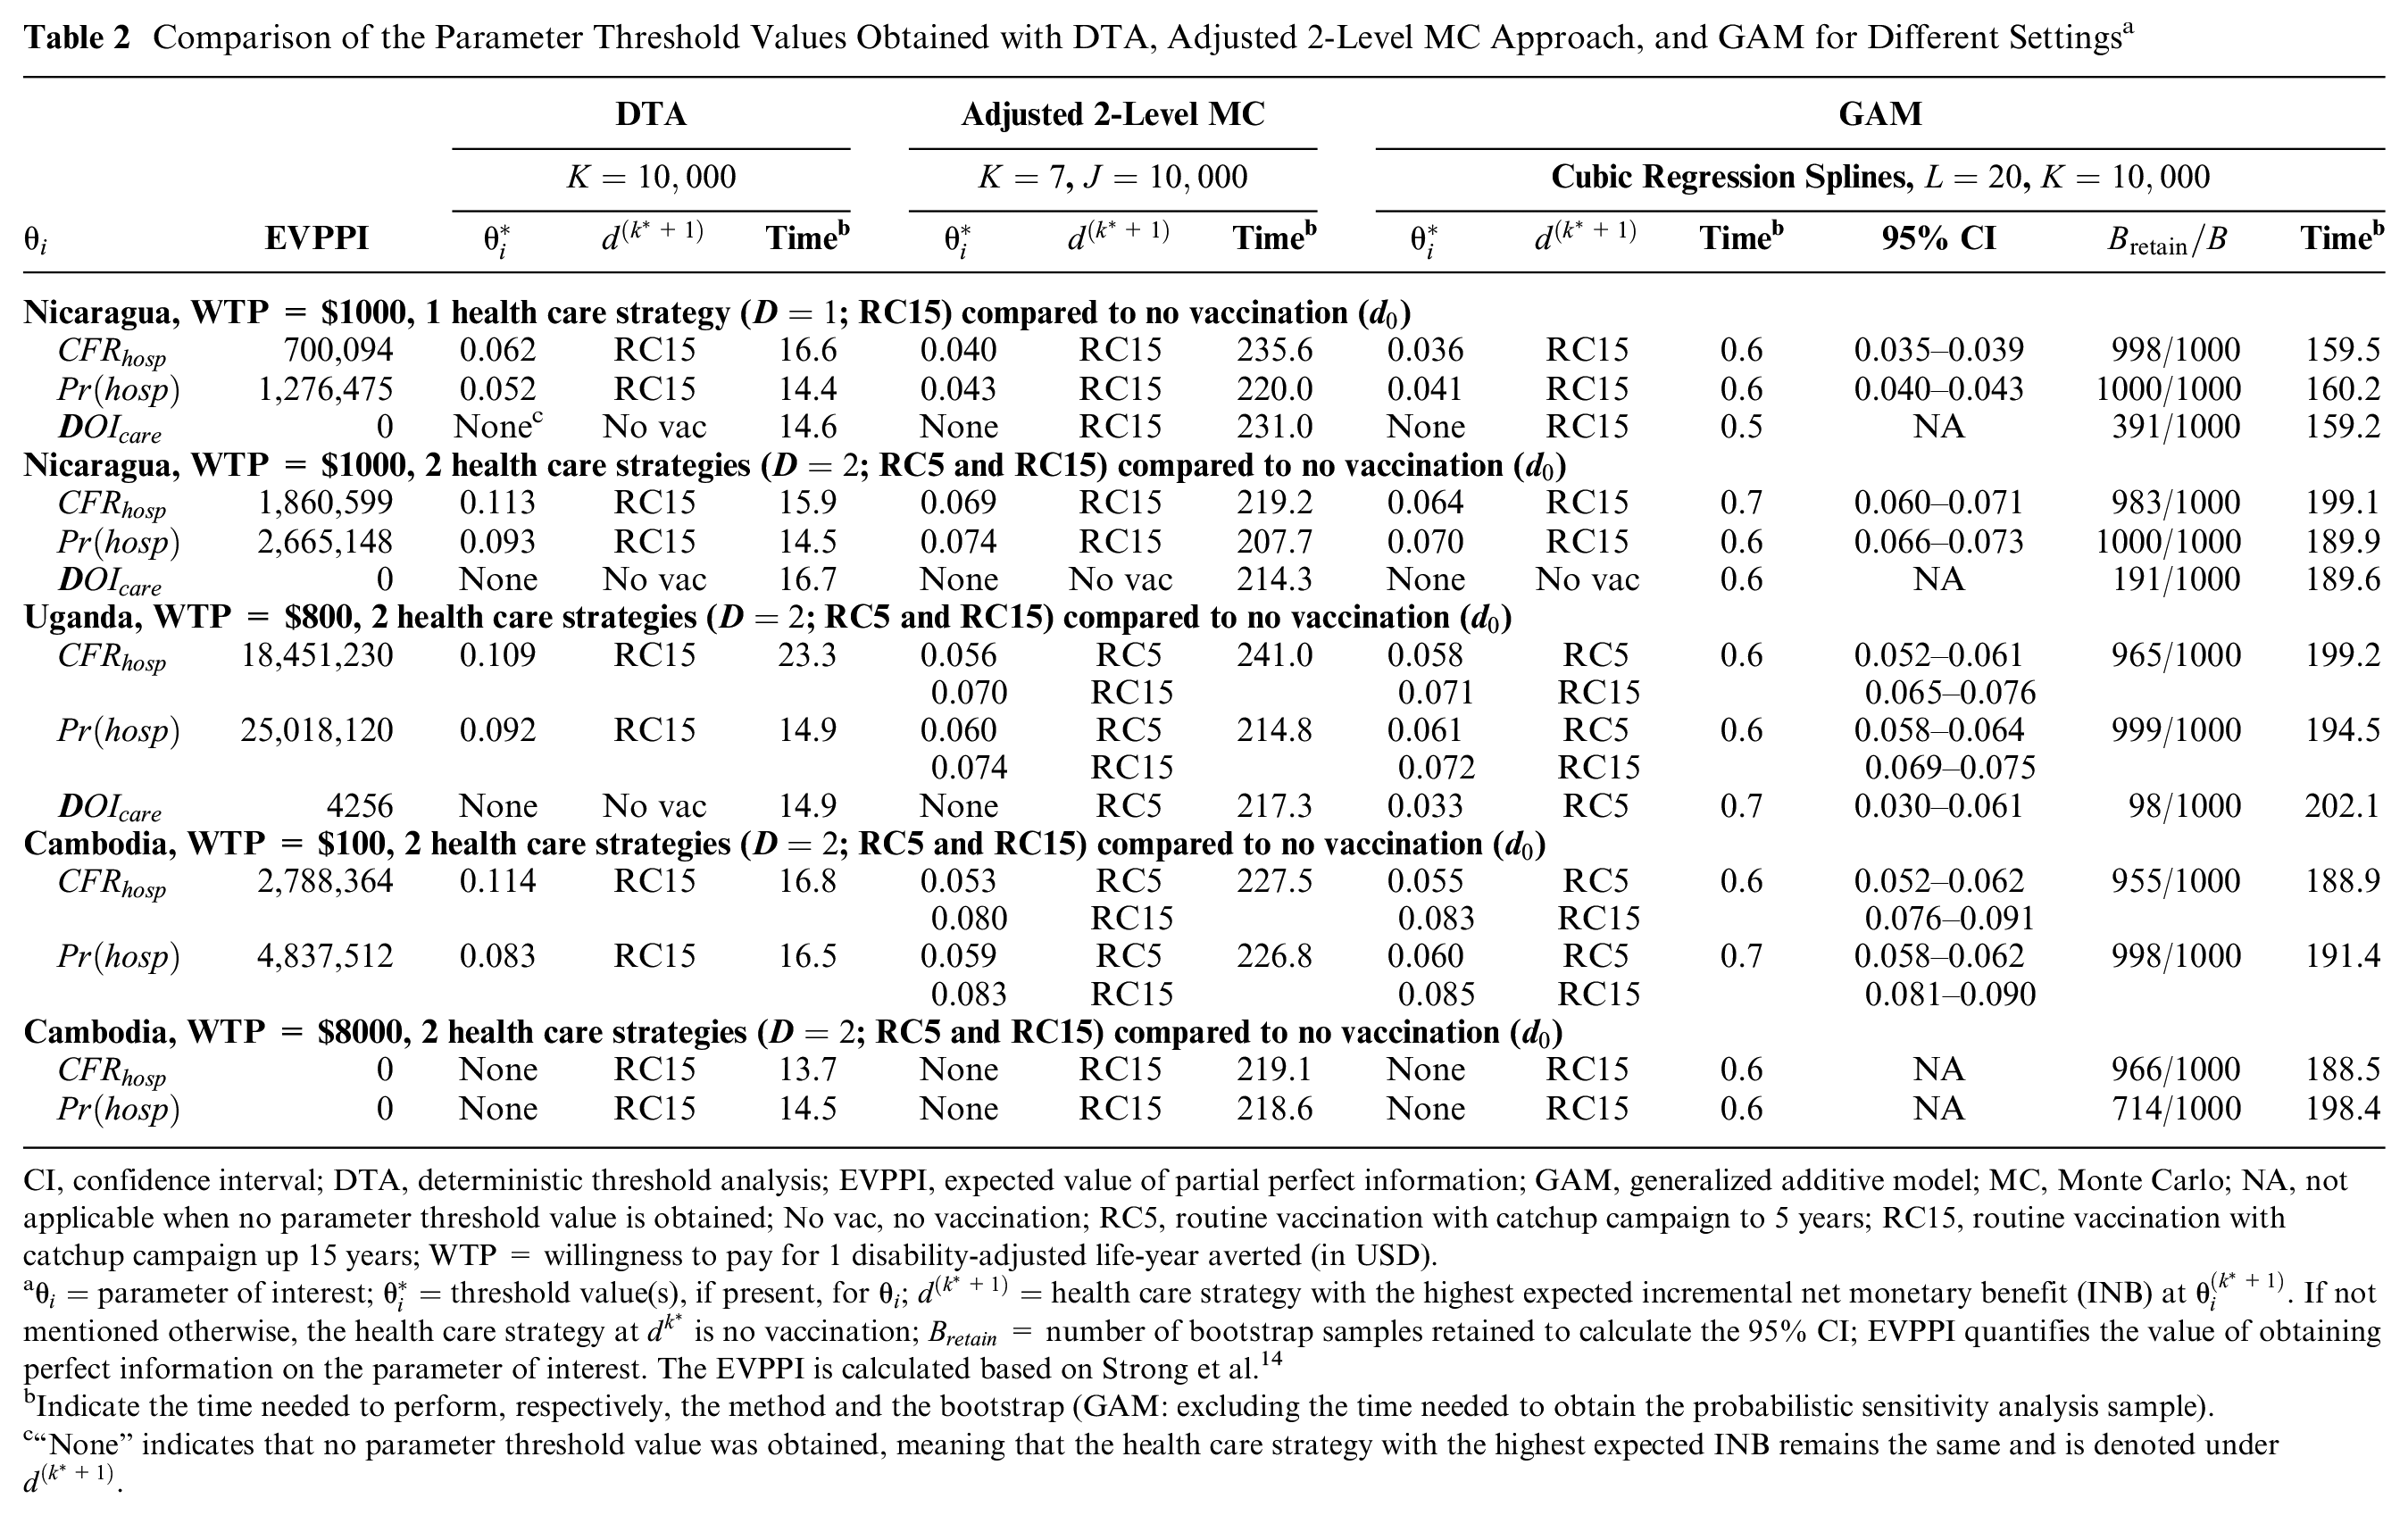
CI, confidence interval; DTA, deterministic threshold analysis; EVPPI, expected value of partial perfect information; GAM, generalized additive model; MC, Monte Carlo; NA, not applicable when no parameter threshold value is obtained; No vac, no vaccination; RC5, routine vaccination with catchup campaign to 5 years; RC15, routine vaccination with catchup campaign up 15 years; WTP = willingness to pay for 1 disability-adjusted life-year averted (in USD).
Indicate the time needed to perform, respectively, the method and the bootstrap (GAM: excluding the time needed to obtain the probabilistic sensitivity analysis sample).
“None” indicates that no parameter threshold value was obtained, meaning that the health care strategy with the highest expected INB remains the same and is denoted under
Deterministic threshold analysis is computationally faster than the adjusted 2-level Monte Carlo approach but slower than GAM. In this example, it consistently overestimates the value of
GAM is able to calculate the threshold value(s) in a fraction of the time that is needed for the adjusted 2-level Monte Carlo approach. Although the bootstrap procedure is time-consuming, GAM is still faster than the adjusted 2-level Monte Carlo approach.
There is a good agreement between GAM and the adjusted 2-level Monte Carlo approach. In most settings, the 2 approaches provide a parameter threshold value that is precise up to 2 decimals, with the exception of the input parameter
For Cambodia, we considered 2 different WTP values, $100 and $8000. When we considered a WTP value of $100, both the adjusted 2-level Monte Carlo approach and GAM find 2 threshold values. For the higher WTP value, no parameter threshold values are found. This was expected, since the EVPPI was low at the higher WTP value.
Discussion
We propose GAM as a novel regression-based approach to calculate a parameter’s threshold value(s) in health economic evaluations. The GAM approach only requires the PSA sample of a cost-effectiveness analysis and is flexible, easy to use, and computationally efficient. In our example, GAM does not provide incorrect threshold values or fails to find threshold values (as the deterministic approach does). GAM also outperforms the 2-level Monte Carlo approach in terms of computational time.
GAM has several advantages over the existing methods. First, GAM results in the same threshold values as the adjusted 2-level Monte Carlo approach when cost-effectiveness measures are nonlinearly related to the inputs, unlike the deterministic threshold analysis. Our example (Table 2) showed that threshold values were overestimated and that not all threshold values were identified with the deterministic threshold approach. Therefore, threshold values obtained from a deterministic threshold analysis should not be interpreted when there is a nonlinear relationship between inputs and outputs. Second, GAM is easy to use because it relies on the PSA sample to account for uncertainty in the input parameters’ distribution, and there is no need to assume plausible values as in the deterministic threshold approach.
21
Third, GAM is computationally fast compared to the 2-level Monte Carlo approach. In order to perform the 2-level Monte Carlo approach, we needed at least 208 seconds for
There are some limitations of this work. First, we performed the comparison of the 3 threshold approaches on only 1 example. However, this proved to be sufficient to show the incorrectness in the deterministic threshold values. Second, we were limited in the number of samples we could use in the 2-level Monte Carlo approach because running our health economic evaluation was computationally too intensive. Thus, we could not perform a complete 2-level Monte Carlo method on a normal personal computer. The focus of this article was not to optimize the 2-level Monte Carlo method but rather to use it as a comparison for the alternatively proposed GAM method. Complex evaluations, including dynamic transmission models, numerous intervention options, multiple countries, and considering a long time horizon, will become more common in the future. This in itself is an important reason for using GAM. But increasing the computational efficiency of complex models will also be helpful here. Third, although we use bootstrapping to provide a measure of uncertainty about the threshold value (and therefore avoid making assumptions of normality and homoscedasticity of the regression residuals), the nonparametric bootstrap itself has a limitation due to the nature of the statistic we are interested in. Due to sampling with replacement, it is possible that more or fewer parameter threshold values arise compared to the number obtained from the original PSA sample.
Parameter threshold analysis provides a useful and intuitively appealing source of information to inform policy makers and developers of technology. For example, threshold analysis can help to identify the maximum price that a government might be willing to pay for a drug. Such information can be used to inform research and development prior to drug licensing or price setting prior to marketing but also—and probably currently most frequently—to inform price negotiations when drugs (or other health care technology) are considered for reimbursement. 22 We showed that this price could be under- or overestimated when based on deterministic threshold analysis. Furthermore, while EVPPI allows for the identification of uncertain input parameters that affect most on the optimal strategy, 2 threshold analysis can single out more precisely at which values of an uncertain parameter the optimal strategy changes. This could inform the design of new trials to obtain more information about a particular uncertain parameter. Also, the threshold parameter value directly informs researchers and decision makers about the (change in) optimal strategy when a more precise estimate becomes available for a particular uncertain parameter based on new evidence. We believe that parameter threshold analysis has a wide range of applications, even beyond the field of health economics.
However, we recommend caution in instances where the parameter of interest is a noninfluential parameter (i.e., when it has a low EVPPI value). As shown in our example for
In conclusion, we provide a flexible, easy to code, and fast alternative to the 2-level Monte Carlo approach for parameter threshold analysis. The GAM method provides correct estimates of parameter threshold value(s) when there is a nonlinear relationship between the uncertain input parameter of interest and the outcome of the health economic model. In this study, we only considered the threshold value for a single parameter. In the future, the GAM-based method could be extended to incorporate more than 1 parameter to conduct simultaneous multiparameter threshold analysis.
Supplemental Material
Supplement_Probabilistic_Threshold_Analysis_20202525.rjf_online_supp – Supplemental material for A Computationally Efficient Method for Probabilistic Parameter Threshold Analysis for Health Economic Evaluations
Supplemental material, Supplement_Probabilistic_Threshold_Analysis_20202525.rjf_online_supp for A Computationally Efficient Method for Probabilistic Parameter Threshold Analysis for Health Economic Evaluations by Zoë Pieters, Mark Strong, Virginia E. Pitzer, Philippe Beutels and Joke Bilcke in Medical Decision Making
Footnotes
The author(s) declared the following potential conflicts of interest with respect to the research, authorship, and/or publication of this article: VEP is a member of the WHO Immunization and Vaccine-Related Implementation Research Advisory Committee (IVIR-AC). The remaining authors declare that there is no conflict of interest.
The author(s) disclosed receipt of the following financial support for the research, authorship, and/or publication of this article: Financial support for this study was provided in part by grants from the Bill and Melinda Gates Foundation (OPP1116967, OPP1151153) (VEP), Research Foundation–Flanders (JB), and the Methusalem financing program of the Flemish government (ZP). The funding agreements ensured the authors’ independence in designing the study, interpreting the data, writing, and publishing the report.
References
Supplementary Material
Please find the following supplemental material available below.
For Open Access articles published under a Creative Commons License, all supplemental material carries the same license as the article it is associated with.
For non-Open Access articles published, all supplemental material carries a non-exclusive license, and permission requests for re-use of supplemental material or any part of supplemental material shall be sent directly to the copyright owner as specified in the copyright notice associated with the article.