
Abstract
Keywords
Decision-analytical models are increasingly used to extrapolate individual-participant data (IPD) from randomized controlled trials (RCTs). For chronic diseases, extrapolation is almost unavoidable, as interventions can take many years before they have a measurable impact on clinical outcomes. Extrapolation may also be needed when the primary outcome of a trial is a proxy or intermediate outcome, such as a change in a known risk factor. It is particularly relevant for economic evaluations, which generally need to use a lifetime time horizon and estimate outcomes such as life expectancy or quality-adjusted life years (QALYs). 1 Patient-level simulation (PLS) models are now in routine use. For example, in the United Kingdom Prospective Diabetes Study Outcomes Model version 2 (UKPDS-OM2), patient characteristics and prior events affect the risk or consequences of subsequent events in type 2 diabetes.2,3 Such dependencies are more difficult to capture in aggregate “cohort” models. Furthermore, when PLS models are used to extrapolate IPD, it becomes easier to capture heterogeneity and to account for the effect of patient history on the risk of subsequent events. By modeling the entire distribution of risk factors rather than the “average” patient, such models can also allow for nonlinear effects of patient characteristics on model outcomes and allow for treatment changes that are based on individual rather than aggregate outcomes.4,5
The increased flexibility offered by PLS models comes at the expense of greater computational burden and additional complexity concerning how to handle uncertainty in the resulting estimates of cost-effectiveness or life expectancy. The reporting of uncertainty is often far from transparent. For example, although uncertainty in economic evaluations arises from several different sources, few published analyses attempt to systematically decompose the various contributions to overall uncertainty. Several publications have attempted to define taxonomies for either trial- or model-based economic evaluations,6–8 but these existing taxonomies do not explicitly discuss uncertainty arising from missing data and do not make specific recommendations on how uncertainty in PLS models should be handled.
Studies that combine IPD and model-based extrapolations are subject to the uncertainties inherent within both types of analyses. Extrapolating RCT data using a model requires combining data from 2 distinct time periods: observed IPD over the within-trial period in which specific individuals are followed up on assigned interventions and simulated IPD during the modeled posttrial period in which outcomes depend not only on patient characteristics but also on model parameters. However, there has been little research on methods for combining uncertainty in this context, in contrast to the well-established methods for combining different types of uncertainty within multiple imputation.9,10
Our study aims to offer suggestions for improving analytic methods and reporting standards for PLS-based extrapolations of trial data by 1) developing and comparing methods for combining sampling uncertainty and parameter uncertainty and 2) assessing the impact of including stochastic uncertainty. After setting out general principles, we compare different methods in a simulation study based on a case study in which the UKPDS-OM22,3 was used to extrapolate results of an RCT (the Atorvastatin in a Factorial design with Omega-3 fatty acids on cardiovascular Risk Reduction in patients with Type 2 Diabetes study, AFORRD 11 ).
Uncertainty for Studies Extrapolating Trial Data Using PLS
We combined published taxonomies categorizing the types of uncertainty affecting model-based6,7 and trial-based7,8 economic evaluations (Table 1). In this article, we focus on methods to combine sampling uncertainty and parameter uncertainty. Parameter uncertainty comprises uncertainty around model inputs (e.g., utilities, costs, and probabilities) and is often handled using probabilistic sensitivity analysis (PSA).1,6,12
Taxonomy of the Types of Uncertainty Affecting Trial-Based Economic Evaluations and Other Studies Extrapolating Randomized Controlled Trial Data Using Patient-Level Simulation Models
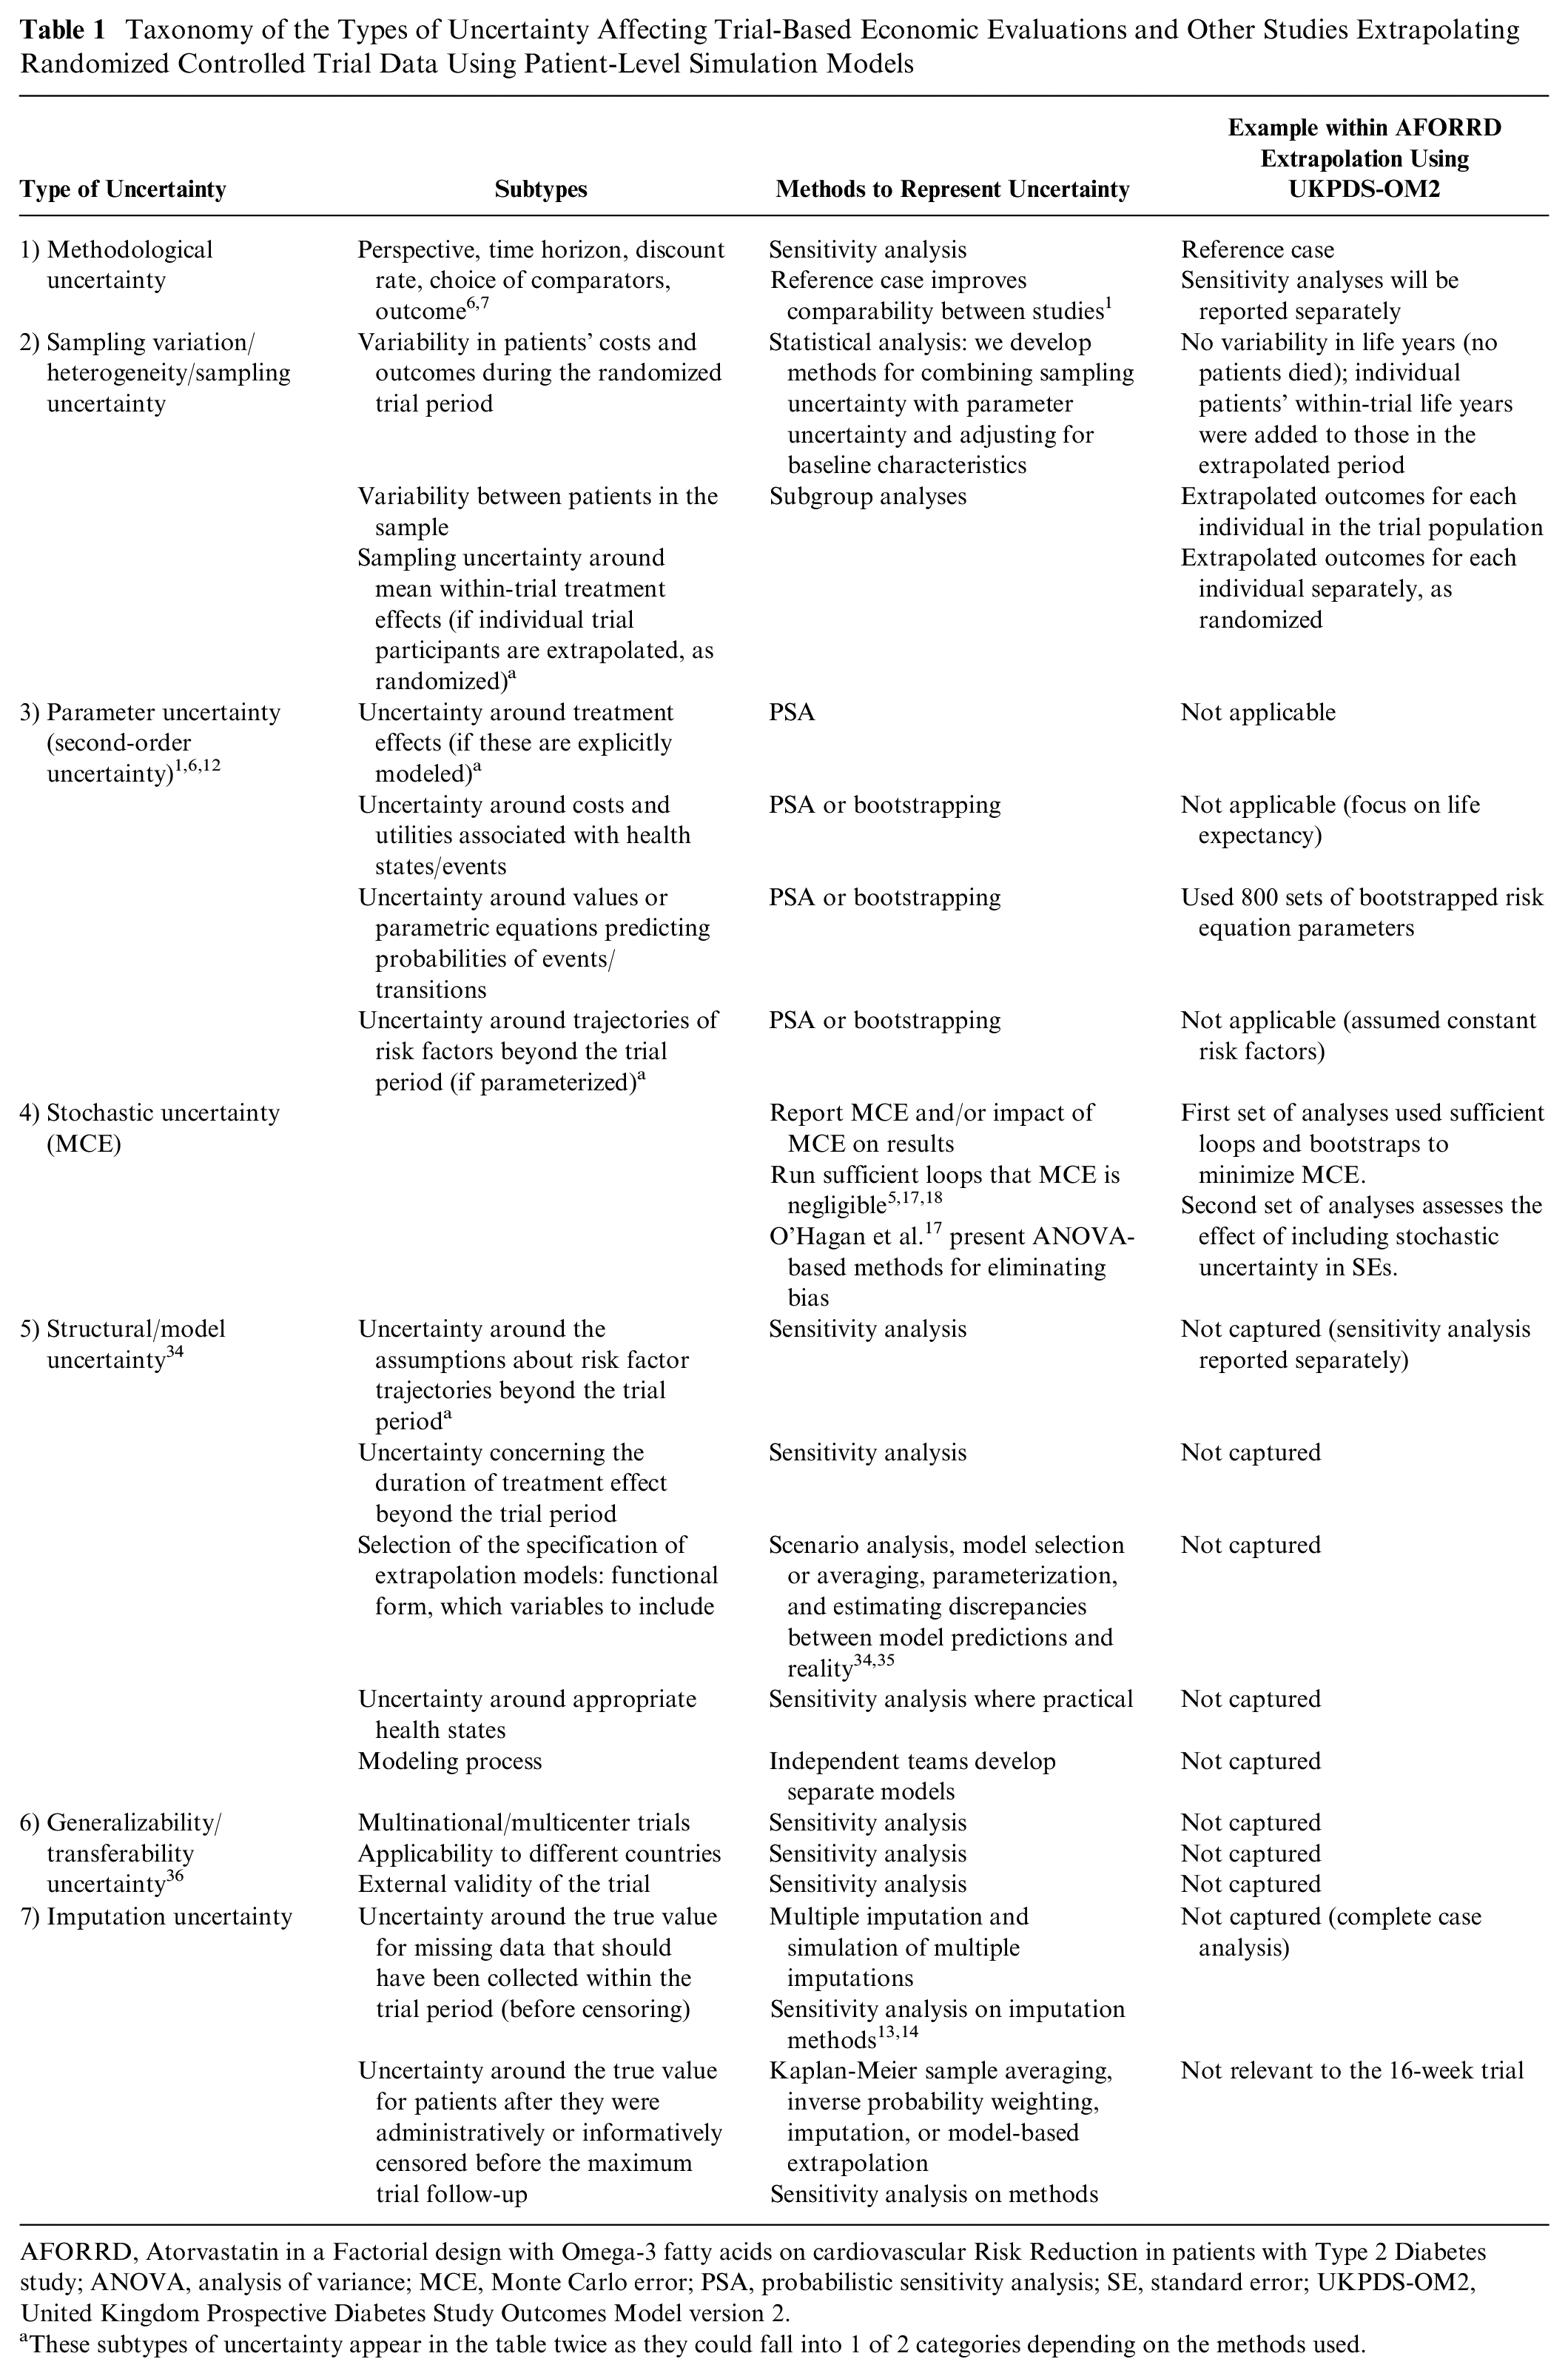
AFORRD, Atorvastatin in a Factorial design with Omega-3 fatty acids on cardiovascular Risk Reduction in patients with Type 2 Diabetes study; ANOVA, analysis of variance; MCE, Monte Carlo error; PSA, probabilistic sensitivity analysis; SE, standard error; UKPDS-OM2, United Kingdom Prospective Diabetes Study Outcomes Model version 2.
These subtypes of uncertainty appear in the table twice as they could fall into 1 of 2 categories depending on the methods used.
Both sampling variation and patient heterogeneity arise in studies using IPD or in model-based economic evaluations that extrapolate outcomes for a finite sample of nonidentical individuals. Trial outcomes will vary between individual participants by chance: for example, some patients will have events and others with identical risk factors will not. Unlike stochastic uncertainty within a PLS model, we cannot eliminate this chance variation by running millions of model runs. Some of the variability may be explained by patients’ baseline characteristics; this explainable variation is termed heterogeneity and could be dealt with using subgroup analysis and/or regression analyses. However, sampling uncertainty (i.e., nonzero standard errors [SEs]) around mean outcomes will remain even after controlling for all observed baseline variables, since RCTs use finite samples and do not provide perfect information. For example, there may be sampling uncertainty around the mean baseline and posttreatment characteristics of the sample of patients recruited to the trial and the absolute or incremental costs, life years, and QALYs accrued during the trial period; variations between patients at the start of the simulation will also propagate sampling uncertainty into estimates of mean costs or life expectancy in the period extrapolated using the PLS. When calculating SEs around mean outcomes for a group of patients, we need to use statistical methods to allow for the fact that the sample is finite and was sampled from a larger population, particularly when estimating differences between treatments.
Methods for Quantifying and Combining Parameter and Sampling Uncertainty
When analyzing results, it is necessary to combine different forms of uncertainty to produce an overall SE or 95% confidence interval (CI) around estimates of mean lifetime outcomes. i However, methods to do so are currently underdeveloped. Several methods could be used to combine parameter and sampling uncertainty.
Rubin’s rule9,10 is widely used following multiple imputation of missing data to combine uncertainty around imputed values with sampling variation from a trial.13,14 This method involves adding the variance between imputed data sets to the variance within each imputation.9,10 PLS models, such as the UKPDS-OM2, can be viewed as a form of multiple imputation, in which the model is used to predict or impute missing values for all participants after the end of the trial, with the model predictions using M sets of model parameters (sampled using PSA or bootstrapping) representing M imputations. On that basis, the original application of UKPDS-OM version 1 (UKPDS-OM1) adjusted 95% CIs to take account of the variance within and between different bootstraps using Rubin’s rule,3,15 although to our knowledge, no such adjustment has been made in any subsequent application of UKPDS-OM1 or UKPDS-OM2.
In multiple imputation, it is recommended that imputed values include random components that take into account the SEs around the regression coefficients predicting the missing values (i.e., parameter uncertainty), the residuals from the regression (i.e., stochastic uncertainty), and the patients’ characteristics (i.e., heterogeneity).13,16 In PLS models, stochastic (or first-order) uncertainty arises because the occurrence of an event depends on both its probability and chance, via Monte Carlo methods, 6 and is measured using Monte Carlo error (MCE). If we view the PLS as a “multiple imputation” model, it could be argued that MCE should be included to mirror the lifetime trial data that are “missing.” However, in general, it is recommended that PLS models eliminate MCE by running large numbers of Monte Carlo trials and averaging the results to produce consistent outcomes5,6,17,18: otherwise, MCE will bias and inflate SEs. 17 This approach views stochastic uncertainty as random noise resulting from the computer simulation, rather than genuine uncertainty around the evidence or methods.
Alternative approaches can also be used to combine parameter and sampling uncertainty. In the variance sum law, uncertainty around 2 random variables is combined by summing the variances (minus any covariance) to calculate the variance around the sum or difference between the variables. Similarly, analysis of variance (ANOVA) partitions variances into different factors that can be summed together. 19 Nonparametric techniques, such as bootstrapping, can also be used to combine uncertainty around correlated endpoints.3,8 Parametric methods such as PSA 8 or Markov chain Monte Carlo 20 may also be used to synthesize data from different sources and quantify uncertainty, although these are outside the scope of the current study since they cannot easily be applied to the way that we extrapolated trial data using the UKPDS-OM2.
There may also be chance differences in baseline characteristics between randomized groups. It is well established that baseline imbalance in EQ-5D utility biases estimates of incremental QALYs, since baseline utility is directly included in the estimates of QALYs for each patient. 21 However, to our knowledge, it has not previously been recognized that the same is true for baseline imbalance in the risk factors used to extrapolate IPD within PLS models like the UKPDS-OM2. For example, if the patients in the control arm of an RCT are older than in the treatment group, this chance difference will increase event rates and decrease life expectancy and QALYs within the control arm as event rates and mortality increase with age in the model; unless we adjusted for this baseline imbalance, we would therefore overestimate the benefits of treatment. Appendix 1 gives a worked example illustrating this bias. In practice, it is unlikely that any RCT will be perfectly balanced for all 17 risk factors in UKPDS-OM2, and the combined effect of multiple interacting risk factors may be difficult to predict. Baseline imbalance could also introduce similar biases for within-trial outcomes that are correlated with baseline characteristics, 22 although the problem may be greater for models where the structure imposes/formalizes relationships between end-of-trial characteristics and outcome. Baseline imbalance will decrease with increasing sample size, 23 and its impact will depend on the correlation between baseline variables and outcome. 22 It may have a greater effect on posttreatment endpoints 22 or absolute differences in event rates, life years, QALYs, or costs compared with relative effects (e.g., hazard ratios) or changes in intermediate endpoints (e.g., change in blood pressure).
Adjusting for baseline covariates can also increase precision.22,24–26 However, it is essential to ensure that analyses are adjusted only for data observed before randomization, rather than risk factors that may have been affected by an intervention.
Given the matrix of predicted outcomes for each parameter set with each patient, it is possible to estimate regression models that adjust for baseline covariates using several convenient Stata commands (e.g.,
Methods
Case Study
AFORRD (ISRCTN: 76737502) was a 1-year factorial double-blind RCT in which 800 patients with type 2 diabetes and no history of cardiovascular events were randomized to 20 mg atorvastatin or placebo and, simultaneously, to omega-3 EE90 or placebo.11,27 General practices were also cluster-randomized to receive a paper-based behavioral intervention intended to increase compliance with study medication or to standard care. 27 Since high-risk patients in both arms were given additional atorvastatin after week 16, 11 we extrapolated 16-week clinical outcomes for 30 years and focus here on a simple comparison of total undiscounted life expectancy between atorvastatin and no atorvastatin, with no adjustment for clustering. A 30-year time horizon was chosen to cover the life expectancy of the average trial participant (mean age, 64 years) while minimizing simulation time. We assumed that all risk factors other than age and event history would remain constant at the values observed at the end of the 16-week trial period. ii For simplicity, we used a complete-case analysis, including only the 732 patients with complete 16-week clinical data. Mean imputation was used for the 36 patients with missing baseline EQ-5D utility. Smoking status was assumed to be the same as at baseline for 3 patients with missing data on smoking status at week 16. All other 16-week data were either fully observed (if the patient attended the 16-week visit) or completely missing. A full economic evaluation reporting sensitivity analyses will be reported separately.
We predicted life expectancy for each individual participating in AFORRD based on their 16-week risk factor data using an adapted version of the UKPDS-OM2 that saved the outputs required for our regression analyses.
The UKPDS-OM2 is a second-generation lifetime individual-patient state transition model for people with type 2 diabetes mellitus.2,28 It was constructed using IPD from up to 89,760 patient years of follow-up in the UKPDS. UKPDS-OM2 simulates the occurrence of death and 8 diabetes-related complications (myocardial infarction, ischemic heart disease, stroke, heart failure, amputation, renal failure, diabetic foot ulcer, and blindness in 1 eye) to estimate life expectancy, QALYs, and costs. It is based on an integrated system of parametric equations that predict the annual probability of death and complications; all model parameters have been published and internally validated previously. 2
Parameter uncertainty around these risk equations is captured using 5000 sets of correlated risk equation coefficients: the 15 regression equations predicting diabetic events and mortality were jointly estimated on each bootstrap sample drawn, with replacement, from UKPDS trial population to allow for correlations between coefficients across all 15 regression models. Monte Carlo methods are used to randomly simulate a possible medical history for each patient in each “loop” of the model. 2 The likelihood of events for each patient is based on the following risk factors: patient demographics, smoking, diabetes duration, body mass index, high- and low-density lipoprotein (HDL, LDL), systolic blood pressure, glycated hemoglobin (HbA1c), heart rate, white blood cell count, hemoglobin, estimated glomerular filtration rate, albuminuria, and event history. Different interventions can be evaluated through their impact on the time paths of these risk factors (e.g., HbA1c) for a population of real or hypothetical individuals, which in turn will alter the probability of clinical events occurring.
The model therefore has a 3-level simulation, predicting L loops comprising lifetime outcomes for each of P patients for each of B sets of bootstrapped model parameters. Each loop comprises a single lifetime disease trajectory, showing when cardiovascular events and death occur for 1 specific individual in the sample. This is estimated by comparing random numbers against the annual probability of events and death. These annual probabilities are predicted by applying risk factor values for patient P to a set of risk equations. Due to the random or Monte Carlo element in their calculation, each loop will return a different value, and so the results of multiple loops are averaged to derive the expected value. Uncertainty concerning the risk equation parameters is dealt with by reestimating L loops for each patient using B sets of risk equation parameters bootstrapped from the UKPDS population.
In the case study, we extrapolated end-of-trial data for each of the AFORRD trial participants and compared the extrapolated outcomes between the 2 groups as randomized. 15 Extrapolating data for individual patients is especially useful for evaluations based on a single study as it makes few assumptions, preserves the correlations between all clinical variables, and takes account of uncertainty around treatment effects and the variability between trial participants at baseline and over the randomized trial period. However, this approach means that any imbalance in baseline characteristics between randomized groups is propagated into the extrapolated estimates. Using this approach, the treatment effect observed in the trial is not parameterized, and uncertainty around treatment effects must be captured statistically based on the variability between patients in each group.
IPD from RCTs can also be extrapolated using UKPDS-OM2 in several alternative ways. First, some researchers have parametrically simulated data for hypothetical patients based on the mean and standard deviation (SD) for each clinical parameter.29,30 This approach may be the only option when IPD are not available but requires distributional assumptions and makes it difficult to allow for correlations between different patient characteristics (e.g., LDL and blood pressure), particularly between continuous and dichotomous variables. Second, other studies have extrapolated IPD for 1 arm of the trial, with and without the addition of a treatment effect equal to the difference between the 2 arms of the study. 31 Providing treatment effects are additive, this approach will not be biased by baseline imbalance and may be useful when it is necessary to compare against comparators not included in the trial but means that additional methods are required to allow for uncertainty around treatment effects and account for correlations between the treatment effects for different risk factors. Using these approaches, parameter uncertainty around treatment effects must be considered separately (e.g., using PSA).
Analytical Methods for the Simulation Study
We conducted a simulation study to do the following:
Compare methods for combining sampling and parameter uncertainty with respect to point estimates, SEs, and coverage. We hypothesized that 95% CIs that include only parameter uncertainty will be too narrow and have <95% coverage and that methods combining parameter uncertainty and sampling uncertainty would have wider 95% CIs and 95% coverage.
Evaluate the impact of adjusting for baseline imbalance in baseline risk factors in terms of point estimates, SEs, and coverage. We hypothesized that this would reduce SEs and alter point estimates by removing the bias resulting from baseline imbalance.
Evaluate the impact of varying the number of loops and assess whether the standard practice of running large numbers of inner loops to minimize MCE is appropriate when IPD from an RCT are extrapolated using PLS in a way analogous to multiple imputation.
The protocol is given in Appendix 2. We used UKPDS-OM2 to extrapolate the AFORRD trial for 30 years using 1, 2000, and 1 million loops and estimated point estimates and 95% CIs using 6 methods (Tables 2 and 3).
Summary of the Analyses Conducted a
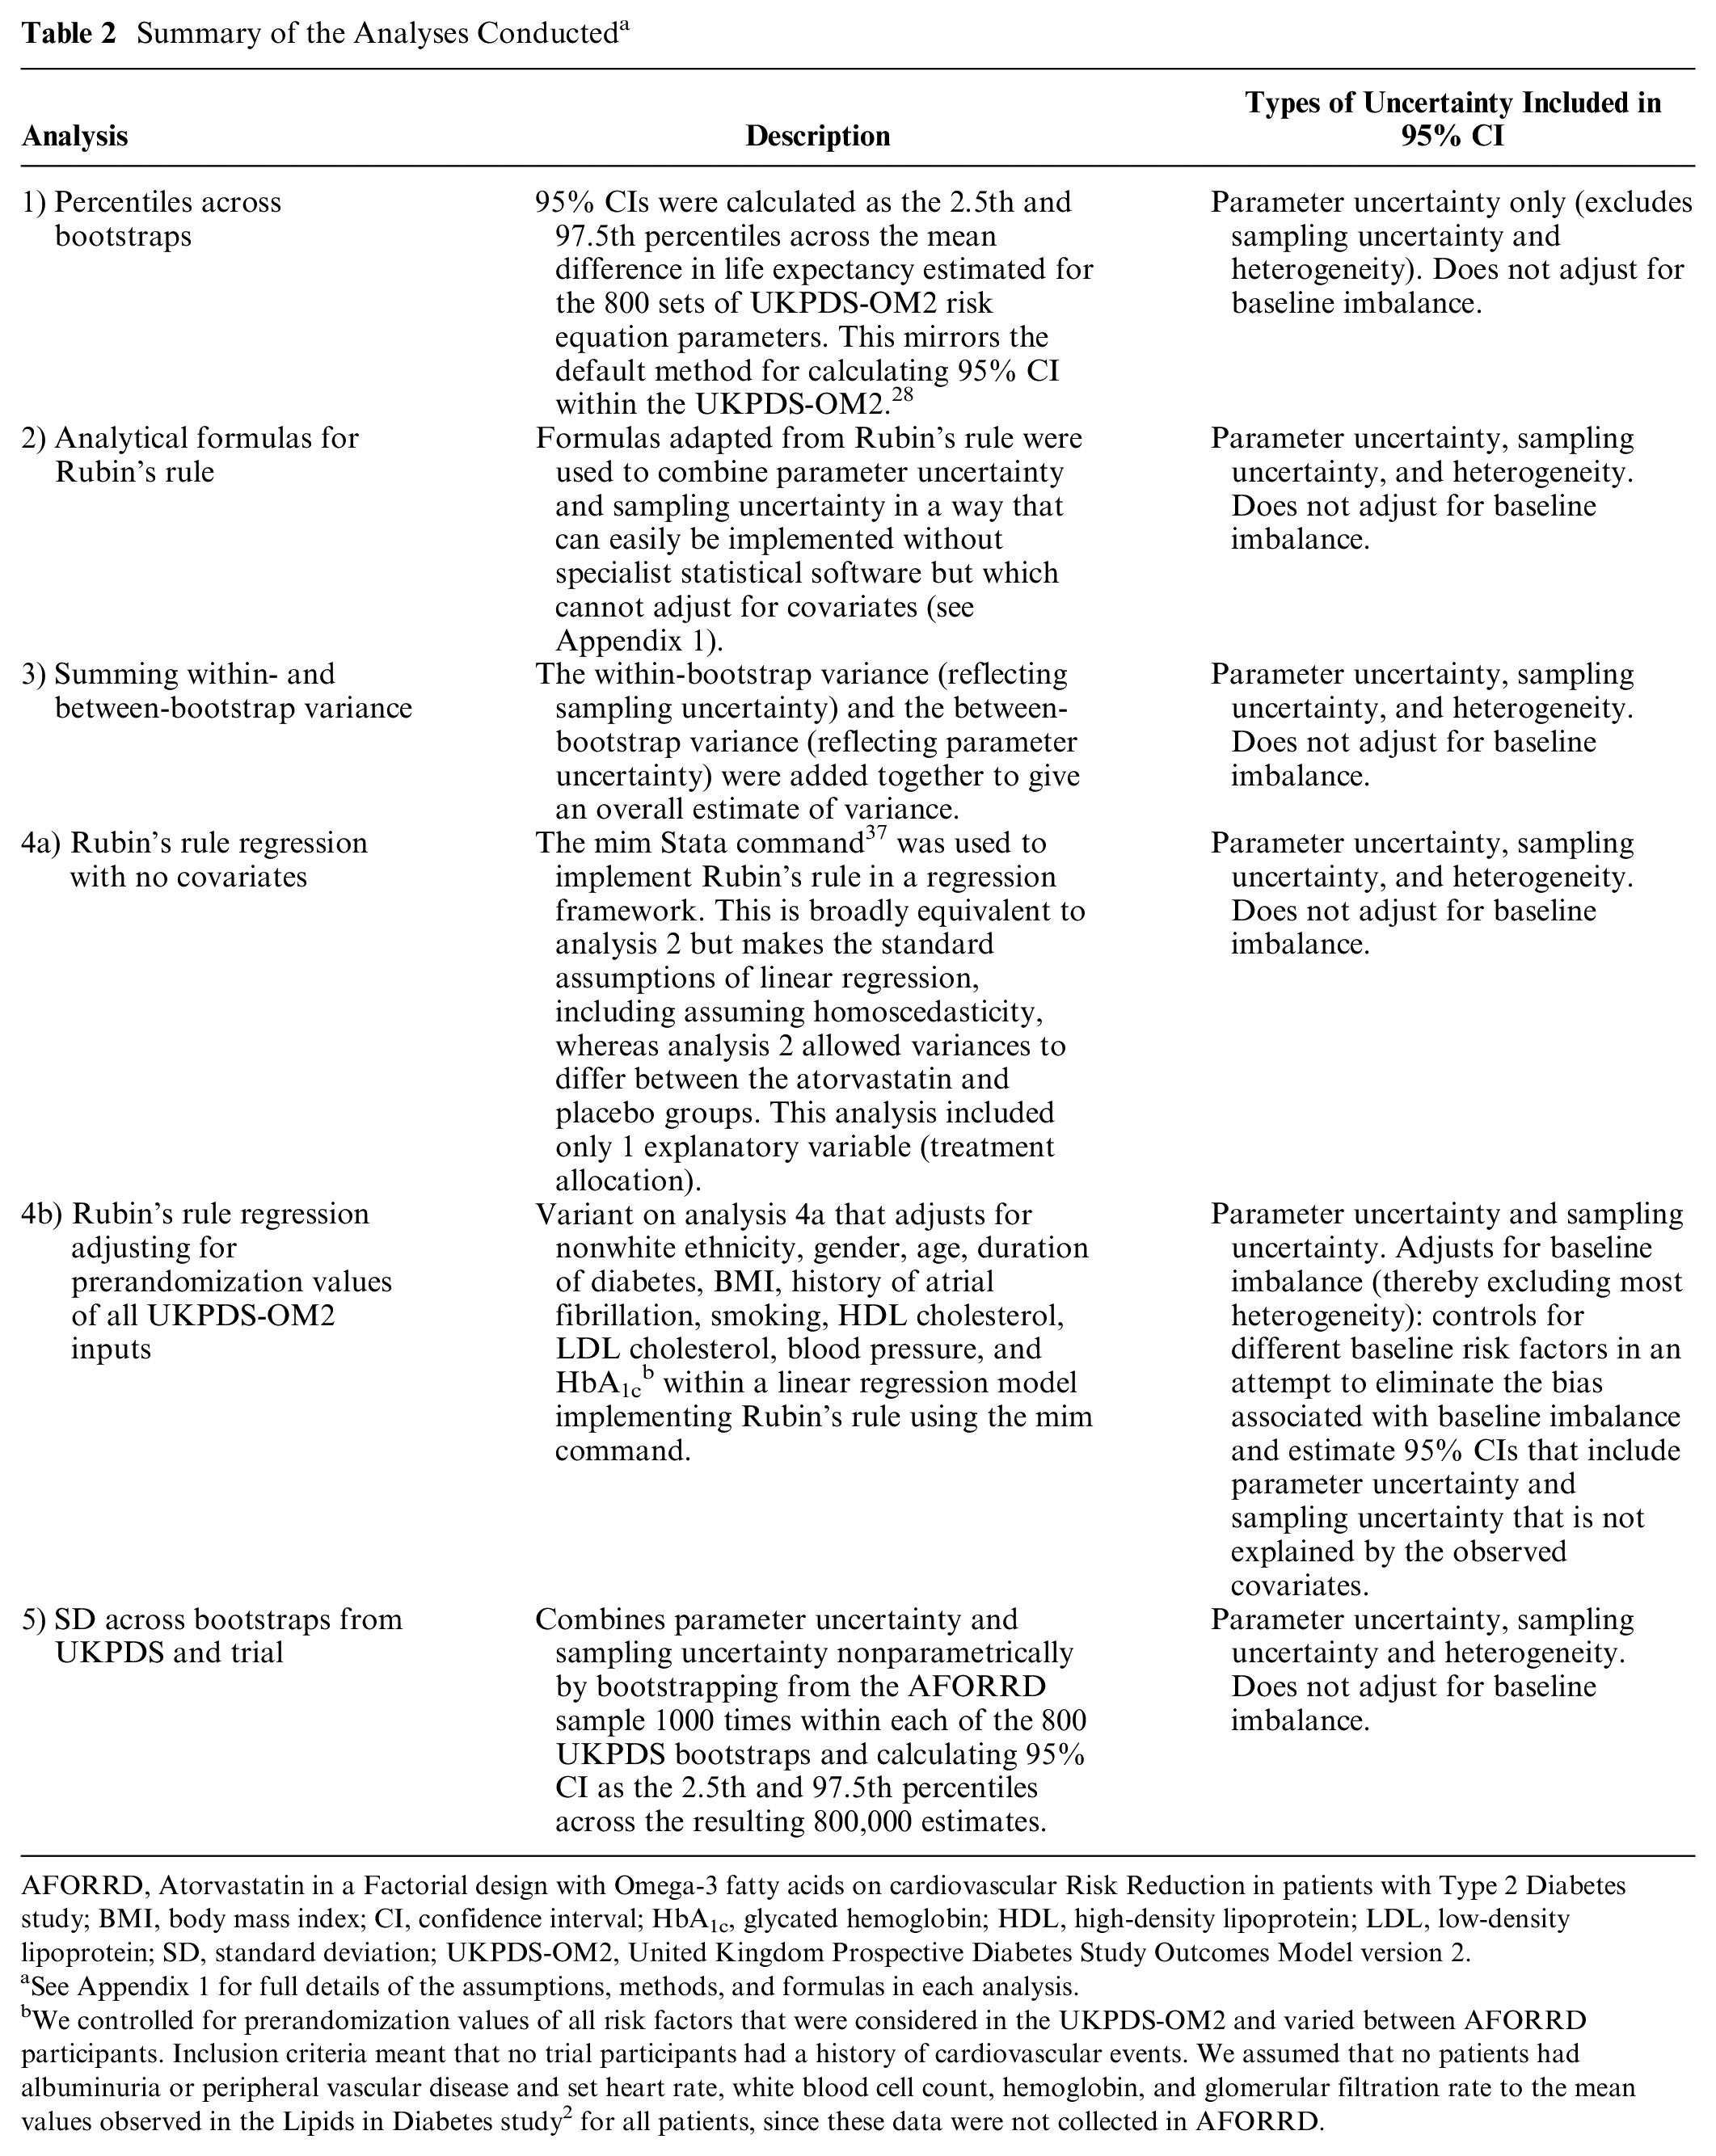
AFORRD, Atorvastatin in a Factorial design with Omega-3 fatty acids on cardiovascular Risk Reduction in patients with Type 2 Diabetes study; BMI, body mass index; CI, confidence interval; HbA1c, glycated hemoglobin; HDL, high-density lipoprotein; LDL, low-density lipoprotein; SD, standard deviation; UKPDS-OM2, United Kingdom Prospective Diabetes Study Outcomes Model version 2.
See Appendix 1 for full details of the assumptions, methods, and formulas in each analysis.
We controlled for prerandomization values of all risk factors that were considered in the UKPDS-OM2 and varied between AFORRD participants. Inclusion criteria meant that no trial participants had a history of cardiovascular events. We assumed that no patients had albuminuria or peripheral vascular disease and set heart rate, white blood cell count, hemoglobin, and glomerular filtration rate to the mean values observed in the Lipids in Diabetes study 2 for all patients, since these data were not collected in AFORRD.
Summary of the Model Runs Conducted a
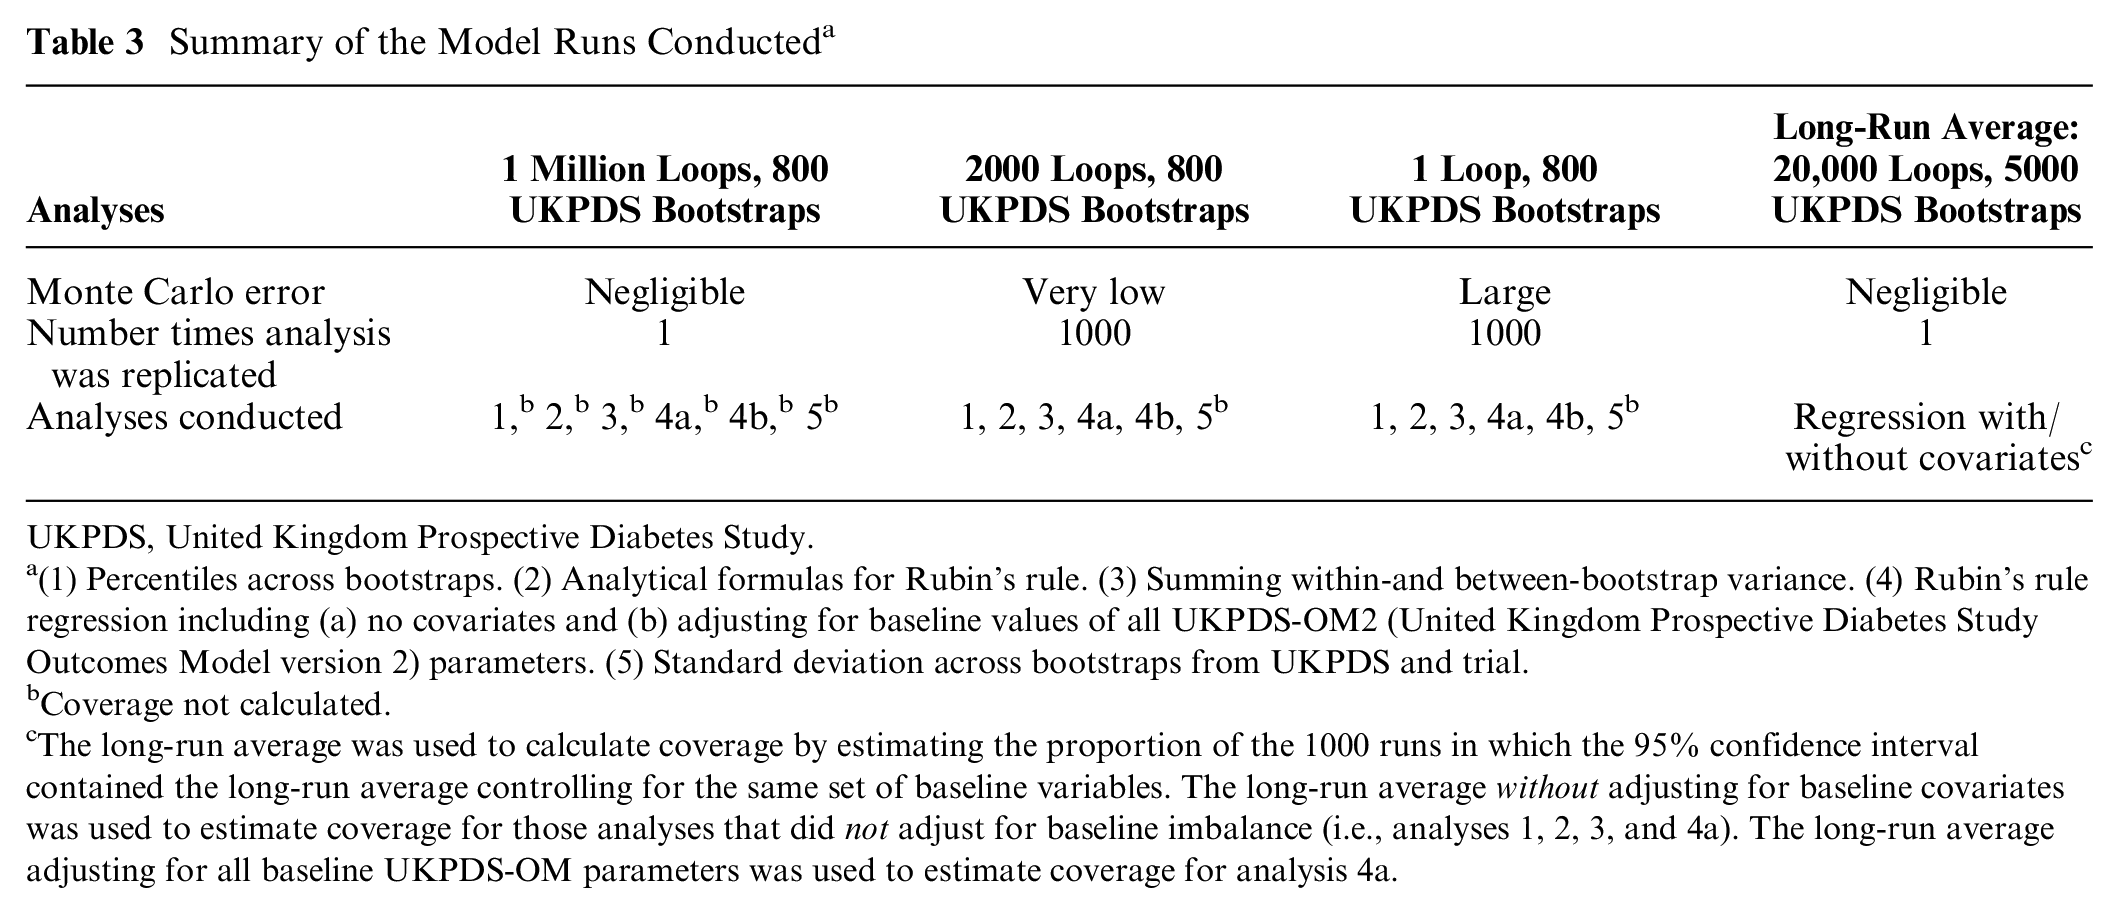
UKPDS, United Kingdom Prospective Diabetes Study.
(1) Percentiles across bootstraps. (2) Analytical formulas for Rubin’s rule. (3) Summing within-and between-bootstrap variance. (4) Rubin’s rule regression including (a) no covariates and (b) adjusting for baseline values of all UKPDS-OM2 (United Kingdom Prospective Diabetes Study Outcomes Model version 2) parameters. (5) Standard deviation across bootstraps from UKPDS and trial.
Coverage not calculated.
The long-run average was used to calculate coverage by estimating the proportion of the 1000 runs in which the 95% confidence interval contained the long-run average controlling for the same set of baseline variables. The long-run average without adjusting for baseline covariates was used to estimate coverage for those analyses that did not adjust for baseline imbalance (i.e., analyses 1, 2, 3, and 4a). The long-run average adjusting for all baseline UKPDS-OM parameters was used to estimate coverage for analysis 4a.
The long-run average against which other results were compared comprised the mean difference in life expectancy from a model run extrapolating the original AFORRD sample (without bootstrapping) using 20,000 loops and all 5000 sets of bootstrapped model parameters, which was more than sufficient to give stable results with a feasible simulation time. To calculate coverage, we repeated analyses 1000 times and calculated the proportion of 95% CIs that contained the long-run average. The long-run average was adjusted for the same covariates as the analyses against which it was compared. We also calculated the empirical SE as the SD across the 1000 estimates of mean difference in life expectancy.
The analyses were intended to reflect the way that researchers would extrapolate and analyze data from a 16-week RCT. Each run used a different set of 800 bootstraps for UKPDS-OM2 parameters, and each model run using 1 loop or 2000 loops also extrapolated outcomes for a different bootstrap sample of patients drawn with replacement from the AFORRD sample. The runs therefore differed from another with respect to parameter uncertainty (bootstraps of model parameters), sampling uncertainty (bootstrap samples of AFORRD participants), and MCE (loops). All model analyses used 800 bootstraps, which is sufficient to estimate SEs to ±10% accuracy based on the methods of O’Hagan et al. 17 and was found to give stable results (Appendix 3, Figure A1). Each run therefore used 16% of the available 5000 bootstraps. Although methods have been developed to calculate the optimal number of loops and eliminate the systematic overestimation of SEs due to MCE in some PLS models, 17 these cannot be applied easily in this setting since we have a 3-level simulation (with L loops for each of B bootstraps of P patients). We therefore compared SEs between model runs using different numbers of loops and found that SEs differ very little between 1000 loops and 1 million loops; 1000 runs of 2000 loops and 1 run of 1 million loops were therefore chosen to keep the computation time feasible (Table 3).
Results of the model-based analyses were analyzed using 6 methods (Table 2), which are described in more detail in Appendix 1 with code supplied in Appendix 4. Coverage was not calculated for the run of 1 million loops, since a single UKPDS-OM2 run took 4 weeks to simulate, or for analysis 5, which took 2.5 hours to analyze per run. The mean and SE around the difference in life expectancy were averaged across all replications. All analyses were conducted in Stata version 14 (StataCorp LLC, College Station, TX).
Financial support for the AFORRD trial was provided by a grant from Pfizer, although this methodological work received no funding.
Results
Taking percentiles across the bootstraps (analysis 1, the standard UKPDS-OM2 output) for the analysis using 2000 loops suggested that the atorvastatin arm of AFORRD accrued 0.55 (95% CI, 0.42–0.69; P < 0.001) more life years than the placebo arm (Figure 1, Table 4). However, this 95% CI includes only parameter uncertainty around risk equations and ignores sampling uncertainty of patient characteristics and treatment effects within the AFORRD trial sample. The SEs from analysis 1 were only 16% of the empirical SE. Consequently, the coverage of the 95% CI for analysis 1 was 25%.
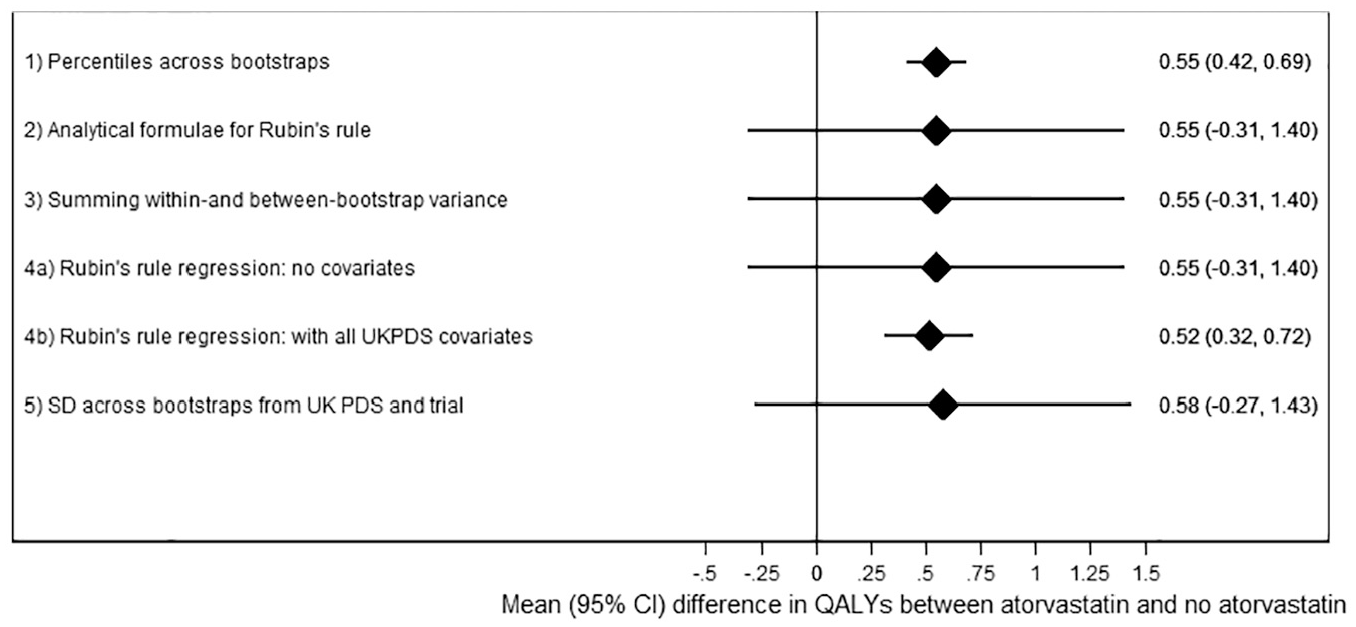
Results of each analysis with 2000 loops.
Results for Each Analysis
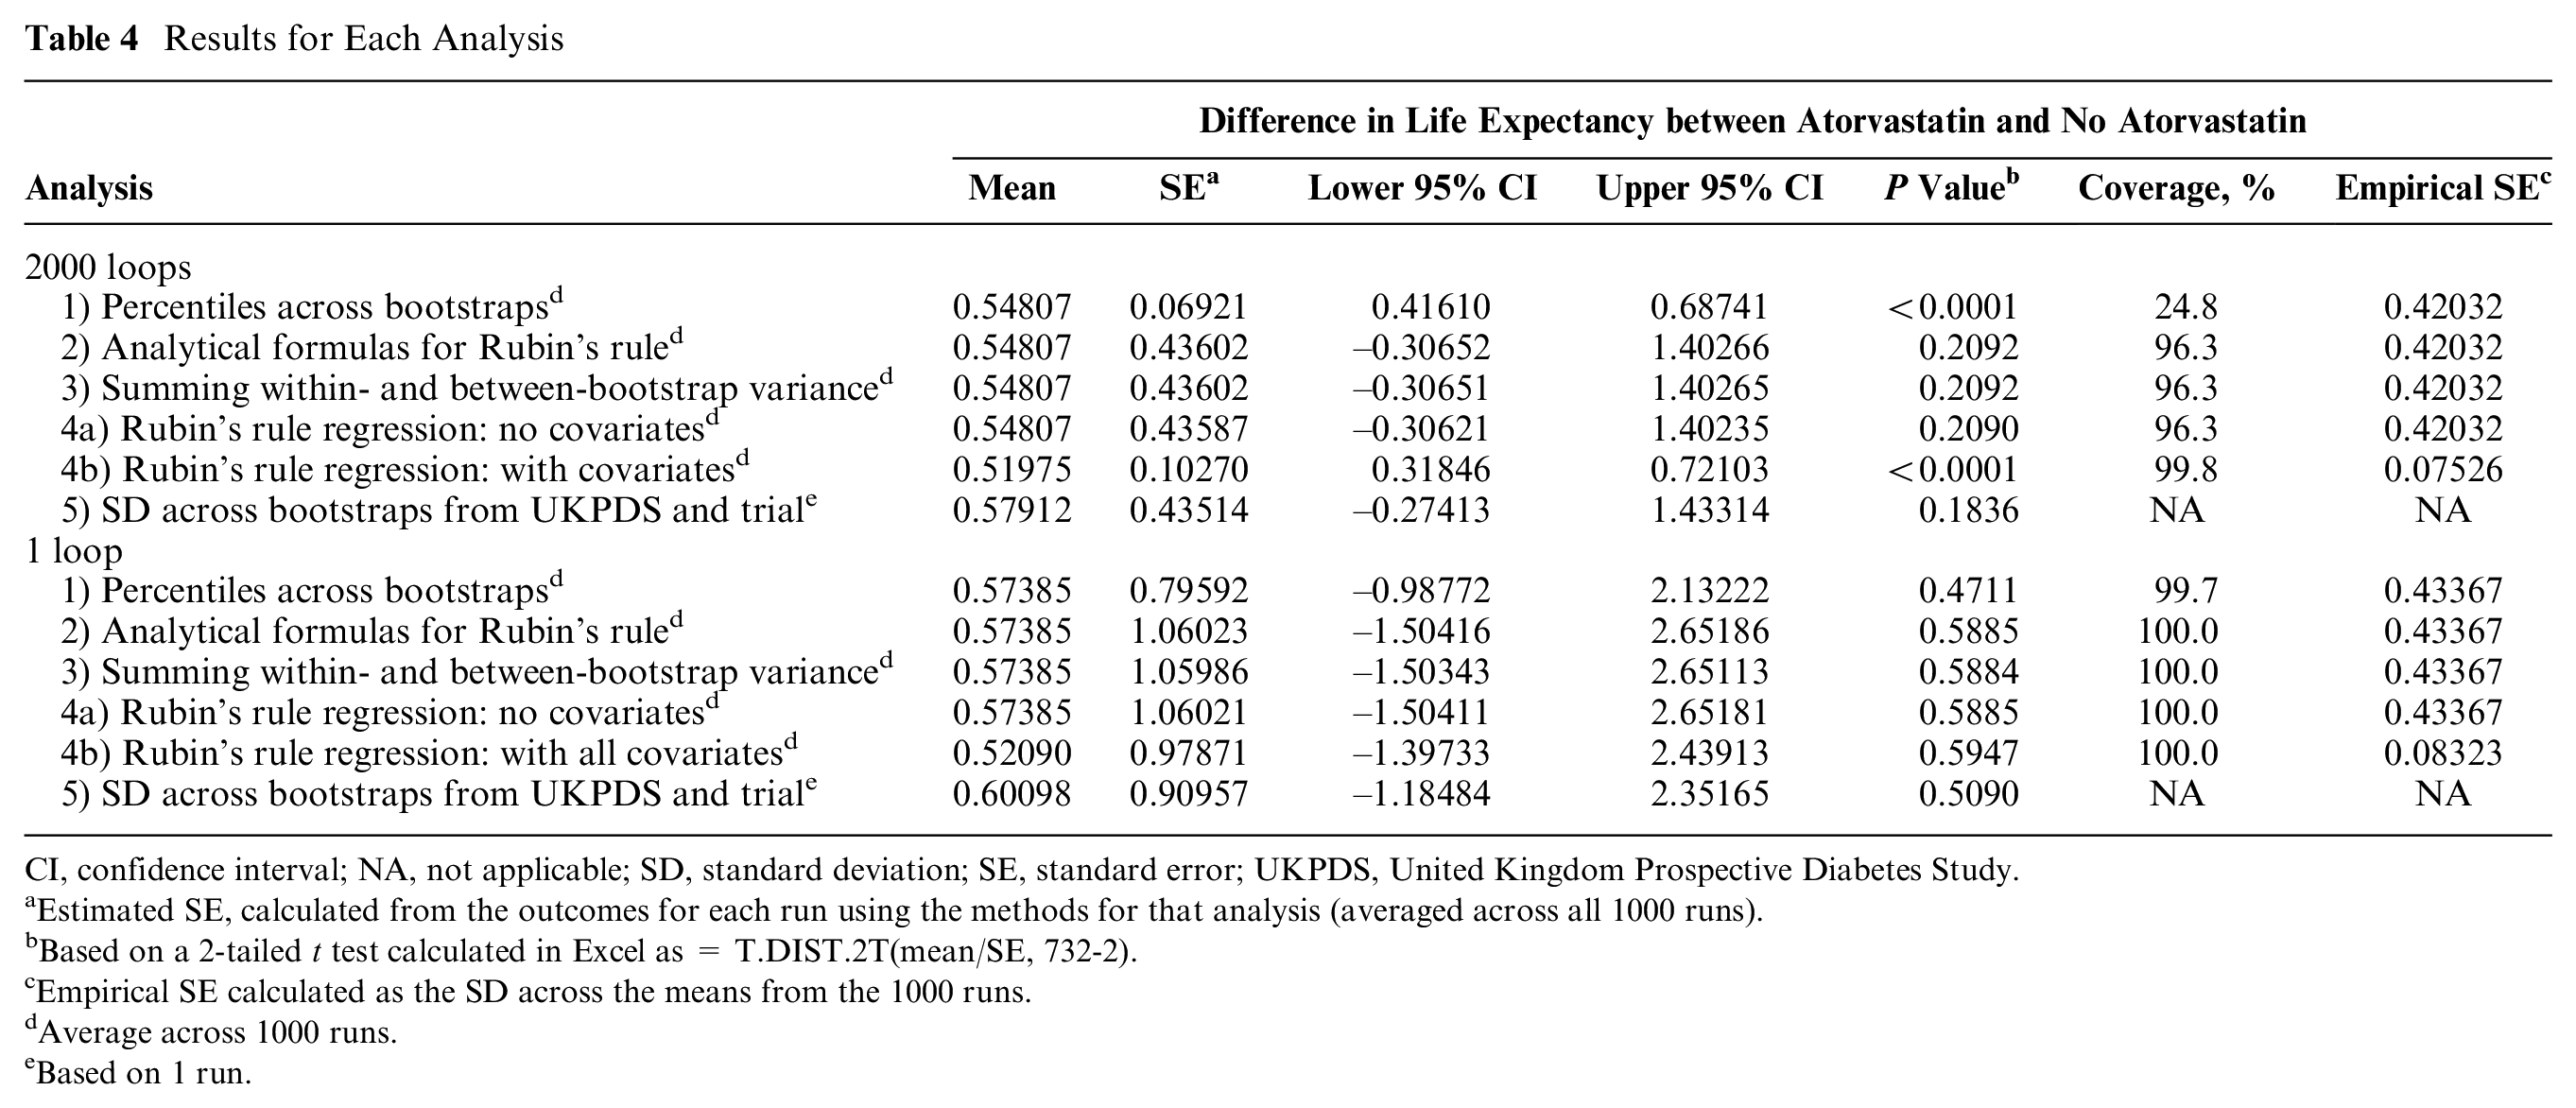
CI, confidence interval; NA, not applicable; SD, standard deviation; SE, standard error; UKPDS, United Kingdom Prospective Diabetes Study.
Estimated SE, calculated from the outcomes for each run using the methods for that analysis (averaged across all 1000 runs).
Based on a 2-tailed t test calculated in Excel as = T.DIST.2T(mean/SE, 732-2).
Empirical SE calculated as the SD across the means from the 1000 runs.
Average across 1000 runs.
Based on 1 run.
By contrast, the analyses combining parameter and sampling uncertainty without adjusting for covariates (analyses 2, 3, 4a, 5) estimated much wider 95% CIs (mean difference: 0.55; 95% CI, –0.31 to 1.40). These analyses did not find statins to significantly increase life expectancy (P = 0.21) because of uncertainty around UKPDS-OM model parameters and the noise introduced by variability in life expectancy unrelated to statins. Sampling uncertainty between patients in the AFORRD sample (including heterogeneity and uncertainty around treatment effects) accounted for 97.5% of the variance, and only 2.5% of the variance was due to uncertainty around UKPDS-OM2 model parameters. (Formulae used to estimate these percentages are given in the “Analysis 2: Analytical Formulae for Rubin’s Rule” section of Appendix 1.) Differences between SEs calculated in analyses 2, 3, 4a, and 5 were negligible, confirming the equivalence of Rubin’s rule analytically and summing variances (Appendix 1) and suggesting that the parametric assumptions within analyses 2 to 4 have a minimal impact on the results. Across the 1000 runs, there was only a weak correlation between the between-bootstrap variance and the within-bootstrap variance (correlation coefficient: –0.11).
Adjusting for baseline levels of all UKPDS-OM2 input parameters within Rubin’s rule regression (analysis 4b) slightly reduced the mean difference in life expectancy by eliminating the bias introduced by imbalance between groups. Minimizing the impact of heterogeneity by adjusting for baseline covariates also reduced the SE by 77% and suggested that statin significantly increased life expectancy (P < 0.0001). However, the coefficient for statin treatment varied little across the 1000 runs compared with analyses 2 to 4a (empirical SE: 0.075), such that coverage increased to 99.8%, despite the reduction in estimated SE to 0.103.
Further analyses suggested that reducing the number of baseline variables included in the regression gave SEs and coverage that were in between those of analyses 4a and 4b (Appendix 3, Table A5 and Figure A2). Adjusting for age (the risk factor most strongly correlated with life expectancy (Appendix 3, Table A6) gave low SE, high coverage, and a point estimate markedly smaller than with all covariates, while controlling for LDL (the factor that was most imbalanced between treatment arms, P = 0.069) had 96% coverage but a high SE similar to that with no covariates.
Results with 1 million loops were very similar to those with 2000 loops for analyses 2 to 4a (Appendix 3, Table A5), confirming that 2000 loops were sufficient to minimize MCE. However, SEs with 2000 loops were 15% larger than with 1 million loops for analysis 1, 4.9% larger for analysis 4b, but only 0.1% larger for analyses 2 to 4a.
SEs were markedly larger when only 1 loop was run per bootstrap and no analysis observed a statistically significant difference between groups (Table 4). With 1 loop, MCE accounted for 99% of the variance in analyses 1 and 4b and 83% of the variance in analyses 2 to 4a, and coverage was ≥99.7% for all analyses.
Discussion
We built on existing taxonomies of uncertainty6–8 to elucidate the specific issues that can arise when combining observed IPD from an RCT with posttrial outcomes extrapolated using PLS modeling. It is hoped that subdividing “uncertainty” into distinct categories will help researchers, readers, and reviewers to consider explicitly the different sources of uncertainty within their analyses and how each type of uncertainty should be represented and combined.
Our simulation study demonstrated the importance of including sampling uncertainty as well as parameter uncertainty when calculating SEs around statistics estimated on groups of individual trial participants extrapolated using a PLS, where the uncertainty around the treatment effect is captured in the patient sample. Ignoring sampling uncertainty produces SEs that are too small and have low coverage, particularly in a small/medium-sized trial like AFORRD. Underestimating SEs could lead to incorrect conclusions that differences are statistically significant, misrepresentation of the uncertainty around treatment adoption decisions, and/or underestimation of the value of conducting further research. However, parameter uncertainty would be sufficient when estimating outcomes for a single real or hypothetical individual with known risk factors (since sampling uncertainty is zero in this case, where the specified individual represents the whole population of interest).
We also highlighted the bias introduced by baseline imbalance between randomized groups in the variables that are used to predict outcomes beyond the end of the trial, even when there were no statistically significant differences in baseline risk factors between groups (Appendix 3, Table A4). 11 To minimize this bias, it is necessary to adjust for prerandomization characteristics when calculating differences between randomized groups extrapolated using PLS. This changed point estimates in this small/medium-sized trial with a marked imbalance in LDL. Similar biases could arise in any analysis estimating absolute differences in posttreatment outcomes, 22 event rates, life expectancy or lifetime costs, or QALYs for cohorts of trial participants (even if results are not extrapolated beyond trial end). By contrast, other endpoints (e.g., costs, relative risks, or change in LDL) may be only weakly correlated with baseline data, such that baseline imbalance introduces noise but little bias. This suggests that researchers should consider adjusting for more prerandomization variables than is currently standard practice in within-trial economic evaluations. It has been suggested that trial analyses should adjust for all variables where the correlation with outcome is >0.5, regardless of imbalance or sample size. 26
Controlling for baseline characteristics also substantially reduced SEs by accounting for heterogeneity in baseline UKPDS-OM risk factors that explain much of the variability in life expectancy between patients. The extent to which SEs are reduced by covariate adjustment depends on the strength of the correlation between the covariate and outcome. 26 In AFORRD, all covariates have some prognostic value (because they are built into the UKPDS-OM), and the correlation between life expectancy and age is −0.968 (Appendix 3, Table A6); SEs therefore reduce substantially when we adjust for age or all covariates. By contrast, the correlation between baseline LDL and life expectancy is 0.026, and adjusting for LDL therefore has minimal impact on SEs despite the marked imbalance.
However, when we controlled for all UKPDS-OM2 risk factors, coverage was markedly higher than 95%, and SEs were 36% larger than the empirical SE, suggesting that this analysis may be inefficient. We are unclear why this should be the case, although it may be because the UKPDS-OM determines the strong link between risk factors and life expectancy, and all of the determinants of posttrial outcomes are known and accounted for in a way that would not happen in a within-trial analysis. The apparent stability in the means may be an artifact of the simulation, as the UKPDS-OM only has 100 seed values and 5000 sets of UKPDS-OM model parameters; reusing seeds and parameter sets may have reduced variability between runs and increased coverage. Consequently, the empirical SE may not be the “true” SE in this case. Despite the high coverage, it may be appropriate to control for all model risk factors to ensure that analyses can be prespecified in analysis plans and minimize the risk of baseline imbalance affecting the point estimate, even if this means that the 95% CI may be inappropriately wide.
The simulation study confirmed that MCE should be minimized even when we extrapolate IPD in a way that is analogous to multiple imputation: analyses using only 1 loop gave 95% CIs that were too wide and had 100% coverage. The simulation time was 1 hour for 2000 loops and 26 days for 1 million loops (Appendix 3, Table A6), although the difference in SEs was small. There is a need for more research to identify the optimal number of bootstraps and loops in models using a 3-level simulation (e.g., with B bootstraps and L loops for P patients).
There may be fundamental differences between the types of uncertainty affecting trial- and model-based economic evaluation. In particular, the outcomes for a 30-year RCT may be subject to stochastic uncertainty and sampling uncertainty, whereas our model-based analysis 4a included sampling uncertainty and parameter uncertainty and was subject to (but excluded) structural uncertainty. In our experience, trial-based economic evaluations tend to have wider 95% CIs and a lower probability of a treatment being cost-effective than model-based economic evaluations, which may reflect these fundamental differences between trials and models and the fact that stochastic uncertainty within a trial may often be larger than parameter uncertainty within a model. However, that trend could also reflect types of uncertainty that are not fully captured within models at present or differences between the types of evidence informing model-based (meta-analyses or explanatory trials) v. trial-based (pragmatic trials) economic evaluations.
The 4 methods that we developed for combining sampling and parameter uncertainty could be used to analyze clinical and economic endpoints in other settings; Stata code is provided in Appendix 4. If it is not necessary to adjust for covariates, any of the methods could be used and give virtually identical results. Rubin’s rule regression naturally facilitates adjustment for covariates. The bootstrapping approach could also be adapted to adjust for covariates by estimating treatment effects using regression rather than sample means. Although it takes longer to run the bootstrapping analysis, this approach avoids parametric assumptions, facilitates construction of scatter-graphs and cost-effectiveness acceptability curves, and could accommodate more complex analyses (e.g., Kaplan-Meier sample averaging). A separate study will illustrate how the bootstrapping approach can be readily extended to economic evaluations considering both costs and QALYs, allowing for correlations between costs and QALYs. Although our analysis did not adjust for clustering by general practitioner practice to avoid overcomplicating the analysis, this could be accounted for by extending analysis 5 to use a 2-stage bootstrap32,33 or applying Rubin’s rule to the results of a mixed model.
In our simulation study, we did not consider structural uncertainty or uncertainty around missing data; future work could explore whether the methods identified here can be adapted to incorporate these types of uncertainty (e.g., by summing 3 variances together). Sensitivity analyses would still be required to evaluate generalizability, methodological uncertainty, and aspects of structural uncertainty that cannot easily be parameterized. We extrapolated 1 trial using UKPDS-OM2, although we anticipate that the results would also apply in other settings. Although the trial was small and lasted only 16 weeks, these limitations do not affect the proof of methodological concepts.
Our results suggest that sampling uncertainty and adjustment for covariates should be incorporated into analyses using models such as UKPDS-OM2 to extrapolate data for individual participants in each study arm. Future research should explore methods for combining uncertainty when using simulated patients or adding sample treatment effects to 1 patient cohort.
Supplemental Material
Appendix_1_online_supp – Supplemental material for Accurately Reflecting Uncertainty When Using Patient-Level Simulation Models to Extrapolate Clinical Trial Data
Supplemental material, Appendix_1_online_supp for Accurately Reflecting Uncertainty When Using Patient-Level Simulation Models to Extrapolate Clinical Trial Data by Helen A. Dakin, José Leal, Andrew Briggs, Philip Clarke, Rury R. Holman and Alastair Gray in Medical Decision Making
Supplemental Material
Appendix_2_online_supp – Supplemental material for Accurately Reflecting Uncertainty When Using Patient-Level Simulation Models to Extrapolate Clinical Trial Data
Supplemental material, Appendix_2_online_supp for Accurately Reflecting Uncertainty When Using Patient-Level Simulation Models to Extrapolate Clinical Trial Data by Helen A. Dakin, José Leal, Andrew Briggs, Philip Clarke, Rury R. Holman and Alastair Gray in Medical Decision Making
Supplemental Material
Appendix_3_online_supp – Supplemental material for Accurately Reflecting Uncertainty When Using Patient-Level Simulation Models to Extrapolate Clinical Trial Data
Supplemental material, Appendix_3_online_supp for Accurately Reflecting Uncertainty When Using Patient-Level Simulation Models to Extrapolate Clinical Trial Data by Helen A. Dakin, José Leal, Andrew Briggs, Philip Clarke, Rury R. Holman and Alastair Gray in Medical Decision Making
Supplemental Material
Appendix_4a_-_details_online_supp – Supplemental material for Accurately Reflecting Uncertainty When Using Patient-Level Simulation Models to Extrapolate Clinical Trial Data
Supplemental material, Appendix_4a_-_details_online_supp for Accurately Reflecting Uncertainty When Using Patient-Level Simulation Models to Extrapolate Clinical Trial Data by Helen A. Dakin, José Leal, Andrew Briggs, Philip Clarke, Rury R. Holman and Alastair Gray in Medical Decision Making
Supplemental Material
Appendix_4b_-_code_for_readers_to_apply_analyses_1-4f_online_supp – Supplemental material for Accurately Reflecting Uncertainty When Using Patient-Level Simulation Models to Extrapolate Clinical Trial Data
Supplemental material, Appendix_4b_-_code_for_readers_to_apply_analyses_1-4f_online_supp for Accurately Reflecting Uncertainty When Using Patient-Level Simulation Models to Extrapolate Clinical Trial Data by Helen A. Dakin, José Leal, Andrew Briggs, Philip Clarke, Rury R. Holman and Alastair Gray in Medical Decision Making
Supplemental Material
Appendix_4c_-_Analysis_5_code_for_paper_online_supp – Supplemental material for Accurately Reflecting Uncertainty When Using Patient-Level Simulation Models to Extrapolate Clinical Trial Data
Supplemental material, Appendix_4c_-_Analysis_5_code_for_paper_online_supp for Accurately Reflecting Uncertainty When Using Patient-Level Simulation Models to Extrapolate Clinical Trial Data by Helen A. Dakin, José Leal, Andrew Briggs, Philip Clarke, Rury R. Holman and Alastair Gray in Medical Decision Making
Supplemental Material
Appendix_4d_-_UKPDS_Outcomes_Model_v2.0_Patient_online_supp – Supplemental material for Accurately Reflecting Uncertainty When Using Patient-Level Simulation Models to Extrapolate Clinical Trial Data
Supplemental material, Appendix_4d_-_UKPDS_Outcomes_Model_v2.0_Patient_online_supp for Accurately Reflecting Uncertainty When Using Patient-Level Simulation Models to Extrapolate Clinical Trial Data by Helen A. Dakin, José Leal, Andrew Briggs, Philip Clarke, Rury R. Holman and Alastair Gray in Medical Decision Making
Supplemental Material
Appendix_4e_-_Risk_factor_data_online_supp – Supplemental material for Accurately Reflecting Uncertainty When Using Patient-Level Simulation Models to Extrapolate Clinical Trial Data
Supplemental material, Appendix_4e_-_Risk_factor_data_online_supp for Accurately Reflecting Uncertainty When Using Patient-Level Simulation Models to Extrapolate Clinical Trial Data by Helen A. Dakin, José Leal, Andrew Briggs, Philip Clarke, Rury R. Holman and Alastair Gray in Medical Decision Making
Supplemental Material
Appendix_4f_-_bootstrap_numbers_online_supp – Supplemental material for Accurately Reflecting Uncertainty When Using Patient-Level Simulation Models to Extrapolate Clinical Trial Data
Supplemental material, Appendix_4f_-_bootstrap_numbers_online_supp for Accurately Reflecting Uncertainty When Using Patient-Level Simulation Models to Extrapolate Clinical Trial Data by Helen A. Dakin, José Leal, Andrew Briggs, Philip Clarke, Rury R. Holman and Alastair Gray in Medical Decision Making
Footnotes
Acknowledgements
We thank the AFORRD participants and the AFORRD Study Group for their work in designing the trials and collecting and cleaning data. Rosa Legood conducted preliminary work on the costing and analysis for the AFORRD economic evaluation, while Frauke Becker helped run simulations and Olorunsola Agbaje provided feedback on a draft of the manuscript. We also thank Ian Kennedy and Vanessa Gregory for adapting the UKPDS-OM2 to save the outputs required for our regression-based analyses. We also received advice on Rubin’s rule from Ian White and helpful feedback on this project from those attending presentations held at the January 2017 Health Economists’ Study Group, the 2016 Mount Hood Challenge meeting, Oxford Health Economics Research Centre, Sheffield School of Health and Related Research, and University of Bristol. RRH is an emeritus UK National Institute for Health Research Senior Investigator.
The author(s) declared the following potential conflicts of interest with respect to the research, authorship, and/or publication of this article: All authors have been involved in the development of the UKPDS-OM, which is licensed by the University of Oxford.
The author(s) disclosed receipt of the following financial support for the research, authorship, and/or publication of this article: The AFORRD trial was registered as ISRCTN 76737502. The protocol was approved by local and national ethics committees and regulatory agencies, and the study was carried out in accordance with the Declaration of Helsinki and good clinical practice guidelines.Financial support for the AFORRD trial was provided by a grant from Pfizer. Pfizer provided atorvastatin study medication and matching placebo, and Pronova Biopharma Norge AS provided omega-3 EE90 study medication and matching olive oil capsules. The funding agreement ensured the authors’ independence in designing the study, interpreting the data, writing, and publishing the report. This methodological work received no funding, although Rury Holman and Alastair Gray are (or were at the time the research began) National Institute for Health Research (NIHR) senior investigators.
Rury Holman, Philip Clarke, and Alastair Gray are supported by the NIHR Oxford Biomedical Research Centre (BRC). José Leal acknowledges support from the Innovative Medicines Initiative 2 Joint Undertaking under grant agreement 115881 (RHAPSODY). The views expressed are those of the authors and not necessarily those of the NHS, the NIHR, or the Department of Health.
Authors’ Note
Preliminary results of this study were presented at the Health Economists’ Study Group meeting in Birmingham, UK, January 4–6, 2017, and the Mount Hood 2016 Challenge: Economics modelling and diabetes, St Gallen, Switzerland, September 16–18, 2016.
Research Data
The code used to conduct analyses described in this article is available in Appendix 4. UKPDS-OM2 is available at ![]() .
.
Supplemental Material
Notes
References
Supplementary Material
Please find the following supplemental material available below.
For Open Access articles published under a Creative Commons License, all supplemental material carries the same license as the article it is associated with.
For non-Open Access articles published, all supplemental material carries a non-exclusive license, and permission requests for re-use of supplemental material or any part of supplemental material shall be sent directly to the copyright owner as specified in the copyright notice associated with the article.