
Abstract
There is little evidence on the association between child and adolescent mental health (CAMH) policies and adolescent mental health. This study examined this association using data on indicators of adolescent mental health—aggressive behavior, life satisfaction, and psychosomatic symptoms—in 172,829 eleven- to fifteen-year-olds from 30 European countries in the 2013-2014 Health Behaviour in School-Aged Children (HBSC) study. Individual records were linked to national-level policies for CAMH, controlling for national-level adult violence, adult well-being, and income inequality. Multilevel analyses revealed lower adolescent aggressive behavior in countries with more CAMH policies, even after controlling for other national-level indicators. Adolescent life satisfaction and psychosomatic symptoms were not associated with CAMH policies. Results may inform policy recommendations regarding investments in adolescent mental health.
Adolescent mental health is important for daily academic, social, and family functioning, and for developmental trajectories of mental health through adulthood (Althoff, Verhulst, Rettew, Hudziak, & Van Der Ende, 2010; Kessler et al., 2007). Positive adolescent mental health is related to lower risks of delinquency and crime, physical illness, and mental health problems throughout life (Kleinert, 2007; Patton et al., 2018). Adverse outcomes from adolescent mental health problems impose a burden not only on individuals and their immediate environment but also on society (Caspi et al., 2016; Fergusson & Woodward, 2002; Kessler et al., 2007; Romeo, Knapp, & Scott, 2006; World Health Organization, 2005, 2015). Therefore, adolescence is a critical period for researchers, policy makers, and practitioners to invest in to ensure and maintain positive mental health (Patton et al., 2014).
Recognizing the important role of adolescent mental health and the lack of policies to support it (Shatkin & Belfer, 2004), the World Health Organization called for more emphasis on policies for child and adolescent mental health (CAMH; World Health Organization, 2005). Since then, several large projects have gathered information on the current state of policies for CAMH in Europe and provided recommendations to strengthen their implementation (e.g., Carral Bielsa, Braddick, Jané-Llopis, Jenkins, & Puras, 2010; Coppens et al., 2015). Nevertheless, to our knowledge, the extent to which these policies relate to adolescent mental health remains unresearched. The aim of the present study is to explore the relation between CAMH policies and different indicators of adolescent mental health across 30 European countries.
In this study, we focus on three indicators of adolescent mental health that are reliably associated with other mental health indicators and contextual risk factors, namely, aggressive behavior, life satisfaction, and psychosomatic symptoms. To illustrate, childhood aggressive behavior is robustly related to other externalizing and internalizing symptoms (Bartels et al., 2018; Granic, 2014; King & Waschbusch, 2010), and psychopathology later in life (Althoff et al., 2010). Life satisfaction is generally considered a hallmark of superior mental and physical health and resilience throughout the life course (Cohn, Fredrickson, Brown, Mikels, & Conway, 2009; Lyubomirsky, King, & Diener, 2005; Proctor, Linley, & Maltby, 2009), and psychosomatic symptoms are associated with mental health problems such as depression and anxiety, and with stressors such as bullying and school stress (Berntsson, Köhler, & Gustafsson, 2001; Piko, 2007).
National CAMH Policies and Adolescent Mental Health
According to the Social Ecological Model (SEM), adolescent mental health development occurs across different social levels (McLeroy, Bibeau, Steckler, & Glanz, 1988; UNICEF, 2018). National policies for CAMH take place at the most external and distal social level (i.e., policy/enabling environment); however, they may affect adolescents directly at the individual level or through intermediate levels specified in the SEM, including the organizational, community, and interpersonal level. We identified four types of national-level policies relevant to CAMH: monitoring adolescent mental health, structural facilities for adolescent mental health, investment in family benefits, and investment in education.
First, monitoring of the prevalence of adolescent mental health problems may be an indication of the priority governments give to this topic (World Health Organization, 2005). Robust evidence on the incidence and prevalence of mental health problems informs governments about the mental health needs of adolescents in a country and potential gaps for prevention and intervention strategies, which may have implications that affect adolescent mental health at the organizational level (Jenkins, 2003; Wittchen & Jacobi, 2005; Wittchen et al., 2011). Second, a country’s number of structural facilities and resources (i.e., psychiatrists, psychologists, community-based mental health services) that deliver medical and psychosocial interventions reflects the capacity to respond to the needs of adolescents with mental health problems, which may express itself at a community level, and, thus, improve adolescent mental health (Tylee, Haller, Graham, Churchill, & Sanci, 2007). Third, policies aimed at vulnerable families through investment in family benefits (i.e., child payments and allowances, parental leave benefits, childcare support) are important to decrease the risk of mental health problems due to poverty and low socioeconomic status (SES) and to improve adolescent mental health through implications at the interpersonal (e.g., stress alleviation in the family environment) and individual level (Currie et al., 2012; Viner et al., 2012). Fourth, policies that aim to ensure universal access to education may improve adolescent mental health through an increase of both quality (i.e., interpersonal level) of and access (i.e., individual level) to education. Consistent evidence links higher educational attainment with better health, well-being, and mental health (Link, Phelan, Miech, & Westin, 2008; Ottova et al., 2012; Sawyer et al., 2012; Viner et al., 2012). Taken together, we expected a positive association between the above four types of CAMH policy assessment at the national level with adolescent life satisfaction and a negative association with adolescent aggressive behaviors and psychosomatic symptoms.
Other National-Level Indicators Related to Adolescent Mental Health
There may be other social determinants (e.g., cultural and social norms) that influence adolescent mental health that are associated with CAMH policy influences, or could be misinterpreted as such (Viner et al., 2012), possibly leading to overestimating the effect of CAMH policies. For example, levels of adult violence and well-being may reflect the cultural norms of society that adolescents grow up with and, as a consequence, may influence their mental health. Adolescence is a sensitive period for social learning (e.g., Sawyer et al., 2012). Therefore, cultural norms regarding the (in)appropriateness of certain behaviors or feelings at the country level may affect the development and reporting of adolescent mental health. Also, national-level income inequality may highlight the (absence or presence of) economic differences, social competition, and strength of social trust (Pickett & Wilkinson, 2007, 2010). Previous research showed that levels of national-level income inequality were associated with adolescent mental health indicators such as psychosomatic symptoms (Elgar et al., 2015) and life satisfaction (Levin et al., 2011). Therefore, we control for adult violence, adult well-being, and income inequality when examining the association between policies for CAMH and indicators of adolescent mental health.
The Present Study
The Health Behaviour of School-Aged Children (HBSC) study is a collaborative cross-national study which aims to gain insights in adolescents’ health and well-being, and their social context (Currie et al., 2012, 2014). Combining HBSC data with country-level indicators of national CAMH policies and national indicators reflecting social and cultural norms provides a powerful tool to examine factors that explain differences in adolescent mental health between countries (Currie & Alemán-Díaz, 2015). Using HBSC data, we assessed adolescent aggressive behavior, life satisfaction, and psychosomatic symptoms as indicators of adolescent mental health in 30 countries and examined their association with national indicators of CAMH policies, controlling for adult violence, adult well-being, and income inequality.
Method
Data consisted of survey data on 11-, 13-, and 15-year-olds who participated in the HBSC study in 2013-2014, from the following countries: Austria, Belgium (i.e., Flanders and Wallonia), Bulgaria, Croatia, Czech Republic, Denmark, Estonia, Finland, France, Germany, Greece, Hungary, Iceland, Ireland, Italy, Latvia, Lithuania, Luxembourg, Malta, the Netherlands, Norway, Poland, Portugal, Romania, Slovakia, Slovenia, Spain, Sweden, Switzerland, and the United Kingdom (i.e., England, Scotland, and Wales). Table 1 depicts the sample sizes of each age group in each country. The HBSC study gathers data every 4 years from adolescents aged 11, 13, or 15 years through school-based self-report surveys. It started in 1983-1984 with five countries, whereas it included 44 countries in 2013-2014. All countries use standard methodology (e.g., Currie & Alemán-Díaz, 2015; World Health Organization, 2016).
Sample Descriptives Per Country.
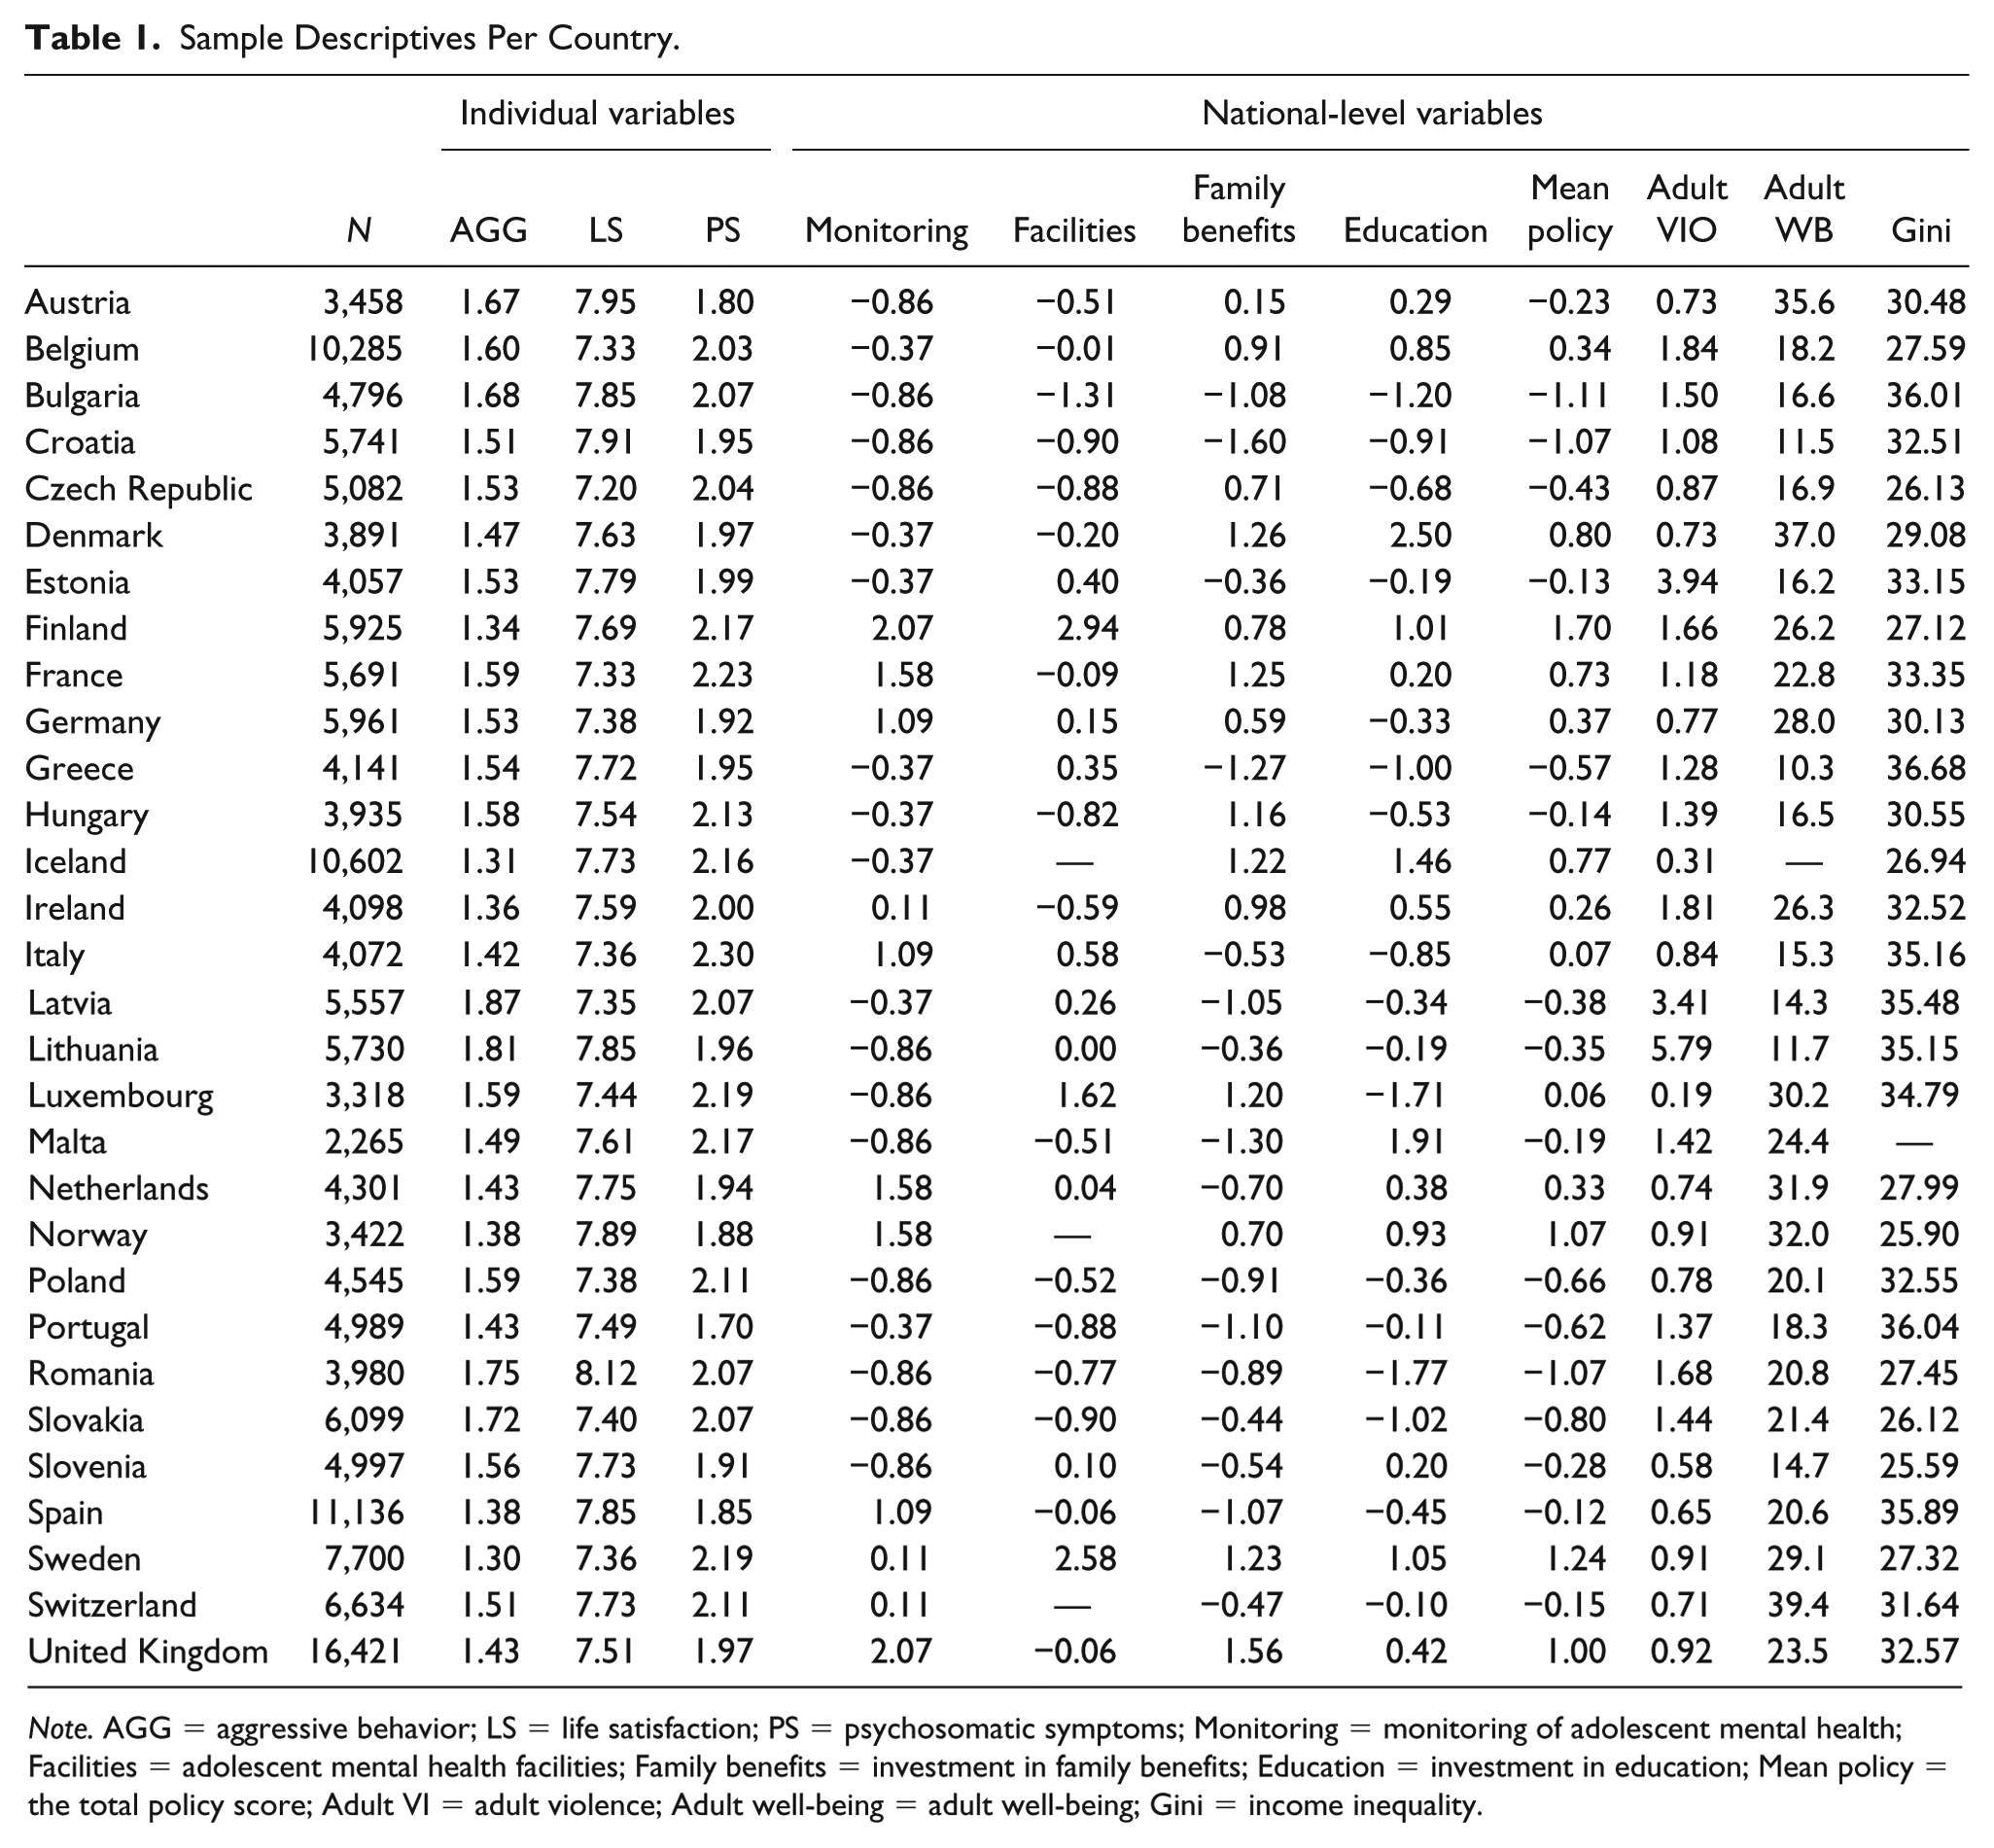
Note. AGG = aggressive behavior; LS = life satisfaction; PS = psychosomatic symptoms; Monitoring = monitoring of adolescent mental health; Facilities = adolescent mental health facilities; Family benefits = investment in family benefits; Education = investment in education; Mean policy = the total policy score; Adult VI = adult violence; Adult well-being = adult well-being; Gini = income inequality.
Individual-Level Measurements
Aggressive behavior
Aggressive behavior was assessed with two items. One item evaluated the frequency of physical fights, “During the past 12 months, how many times were you in a physical fight?” using a 5-point scale: I have not been in a physical fight, 1 time, 2 times, 3 times, and 4 times or more (Centers for Disease Control and Prevention et al., 2006). This item was developed as part of the Youth Risk Behavior Survey Questionnaire (Brener, Collins, Kann, Warren, & Williams, 1995) and validated in adolescents both as a continuous (Pickett, 2005) and dichotomous (Pickett et al., 2013; Walsh et al., 2013) variable. The second item assessed the frequency of bullying others, “How many times have you bullied others at school in the previous months?” with the following response options: I haven’t, once or twice, 2 or 3 times a month, about once a week, and several times a week (Olweus, 1992). Based on item content and the correlation between the items (r = .28), the two items were combined into a mean score of aggressive behavior; higher scores indicated more aggressive behavior.
Life satisfaction
Life satisfaction was measured with the Cantril ladder of life satisfaction (Cantril, 1965), adapted for use with adolescent samples by omitting the part asking to imagine the best and worst possible life (Levin & Currie, 2014). The item asks adolescents where on a ladder they would rate their satisfaction with life. Possible answers ranged from 0 = worst possible life at the bottom of the ladder to 10 = best possible life at the top of the ladder. We included the individual scores as a continuous variable.
Psychosomatic symptoms
Psychosomatic symptoms were assessed with the following questions from the HBSC symptom checklist: “In the last 6 months: how often have you had the following? 1) headache, 2) stomach-ache, 3) back ache, 4) feeling low, 5) irritability or bad temper, 6) feeling nervous, 7) difficulties in getting to sleep, and 8) feeling dizzy.” Possible responses were about every day, more than once a week, about every week, about every month, rarely or never. The measure has demonstrated reliability and validity for research on adolescents (Cronbach’s α in the present study was .83; Ravens-Sieberer et al., 2008). Following previous research (Ravens-Sieberer et al., 2009), we computed the mean score. Participants with missing information on more than two items were not included in the analyses. A higher score indicated more psychosomatic symptoms.
Demographic variables
We included age, gender, and SES as demographic variables because of their associations with adolescent mental health (e.g., Archer, 2004; Cavallo et al., 2006; Sweeting & West, 2003). Age was included as a categorical variable, with the categories 11, 13, and 15 years. SES was measured with the Family Affluence Scale (FAS; Currie et al., 2008; Torsheim et al., 2016) comprising six items: “Does your family own a car, van or truck?” (No = 0, Yes = 1, Yes, two or more = 2); “During the past 12 months, how many times did you travel away on holiday with your family?” (Not at all = 0, Once = 1, Twice or more = 2); “How many computers does your family own?” (None = 0, One = 1, Two or more = 2); “Do you have your own bedroom for yourself?” (No = 0, Yes = 1); “Does your family own a dishwasher?” (No = 0, Yes = 1, Yes, two or more = 2); “How many bathrooms are there in your house?” (None = 0, One = 1, Two or more = 2). Following previous HBSC studies (Elgar, Gariépy, Torsheim, & Currie, 2017; Levin et al., 2011; Torsheim et al., 2004; Walsh, Bruckauf, & Gaspar, 2016), we used the ridit transformation of the sum scores to render relative FAS scores comparable across countries. In this transformation, FAS scores within each country were assigned a distribution between 0 and 1, with a country mean of 0.5 (Torsheim et al., 2004). A higher score was indicative of a higher SES.
National-Level Indicators for Policies
Descriptives of all policy indicators per country as transformed for the analyses are described in Table 1. The original values of the policy indicators are presented in Supplemental Table 1. For analyses on the separate policies, we used unstandardized values; to create a total policy score, we standardized the values. First, we derived the extent to which countries monitor adolescent mental health through collection of epidemiological data using information from the Global Burden of Disease Study (GBD; Institute for Health Metrics and Evaluation, 2018). Countries could report on six types of children’s psychopathologies, including conduct disorder, attention-deficit/hyperactivity disorder, autism spectrum disorders, eating disorders, depression, and anxiety. Countries received a score (i.e., 0-6) based on the number of children’s psychopathology types countries reported to have epidemiological data on, in either the 2010 or 2013 GBD study (Erskine et al., 2017; see supplemental material). We standardized the variable to have a mean of 0 and a standard deviation of 1. Monitoring scores before standardization ranged between 0 (Bulgaria, Croatia, Czech Republic, Lithuania, Luxembourg, Malta, Poland, Romania, Slovakia, Slovenia) and 6 (Finland and the United Kingdom).
Second, as indicators of adolescent mental health facilities in a country, we used the number of child and adolescent mental health services (CAMHS), the number of psychiatrists, and the number of psychologists per 100,000 young people (i.e., younger than 18 or the age of majority in a country). CAMHS were defined as specialist, community-based, multidisciplinary mental health services, delivering medical and psychosocial interventions. We derived this information from the article by Signorini and colleagues (2017), which describes the current status of CAMHS in the European Union based on a questionnaire completed by child psychiatrists and representatives of national child psychiatry associations. We standardized these variables to have a mean of 0 and a standard deviation of 1 and combined them into a single factor score (Cronbach’s α = .63). For Iceland, Norway, and Switzerland, we did not find a source to complement this variable; therefore, we coded them as missing. The three variables had the following ranges per 100,000 young people: number of CAMHS, 0.50 (Bulgaria) to 12.90 (Finland); number of CAMH psychiatrists, 1.90 (Bulgaria) to 36.00 (Finland); number of psychologists, 1.70 (Bulgaria) to 104.20 (Sweden).
Third, investment in family benefits to support (vulnerable) families was measured by the percentage of a country’s GDP spent on family benefits. We retrieved this information from the Organisation for Economic Co-operation and Development (OECD) family database describing country percentages from 2012 or 2013 (http://www.oecd.org/els/family/database.htm; OECD Social Policy Division, 2016). For countries for which the OECD did not report this information (indicated with an asterisk in Supplemental Table 1), we retrieved information from the World Social Protection Report (correlation between estimates from the OECD and the World Social Protection Report for countries with data available from both was .89; International Labour Office, 2014). Family benefits referred to payments solely for families and children, namely, child payments and allowances, parental leave benefits, and childcare support. The percentage of the GDP was a combination of cash transfers to families, payments to services to support families with children, and financial support for families provided through tax benefits. We standardized this variable to have a mean of 0 and a standard deviation of 1. Before transformation, scores ranged between 0.96% (Croatia) and 3.95% (the United Kingdom).
Fourth, investment in education was measured by national-level percentages of GDP spent on education, derived from Eurostat, the statistical office of the European Union (Eurostat, 2016). The variable represented the percentage of the national GDP spent on education. This was through funding by the public sector given to educational institutions or students and their families, or through public subsidies to private firms or nonprofit organizations to support educational activities. We standardized the values to have a mean of 0 and a standard deviation of 1. Before transformation, the values ranged between 3.07% (Romania) and 8.75% (Denmark).
Total policy score
Due to the transformation, the separate policy variables had a similar scale, allowing for combining them into a single total policy score. We calculated a total policy score for each country; Cronbach’s α was .65. Because there were some missing values, we used the mean of each country instead of a sum score.
Other National-Level Indicators Related to Adolescent Mental Health
Adult violence
We used countries’ homicide rates as a proxy for adult violence. We obtained this information from Eurostat, which reported the number of intentional homicides per 100,000 inhabitants reported in 2013 based on police records (Eurostat, 2017). The number of intentional homicide rates was lowest in Iceland (0.31) and highest in Lithuania (5.79).
Adult well-being
We derived data on national-level adult well-being from the Gallup-Healthways Global Well-Being Index based on interviews administered in 2014. This index comprises the world’s largest dataset on well-being. The interviews investigated five dimensions of well-being (i.e., purpose, social, financial, community, and physical). The reported numbers refer to the percentage of the population thriving on at least three dimensions (Gallup-Healthways Well-Being Index, 2014). Adult well-being was lowest in Croatia (11.5) and highest in Switzerland (39.4).
Income inequality
To measure income inequality, we used the Gini index (The World Bank Group, 2017). In the present study, we report the most recent estimates; these were obtained by the World Bank between 2011 and 2013. These estimates derived from the World Bank were percentages ranging between 0 and 100; 0 indicated perfect equality, 100 indicated perfect inequality. Some articles report Gini estimates ranging from 0 to 1; the scale, however, did not have consequences for the results. Slovenia had the lowest income inequality (25.59); Greece had the highest (36.68).
Analyses
First, we explored the data by performing descriptive analyses and obtaining correlations between all variables. Second, we performed multilevel analyses separately for aggressive behavior, life satisfaction, and psychosomatic symptoms to examine the relationship between national-level indicators and indicators of adolescent mental health. To adjust for oversampling of subpopulations, we applied survey weights in the multilevel analyses. We fitted two-level random intercept models with adolescents (Level 1) nested within countries (Level 2). To examine the contribution of all variables, we performed blockwise model fitting. We fitted a model containing only the dependent variable (adolescent aggressive behaviors, also separately for fighting and bullying, reported in Supplemental Tables 2 and 3, life satisfaction, or psychosomatic symptoms; Model 1), subsequently adding the demographic variables (Model 2), the total policy score (Model 3.1), or the separate policy variables (Model 3.2). Next, we added adult violence, adult well-being, and income inequality both with the total policy score (Model 4.1), and the separate policy variables (Model 4.2). To correct for the large number of tested variables, and control the familywise error rate, the significance threshold was p < .01. We z-standardized the adolescent aggressive behavior and psychosomatic symptoms for interpretability of the parameter estimates. For life satisfaction, we retained the scale because of the interpretation of a single-unit increase as a higher step on the ladder.
Results
Table 1 displays the country means for aggressive behavior, life satisfaction, and psychosomatic symptoms, and the values for the national-level indicators. Mean adolescent aggressive behavior was lowest for Sweden (1.30) and highest for Latvia (1.87). Adolescent life satisfaction was lowest in the Czech Republic (7.20) and highest in Romania (8.12). Adolescents in Portugal scored lowest on psychosomatic symptoms (1.70), and adolescents in Italy scored highest (2.30). The country scoring the lowest on policy was Bulgaria (–1.11); the country scoring the highest was Finland (1.70). Figure 1 graphically displays the country means of CAMH policies, and adolescent aggressive behaviors, life satisfaction, and psychosomatic symptoms.
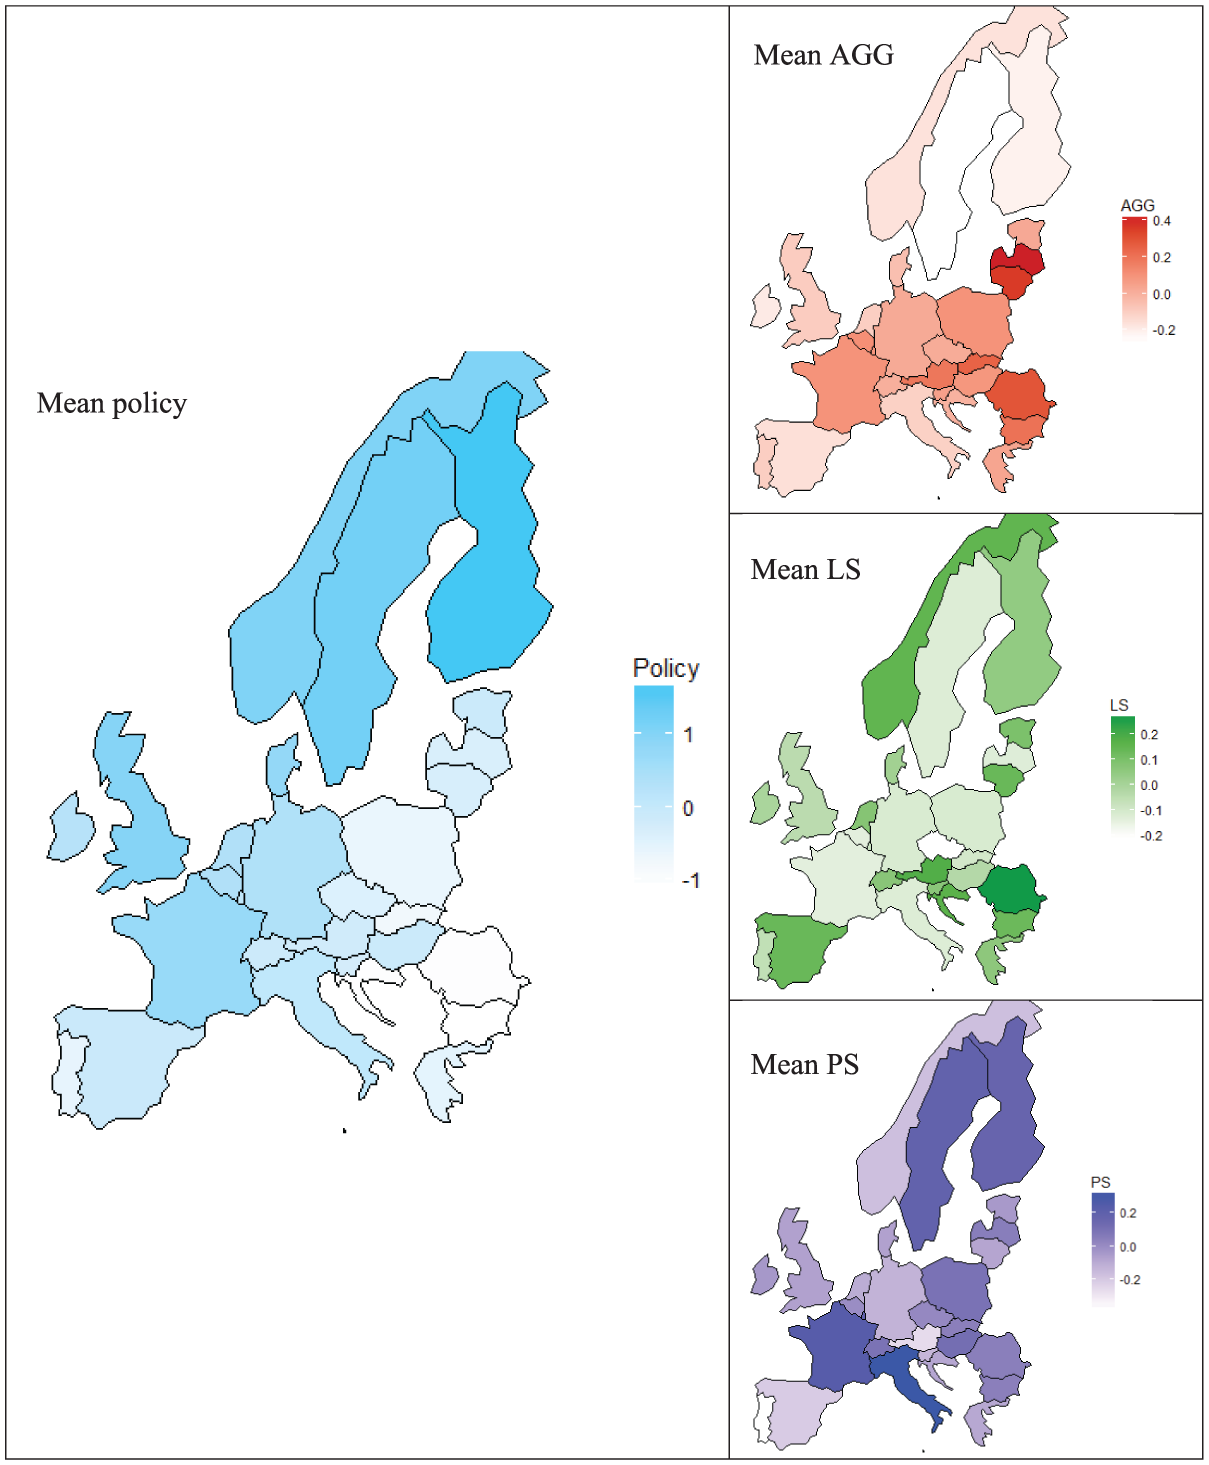
Country means for total policy, adolescent aggressive behaviors (AGG), life satisfaction (LS), and psychosomatic symptoms (PS).
Table 2 shows the disaggregate pooled correlations between all indicators of adolescent mental health and national-level variables. As expected, a positive association was found between aggressive behavior and psychosomatic symptoms. Aggressive behavior and psychosomatic symptoms were both negatively associated with life satisfaction. The correlations between the indicators of adolescent mental health and the national-level indicators (i.e., total policy, monitoring, structural facilities, investment in family benefits, investment in education, adult violence, adult well-being, income inequality) were small but almost all significant. As expected, adolescent aggressive behavior was weakly negatively associated with all national indicators except for positive associations with adult violence and income inequality. Adolescent life satisfaction, unexpectedly, was negatively associated with all policy variables and positively associated with adult violence and income inequality; there was no association with adult well-being. Adolescent psychosomatic symptoms had, similarly, and unexpectedly, weak positive associations with most national-level indicators, except for a negative association with adult violence and income inequality, and no association with monitoring. The associations between the national-level indicators were stronger than the associations between the (individual) adolescent mental health indicators and the national-level indicators, and in the expected direction. For instance, adult well-being was positively associated with all policy variables, but negatively associated with adult violence and income inequality. Adult violence, on the other hand, had negative associations with all policy variables and adult well-being, and a positive association with income inequality.
Pooled Correlations Between the Individual Variables and the National-Level Variables.

Note. AGG = aggressive behavior; LS = life satisfaction; PS = psychosomatic symptoms; Total policy = the total policy score; Monitoring = monitoring of adolescent mental health; Facilities = adolescent mental health facilities; Family benefits = investment in family benefits; Education = investment in education; Adult VIO = adult violence; Adult well-being = adult well-being; Gini = income inequality. All correlations except the following had a p value < .01: Adolescent life satisfaction with adult well-being, and adolescent psychosomatic symptoms with monitoring.
Aggressive Behavior
Table 3 displays the results of the linear multilevel regression analyses of aggressive behavior. According to the null model (Model 1), there was significant but small country-level variance in aggressive behavior. Dividing the country-level variance by the total variance (0.031/(0.031 + 0.967) = 0.031) yielded an intraclass correlation of .031, which revealed that 3.1% of total variance in aggressive behavior was due to between-country variation. The model that included the demographic variables (Model 2) indicated that aggressive behavior was lowest at age 15, was higher for boys, and was not related to SES. Adding total policy in Model 3.1 showed a significant negative association with aggressive behavior, indicating that there was more aggressive behavior in countries with fewer policies. Model 3.2 revealed that none of the separate policies was associated with aggressive behavior. Controlling for the other national-level indicators (i.e., adult violence, adult well-being, income inequality; Model 4.1) yielded a positive association between adolescent aggressive behavior and adult violence, indicating that adolescent aggressive behavior was higher in countries with higher levels of adult violence. In addition, the significant association between policy and adolescent aggressive behaviors remained after controlling for the other national-level indicators. In line with Model 3.2, Model 4.2 showed no effect of separate policies on adolescent aggressive behavior. Across the models, country-level variance decreased from 0.031 to 0.011, indicating that the variables explained 65% of the country-level variance in adolescent aggressive behavior.
Results of Linear Multilevel Regression Analyses of Aggressive Behavior.
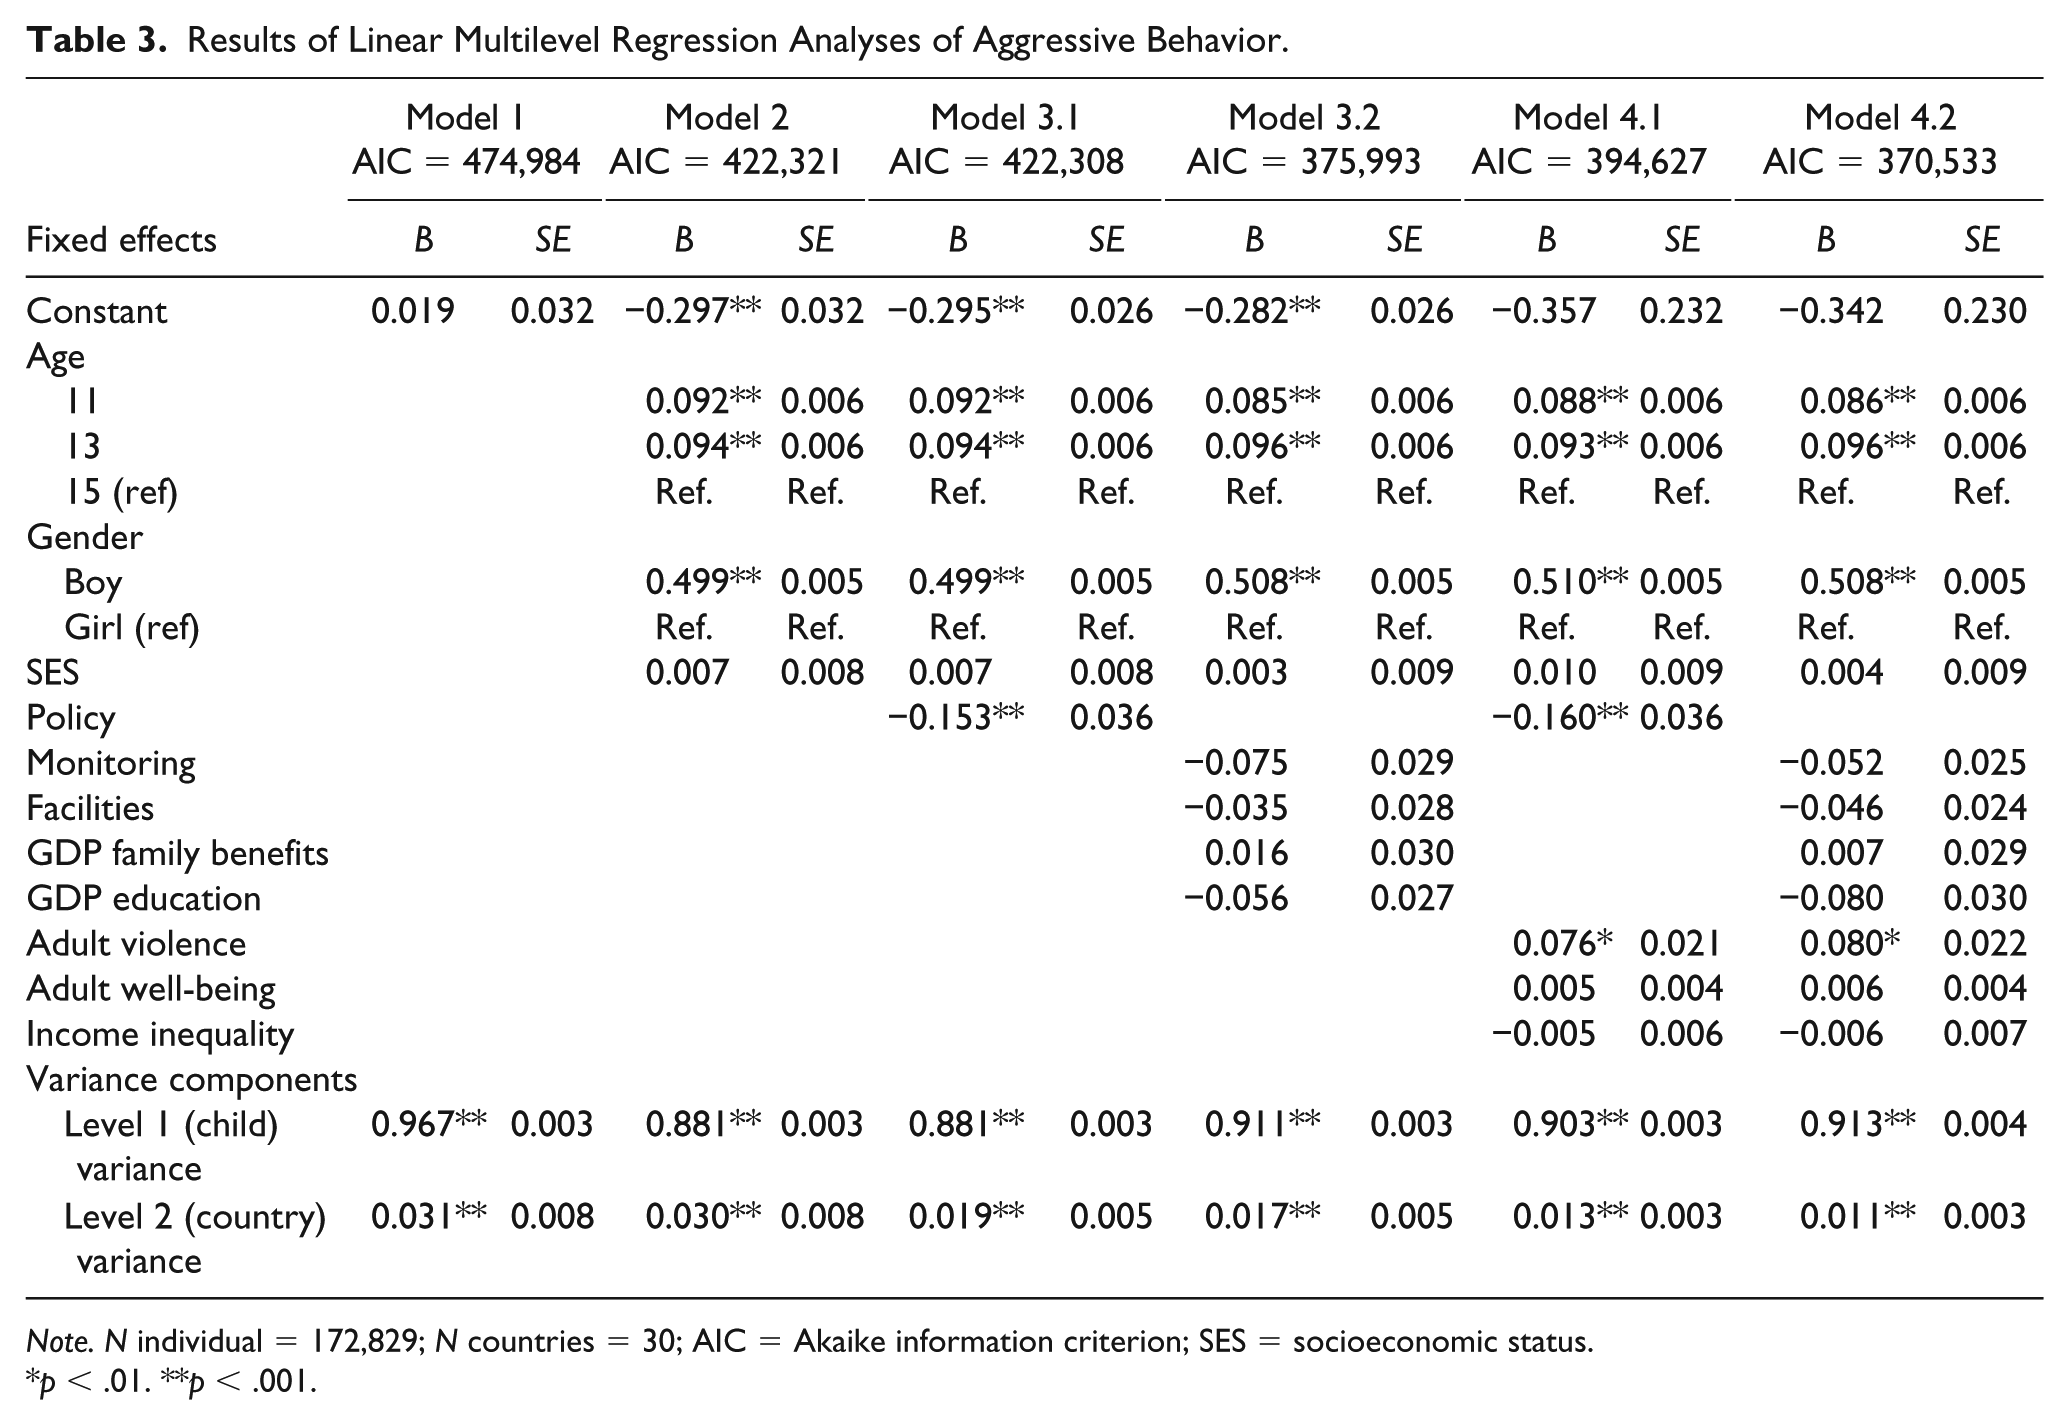
Note. N individual = 172,829; N countries = 30; AIC = Akaike information criterion; SES = socioeconomic status.
p < .01. **p < .001.
Life Satisfaction
Table 4 displays the results of the linear multilevel regression analyses for adolescent life satisfaction. The null model (Model 1) showed significant but small country-level variance in life satisfaction. Of the total variance in life satisfaction, 1.4% (0.051/(0.051 + 3.628) = 0.014) was at the country level. Model 2 indicated that life satisfaction decreased with age, was higher for boys, and was higher for adolescents with a higher SES. Adding policy to the model (Model 3.1) revealed no significant association with life satisfaction. Similarly, the model including the separate policies (Model 3.2) showed no effect on life satisfaction. When taking the other national-level indicators into account (Model 4.1 and Model 4.2), there was no association between policy (i.e., total policy and separate policies) and adolescent life satisfaction either. Moreover, no associations between life satisfaction and the other country-level variables (adult violence, adult well-being, and income inequality) were found. Country-level variance decreased from 0.051 to 0.036 across models, indicating that the variables explained (0.051 – 0.036)0.051 = 29% of the between-country variance in adolescent life satisfaction.
Results of Linear Multilevel Regression Analyses of Life Satisfaction.
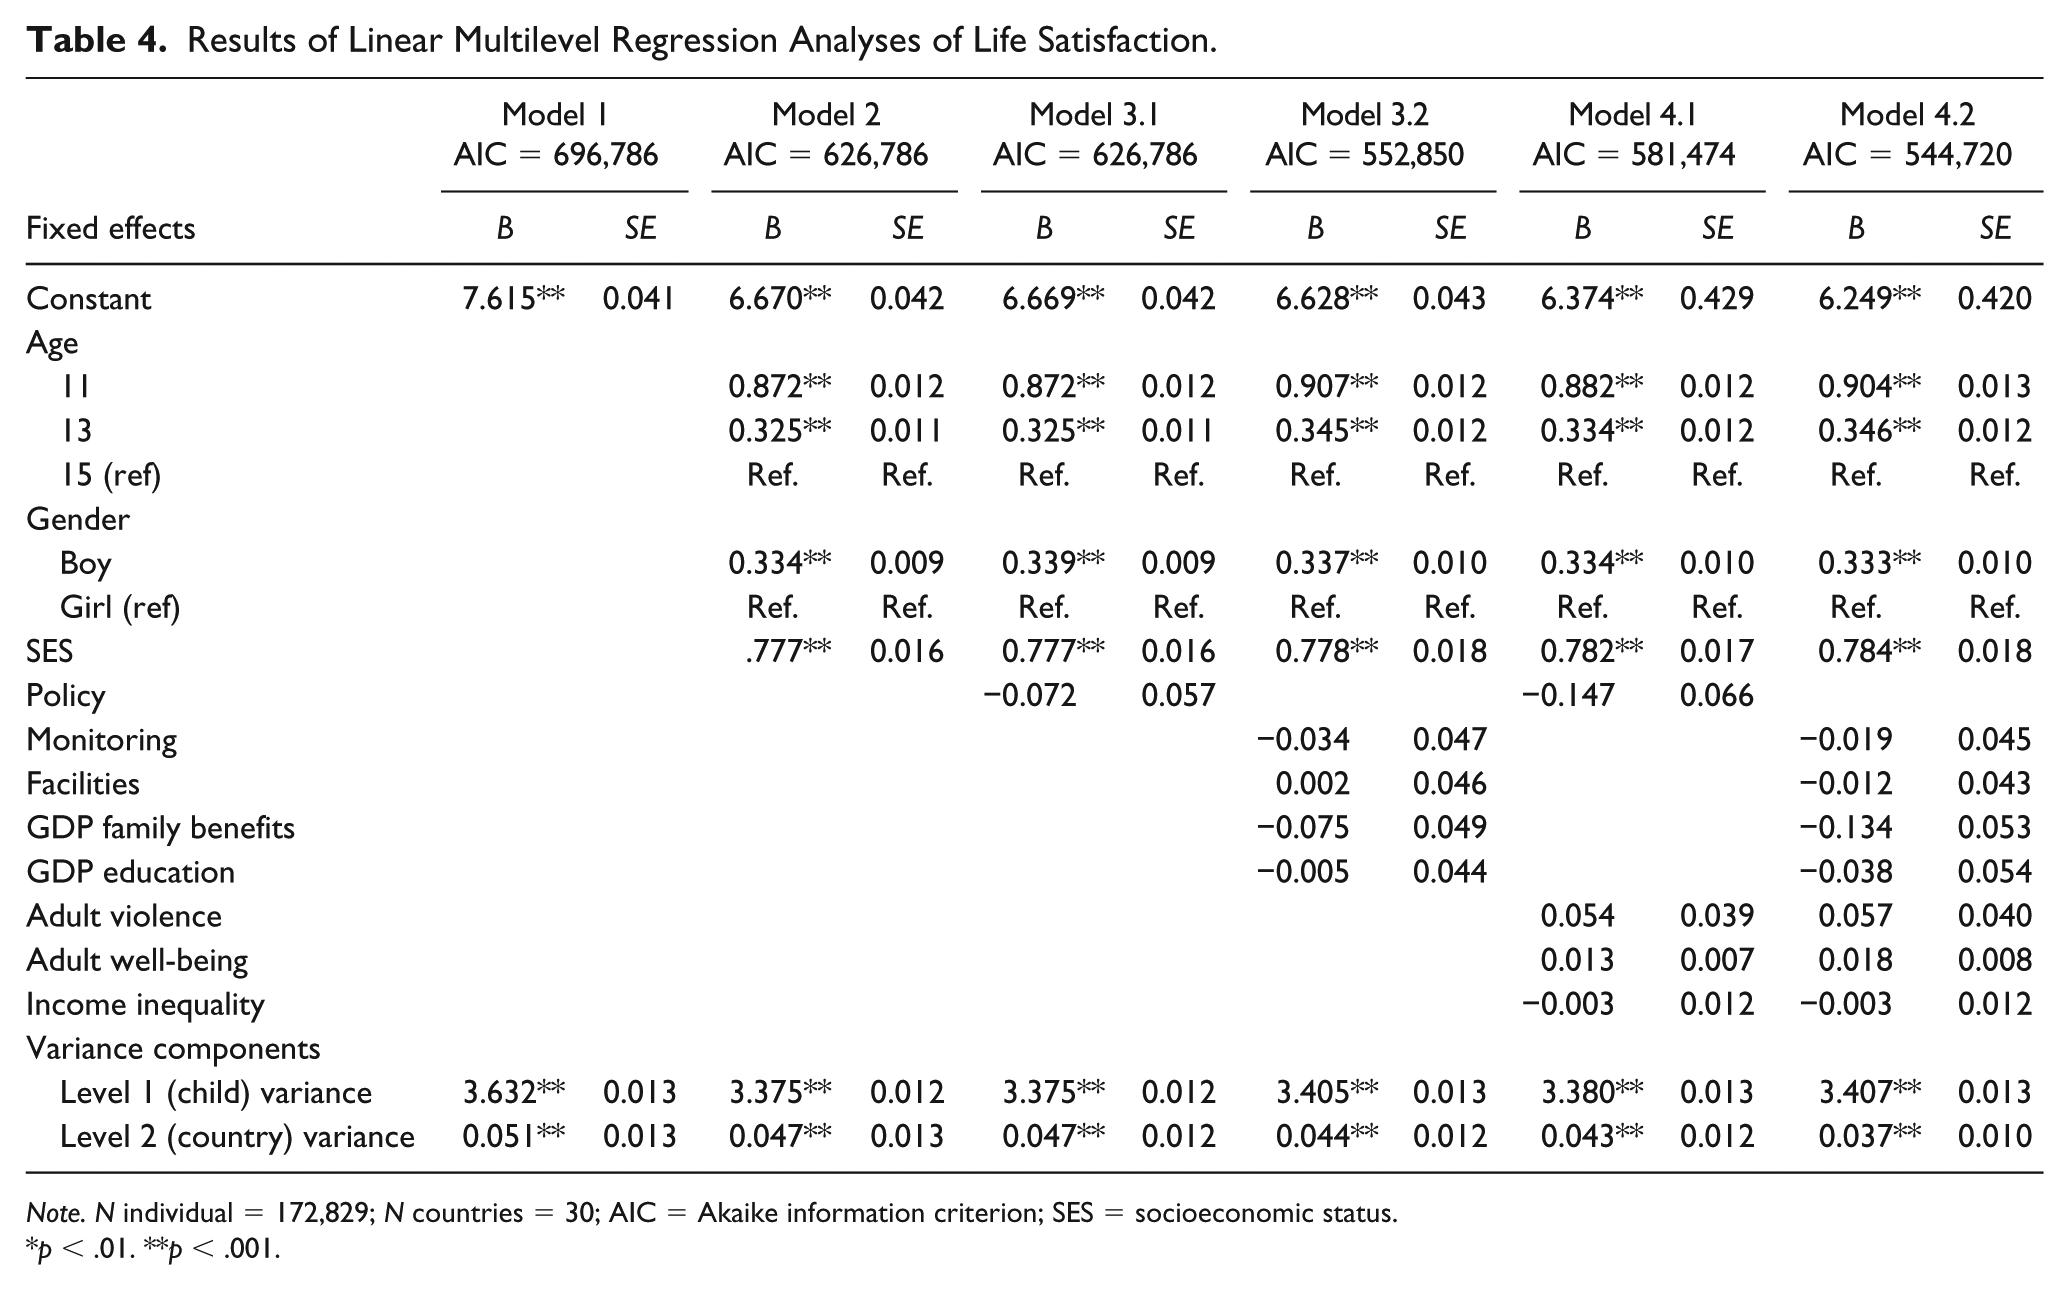
Note. N individual = 172,829; N countries = 30; AIC = Akaike information criterion; SES = socioeconomic status.
p < .01. **p < .001.
Psychosomatic Symptoms
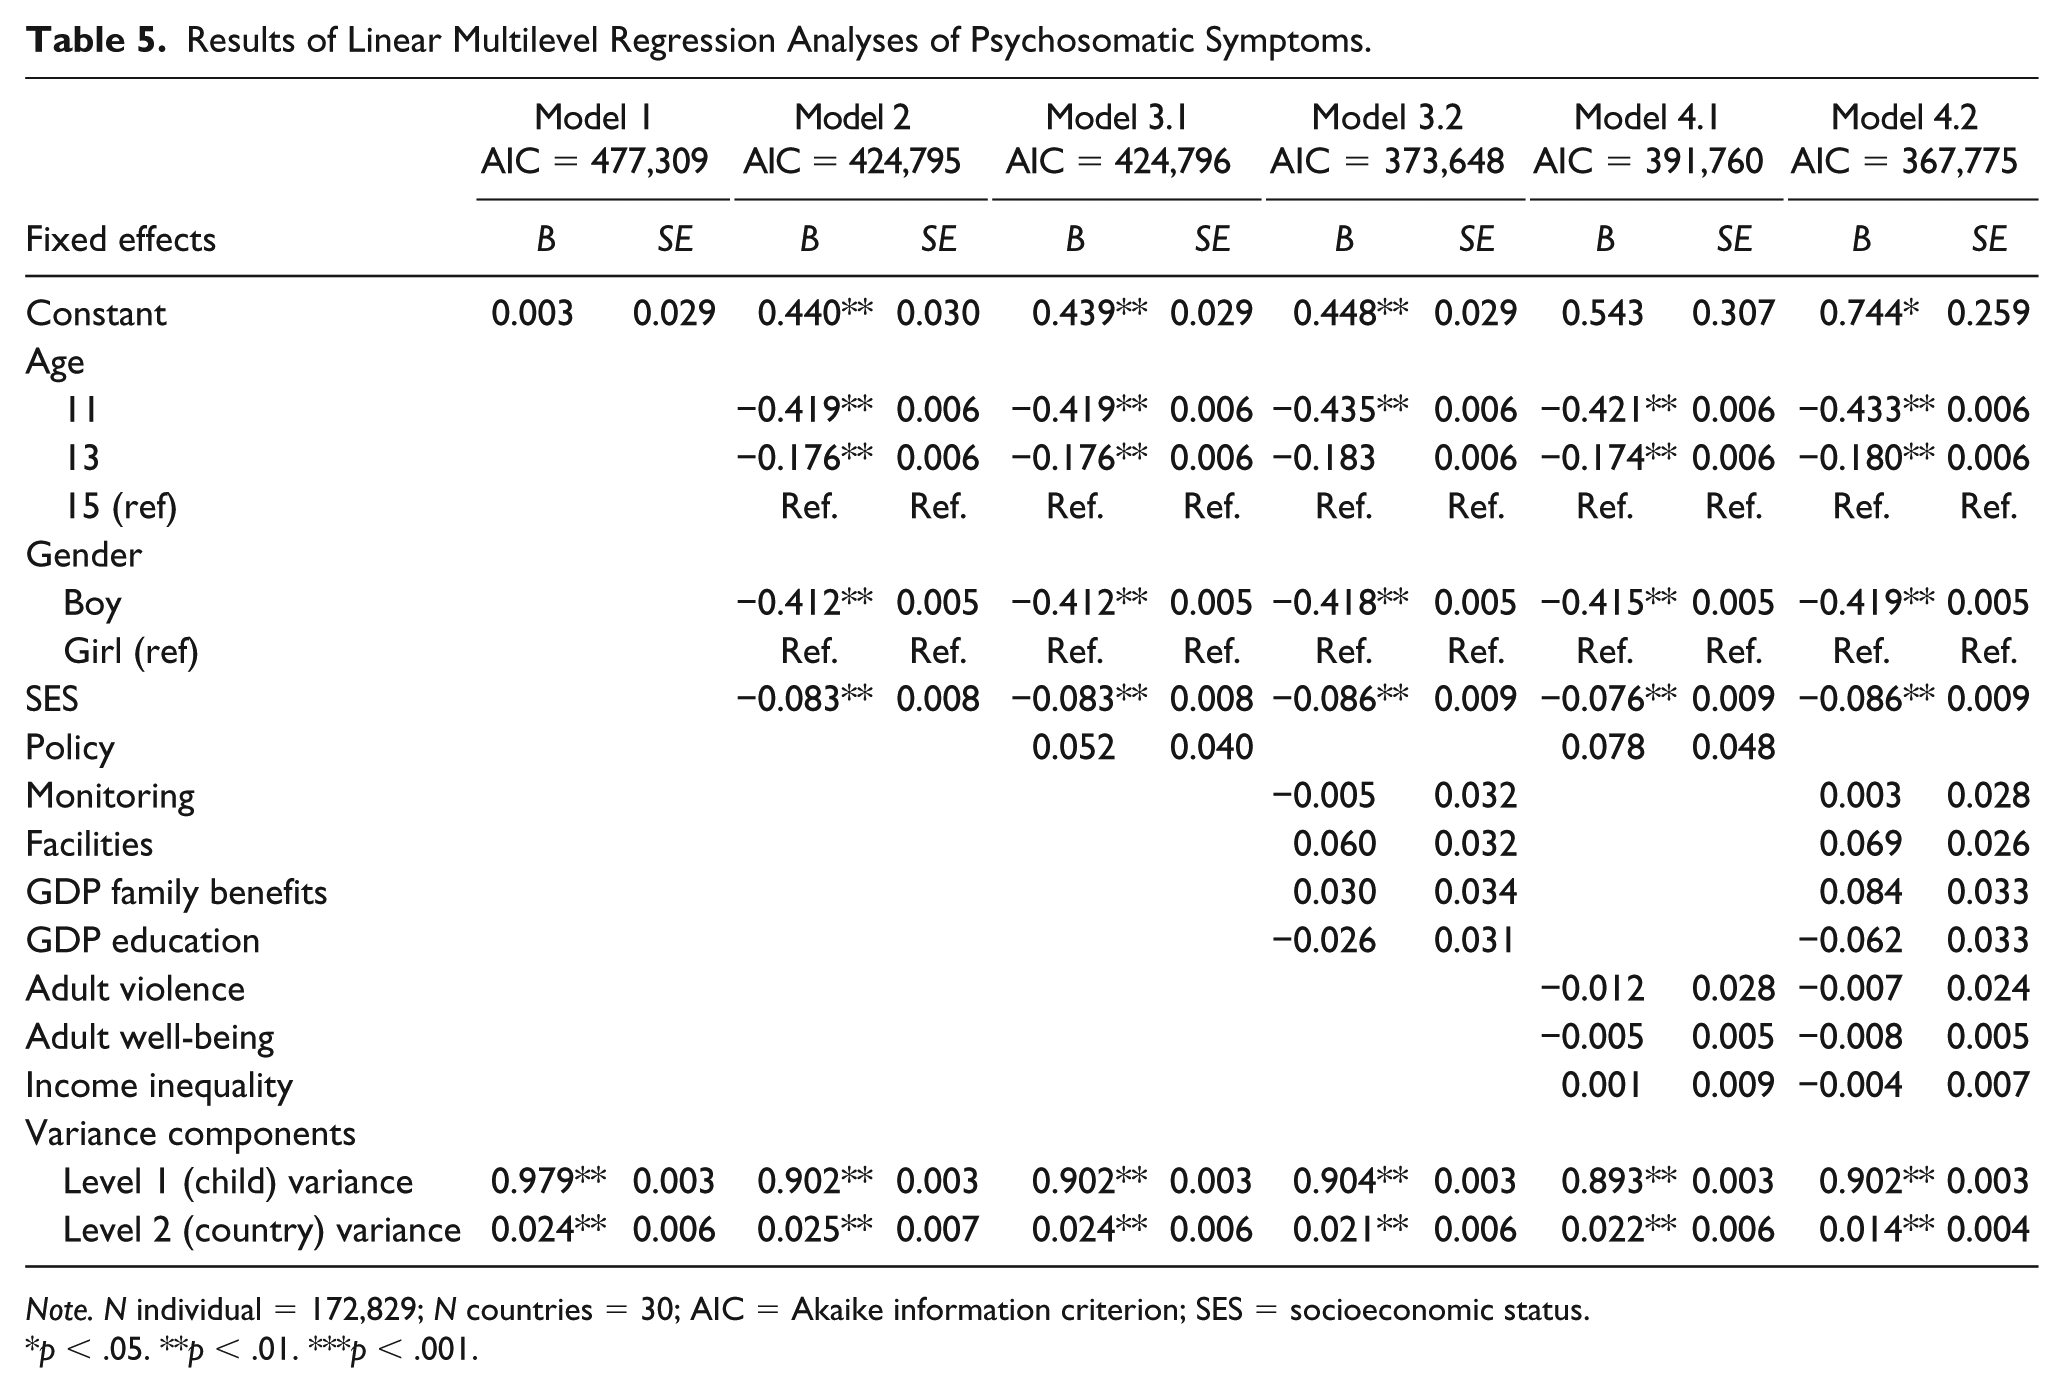
Table 5 displays the results of the linear multilevel regression analyses for adolescent psychosomatic symptoms. The null model (Model 1) revealed significant but small country-level variance in psychosomatic symptoms. Of the total variance in psychosomatic symptoms, 2.4% (0.024/(0.024 + 0.977) = 0.024) was at the country level. Psychosomatic symptoms increased with age, were lower for boys, and were lower for adolescents with a higher SES (Model 2). Including total policy (Model 3.1) yielded no significant association with psychosomatic symptoms. Similarly, when examining the separate policies (Model 3.2), there were no significant associations with psychosomatic symptoms. Controlling for the other national-level variables (which were not significantly related to psychosomatic symptoms; Model 4.1), the association of total policy with adolescent psychosomatic symptoms remained nonsignificant, and the same was true for the separate policies (Model 4.2). There was almost no decrease in country-level variance between the models (0.024-0.022).
Results of Linear Multilevel Regression Analyses of Psychosomatic Symptoms.
Note. N individual = 172,829; N countries = 30; AIC = Akaike information criterion; SES = socioeconomic status.
p < .05. **p < .01. ***p < .001.
Discussion
The present study aimed to examine the association between policies for CAMH and indicators of adolescent mental health (i.e., aggressive behavior, life satisfaction, and somatic complaints), controlling for indicators of cultural and social norms (i.e., adult violence, adult well-being, income inequality). We found a relation between combined policies for CAMH and adolescent aggressive behavior, whereby more policies were associated with fewer reported adolescent aggressive behaviors. Policies for CAMH were not associated with adolescent life satisfaction and psychosomatic symptoms. Our findings for aggressive behavior are in line with earlier research that reports a more robust decrease in externalizing behavior problems as a result of improving SES than for internalizing problems (Reiss, 2013). Some of the included CAMH policies comprised investments to decrease the effects of SES (i.e., investments in family benefits, investments in education) on CAMH; thus, this may explain why CAMH policies were associated with adolescent aggressive behaviors, but not with life satisfaction and psychosomatic symptoms. Also, we know more about prevention and treatment of mental health problems than about the promotion of positive mental health (Barry, 2009; Bartels, Cacioppo, Van Beijsterveldt, & Boomsma, 2013; Weisz et al., 2017; Welsh et al., 2015), which may explain that we found an association with CAMH policy for adolescent aggressive behaviors but not for life satisfaction. Finally, high levels of aggressive behaviors may be a more salient societal issue than low levels of life satisfaction and/or high levels of psychosomatic symptoms. Aggressive behaviors are among the most prevalent disorders (NICE, 2013), often co-occur with other disorders or adversity (Bartels et al., 2018; Sousa, Correia, Ramos, Fraga, & Barros, 2010; Walsh et al., 2013), and are costly for society (Rivenbark et al., 2018; Scott, Knapp, Henderson, & Maughan, 2001). These characteristics may make them a more likely target for policies compared with life satisfaction or psychosomatic complaints.
Although the multilevel analyses failed to find country-level variance for policies for CAMH in adolescent life satisfaction and psychosomatic symptoms, we have reasons to suspect their importance. In contrast to the adolescent mental health indicators, the correlations between adult violence and well-being with the policy variables were strong and in the expected direction (i.e., more policies, less violence, and higher levels of well-being, respectively). The adult correlations may indicate that adults have been exposed longer to the positive effect of policies or that effects of policies are more easily accessible to adults (e.g., family benefits) than to adolescents (Gulliver, Griffiths, & Christensen, 2010; Rocha, Graeff-Martins, Kieling, & Rohde, 2015; Tylee et al., 2007). In addition, policies such as investment in family benefits may alleviate stress among low-SES adults in a family more strongly and directly than among low-SES adolescents (e.g., Evans, 2004), and consequently relate more strongly to adult mental health than adolescent mental health. Nevertheless, although not detected in the present study, through alleviation of stress of the adults in the family, these policies still may have a positive effect on adolescent mental health. Future research on the mechanisms underlying the differential relations between policies and adult and adolescent mental health indicators may enhance our understanding of how national CAMH policies may benefit adolescent mental health.
Strengths and Limitations
The present study included large, nationally representative samples from the HBSC study, allowing us to include individual-level data from 30 countries combined with national-level indicators from renowned statistical institutes (Currie & Alemán-Díaz, 2015). Also, we included both income inequality and adult violence and well-being to account for some confounding differences between countries.
Despite these strengths, a number of limitations should be noted. First, the data were cross-sectional, preventing causal inferences. Examining adolescent mental health in the years after implementing a policy for CAMH may provide important insights in the direction of effects, mechanisms, and changes over time (e.g., some policies may become increasingly effective). Furthermore, longitudinal research may illuminate whether and why the association between CAMH policies and adolescent mental health varies across different indicators of adolescent mental health. It would be interesting to investigate this prospectively profiting from the increase of big data and recording of national-level information (e.g., Fuller, Buote, & Stanley, 2017), but also retrospectively with existing data on adolescent mental health and national-level data from statistical institutes across the last decades.
Second, by combining national-level information with individual-level data, our analyses regarding policies for CAMH only allowed for national-level comparisons. Adolescent mental health may, however, be (more) susceptible to influences of more proximal-level contexts such as regions, schools, peers, and the family (McLeroy et al., 1988; UNICEF, 2018). To add to complexity, these levels may be affected differently by national CAMH policies. To illustrate, adolescents from more disadvantageous backgrounds may benefit more from more structural facilities such as schools or mental health care facilities than adolescents from more advantageous backgrounds (e.g., Hatch et al., 2012; Phelan, Link, Diez-Roux, Kawachi, & Levin, 2004). In addition, implementation of CAMH policies may vary within countries, and, therefore, national-level information may not yet provide a complete impression of the association between CAMH policies and adolescent mental health. Research on these mechanisms and interactions of the effects of policies for CAMH on adolescent mental health, including more proximal levels of influence, would, therefore, be particularly promising.
Conclusion
Combining national-level information from renowned institutes with the individual-level data from the HBSC study allowed us to examine whether policies for CAMH are associated with adolescent mental health. We found less adolescent aggressive behaviors in countries with more policies for CAMH. There was no association between policies for CAMH and adolescent life satisfaction and psychosomatic symptoms. To examine whether and how policies may affect adolescent life satisfaction and psychosomatic symptoms, more research is needed. Nevertheless, our findings provide a good starting point for further research on the implications of policies for CAMH for adolescent mental health.
Supplemental Material
Supplementary_Material – Supplemental material for National Child and Adolescent Health Policies as Indicators of Adolescent Mental Health: A Multilevel Analysis of 30 European Countries
Supplemental material, Supplementary_Material for National Child and Adolescent Health Policies as Indicators of Adolescent Mental Health: A Multilevel Analysis of 30 European Countries by Anne M. Hendriks, Meike Bartels, Gonneke W. J. M. Stevens, Sophie D. Walsh, Torbjørn Torsheim, Frank J. Elgar and Catrin Finkenauer in The Journal of Early Adolescence
Footnotes
Acknowledgements
This study used survey data collected in the 2013-2014 cycle of the Health Behaviour in School-Aged Children (HBSC) study. The HBSC study is a World Health Organization collaborative study and is supported by each member country. The HBSC study is coordinated internationally by J. Inchley, University of St. Andrews, Scotland, with international data coordination performed by O. Samdal, University of Bergen, Norway. The countries involved in this analysis (including current responsible PI) were Austria (R. Felder-Puig), Belgium (C. Vereecken, A. Hublet, D. Piette), Bulgaria (L. Vasileva), Croatia (M. Kuzman, I. Pavic Simetin), Czech Republic (M. Kalman), Denmark (P. Due, M. Rasmussen), Estonia (K. Aasvee), Finland (J. Tynjälä), France (E. Godeau), Germany (P. Kolip, M. Richter), Greece (A. Kokkevi), Hungary (Á. Németh), Iceland (A. Arnarsson), Ireland (S. Nic Gabhainn, M. Molcho), Italy (F. Cavallo), Latvia (I. Pudule), Lithuania (A. Zaborskis), Luxembourg (Y. Wagener), Malta (C. Gauci), the Netherlands (W. Vollebergh, T. ter Bogt), Norway (O. Samdal), Poland (J. Mazur), Portugal (M. Gaspar de Matos), Romania (A. Baban), Slovakia (A. Madarasová Gecková), Slovenia (H. Jericek), Spain (C. Moreno Rodriguez), Sweden (L. Augustine, P. Lofstedt), Switzerland (E. Kuntsche), and the United Kingdom (A. Morgan, F. Brooks, C. Currie, J. Inchley, C. Roberts).
Declaration of Conflicting Interests
The author(s) declared no potential conflicts of interest with respect to the research, authorship, and/or publication of this article.
Funding
The author(s) disclosed receipt of the following financial support for the research, authorship, and/or publication of this article: This work was supported by the “Aggression in Children: Unraveling gene-environment interplay to inform Treatment and Intervention strategies” project (ACTION). ACTION receives funding from the European Union Seventh Framework Program (FP7/2007-2013) under grant agreement no. 602768. Meike Bartels is supported by an ERC consolidator grant (WELL-BEING 771057 principal investigator [PI] Bartels). The funding sources were not involved in the preparation of the article.
Supplemental Material
Supplemental material for this article is available online.
Author Biographies
References
Supplementary Material
Please find the following supplemental material available below.
For Open Access articles published under a Creative Commons License, all supplemental material carries the same license as the article it is associated with.
For non-Open Access articles published, all supplemental material carries a non-exclusive license, and permission requests for re-use of supplemental material or any part of supplemental material shall be sent directly to the copyright owner as specified in the copyright notice associated with the article.