
Abstract
Rapid breakdown of cerebral glucose metabolism is a hallmark in stroke pathology. Metabolic activity delineates the penumbra from the infarct core, representing tissue that is potentially salvageable by therapeutic interventions. Tools to image dynamics of glucose and its spatial distribution could provide biomarkers of disease severity and of the success of therapeutic interventions. Here, we developed a new protocol to measure glucose transport and metabolism in a rat model of stroke using chemical exchange-sensitive spin-lock (CESL) MRI of the glucose analogue 2-deoxy-D-glucose (2DG). We further implemented a protocol that combines 2DG-CESL-MRI with perfusion and diffusion MRI to relate this new signal to established definitions of hypoperfused tissue, cytotoxic edema and the penumbra. We found that 2DG-CESL-MRI provides a biomarker of disturbed glucose transport and metabolism after stroke with high effect size. This is the first study to investigate CESL MRI of 2DG in the context of transport and metabolism imaging in rodent stroke.
Introduction
The brain almost exclusively relies on glucose as its main source of energy to sustain its function.1,2 In ischemic stroke, occlusion of a cerebral blood vessel leads to a rapid decline of oxygen, glucose and other metabolites in the affected brain region. Acute neurodegeneration is triggered by a range of mechanisms including excitotoxicity, apoptosis, mitochondrial dysfunction, and neuroinflammation.3–7 Metabolic deficiency, and in particular impaired glucose metabolism, is an important mechanism controlling acute neurodegeneration in stroke.3,8
The ischemic penumbra is defined as the hypoperfused brain tissue around the necrotic infarct core.3,9,10 In magnetic resonance imaging, the penumbra can be approximated by the mismatch between perfusion and diffusion with some limitation.11,12 The penumbra is characterized by decreased oxygen and glucose availability putting the cells of the neuro-glial-vascular unit in this tissue area at risk of death. 3 However, if blood flow is restored, the penumbra is salvageable.9,10 The penumbra is highly dynamic, with diverse cellular and molecular mechanisms influencing tissue outcomes. 3 Clinical imaging of the penumbra typically focuses on blood flow and subsequent tissue damage.13,14 Despite the early adoption of metabolic imaging in understanding the penumbra,15–17 it remains largely inaccessible in both preclinical and clinical settings. Therefore, developing scalable methods to measure glucose metabolism is crucial for improving diagnostic tools and therapeutic stratification in stroke. Established methods include ex vivo autoradiography of 14 C-labeled glucose analogues such as 2-deoxy-D-glucose (2DG) and in vivo positron emission tomography (PET) of 18F 2-fluoro-2-deoxy-D-glucose (18F-FDG). 12 Both methods have their caveats: autoradiography is invasive and unsuitable for longitudinal studies, while 18F-FDG PET requires elaborate hardware and is heavily constrained by logistics and availability of equipment, and requires a dedicated radiation protection environment e.g. of nuclear medicine departments.
Magnetic resonance imaging (MRI) is broadly available and works with non-ionizing radiation. It has evolved as a key modality in stroke imaging since the contrast of MRI can be sensitized to different biological processes within one imaging session. For example, in ischemic stroke, dedicated sequences can measure reduced cerebral blood flow (CBF) and reduced apparent diffusion coefficient (ADC) 18 to assess acute hypoperfusion and the extent of the lesion core, respectively. The mismatch of these signals provides a noninvasive marker of the penumbra. 17 Hyperintense signal in T2-weighted (T2w) imaging provides a marker of vasogenic edema in subacute stroke and of necrotic tissue in older lesions. 19 These findings have triggered MRI-based diagnostic concepts in the context of preclinical and clinical research and successfully translated to acute stroke patient care in many specialized stroke centers.19,20
Recently, MRI of natural D-glucose and glucose analogues has been achieved by exploiting chemical exchange between exchangeable protons on the molecule and the bulk water pool.21–26 The two primary methods, Chemical Exchange Saturation Transfer (CEST) and Chemical Exchange Sensitive Spin Lock (CESL) MRI, are both based on the same underlying theory about the relaxation rate in the rotating frame (R1ρ). 27 However, CESL MRI has been shown to offer slightly higher sensitivity for detecting glucose and its analogues. 27
The goal of this study was to transfer these results to the context of stroke. We aimed to establish 2DG CESL MRI as a new biomarker of glucose transport and metabolism in a rat model of ischemic stroke and combined it with T2w, CBF and ADC imaging to relate this new biomarker with established MRI markers of tissue damage.
Material and methods
Phantom preparation
For the in vitro experiments, solutions of varying concentrations of 2DG in 1x Dulbecco’s phosphate buffered saline (DPBS, Gibco, Thermo Fisher Scientific, Hennigsdorf, Germany) were prepared and filled in 5 mm NMR tubes (Carl Roth GmbH, Karlsruhe, Germany). The pH in the phantoms was measured at ∼7.1. We note that the measurements are highly dependent on the exact buffer composition and pH. For phantom imaging parameters, see MRI methods below.
Animals and study approval
Male Wistar rats (∼8 weeks old, 280–320 g, n = 12) obtained from Charles River Germany were used in this study. Rats were housed in a temperature, humidity and light (12/12-h light/dark cycle; lights on: 06:00 am, experiments performed during the light cycle) controlled environment. All animal procedures were performed after approval by the regulating authority (Landesamt für Gesundheit und Soziales Berlin). Studies were performed in accordance with the German Animal Welfare Act and EU regulations, and reporting follows the ARRIVE guidelines.
Anaesthesia and femoralis catheter
Animals were anesthetized using isoflurane in a 70%/30% N2O/O2 mixture. Anesthesia was induced with 5% isoflurane and maintained at 1.75–2.5% isoflurane during MCAO and 1.75% during MRI to achieve a breathing rate of ∼60–100/min. A catheter (Portex Fine Bore Polythene Tubing, 0.58 mm inner diameter, 0.96 mm outer diameter, 90 cm long) was surgically placed and secured in the femoral vein for 2DG i.v. injections during MRI measurements.
Middle cerebral artery occlusion (MCAO) model of focal cerebral ischemia
Directly after placing the catheter, MCAO was surgically induced by an experienced surgeon. A midline neck incision was made to expose the left common carotid artery, and a ligature was tied around the common carotid artery (CCA) and the external carotid artery (ECA). After a small incision into the CCA, a filament (390 µm diameter, 4039910PK10Re, Doccol, Sharon, MA, USA) was introduced into the CCA and advanced to the origin of the left MCA via the internal carotid artery. After 90 min, the filament was withdrawn. Both the CCA and ECA remained ligated during reperfusion. All MCAOs were performed by experienced surgeons. Blinding was not performed. Injection of 2DG (see below) led to temporary respiratory depression in many animals requiring adjustment of isoflurane concentration.
MRI measurements
The experimental design is illustrated in Figure 1. Directly after MCAO and reperfusion surgery, animals were transferred to a 7 T animal MRI (BioSpec 70/20 USR, Bruker, Ettlingen, Germany). Imaging was started within 10 to 15 min after reperfusion using an 86 mm diameter volume coil for transmission, a rat surface coil for reception and Paravision 6.0.1 software. An MR compatible monitoring system (SA Instruments, Stony Brook, NY, USA) was used to continuously control animal temperature via a rectal probe and respiration rate via a pressure sensitive pad under the thorax. A blanket connected to a heated circulating water system was used to keep the body temperature of the animal at 37.0 ± 0.5°C. Animals were positioned prone on a dedicated animal holder inside the MRI, with ear and tooth bar fixation to minimize movement. First, a localizer scan was acquired followed by B0 mapping and second order shimming (MAPSHIM). A simultaneous mapping of water shift and B1 (WASABI) sequence was used to check B0 and B1 homogeneity. 28 The protocol consisted of whole brain T2w MRI (2 D RARE, 38 contiguous coronal slices with thickness 0.75 mm, field of view FOV =33 × 33 mm2, image matrix MTX = 220 × 220, repetition time TR = 4000 ms, RARE factor 8, echo spacing 11 ms, effective echo time TE = 33 ms, bandwidth BW = 34.7 kHz, number of averages NA = 3, total acquisition time TA = 5:25 min), 2DG CESL MRI (single 2.25 mm thick slice with FOV and geometry matching three slices of the T2w through the rostral-caudal center of the striatum), MTX = 110 × 110, TR = 5.4 ms, TE = 2.4 ms, BW = 46.9 kHz, 13 spin lock times (TSL) between 5–200 ms, adiabatic tipping using optimized HSExp pulses 29 and a matching spin lock pulse amplitude of B1 = 5 µT, NA = 1, 35 repetitions with TA = 1:26 min each, slow injection of 1 g/kg bodyweight 2DG i.v. after scan #5 over 2 minutes, diffusion MRI (SE-EPI, geometry matching the T2w, MTX = 128 × 128, TR = 3000 ms, TE = 20 ms, diffusion duration/separation = 2.5 ms/8.4 ms, 3 diffusion directions each with b = 650 s/mm2 and b = 1300 s/mm2, one b = 0 image, TA = 5:36 min), and arterial spin labeling MRI of CBF (FAIR-EPI, FOV =33 × 33 mm2, MTX = 128 × 96, single 1.0 mm thick slice with geometry matching the CESL MRI, 16 inversion times between 35 ms–1600 ms, recovery time 10 s, TE = 16 ms, BW = 357.1 kHz, TA = 5:45 min). Perfusion MRI was performed using global shimming (not local MAPSHIM) to ensure sufficiently homogeneous B0 profile outside the FOV to enable efficient global inversion pulses. For phantom experiments, the same CESL scan was used but with slice thickness of 2 mm, FOV = 16 × 16 mm2, MTX = 128 × 128.
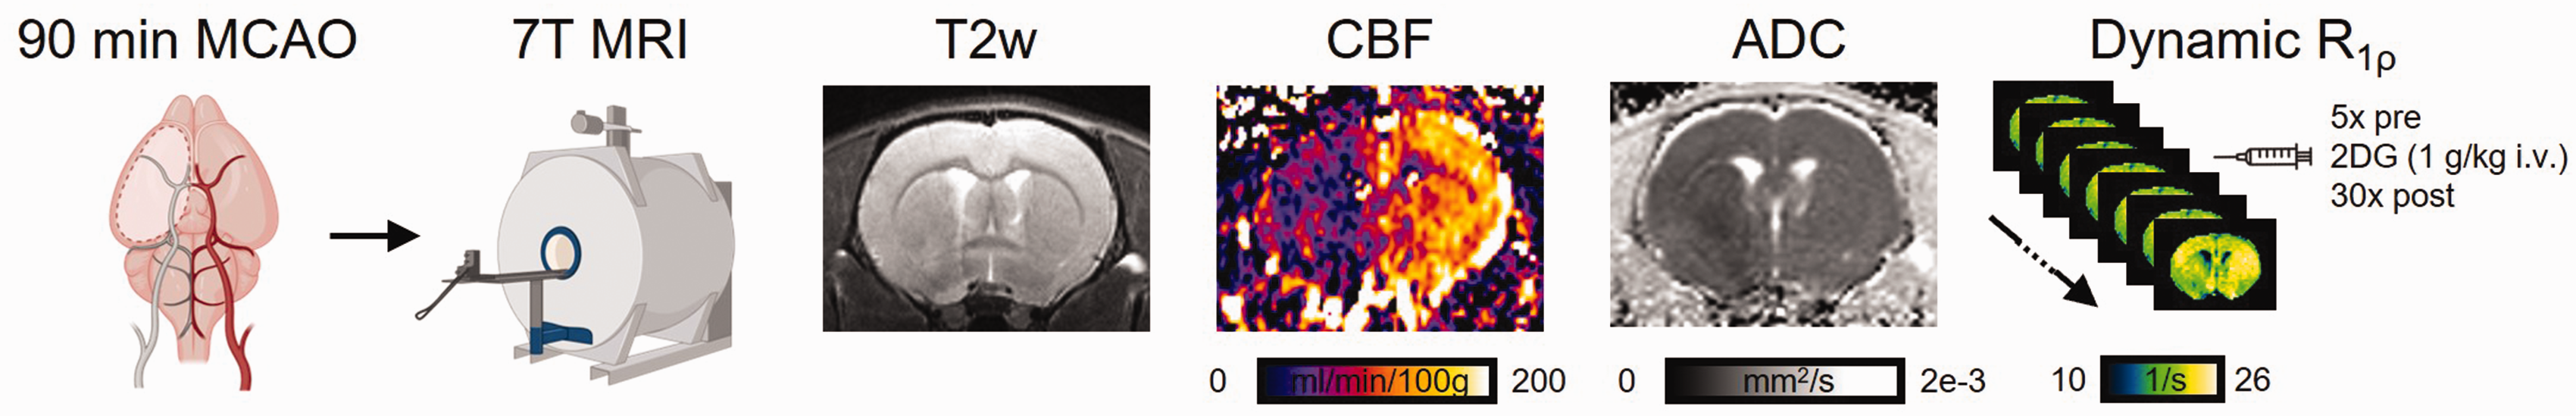
Study design. Rats underwent 90 min transient MCAO. After surgery, animals were directly transferred to a 7 T MRI system for T2-weighted (T2w) MRI, perfusion MRI of cerebral blood flow (CBF), diffusion MRI of apparent diffusion coefficient (ADC) followed by dynamic R1ρ mapping with CESL MRI before and after injection of 2DG.
MRI data analysis
First, CESL images were motion-corrected in ANTx2 (https://github.com/ChariteExpMri/antx2) 30 using rigid (6 degrees of freedom) image registration of the later (i = 2…35) to the first CESL image dataset. For each time point, the first spin lock time image (TSL = 5 ms) was used for registration, the transformation was then applied to the other 12 TSL images.
R1ρ(ti) maps at time ti were calculated voxel-wise via mono-exponential fitting of CESL image signal intensities S(ti) over spin lock time TSL using the CESL signal equation:

ΔR1ρ(ti) is a measure of local 2DG concentration and was calculated as the percent change with respect to the mean R1ρ during the first five baseline CESL scans:
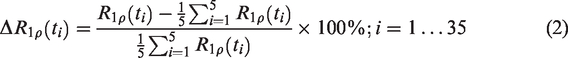
Region-of-interest (ROI) analysis was performed in two ways (Figure 2) In the first approach, brain regions were automatically segmented on the different MRI contrasts (T2, ADC, CBF, CESL) using a series of 3 D to 3 D and 3 D to 2 D image registrations using the SIGMA rat brain template. The registration was then applied to the SIGMA atlas, 31 which matches the template. For registration, we used the b = 0 image for diffusion MR images, the first inversion time image for perfusion MR images and the first TSL image for CESL images. The transformation was then applied to the atlas to yield segmentations of the brain regions co-registered to ADC and CBF maps. For perfusion MRI, images were distorted due to shimming artefacts of the EPI sequence and a nonlinear registration was used. For ADC and CESL images, affine (12 degrees of freedom) registrations were sufficient.
ROI analyses. CESL images were quantified in anatomical regions defined in the SIGMA rat brain atlas (a) or using manual delineation (b) of the lesion on ADC, CBF and late ΔR1ρ maps (mean of the last 5 maps). Penumbra was defined via perfusion/diffusion mismatch.
For the second approach, the hypointense lesion was segmented on ADC, CBF and ΔR1ρ maps (mean image of the last 5 images) by an experienced researcher using an initial automated histogram-based segmentation followed by manual corrections in ANALYZE software (v5.0, AnalyzeDirect, Overland Park, KS, USA). Using the image registration transforms of the first approach, the lesion masks were transformed from ADC and CBF to the atlas and then registered to the ΔR1ρ maps. In atlas space, ROIs mirrored at the midline were automatically generated and transformed to the ΔR1ρ maps. Lesion core was defined via hypointense ADC, hypoperfused tissue via hypointense CBF and the hypometabolic lesion was defined via hypointense areas on the mean ΔR1ρ maps (mean of the last 5 measurements). The penumbra was defined via perfusion diffusion mismatch, i.e.

Statistics
Statistical analyses were performed in MATLAB (version 2021a, Natick, MA, USA). Values are expressed as mean ± 95% confidence interval (CI) for time courses and the correlation analyses. For the bar plots, mean ± standard deviation is shown. Effect sizes of ipsi- vs. contralateral mean values are reported as Cohen’s d. Statistical analysis of ipsi- vs. contralateral values in the bar plots was performed using paired t-tests. Correlations of ΔR1ρ with 2DG concentration and ΔR1ρ with ADC and CBF were performed using Pearson correlation analyses. Lesion masks from the different modalities were compared using mask area and using Dice similarity coefficient with the hypometabolic lesion mask (derived from ΔR1ρ maps) with all other masks. A test with p < 0.05 was considered statistically significant. Bonferroni correction of the significance level for multiple comparisons was used where indicated in the results.
Results
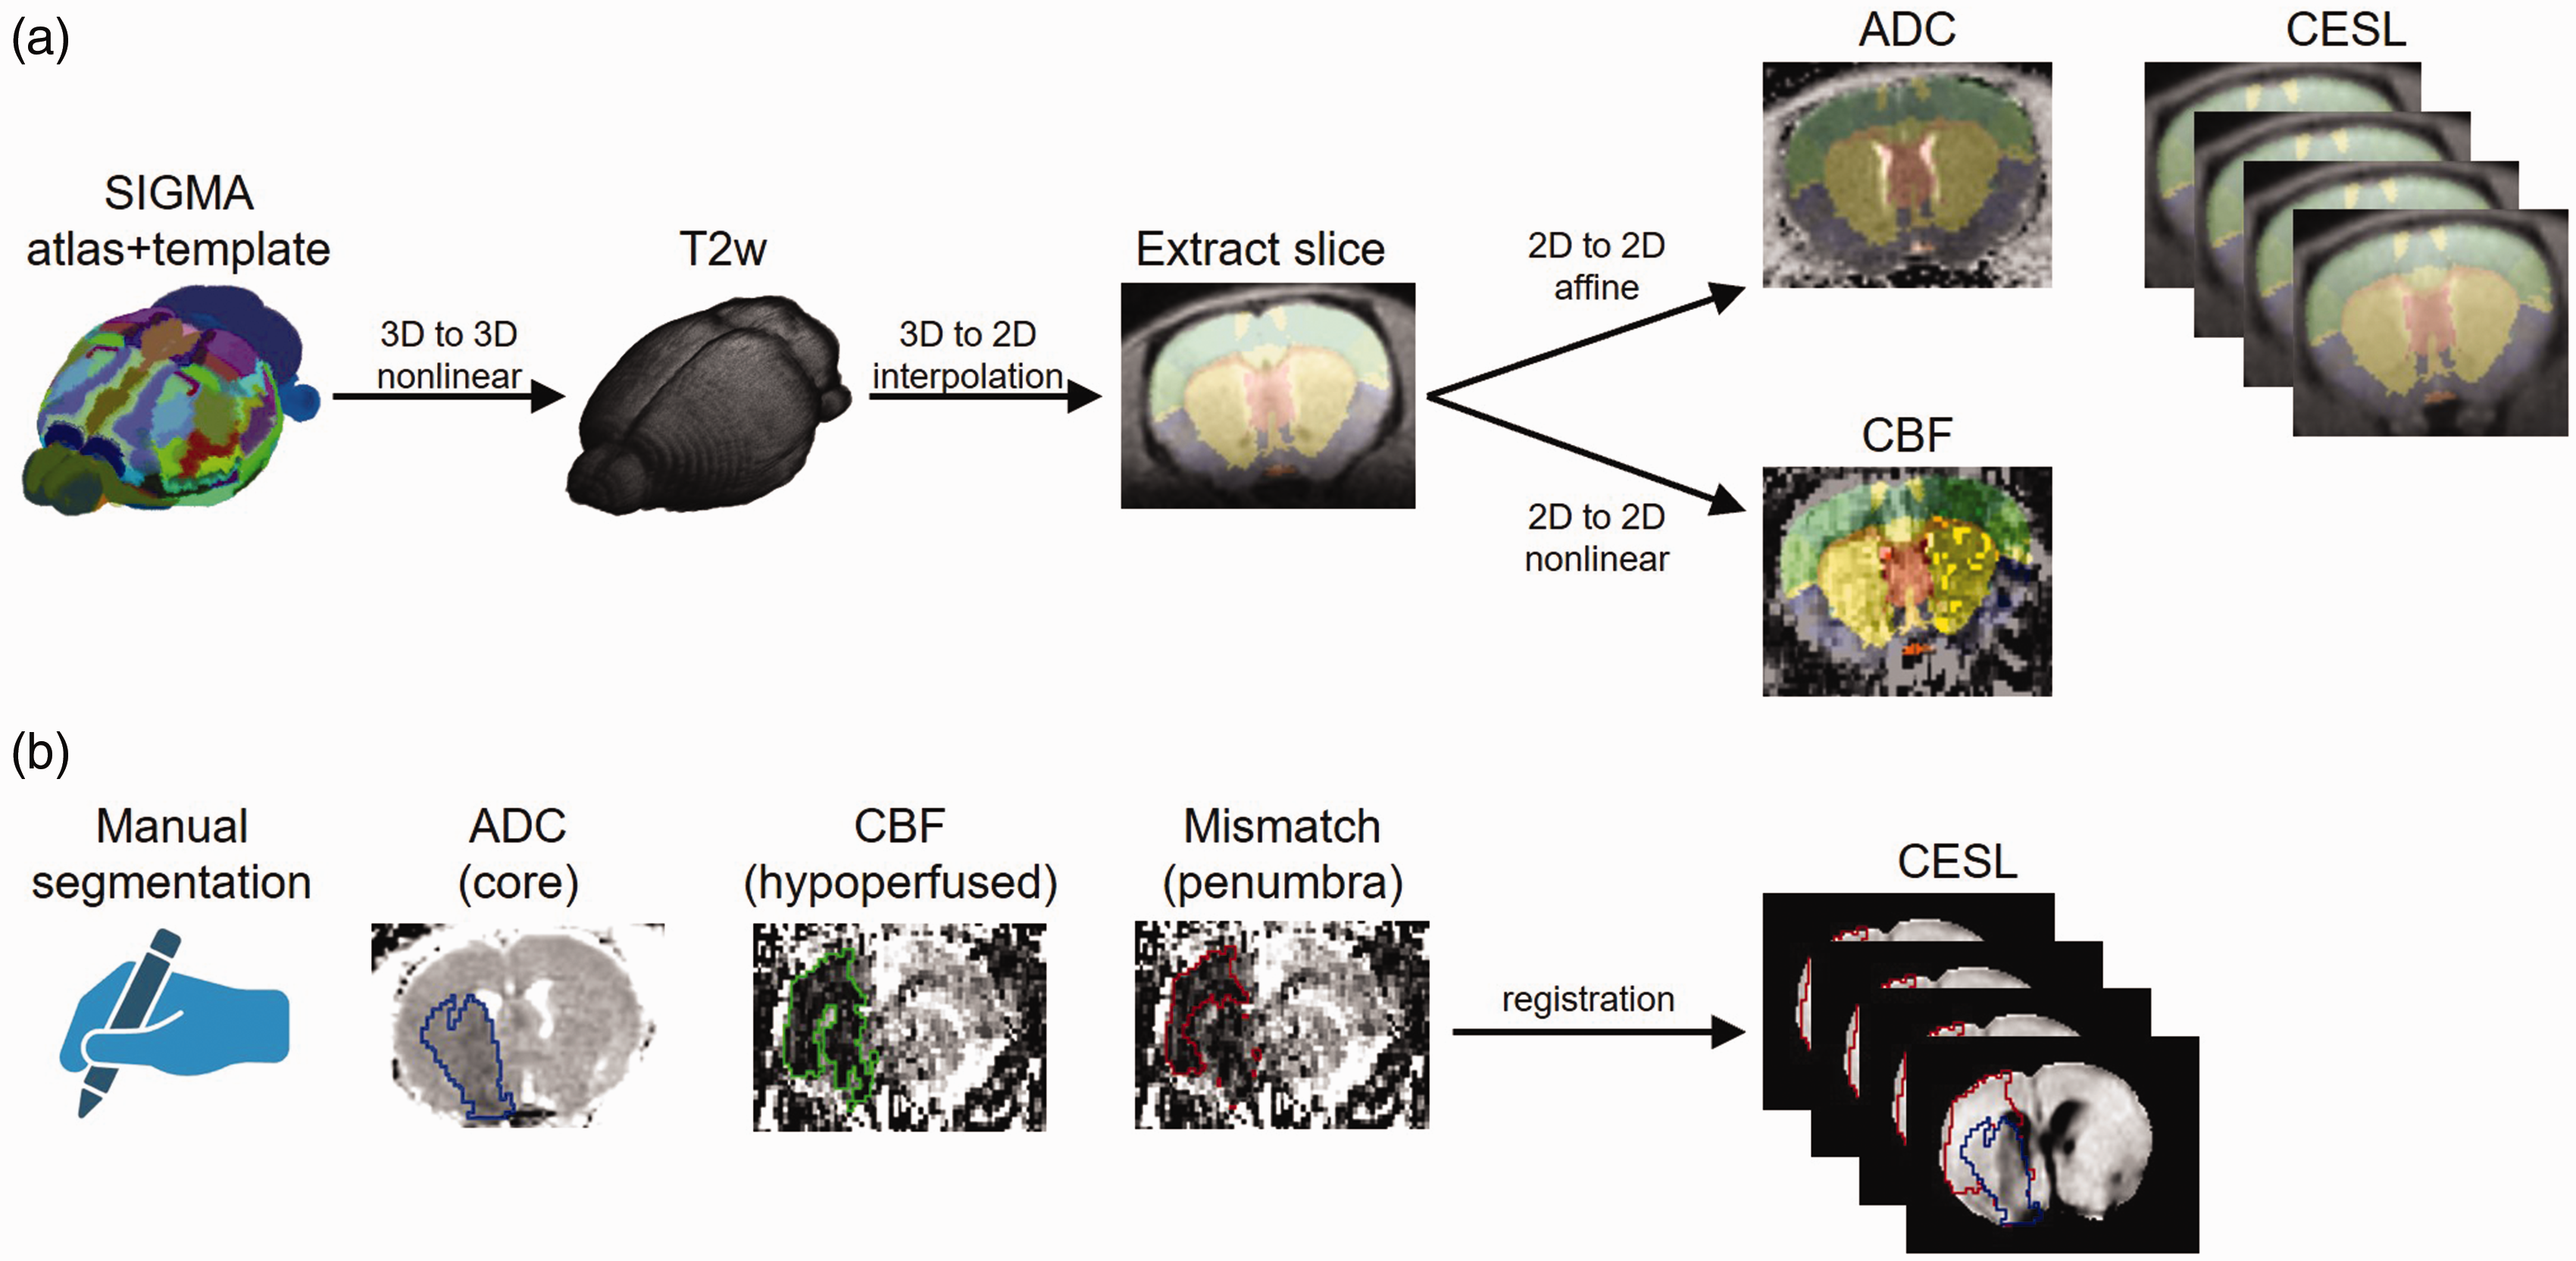
CESL MRI of phantoms containing different concentrations c2DG of 2DG in buffer revealed the expected linear relationship with concentration (Figure 3):

Phantom experiments. R1ρ map of NMR tubes with different concentrations of 2DG (a) and linear fit of mean R1ρ within each tube over 2DG concentration (b).
In the rat MCAO model, we found a continuous increase of R1ρ over ∼45 min CESL imaging time in metabolically active contralateral tissue whereas R1ρ remained stable or even decreased in ipsilateral tissue (Figure 4(a) and (b)). When quantifying late ΔR1ρ (mean of last 5 scans, Figure 4(c)), the contrast was most pronounced in striatum (ipsi: −1.54 ± 2.62%, contra: 2.80 ± 1.45%, t = −5.27, p = 0.00026, significant after Bonferroni correction, Cohen’s d = 1.52) and lesion core (ipsi: −1.11 ± 2.70%, contra: 3.09 ± 1.10%, t = −5.08, p = 0.00036, significant after Bonferroni correction, Cohen’s d = 1.47) but smaller in hypoperfused tissue (ipsi: −1.04 ± 2.76%, contra: 2.33 ± 1.73%, t = −3.84, p = 0.0027, significant after Bonferroni correction, Cohen’s d = 1.11) and not significant in the penumbra (ipsi: 0.04 ± 3.19%, contra: 0.99 ± 2.55%, t = −1.16, p = 0.27, Cohen’s d = 0.33).
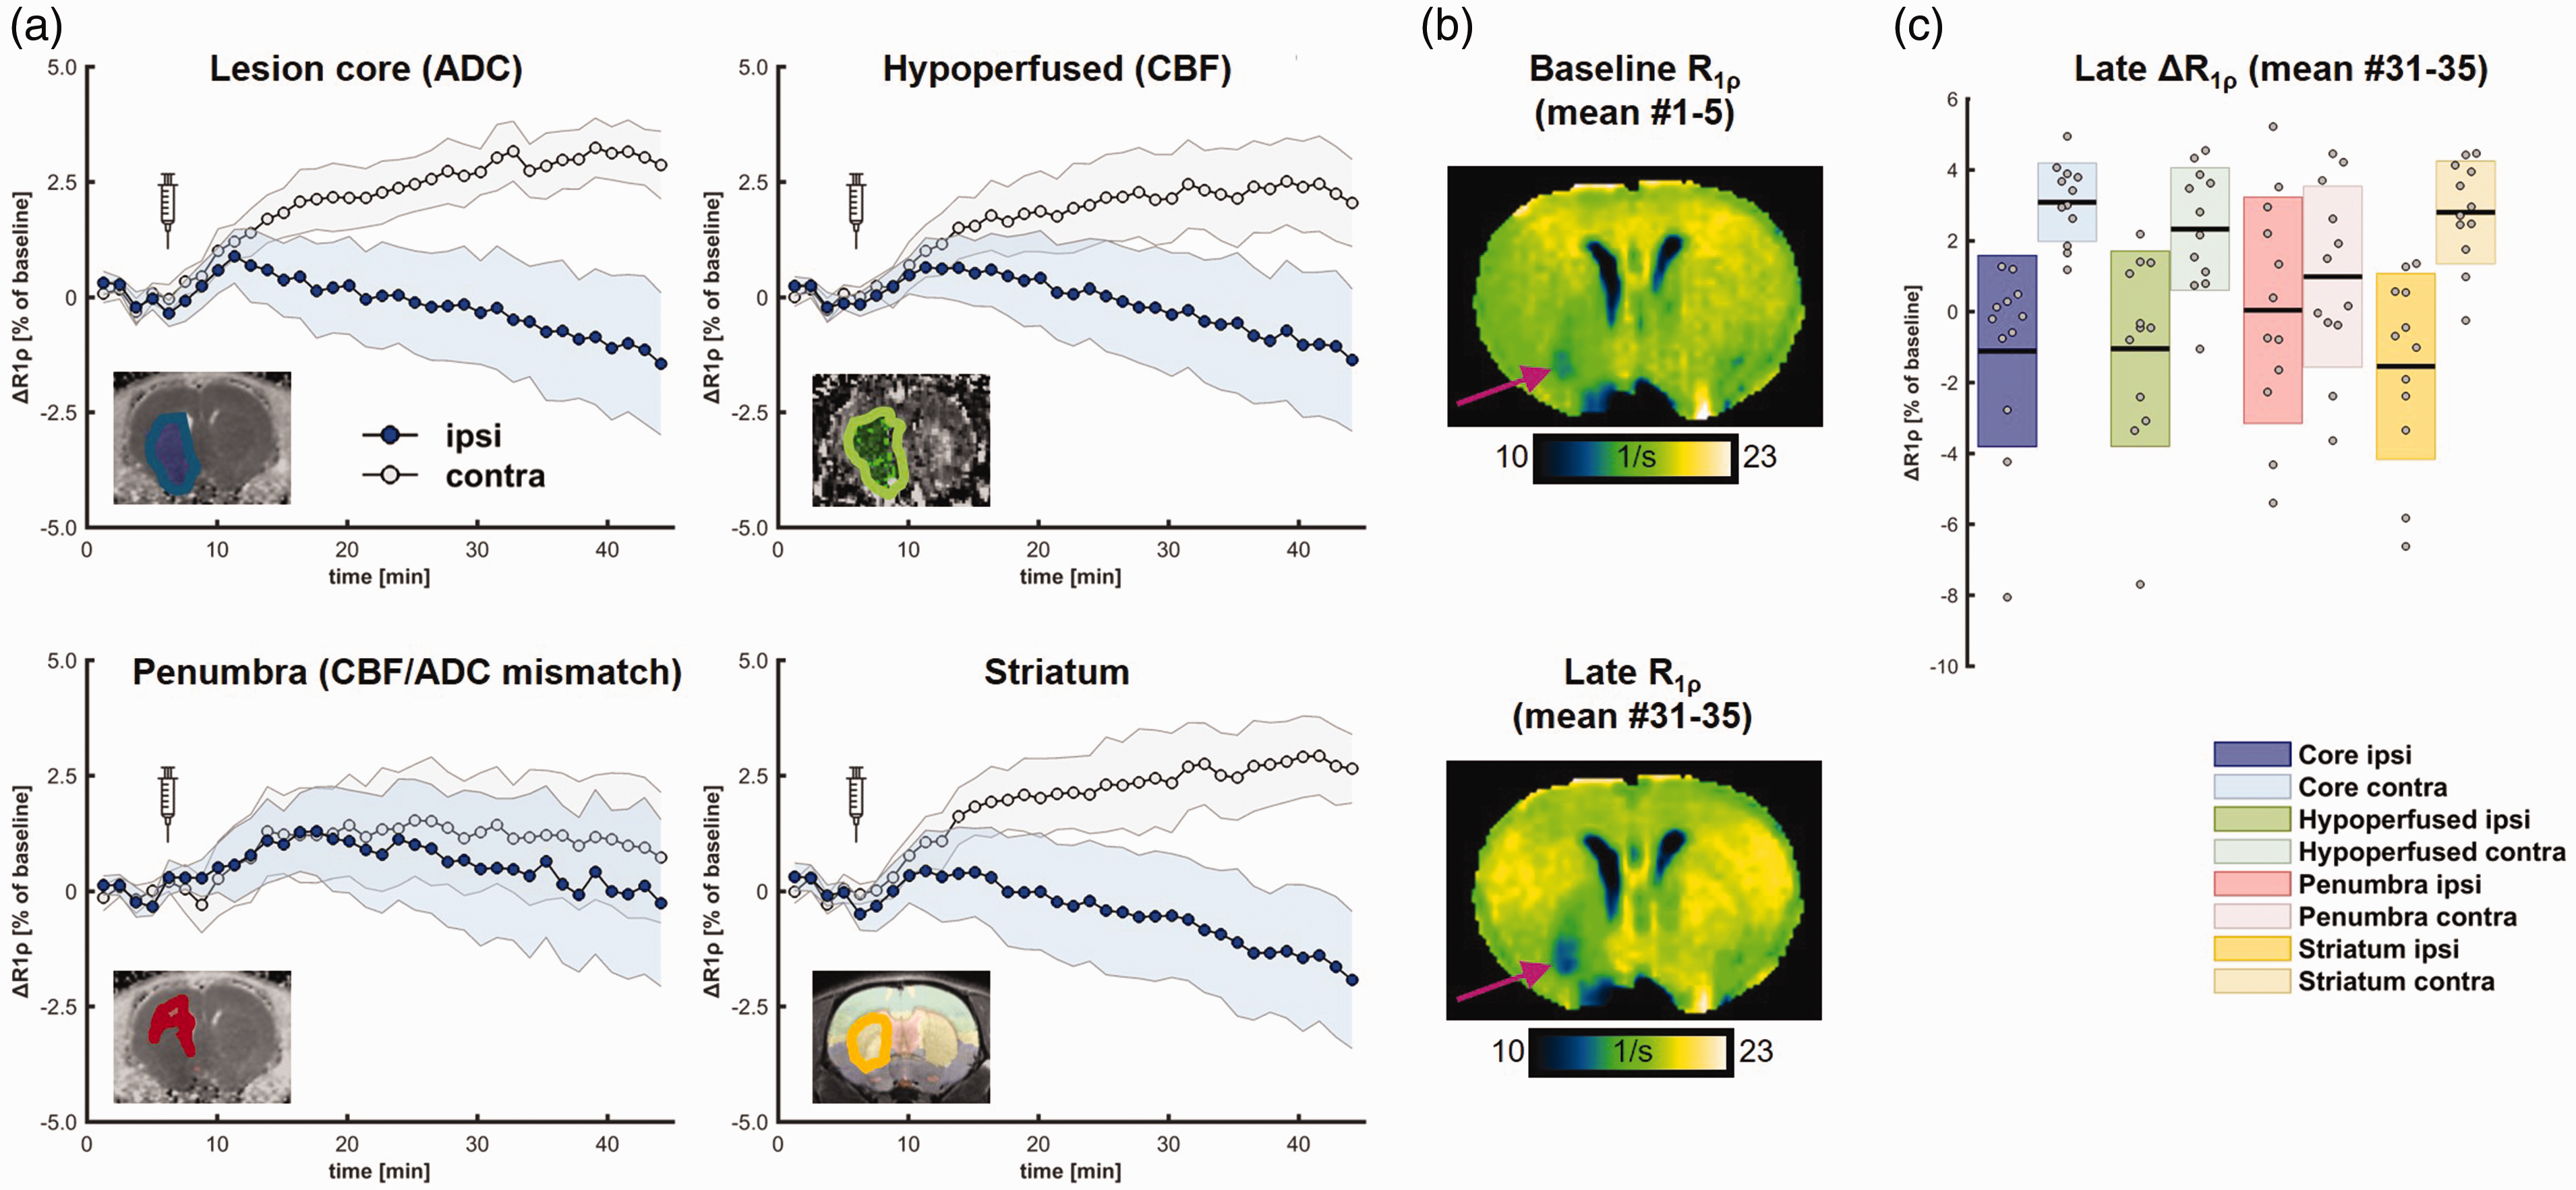
In vivo metabolic MRI. Quantification of mean R1ρ in lesion core, hypoperfused area, penumbra, ipsilateral striatum (blue) and in corresponding mirrored ROIs (gray) showed strong differences that continuously increased over time. Shaded area corresponds to 95% CI. Syringes indicate injection of 2DG at 8 minutes after start of CESL imaging. (a). Representative baseline and late (mean of first and last 5 maps) R1ρ maps show an increase in contralateral tissue and slight decrease in the lesion territory (b). Quantification of late R1ρ showed strongest effects of ipsi- vs. contralateral values in striatum and lesion core (c).
We then investigated how the new biomarker ΔR1ρ (mean of last 5 scans) correlates with conventional MR biomarkers of focal cerebral ischemia, i.e. ADC (Figure 5) and CBF (Figure 6). A significant correlation was found only for ADC in the ipsilateral striatum (Pearson R = 0.65, p = 0.023).
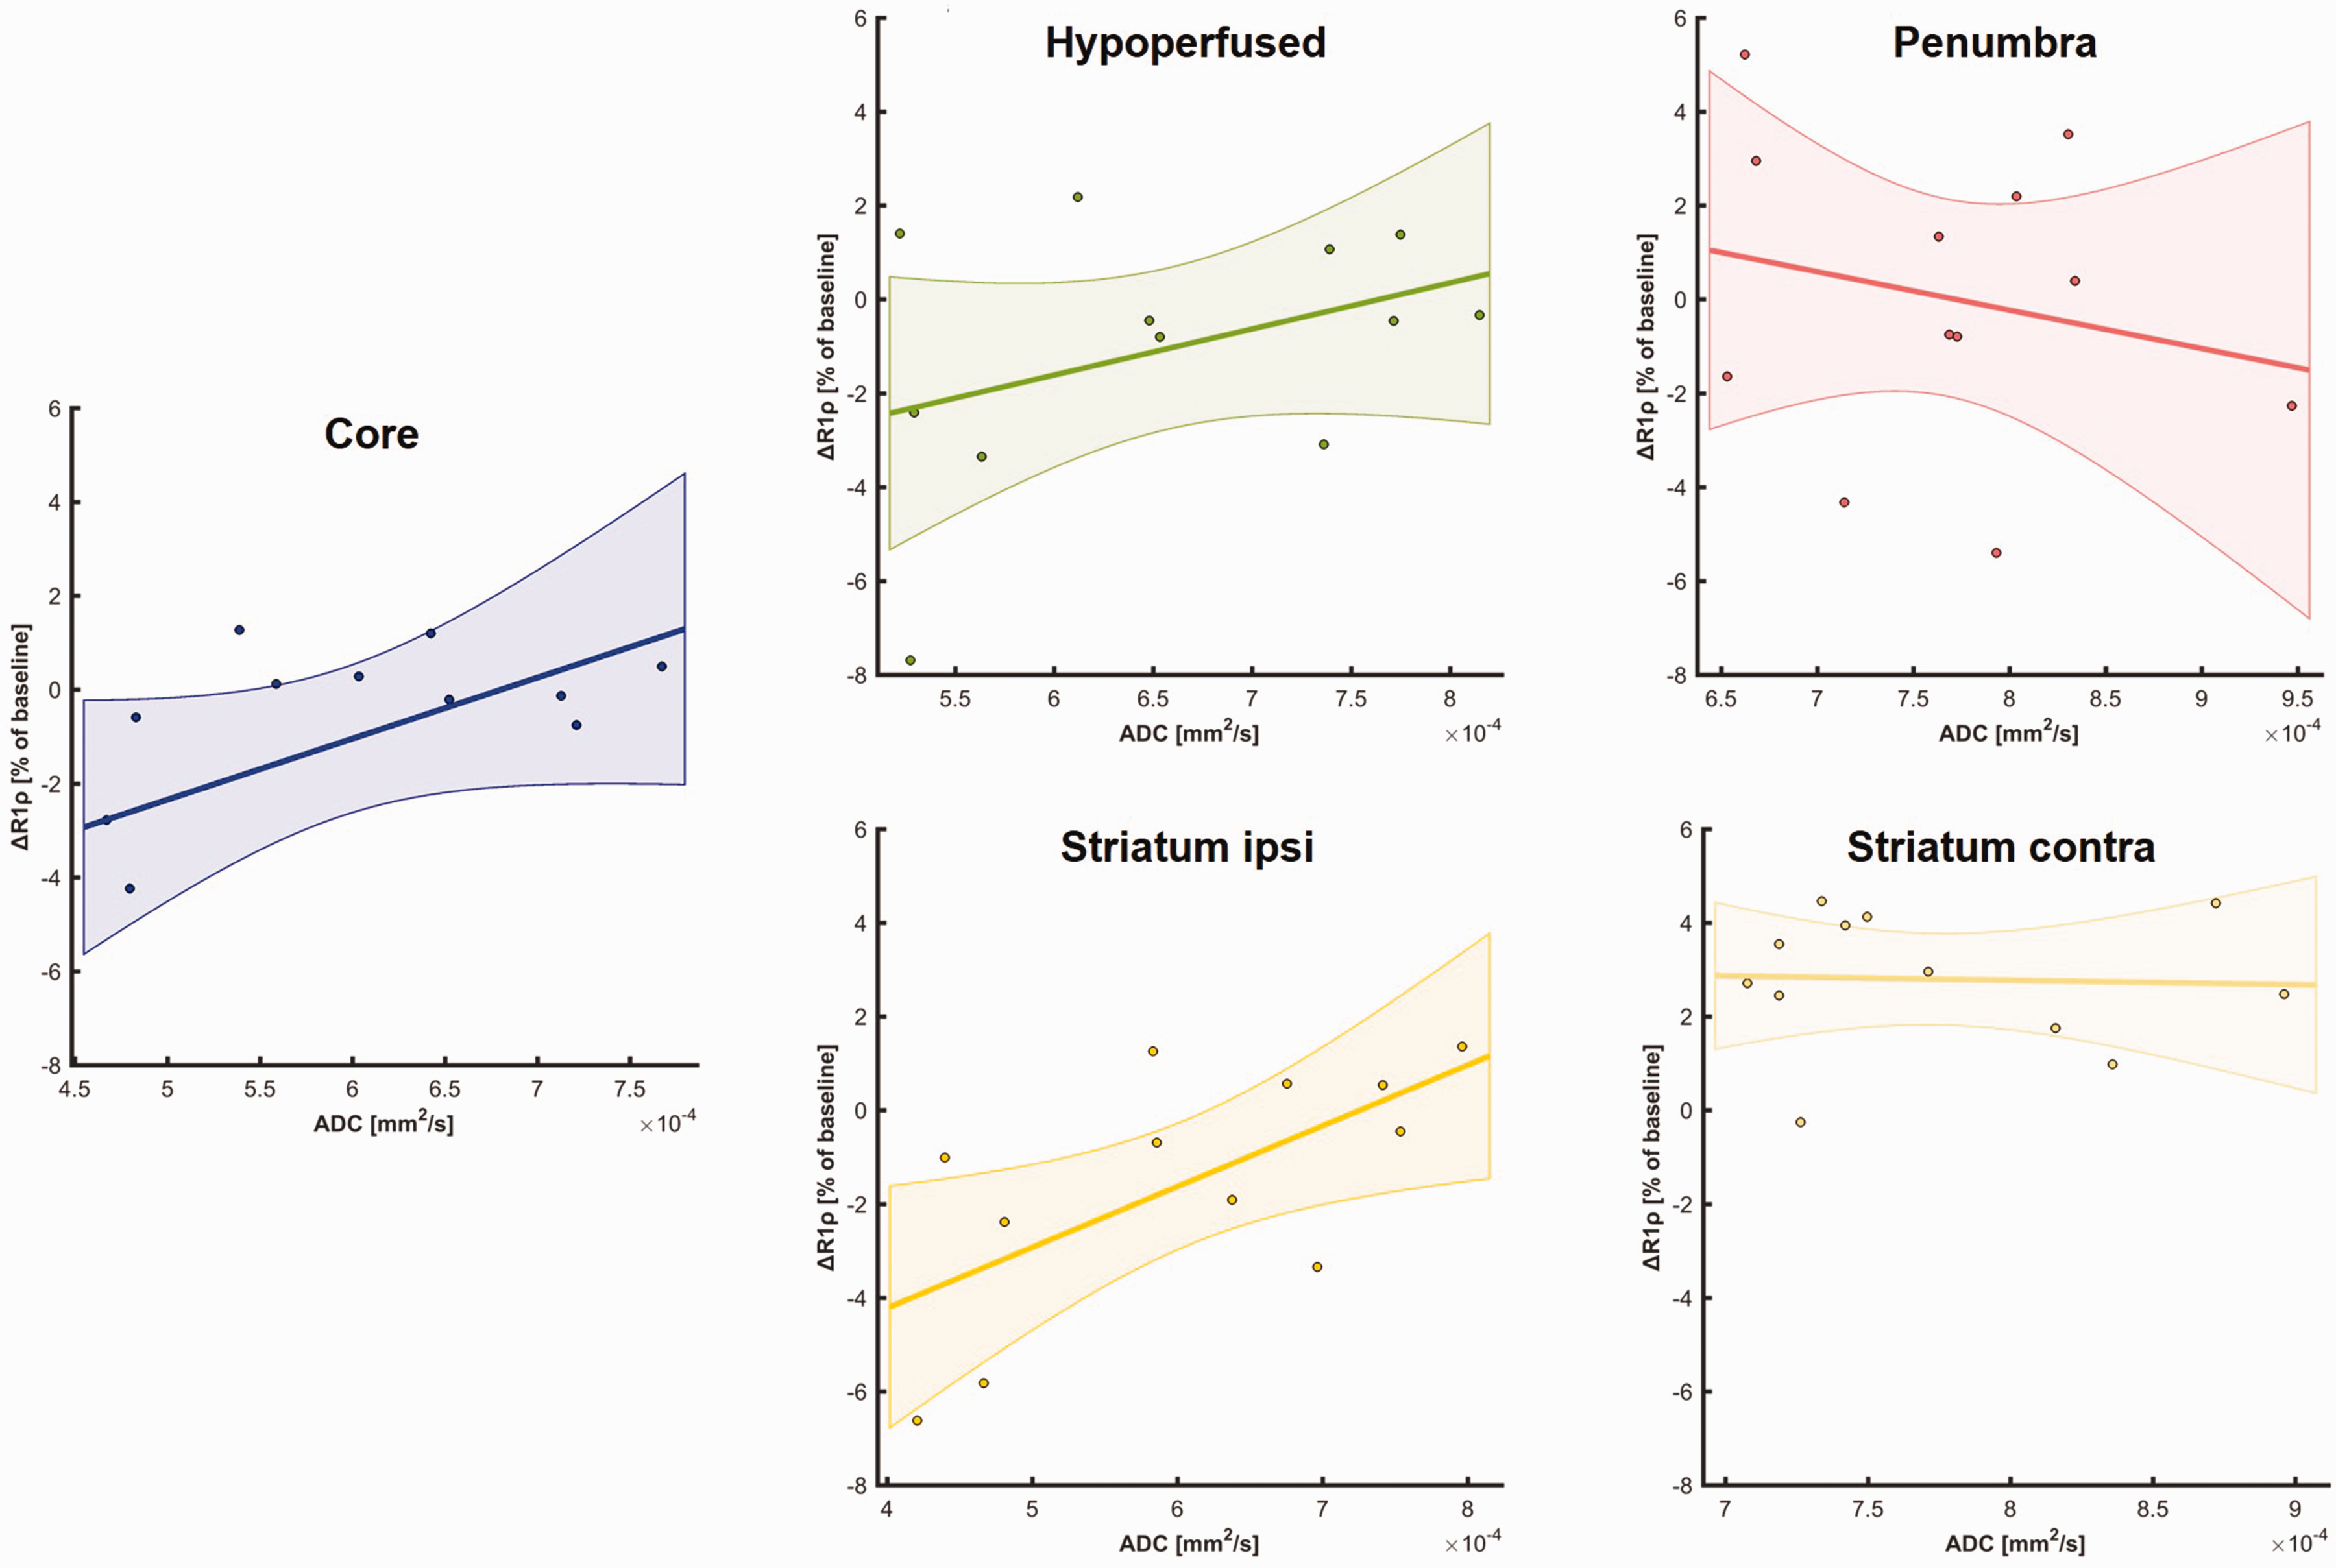
Correlation of mean late ΔR1ρ with mean ADC in ROIs.
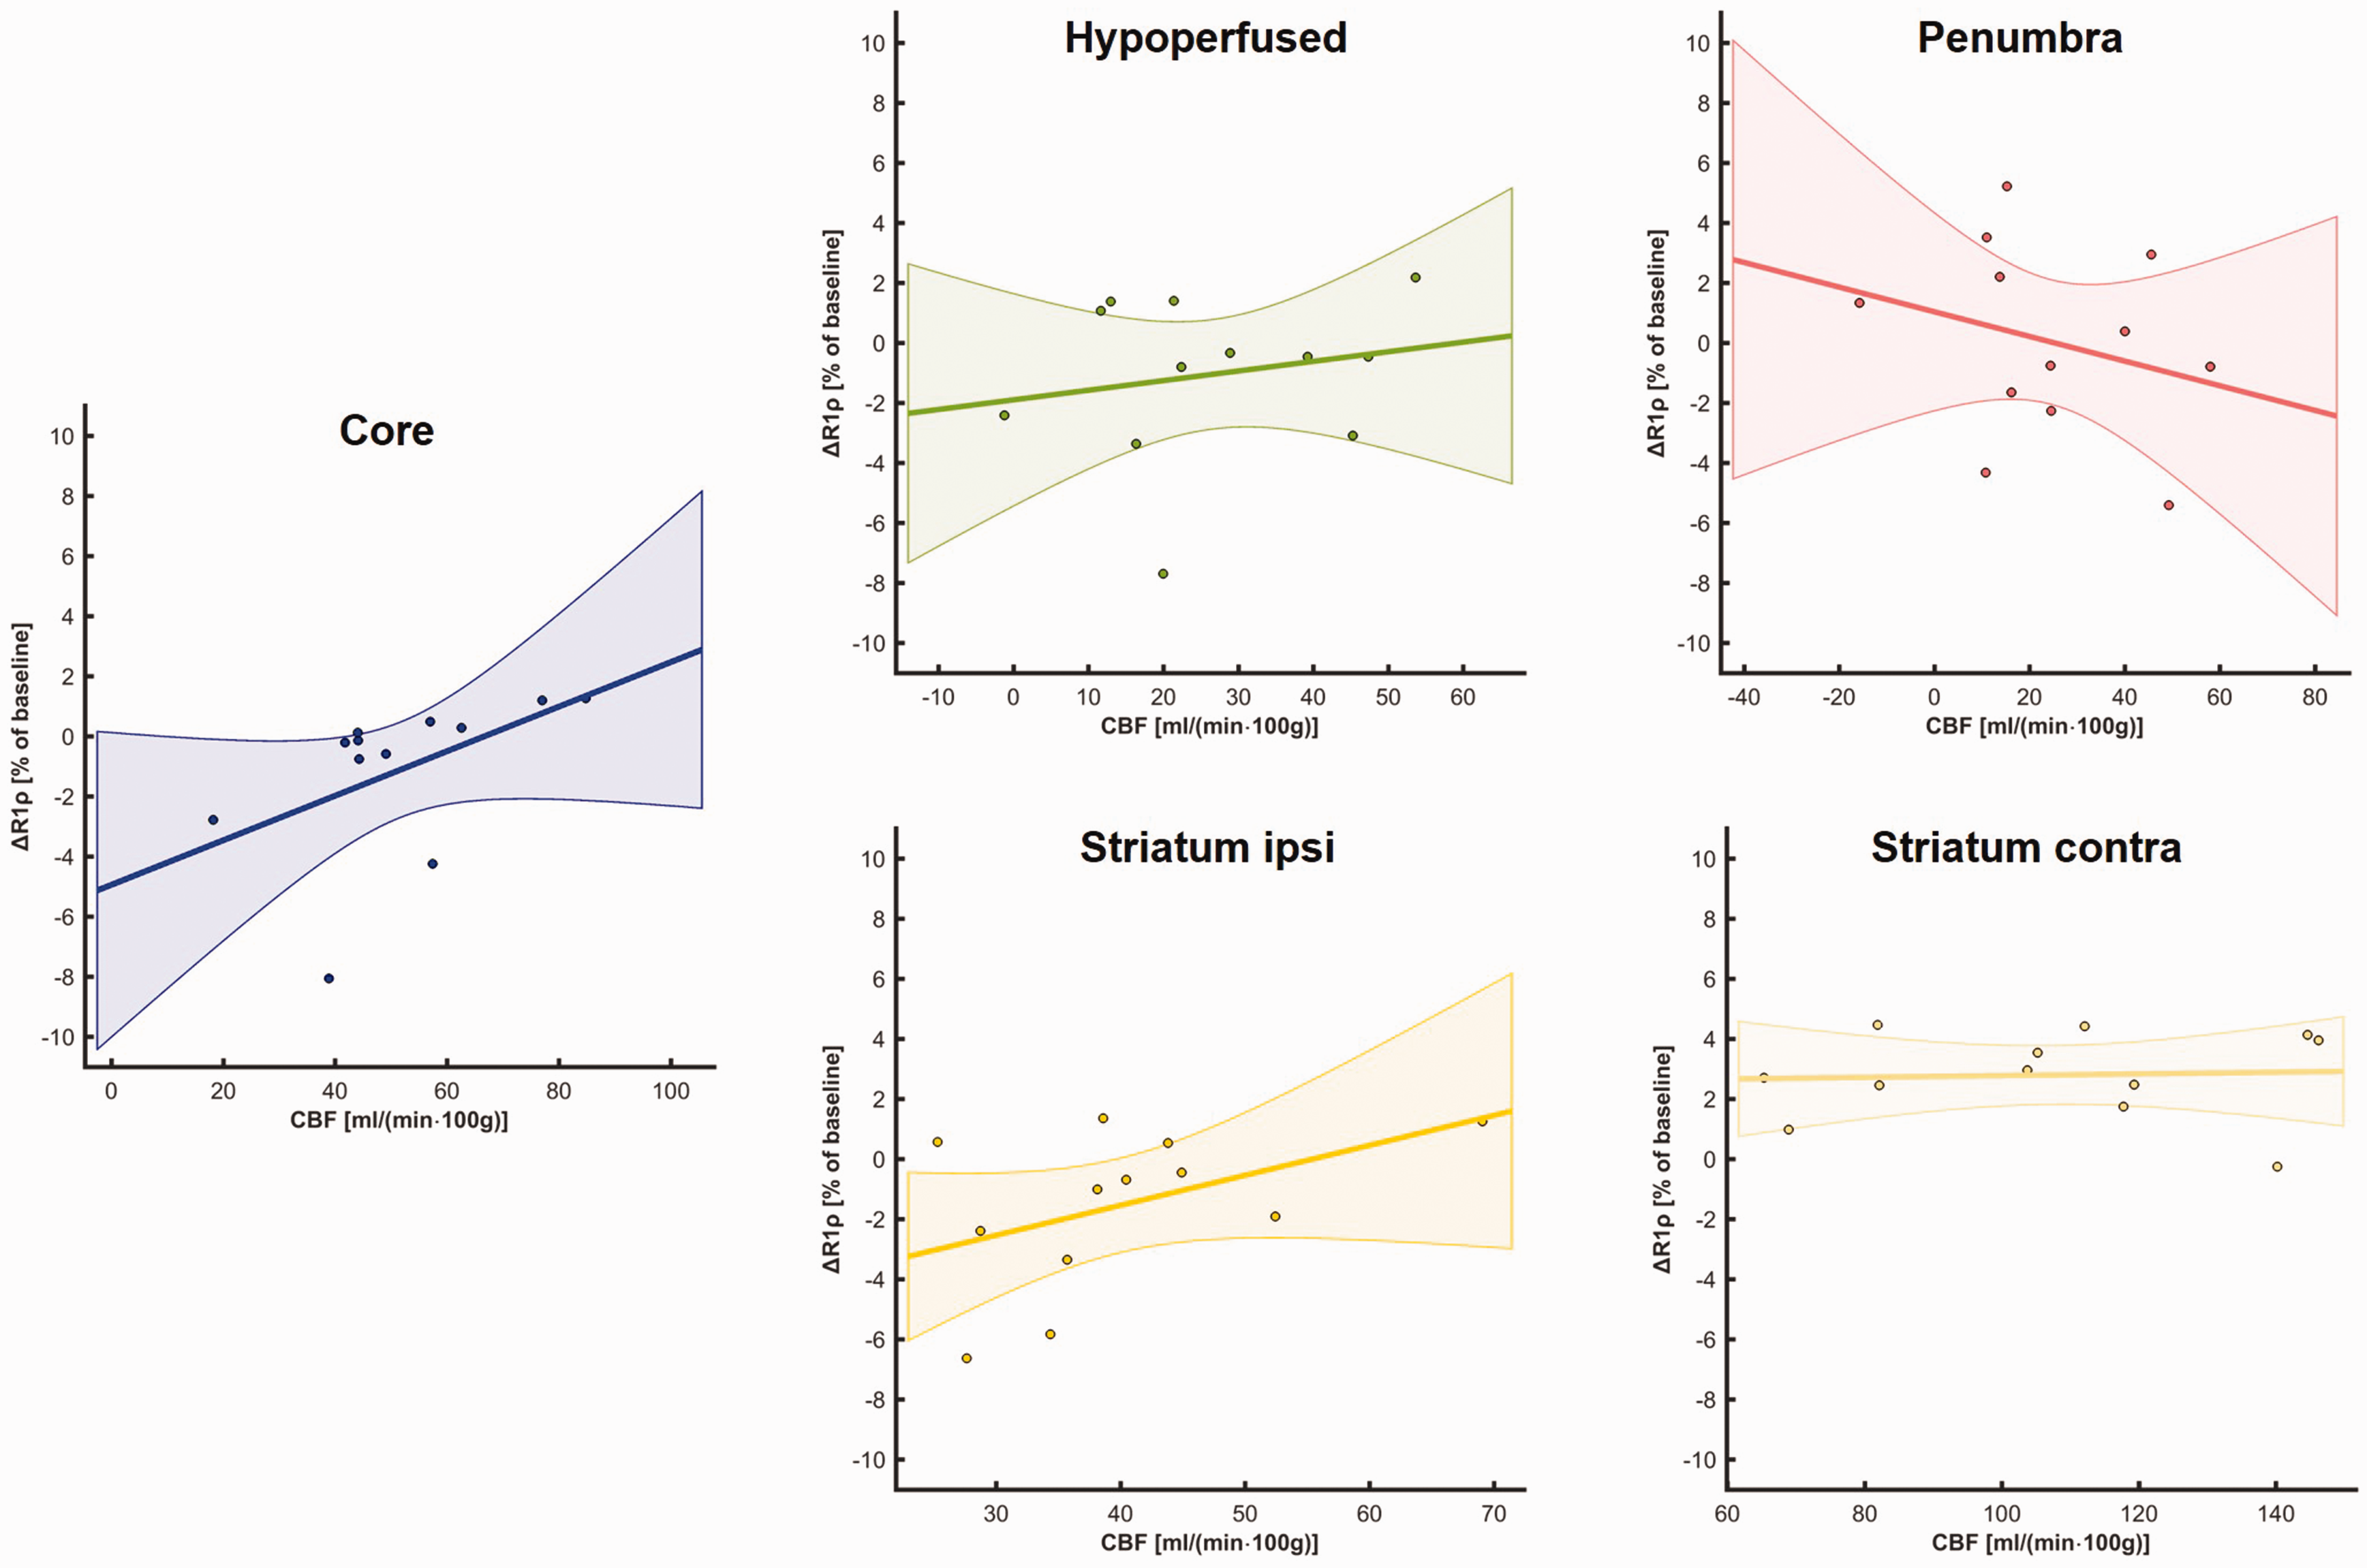
Correlation of mean late ΔR1ρ with CBF in ROIs.
Finally, in a radiologist’s approach, we wanted to investigate how the lesion mask derived from ΔR1ρ maps, i.e. the hypometabolic lesion, correlates with the lesion defined via ADC and CBF maps. The hypometabolic lesion area (Figure 7(a)) was smaller than lesion core (AΔR1ρ = 14.63 ± 8.79 mm2 vs. AADC =21.95 ± 6.95 mm2, t = −4.94, p = 0.0004, significant after Bonferroni correction) and hypoperfused area (AΔR1ρ vs. ACBF = 26.48 ± 5.76 mm2, t = −4.64, p = 0.0007, significant after Bonferroni correction) and comparable to penumbra (AΔR1ρ vs. Apenumbra= 10.86 ± 4.81 mm2 t = 1.10, p = 0.30). Dice coefficient D similarity analysis (Figure 7(b)) revealed most overlap with the lesion core (DΔR1ρ,ADC = 0.62 ± 0.17), defined via ADC followed by hypoperfused area (DΔR1ρ,CBF = 0.50 ± 0.16) and penumbra (DΔR1ρ,penumbra = 0.10 ± 0.10). The pairwise differences between the three Dice coefficients were all significant after Bonferroni correction (DΔR1ρ,ADC vs. DΔR1ρ,CBF, t = 5.34, p = 0.0002; DΔR1ρ,ADC vs. DΔR1ρ,penumbra, t = 8.79, p = 3*10−6; DΔR1ρ,CBF vs. DΔR1ρ,penumbra, t = 8.12, p = 6*10−6).
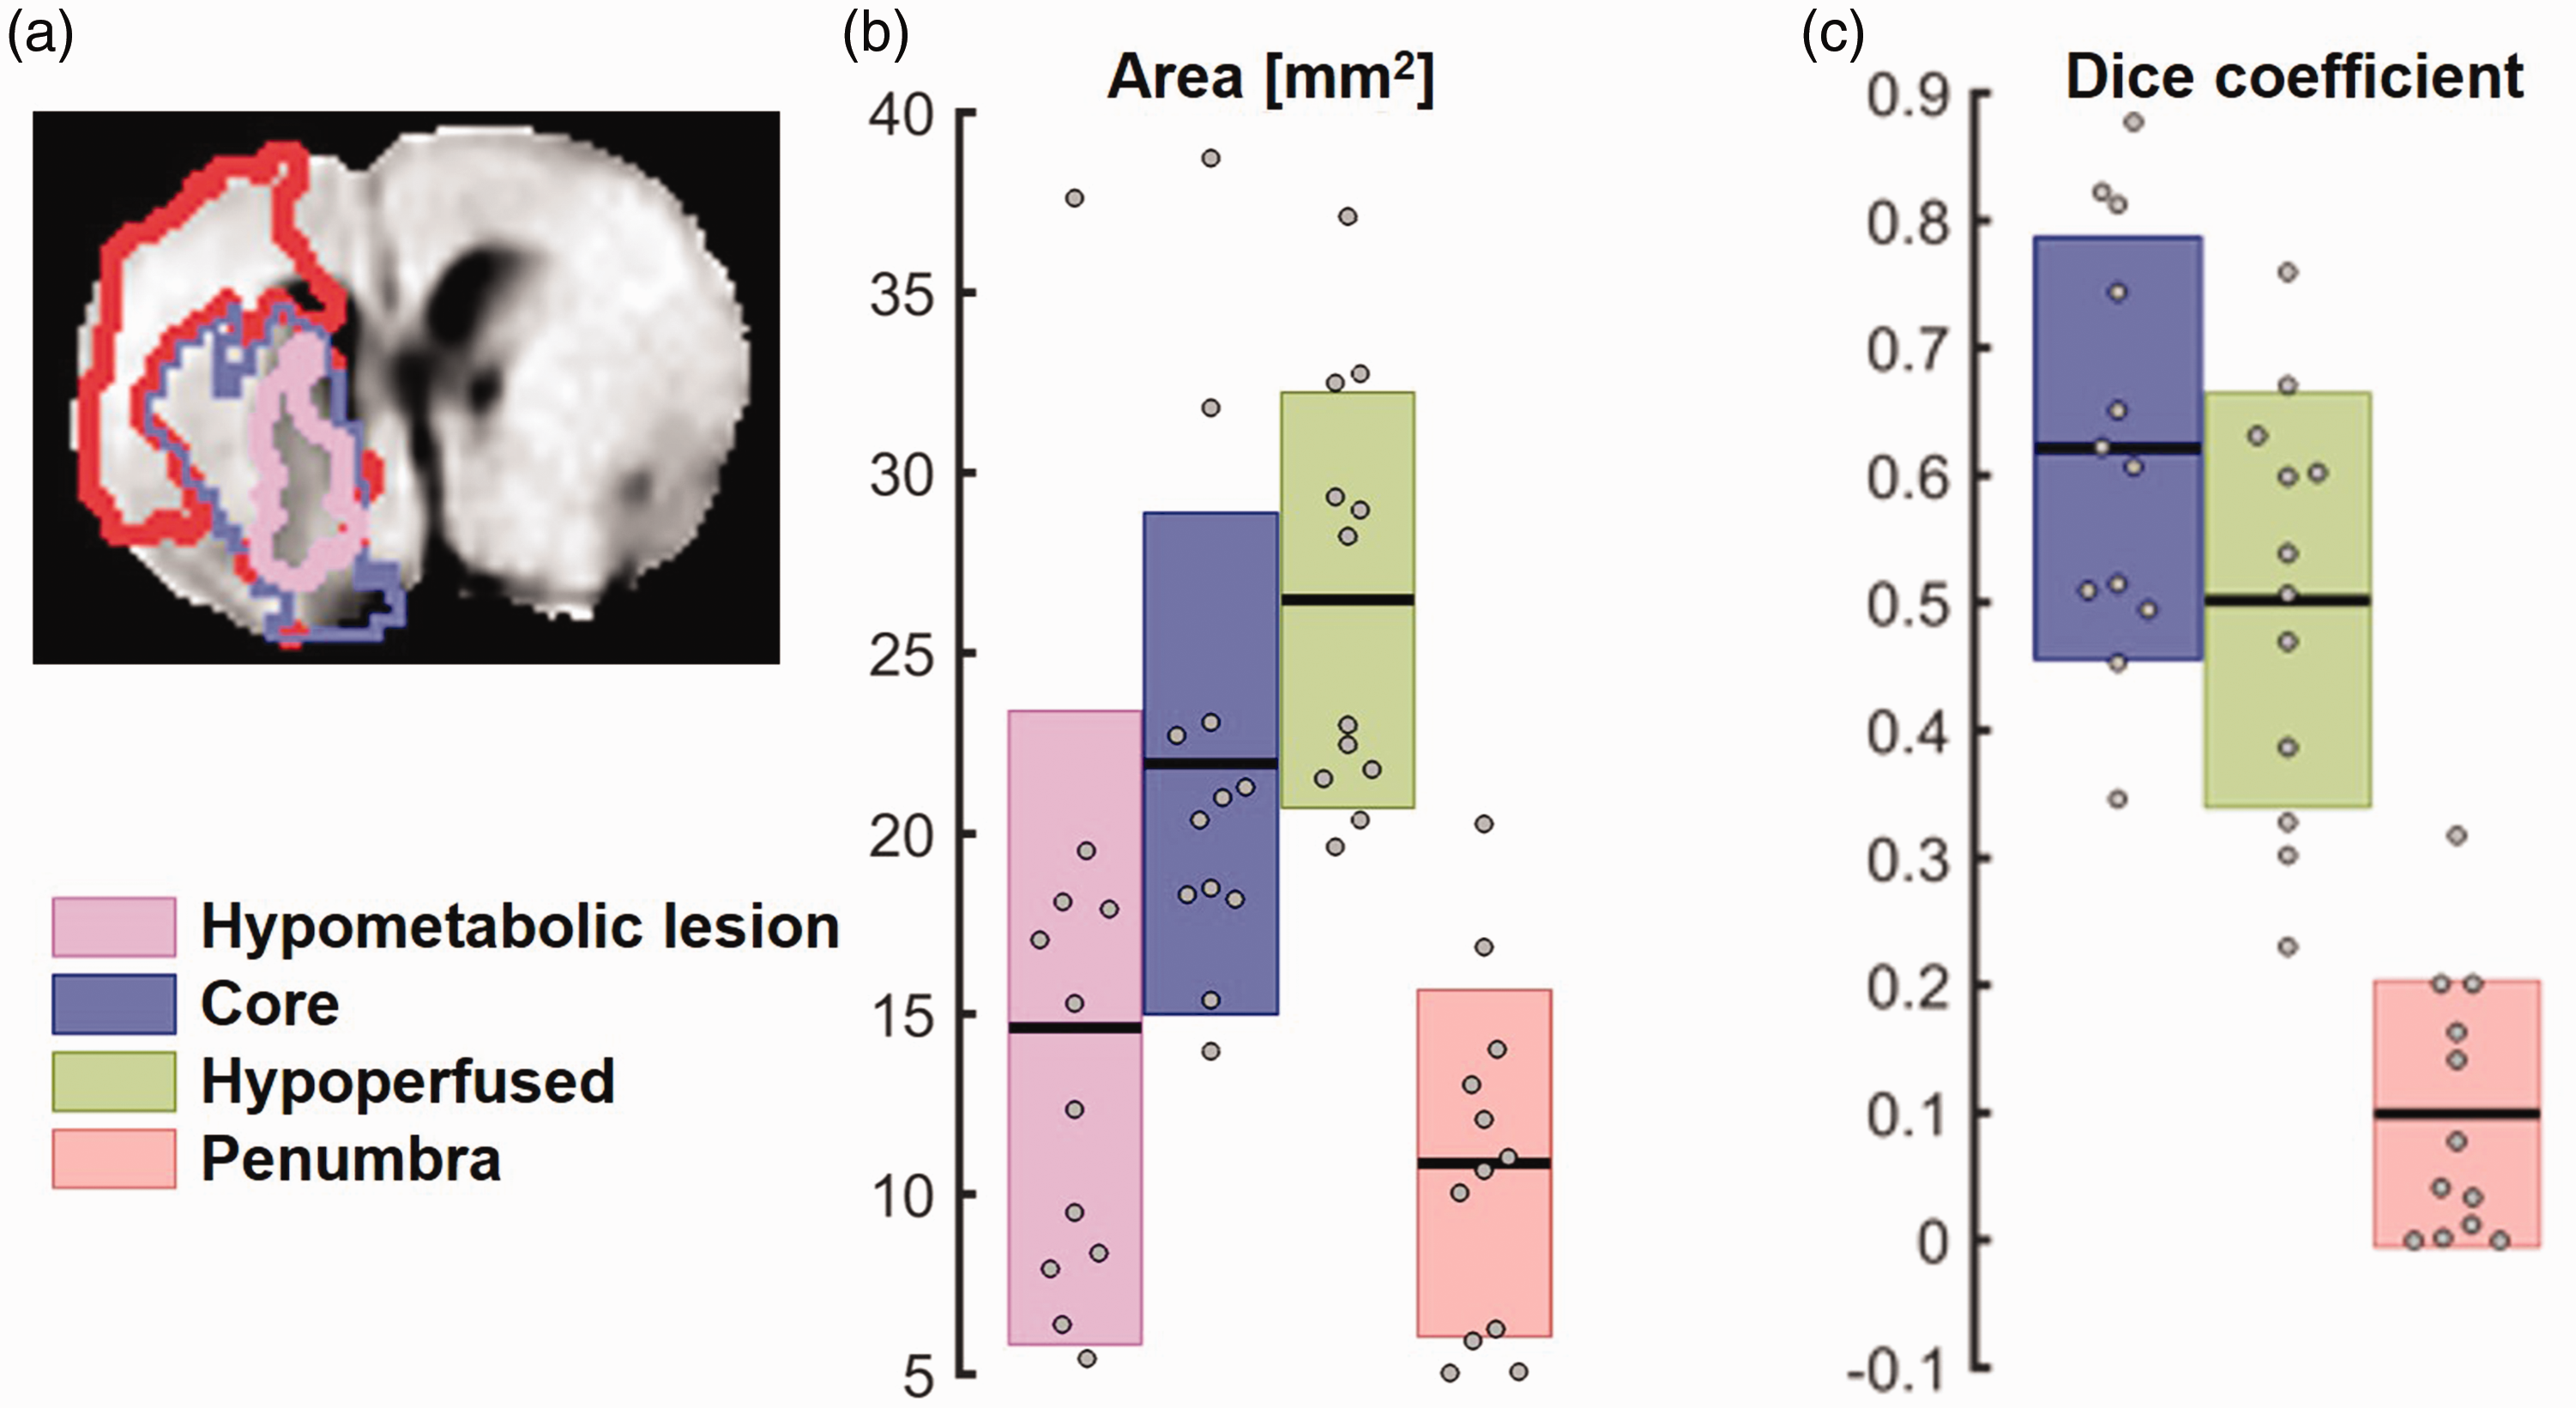
Characterization of metabolic lesion mask defined via hypointense late ΔR1ρ. Delineated masks overlaid on ΔR1ρ map from representative animal (a). The hypometabolic lesion (magenta) is smaller than lesion core (blue) or hypoperfused area (green, b) and overlaps best with lesion core compared to hypoperfused area or penumbra (red) as assessed by Dice coefficient analysis (c).
Discussion
In this study, we established 2DG CESL MRI as a new biomarker for cerebral glucose transport and metabolism in a rat model of ischemic stroke. We found that 2DG CESL MRI accurately delineated the ischemic core and allowed measuring cellular uptake of the glucose analogue in the penumbra. While 2DG CESL MRI provides conceptual information similar to 18F-FDG-PET imaging, the latter has not found wide adaptation due to the limited clinical availability of PET scanners for routine imaging. In our hands, 2DG CESL MRI allowed metabolic imaging with high effect sizes and SNR and superior spatial resolution compared to typical resolutions achieved with PET or deuterium metabolic MRI. 32
Based on an average R1ρ of ∼20 s−1, the observed mean ΔR1ρ increase of ∼2.5% in normal tissue (Figure 4(a)) corresponds to an absolute change of ∼0.5 s−1, consistent with previously reported values following i.v. 2DG injection.21,22 In principle, such ΔR1ρ values can be translated into 2DG concentration changes using relaxivities. However, relaxivity values are highly sensitive to factors like temperature, pH, and the presence of exchange catalysts, which limits the direct applicability of our in vitro results obtained at room temperature in high PBS concentrations to in vivo conditions. Using a literature relaxivity of 0.050 L·mmol−1·s−1, determined under more physiologically relevant conditions, the observed ΔR1ρ would correspond to a 2DG concentration change of approximately 10 mmol/L, which appears physiologically plausible. This estimated 10 mmol/L concentration is also consistent with pharmacokinetic modelling of natural D-glucose uptake in healthy brain tissue using glucoCESL MRI. 33 The model based on saturable transport reported a Michaelis-Menten constant (Kt) of (8.8 ± 2.2) mM, which is proximate to this concentration. 33
The size of the ischemic core in metabolic MRI in the present study was substantially smaller than resolved with conventional blood flow and diffusion imaging biomarkers of stroke, as expected from metabolic PET imaging. 17 While our study was not designed to address that, this raises the question whether the hypometabolic lesion represents the real ischemic core. Indeed, previous work has discussed and measured the proportion by which the surrogate identification of the penumbra using flow-based MRI sequences overestimate the size of the ischemic core. 17 Since we measured CBF and ADC directly after reperfusion, these markers can also develop dynamically 34 and such changes were not accessible with the current design of the study. Since our study focused on acute timepoints, our results are limited in that we do not measure final infarct sizes. Furthermore, in this study, we did not verify successful occlusion or reperfusion of the tissue by direct measurements of blood flow. However, in general, the MCAO model reliably achieves stroke and reperfusion when performed by experienced surgeons. 35 Persisting large hypoperfused regions might be attributed to no reflow phenomena or to the permanent occlusion of the CCA and ECA. 36 Nonetheless, our study provides a path for establishing metabolic MRI as a precise tool for classifying ischemic tissue. Further improvements could result from automated lesion segmentation 37 as opposed to the semi-manual approaches employed in the present study. A previous study investigating the utility in early MRI in predicting final infarct sizes in murine stroke demonstrated that the accuracy of ADC to predict the final infarct size depends on the time of imaging. 38 It is thus conceivable that the timing of imaging in our study can explain these differences and that the hypometabolic infarct core measured early after reperfusion is not representative of the final infarct size.
The observed decrease in R1ρ within the lesion core aligns with other findings 39 and previous studies in rodent stroke models.40–42 This reduction is predominantly attributable to the well-established R2-decreasing effect (i.e., T2 prolongation) characteristic of vasogenic edema. However, given that CESL MRI contrast is indirectly derived from the water signal, other contributing factors warrant consideration. These include alterations in glucose/2DG transport dynamics, tissue pH, temperature fluctuations, osmolality changes, and differences in blood-brain barrier permeability between ischemic and normal tissues, all of which could potentially modulate the observed contrast. 39 Furthermore, while the adiabatic CESL sequence employed in our study offers considerable robustness against static (B0) and radiofrequency (B1) field inhomogeneities,24,29 their residual influence cannot be entirely dismissed.
As acute treatments like endovascular thrombectomy broaden therapeutic options for stroke, advanced imaging modalities play a crucial role in identifying patients who may benefit most from interventional therapy. The mismatch between perfusion and diffusion deficits is often considered a robust indicator of salvageable brain tissue,11,43 and mismatch imaging has become a crucial tool for stratifying patients and selecting therapies.43,44 However, the clinical value and accuracy of the perfusion/diffusion mismatch in defining the penumbra is still under debate,11,17 which calls for further research into alternative and more precise methods. To this end, integrating metabolic imaging, and precisely quantifying both the hypometabolic stroke core and metabolic penumbra at the time of emergency care, could further refine these treatment decisions. By providing essential data on tissue viability, metabolic imaging can improve our understanding of salvageable brain regions and inform on the potential reversibility of clinical deficits.
It should be noted that due to the high concentration of 2DG required for CESL MRI compared to FDG PET, it is presently not suitable as a translational tool. However, a previous study has used regular D-glucose for cerebral CESL imaging with reasonable signal-to-background, 22 albeit different temporal kinetics, indicating that alternative carbohydrate tracers could provide a viable pathway for future clinical translation with further optimization. It was shown that after injection of D-glucose or glucose analogues, R1ρ increased linearly with local concentration of the metabolite.21,22,45 The authors concluded that 2DG CESL MRI can measure glucose transport and metabolism noninvasively in normal and pathological brain tissue. However, 2DG is metabolized to 2-deoxy-glucose-6-phosphate (2DG6P), which is trapped in cells and not further metabolized. 2DG CESL MRI is limited in that regard in the same way as 18F-FDG-PET. Prior studies indicate that measuring 2DG utilization is reflective of hexokinase activity. 46 However, given the nature of the CESL signal, we cannot distinguish between singal originating from 2DG and 2DG6P. To this end, the metabolically inert non-toxic glucose analogue 3-O-methly-D-glucose (3OMG) has been shown to provide suitable CESL signal to study glucose uptake in the brain. 39 Both 3OMG and 2DG exhibit comparable in vivo transport and distribution characteristics, primarily accumulating in extravascular compartments. However, at equivalent doses, 2DG produces higher R1ρ changes in vivo, likely due to the additional contribution from intracellular accumulation of 2DG6P. 39 This slight sensitivity disadvantage of 3OMG can be compensated by higher dosing, enabled by its more favorable safety profile and lower impact on systemic physiology and brain function compared to 2DG.21,47 Overall, both analogues have distinct advantages and limitations, but they are expected to yield comparable results which is consistent with the similarity of the dynamic R1ρ curves observed in both studies. However, both 2DG and 3OMG are thought to be competitive inhibitors of glucose transport into the brain. 48 Consequently, the high 2DG concentration used in our study lead to a temporary depression of respiration. Even though 3OMG can have similar effects on brain function as 2DG, 48 when it was used for CESL measurements, respiratory depression was not reported. 39 Given the relatively high concentration of 2DG used in our study, biochemical inhibition of hexokinase by 2DG6P has to be considered, which could also have adverse effects on cellular viability.1,49
Recently, dynamic nuclear polarization (hyperpolarization) 50 has made it possible to map the metabolism of carbon-13-labeled metabolic substrates in preclinical models51,52 and in humans52–55 and achieves high spatial and temporal resolution as well as substantially improved signal-to-noise ratios, 52 circumventing the problem of competitive inhibition of glucose transport by its analogues. Another recent study used deuterium metabolic imaging in combination with 18FDG-PET to study cerebral glucose metabolism after MCAO in mice. 32 While this approach allows for the mapping of glucose metabolites, it is at the expense of spatial resolution. 32
In summary, our present study demonstrates that 2DG CESL MRI provides new imaging biomarkers in preclinical stroke models which allows for multiplexing with other MR imaging modalities.
Footnotes
Data and code availability
Funding
The author(s) disclosed receipt of the following financial support for the research, authorship, and/or publication of this article: This work was funded by the Einstein Foundation Berlin (EJF-2020-602 to PM, EVF-2021-619 and EVF-2021-619-2 to PM and AMB) and the Leducq Foundation for Cardiovascular and Neurovascular Research (Leducq Foundation Trans-Atlantic Network of Excellence on Circadian Effects in Stroke, 21CVD04, PM and AMB). Funding to SM, MF, SPK and PBS was provided by the German Federal Ministry of Education and Research (BMBF) under the ERA-NET NEURON scheme (01EW2305), and the German Research Foundation (DFG, project BO 4484/2-1, Project-ID 424778381-TRR 295 ReTune and EXC-2049-390688087 NeuroCure). Noninvasive imaging experiments were supported by Charité 3 R – Replace | Reduce | Refine. Funding to PS was provided by the Deutsche Forschungsgemeinschaft (DFG, Project-ID 372486779-SFB 1340 Matrix in Vision). DJB was supported by an EMBO short-term Fellowship and funding from the National Health and Medical Research Council Australia (APP1182153). PM is Einstein Junior Fellow and AMB is Einstein Visiting Fellow, both funded by the Einstein Foundation Berlin. PM acknowledges funding from the Einstein Foundation Berlin (EVF-BUA-2022-694), the Volkswagen Foundation (9A866), the Else Kröner-Fresenius Stiftung (2019-A34), and the Stiftung Charité (StC-VF-2024-59). Besides funding, the sponsoring organizations did not play any role in the preparation, review, or approval of the article, or decision to submit the article for publication.
Acknowledgements
We thank Dr. Kai Herz for providing the adiabatic HSExp tipping pulses and Dr. Steffen Görke and Dr. Philip Boyd for helpful discussions during the planning of the study.
Declaration of conflicting interests
The author(s) declared the following potential conflicts of interest with respect to the research, authorship, and/or publication of this article: AMB is cofounder of BRAINOMIX. DJB is an inventor, and The University of Newcastle is applicant for the patent: Stroke Treatment (WO 2022/072348). The other authors report no conflicts.
Authors’ contributions
Concept and design: Boehm-Sturm, Mergenthaler
Acquisition, analysis, or interpretation of data: Boehm-Sturm, Schuenke, Foddis, Mueller, Koch, Mergenthaler
Discussion of the data: Boehm-Sturm, Schuenke, Foddis, Müller, Koch, Beard, Holloway, Mottahedin, Schröder, Buchan, Mergenthaler
Drafting of the manuscript: Boehm-Sturm, Mergenthaler
Critical review of the manuscript for important intellectual content: Boehm-Sturm, Schuenke, Foddis, Mueller, Koch, Beard, Holloway, Mottahedin, Schröder, Buchan, Mergenthaler
Statistical analysis: Boehm-Sturm, Schuenke, Koch
Supervision: Boehm-Sturm, Mergenthaler