
Abstract
Notwithstanding recanalization treatments in the acute stage of stroke, many survivors suffer long-term impairments. Physical rehabilitation is the only widely available strategy for chronic-stage recovery, but its optimization is hindered by limited understanding of its effects on brain structure and function. Using micro-ultrasound, behavioral testing, and electrophysiology, we investigated the impact of skilled reaching rehabilitation on cerebral hemodynamics, motor function, and neuronal activity in a rat model of focal ischemic stroke. A 50 MHz micro-ultrasound transducer and intracortical electrophysiology were utilized to characterize neurovascular changes three weeks following focal ischemia elicited by endothelin-1 injection into the sensorimotor cortex. Sprague-Dawley rats were rehabilitated through tray reaching, and their fine skilled reaching was assessed via the Montoya staircase. Focal ischemia led to a sustained deficit in forelimb reaching; and increased tortuosity of the penetrating vessels in the perilesional cortex; with no lateralization of spontaneous neuronal activity. Rehabilitation improved skilled reaching; decreased cortical vascularity; was associated with elevated peri- vs. contralesional hypercapnia-induced flow homogenization and increased perilesional spontaneous cortical neuronal activity. Our study demonstrated neurovascular plasticity accompanying rehabilitation-elicited functional recovery in the subacute stage following stroke, and multiple micro-ultrasound-based markers of cerebrovascular structure and function modified in recovery from ischemia and upon rehabilitation.
Introduction
Despite the availability of intravenous thrombolysis and endovascular thrombectomy in the acute stage post stroke, ∼88% of stroke survivors experience disabling long-term upper extremity motor impairment. 1 Moreover, nearly 50% of patients who have a successful endovascular thrombectomy still experience long-term neurological deficits. 2 Physical rehabilitation, or the targeted use of the paretic limb in skilled movements in the chronic stage post stroke, decreases the mortality rate and affords an earlier return to independent living. 3 Optimizing physical rehabilitation, so as to further improve long-term outcome following ischemic stroke, requires deepening our understanding of ischemia- and rehabilitation-elicited effects on the neurophysiological state.
A range of brain vascular and neuronal changes have been reported in the subacute (1–3 weeks) to chronic (>3 weeks) stage following experimental ischemia. In the endothelin-1 rat model of stroke, we have observed increased vascular density peri-lesionally, with functional alterations in the form of vascular hyperreactivity to hypercapnic challenges during the subacute stage, indicating altered capacity to respond to stimuli. 4 Neurovascular coupling studies have revealed functional abnormalities perilesionally in the subacute stage of photothrombosis, with reduced sensory evoked dilation or decoupling of vascular responses from neuronal activity.5,6 Following acute hypoperfusion, stroke produces transient hyperperfusion of the peri-infarct cortex subacutely (within 7 days of insult), 4 followed by hypoperfusion within the microvascular bed that persists for weeks. 7 Neuronally, the first month post-stroke is a significant time for plasticity and remapping in the peri-infarct region, which shows spontaneous neuronal restructuring and functional remodeling that can be enhanced via activity-dependent mechanisms.8 –10 Neuronal plasticity is observed during subacute and into the chronic stage post injury, with increased dendritic spine formation and dendritic plasticity up to and including 6 weeks post injury. 11 Neuronal activity levels are altered over time: initial hypoactivity progresses to hyperactivity by three weeks following stroke.4,12 In the chronic stage, the peri-infarct zone becomes critically important to recovering motor function, and represents the anatomical substrate acted upon by physical rehabilitation. Cortical remapping in this period involves the upregulation of growth processes for repair and rewiring of the neuronal circuitry, 13 via increased expression of neuronal genes related to axonal sprouting, formation of new synapses, and cytoskeletal remodeling, 14 which are prevalent in the peri-infarct zone, but also occur in the interconnected brain regions. 15
Although much is known regarding the effects of ischemia on the brain vessels and neurons, our understanding of the effects of physical rehabilitation on the neurophysiology is quite limited. Rehabilitation in experimental models has shown to reorganize the motor map toward normal range 16 and re-establish normal structure and connectivity when combined with contralateral inhibition. 17 There may be a period where the brain is most receptive to rehabilitation, as is seen experimentally 18 and recently clinically. 19 In the present study, we explored the use of microultrasound imaging to elucidate the effects of experimental ischemia and physical rehabilitation on cerebrovascular morphology and function in the subacute stage of stroke. Micro-ultrasound is a low-cost, real-time imaging modality that uses high frequency (>15 MHz), 20 is well suited to studies in experimental models, and is rapidly gaining ground as a neuroimaging modality. 21 Increased operating frequency improves spatial resolution but potentiates attenuation in the tissue, limiting the maximum imaging depth. This results in more rapid imaging because of the shorter time-of-flight of the ultrasound pulse. Micro-ultrasound provides a unique view of the neocortex exhibiting the cortical vasculature, and allows measurement of blood velocity. We used 50 MHz micro-ultrasound to image the neocortical vasculature with <50 µm resolution to 10 mm cortical depth. Administration of an intravenous ultrasound contrast agent increased vascular contrast for visualization of the microvascular bed and estimation of red blood cell velocities, with microbubbles acting as a proxy for red blood cells.22,23
The micro-ultrasound based cerebrovascular assays were acquired approximately three weeks following ischemia induction by endothelin-1 injection into the cortex, with tray reaching or control treatment commencing three days following stroke. We measured changes in male Sprague-Dawley rats of spontaneous cortical activity and motor function via concomitant electrophysiological recordings and periodic Montoya staircase testing. A range of ischemia- and rehabilitation-induced changes in the cerebrovasculature were observed with micro-ultrasound, with accompanying improvements in forelimb skilled reaching and lateralization of neuronal power in the rehabilitated cohort. We substantiate observations and measurements acquired with micro-ultrasound supported by electrophysiology and behavioural data, to demonstrate the utility of micro-ultrasound in stroke recovery research and future mechanistic studies of the recovery processes.
Material and methods
Animals and experimental design
All experimental procedures were approved by the Animal Care Committee of the Sunnybrook Health Sciences Center which adheres to the Policies and Guidelines of the Canadian Council on Animal Care and meets all the requirements of the Provincial Statute of Ontario, Animals for Research Act as well as those of the Canadian Federal Health of Animals Act. The reporting on animal experiments conforms to ARRIVE guidelines. The experiments were performed on a total of 40 adult male Sprague-Dawley rats (Charles River, Montreal, Canada) weighing 360 ± 50 g (mean ± SD) at the end of study. Rats were kept in a reverse light cycle (12-hour light/dark) room, and the behavioral tasks and imaging were conducted during their dark (active) phase. Food was restricted to 12–15 g per day during the behavioral training and testing period. The body weight of each rat remained above 90% of their free-feeding weight. The present methodological optimization of the microultrasound imaging was restricted to healthy young male rates: deployment of microultrasound to animal models incorporating comorbidities, and in particular, to menopausal female rats will be fundamental to microultrasound-based studies of ischemic sequelae. The study timeline is illustrated in Figure 1(a), with each experimental procedure including stroke induction described in detail in the Supplementary Materials.
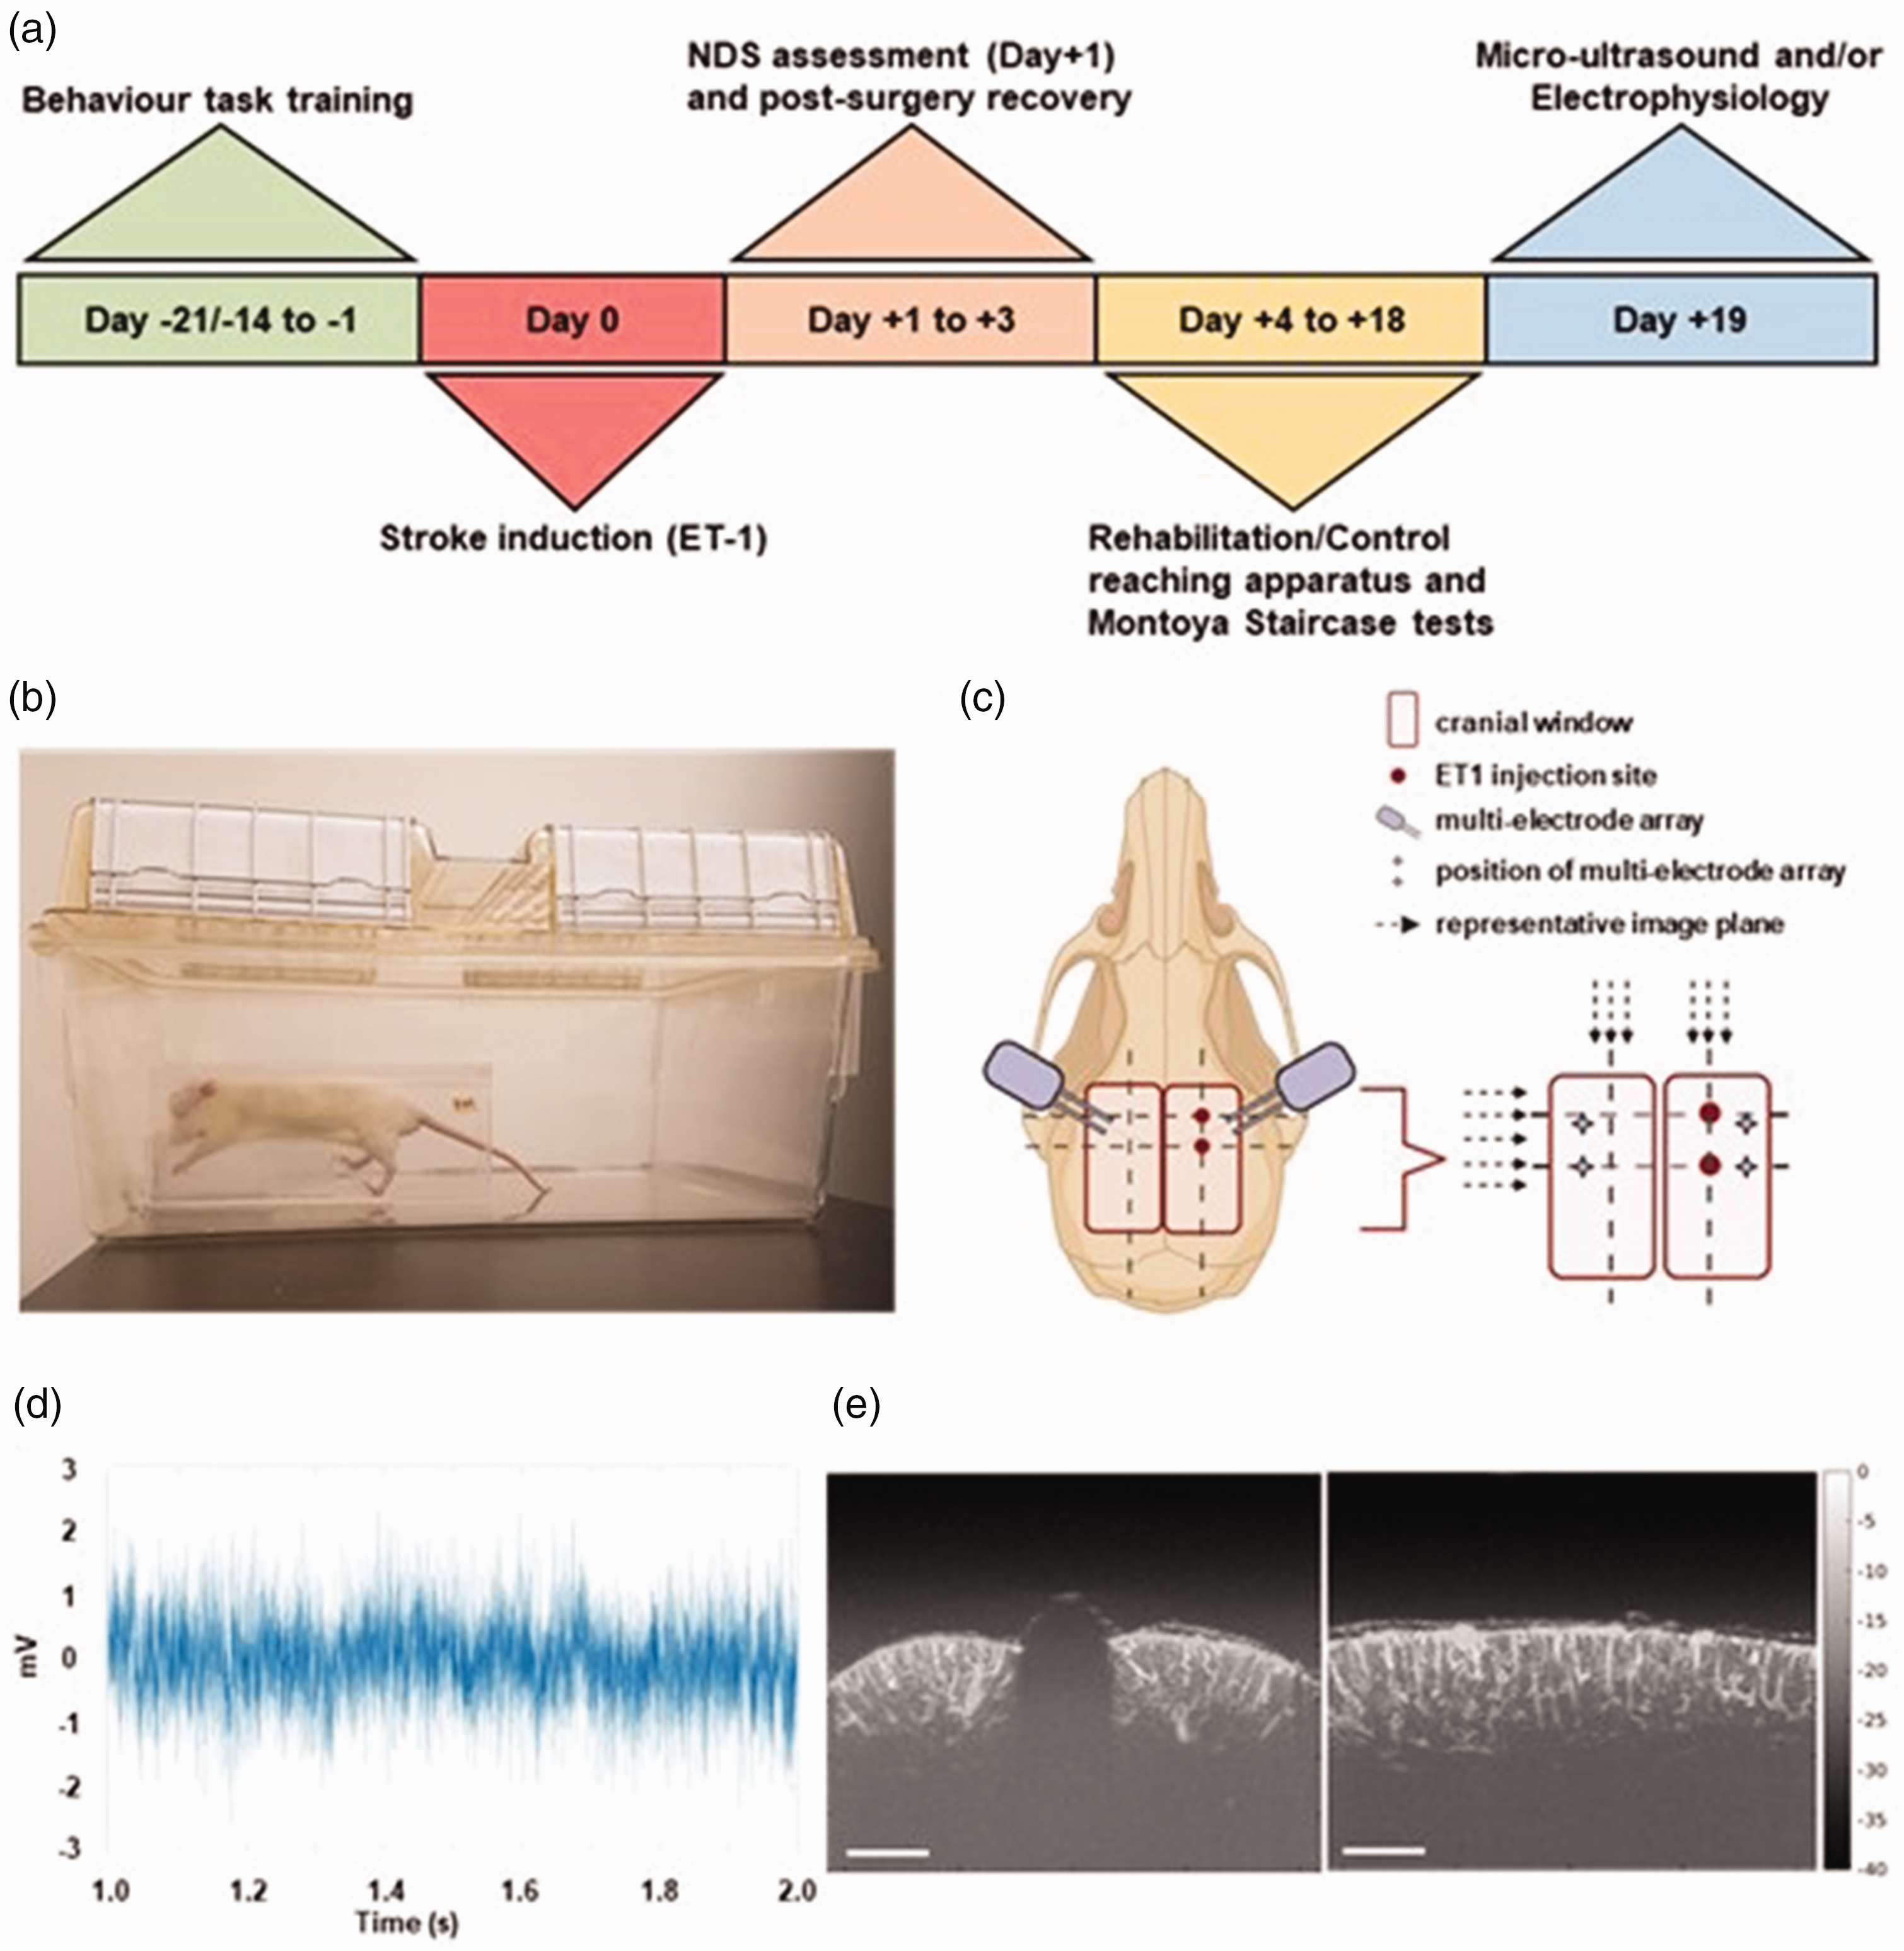
Overview of the experimental design. (a) Experimental time-line. Rats were trained on behavior tasks (Montoya staircase and reaching apparatus) for either 14 days or 21 days. At completion of training, focal ischemic stroke was induced via ET-1 injection into the forelimb area of the primary somatosensory cortex. On Day +1, NDS test evaluated the contralateral forelimb function, and an additional two days of recovery were provided. Day +4 was the first day of either rehabilitation on the tray reaching apparatus or control treatment (without tray reaching), and the Montoya staircase testing. On the final day, rats underwent ultrasound and/or electrophysiology assessments. (b) Rat performing the forelimb reaching task in the apparatus. (c) Experimental setup for ultrasound and electrophysiology recording following a bilateral craniotomy over the sensorimotor cortices. ET-1 injection sites for stroke induction are indicated by red circles. Micro-electrode arrays were inserted in both ipsi- and contralesional hemispheres, indicated by the stars. Micro-ultrasound imaging was performed in the sagittal and coronal planes; dashed arrows indicate image planes. (Created with BioRender.com) (d) Representative electrophysiology recording of spontaneous neuronal activity (Voltage in milliVolts over Time in seconds) and (e) Representative coronal (left panel) and sagittal (right panel) post-processed ultrasound maximum intensity projection (MIP) images with micro-bubble infusion, displayed with 40 dB dynamic range relative to peak signal in each image (scale bar = 1 mm).
Behavioral training and rehabilitation protocol
All rats were trained on the Montoya staircase 24 (one 15-minute session per day) and tray reaching (three 15-minute sessions per day) prior to stroke induction. The Montoya staircase consists of two staircases (one for each forelimb) with 7 steps in total and a barrier in between so as to ensure trays on the right can only be reached with the right forepaw and similarly on the left. Each step had a well where three sugar pellets are placed. Proficiency on the Montoya staircase was achieved when >75% of pellets (TestDiet AIN-76A Rodent Tablet 45 mg (5TUL)) were consumed on both left and right side: the animals had to obtain at least 12 (out of 21) pellets using each forepaw, with no more than a 20% discrepancy in average fraction of pellets eaten by each forepaw. 25 All animals were tested for handedness to ensure both forepaws were proficient in the reaching task prior to stroke induction.
The rehabilitative tray reaching task involved a tray filled with 3 grams of pellets (totalling 47 pellets), placed only on the side of the affected (left) forelimb, contralateral to the sensorimotor cortex injected with ET-1 (Figure 1(c)). When >75% of the pellets were eaten at a level, the tray was lowered by 0.5 cm. Proficiency was achieved on the tray reaching task when the rats reproducibly consumed >75% of the pellets at the lowest level. Total pellets eaten were calculated by subtracting the total number of pellets remaining in the tray and those dropped on the floor from the total pellets initially placed in the tray. After a rat reached proficiency on both the Montoya staircase and tray reaching task, experimental stroke was induced by endothelin-1 injection.
Electrophysiology recording and analysis
Detailed description is provided in the Supplemental materials.
Ultrasound data acquisition
A Vevo 2100 micro-ultrasound imaging system (FUJIFILM VisualSonics Inc., Toronto, Canada) equipped with a 50 MHz linear array transducer (MS700, nominal 30 μm axial and 75 μm lateral resolutions) was used for contrast-enhanced ultrasound image data acquisition in coronal and sagittal planes (Figure 1(e)). Microbubble contrast agent (Vevo MicroMarker™ Non-Targeted Contrast Agent, FUJIFILM Visualsonics Inc.) was injected to increase vascular contrast. The imaging setup used a 6.73 mm (width) × 8.73 mm (depth) field-of-view B-mode acquisition with 50 frames/s frame rate, high line density, 100% transmit power, 36 dB receive gain, and a single transmit focus set at 4.5 mm. The microbubble contrast agent suspension (105 μL at 2 × 10⁹ microbubbles/mL in saline) was injected through a tail vein catheter at a rate of 70 μL/min using a programmable syringe pump (Pump 11 Elite, Harvard Apparatus, Holliston, MA, USA) prior to the start of each ultrasound imaging acquisition.
Beamformed in-phase and quadrature (IQ) components of the ultrasound data were acquired in B-mode, with RF-mode activated. At each location, 1000 IQ frames were collected, for 20 seconds of ultrasound image data. IQ data were acquired in the coronal plane in the following sequence: at the anterior injection site, at the posterior injection site, at half-way between the two injection sites, 1 mm anterior of the anterior injection site, and 1 mm posterior of the posterior injection site (Figure 1(c)). Thereafter, sagittal plane IQ data were acquired in the plane of the injection sites, followed by sagittal images at 1 mm medial and then 1 mm lateral of the injection sites. We subsequently acquired the corresponding sagittal slices in the contralateral hemisphere.
Hypercapnic challenge
To assess the reactivity of the cortical penetrating vessels and evaluate cerebrovascular reserve using the broadly employed clinical test,26,27 a transient hypercapnic challenge was presented using the programmatically controlled gas mixer (GSM-3, CWE Inc. Boston MA). Micro-Ultrasound images were acquired at the five coronal imaging planes, covering both ipsilesional and contralateral hemispheres (Figure 1(c)). A bolus microbubble suspension was infused just prior to the start of imaging. The gas mixer program then delivered three cycles of hypercapnic challenge, presenting 1 minute of 10% CO2:31% O2:59% N2 followed by 3 minutes of 0% CO2:31% O2:69% N2 per cycle. For each peak CO2 reading of the inspired gas mixture and each nadir of CO2 inspired air, microbubbles were injected and the ultrasound IQ data recorded for 20 seconds.
Ultrasound data processing
Ultrasound data files were exported from the Vevo 2100, for offline processing using in-house written software. For each 1000-frame, 20-second data recording, in-phase (I) and quadrature phase (Q) signals were filtered using singular value decomposition. Singular values outside of the 200–800 rank range were zeroed to remove stationary or fast-moving signals. The preserved IQ data were enveloped and then motion corrected using the IMREGISTER function in Matlab (MathWorks, Natick, USA), such that each frame was registered to the median frame of the recorded time series through in-plane translations and rotation. Maximum intensity projection (MIP) images, along time dimension, were created from each acquired ultrasound recording series. For display purposes, the amplitudes were logarithmically compressed. The data were modeled by linear mixed effects models (lme in R), with hemisphere and treatment as fixed effects and subject as a random effect. For each linear mixed effects model ran, the Shapiro-Wilk test was used to test for non-normality in the residuals’ distribution.
Vessel tortuosity estimation
To estimate the tortuosity of the cortical penetrating vessels, we adapted the approach from Chong et al., 2017. MIP images of all sagittal plane ultrasound data recordings were used to calculate vessel tortuosity. The geodesic distance (LG) and the Euclidean distance (LE) defined as the path length of a vessel segment and the shortest distance between its extremities, respectively, were estimated for individual vessels. The ratio LG/LE yielded a tortuosity index for each vessel. Vessel segments between the cortical surface and a cortical depth of 2 mm with LG ≥ 0.5 mm were analyzed. Segments of lower LG were considered too short to allow a robust assessment of their tortuosity. Linear mixed modeling (GraphPad Prism) was used to evaluate the effect of hemisphere (ipsilesional vs. contralesional) and treatment (rehabilitation vs. control) on the vessel tortuosity index, with subject treated as a random effect.
Microbubble velocity estimation
The velocity of microbubbles was estimated in cortical penetrating vessels in the five coronal image planes, under normocapnia and hypercapnia. Penetrating arterioles and venules were identified in each image time series as vessels orthogonal to the cortical surface and exhibiting, respectively, downward or upward passage of microbubbles, and analyzed independently. Vessels were manually segmented from MIP images using a polygon-drawing tool, written in-house in python, and the vessel center axis calculated from the outline. In each frame, pixels with intensity above a threshold value were identified as microbubbles and their position located via centroid detection. The threshold level was set per vessel such that passage of multiple scatterers through the vessel could be visualized over the 20-s acquisition. Where multiple local maxima were detected in close proximity (within the 3 × 3 square centered at the given pixel), these clusters were screened for accurate depiction of scatterer passage through the vessel, and the peak closest to the vessel axis was selected as the microbubble position. The resulting data provided the coordinates of microbubbles in each frame, which were tracked from frame to frame to estimate the velocity in each vessel. Velocity was calculated over packets of minimum five frames that had the same number of microbubbles in the vessel, indicating consistent flow. The frame packet with the most detected centroids was used to define vessel sub-sections for velocity measurement. The mean velocity of a microbubble in a section was calculated using the displacement over the series of frames for which an individual centroid could be tracked. Finally, calculated velocities in vessel sections were averaged across the time series to give a mean section velocity. Where microbubble passage was observed in the same segmented vessel under normocapnia and hypercapnia, the mean velocity along the length of the vessel was calculated. We thus computed the mean velocities during each of the two normocapnic and three hypercapnic periods, and subsequently estimated hypercapnia-induced changes in microbubble velocities in each vessel.
Vascularity index calculation
The coronal plane MIP images were then used to evaluate the intensity of blood flow by calculating a Vascularity Index (VI). The cortical regions of interest (ROI) for each hemisphere were manually drawn around the cortex in each hemisphere, where vessels could be visualized on the maximum intensity projection (MIP) image of the Power Doppler acquisition. The mean pixel count was 15,114 ± 1972 for contralateral ROI and 16,947 ± 1980 for ipsilateral ROI. The Vascularity Index was then computed as the ratio of the mean ROI signal intensity to the total number of pixels in that ROI.28,29 We also computed the change in the vascularity index induced by the hypercapnic challenge in relation to its value during air-breathing.
Statistical analysis
Statistical analyses and figure visualizations were performed using R 30 and Matlab. The Shapiro-Wilk test was used to test the normality of the data used here; no non-normality in data distribution was seen, hence the standard deviations are used to report the errors in this work. Differences in quantitative measurements were evaluated by the significance of the effects through the linear mixed modeling or Student’s t test when corresponding. Differences were deemed statistically significant when p-value is <0.05.
Results
Rehabilitation induced an improvement in contralateral forelimb reaching post focal ischemia
We used the Montoya staircase to assess the effects of stroke and subsequent rehabilitation on forelimb reaching (Figure 1(b)). The Montoya staircase measures the ability of the animal to reach and grasp pellets from seven progressively more distant staircase levels using either forelimb. Across the 8 days prior to stroke, 79 ± 13% (mean ± SD) of pellets were retrieved using the contralateral forelimb, with no significant difference (p = 0.1381) between the rehabilitated and control group (80 ± 12% rehabilitated vs. 78 ± 15% control, respectively).
Stroke induced a significant drop (60 ± 6%, p < 0.0001) in reaching performance of the contralesional forelimb (accounting for 81% of total variation) in both the rehabilitated and control group, evaluated by comparing the performance during the last 3 days prior to stroke to the first 3 days following stroke (Figure 2(a)). Over the 14 days following focal ischemic stroke, the average percent of pellets retrieved by the rehabilitated group was 300 ± 15% that of the control group (57 ± 20% rehabilitated vs. 19 ± 9% control, p < 0.0001). Sixty percent of the total variation between the rehabilitated and control group was due to the tray-reaching rehabilitation (p = 0.0039), while 11% of the total variation between the rehabilitated and control group was due to time (p < 0.0001).
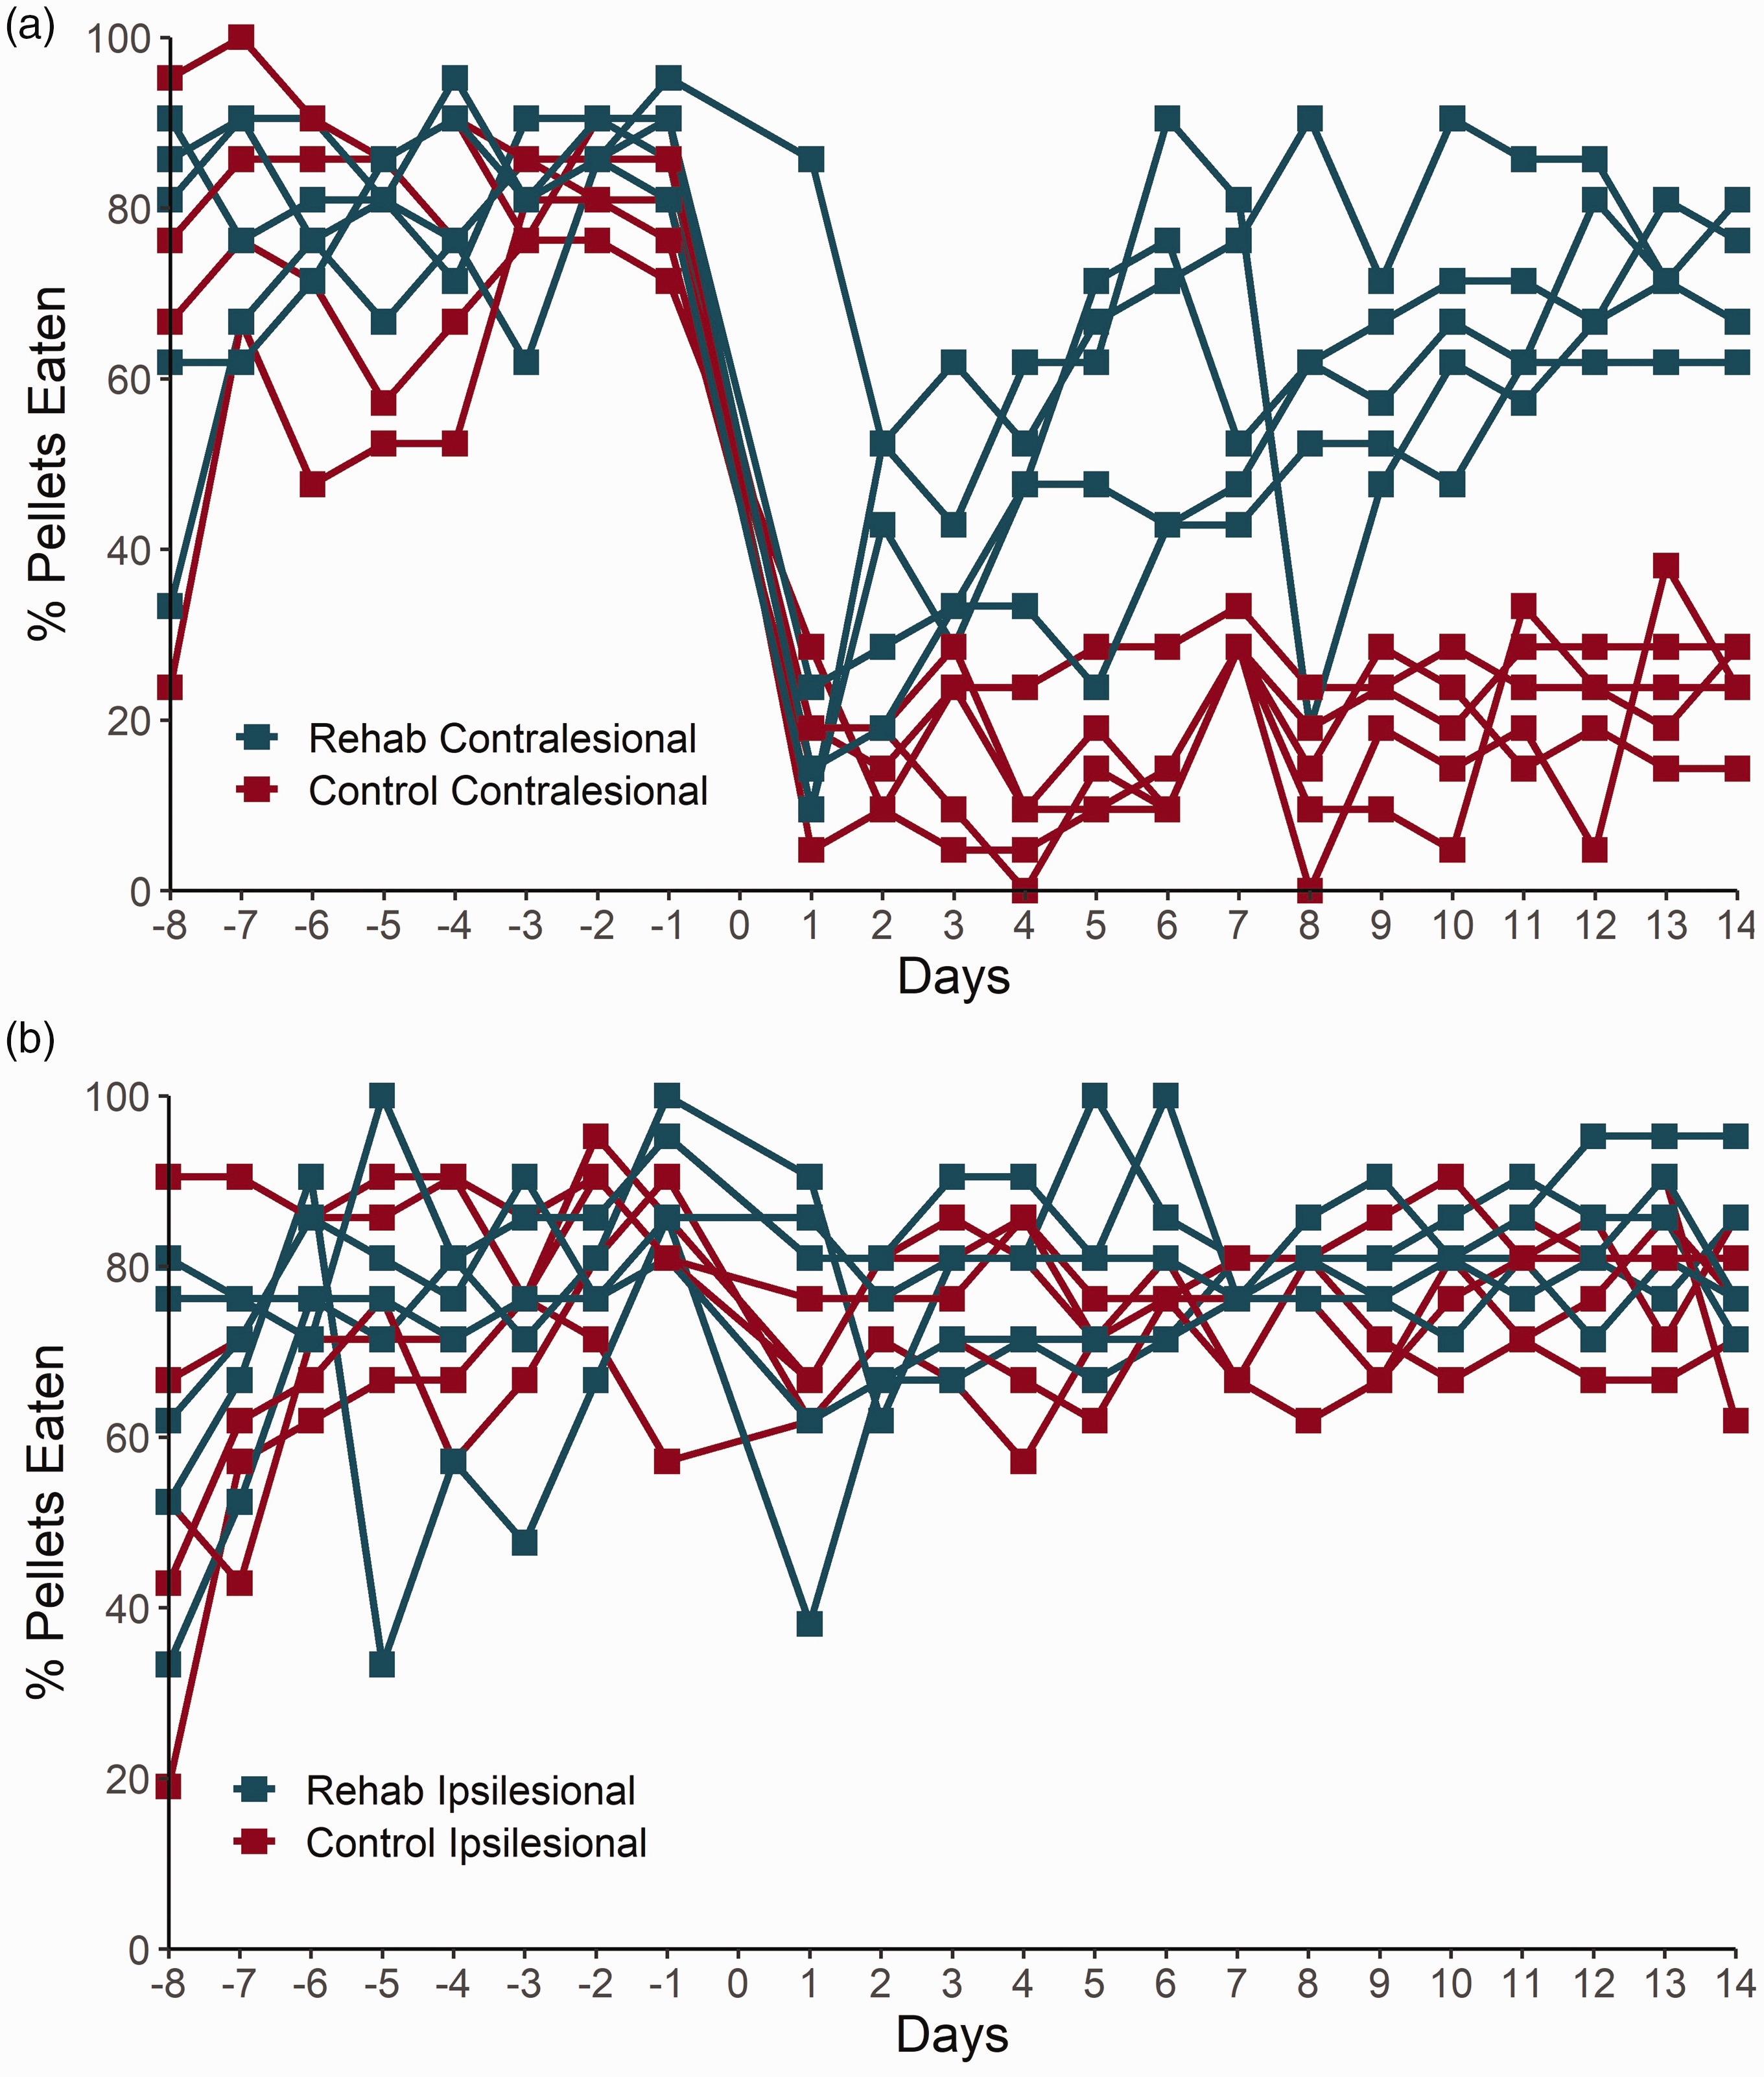
Montoya staircase performance. (a) Percentage of pellets eaten during the study using the affected forelimb, contralateral to stroke for each rat in the control and rehabilitated (Rehab) group (n = 5 rats in each group). Stroke was induced on day 0. Control and rehabilitated cohorts showed no differences in skilled forelimb reaching task using the contralesional forelimb prior to stroke (p = 0.1381). Over the 14 days following focal ischemic stroke, the average percent of pellets retrieved by the contralesional forelimb in the rehabilitated group was significantly higher than that in the control group (57 ± 20% pellets were retrieved by the rehabilitated vs. 19 ± 9% pellets retrieved by the control, p < 0.0001) and (b) Percentage of pellets eaten before and following stroke using the ipsilateral (notionally unaffected) forelimb by the control (red) and rehabilitated (blue) groups. Across the last 8 days prior to stroke, the animals retrieved 74 ± 15% of the pellets by the ipsilateral forelimb. There was no significant difference in ipsilateral forelimb reaching between the rehabilitated and control groups either before stroke (p = 0.2694) or following stroke (p = 0.0947).
For the ipsilateral forelimb, an average of 74 ± 16% of total pellets were retrieved in the 8 days prior to stroke induction, with no significant difference between the rehabilitated and control group (p = 0.2694) (75 ± 15% and 74 ± 16% respectively; Figure 2(b)). Over the 14 days following stroke, the portion of pellets retrieved with the notionally unaffected forelimb was 77 ± 9%, with a trend toward improved performance in the rehabilitated vs. control groups (80 ± 10% rehabilitated and vs. 75 ± 8% control, mean ± SD, p = 0.0947).
Rehabilitation elevated the ipsi-to-contralesional neuronal power ratio in the alpha, beta, and low gamma frequency bands
Electrophysiological signals were recorded to evaluate the neuronal activity levels in the forelimb region. The ratio of power between the ipsilesional and contralesional hemisphere was computed for each frequency band. Spontaneous activity levels were lateralized (i.e ipsi-to-contralesional neuronal power ratio was significantly different from 1) in the theta, alpha, and beta frequency bands of the rehabilitated group (p = 0.0001, p < 0.0001, and p = 0.0036 respectively; Table 1 and Figure 3). In contrast, no neuronal power lateralization was observed in the control cohort in any band. The ipsi-to-contralesional neuronal power ratio was significantly higher in the rehabilitated vs. control group in the theta (p = 0.0343), alpha (p = 0.0307), beta (p = 0.0293), and low gamma (p = 0.0472) bands.
Ipsi-to-contralesional neuronal power ratios (mean ± SEM).
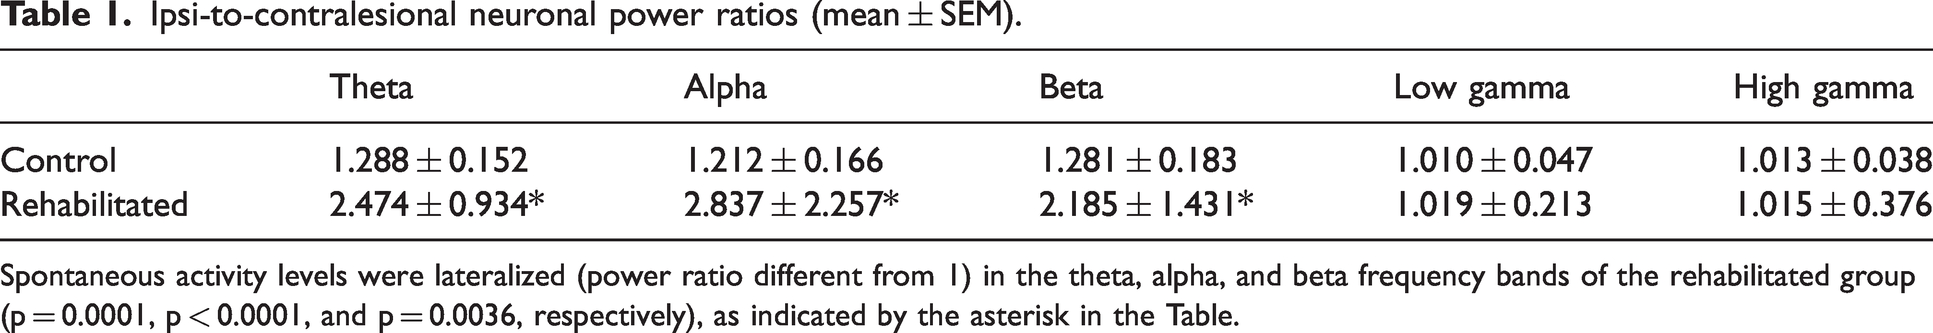
Spontaneous activity levels were lateralized (power ratio different from 1) in the theta, alpha, and beta frequency bands of the rehabilitated group (p = 0.0001, p < 0.0001, and p = 0.0036, respectively), as indicated by the asterisk in the Table.
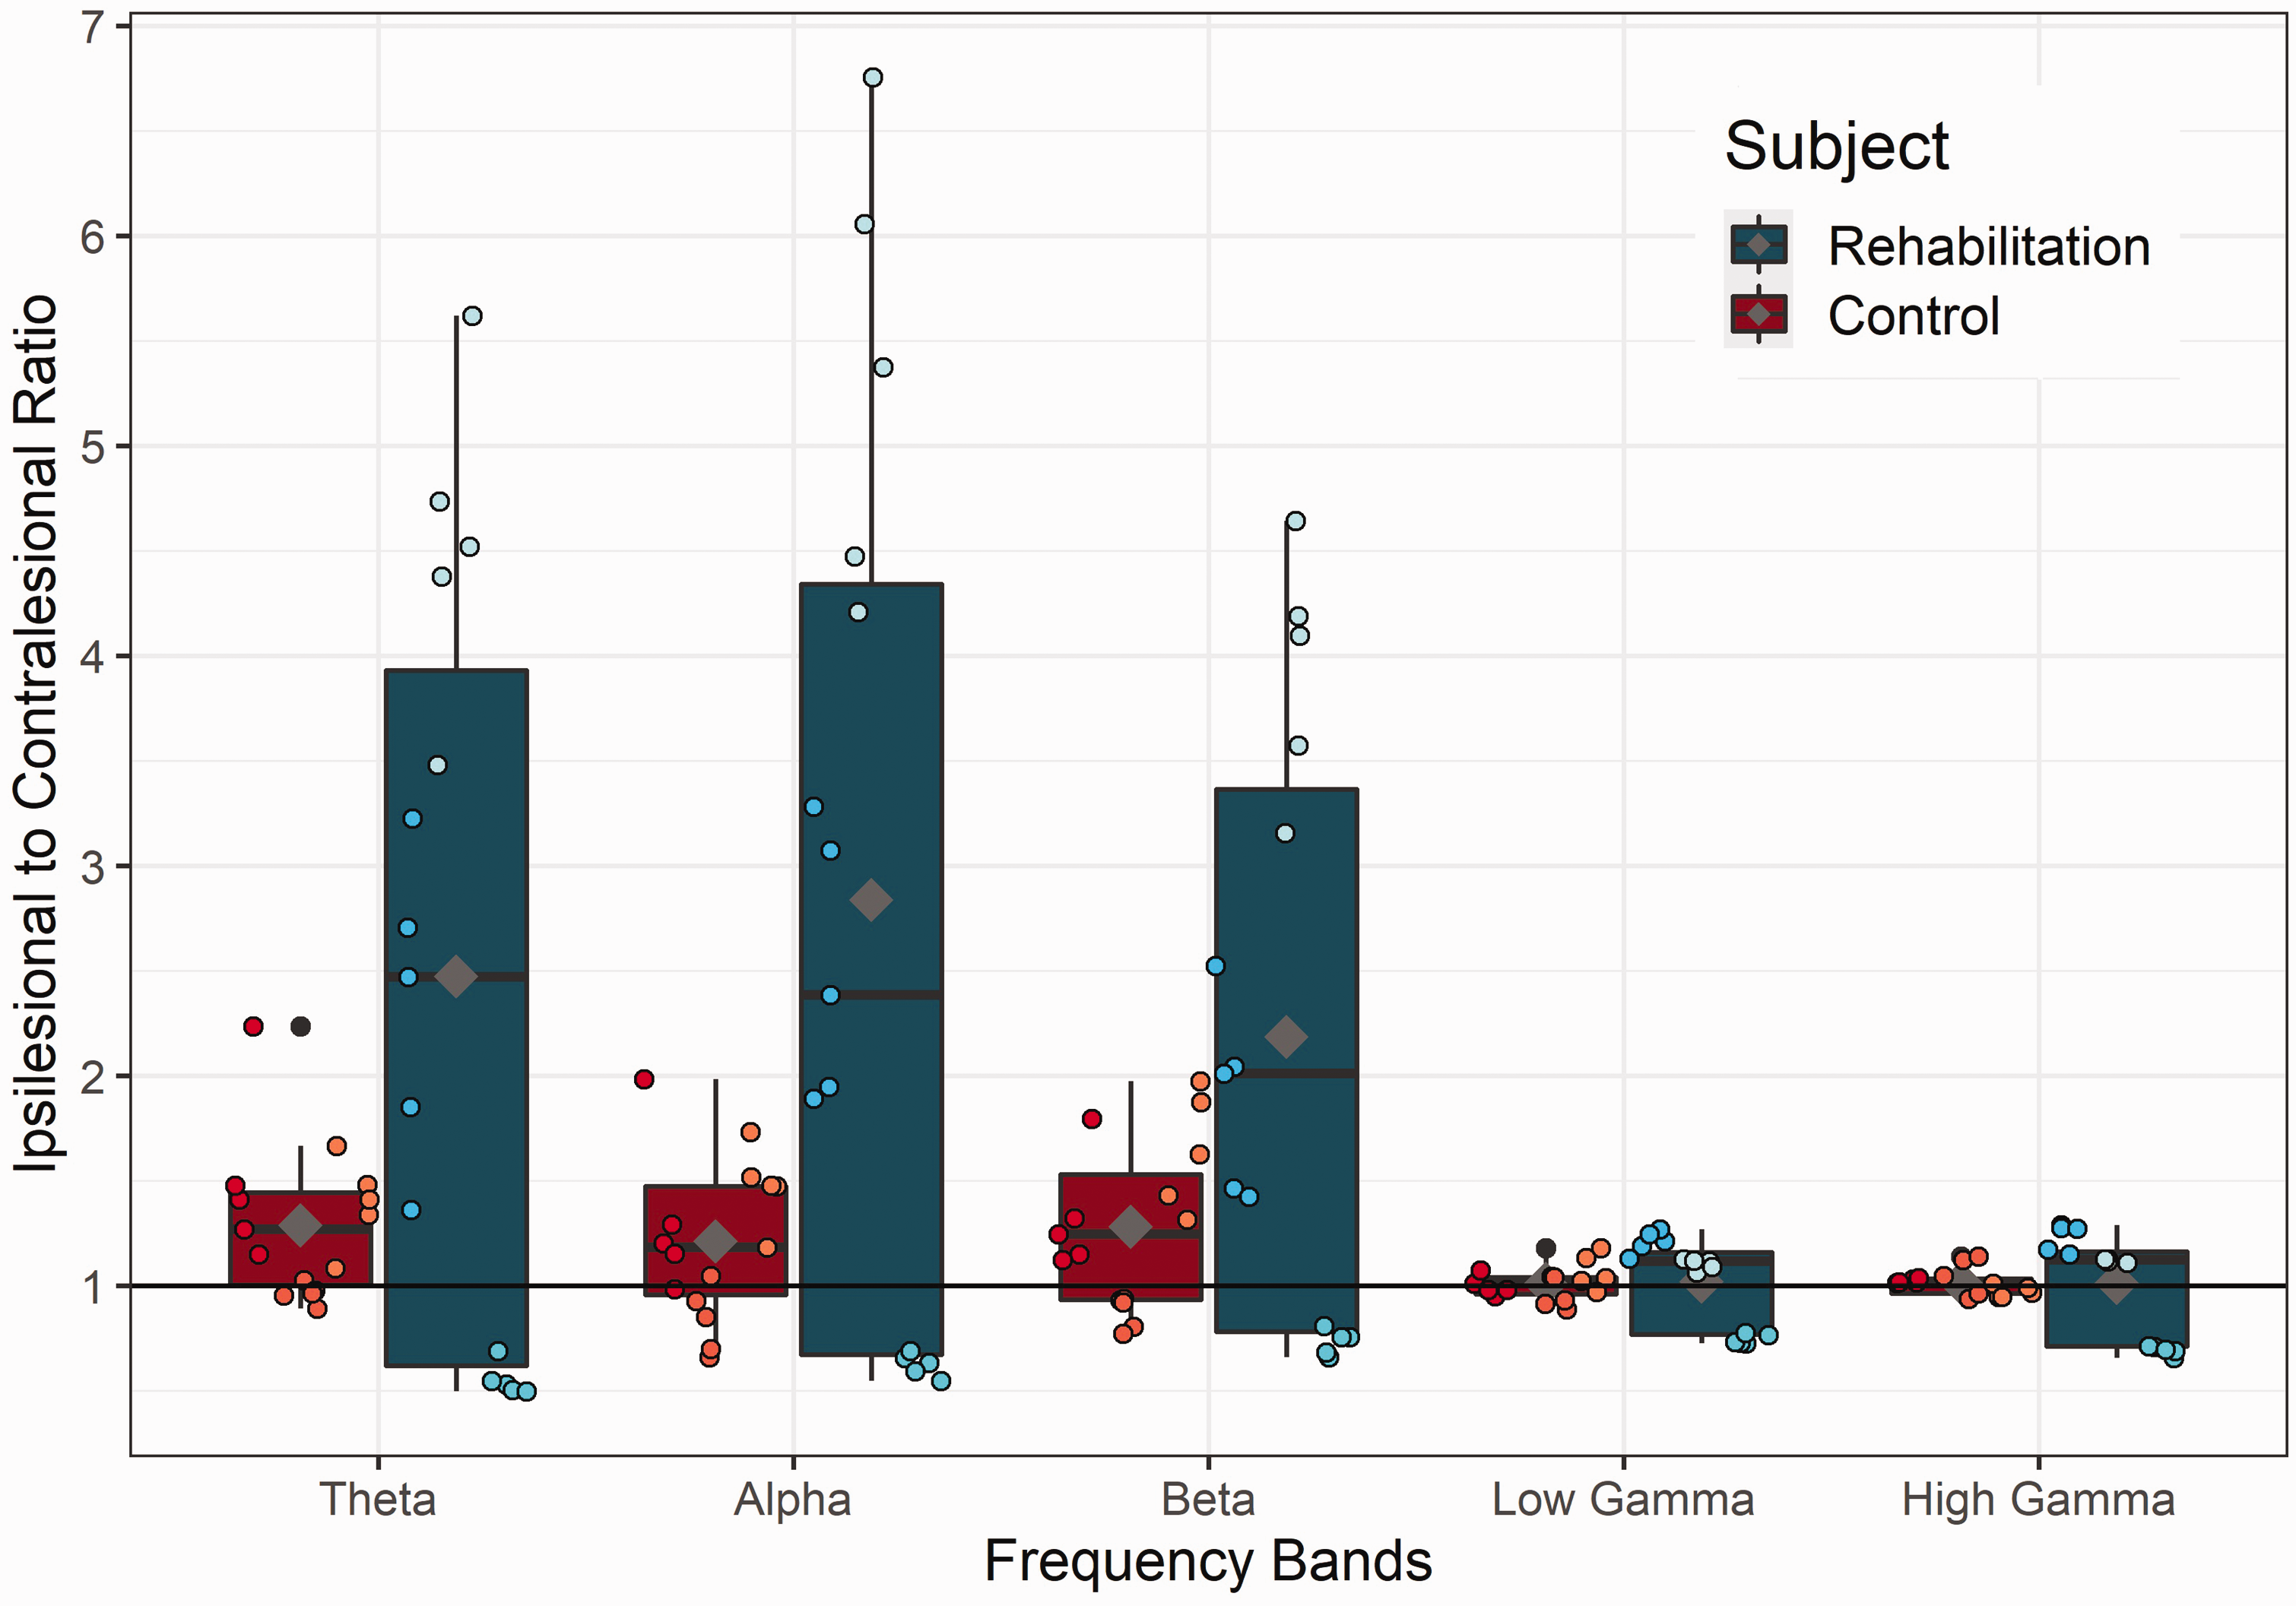
Ipsi-to-contralesional neuronal power ratio. Power ratio between the ipsilesional and contralesional neuronal power was calculated for the control (red; n = 3 rats) and rehabilitated (blue; n = 3 rats) groups, with five 2-minute recordings in each rat. Theta (2–10 Hz), alpha (10–15 Hz), beta (15–30 Hz), low gamma (30–80 Hz), and high gamma (>80 Hz) frequency bands were evaluated. Ipsi-to-contralesional neuronal power ratio as a function of neuronal oscillation band. The ipsi-to-contralesional neuronal power ratio was significantly elevated in the rehabilitated vs. control group in the theta (p = 0.0343), alpha (p = 0.0307), beta (p = 0.0293), and low gamma (p = 0.0472) bands. Grey diamond marks the mean power ratio of each frequency band for control and rehabilitated rats.
Focal ischemia elicited an increase in the tortuosity of ipsilesional cortical penetrating vessels
Vessel tortuosity was evaluated to probe the effect of ischemic stroke and rehabilitation on the structural integrity of the cerebral penetrating vessels. The tortuosity of a vessel can impact blood flow, and correlates with vessel wall permeability. 31 Representative images of a relatively tortuous and a relatively straight vessel are shown in Figure 4(a) and (b). Tortuosity indices were not significantly different between the contralesional cortex of the control group and the contralesional cortex of the rehabilitated group (1.030 ± 0.0167 vs. 1.032 ± 0.0153, respectively, p = 0.66), nor between the ipsilesional cortex of the control group and ipsilesional cortex of the rehabilitated group (1.184 ± 0.0657 vs. 1.182 ± 0.0743, respectively, p = 0.95) (Figure 4(c)). Consequently, the data for control and rehabilitated group were pooled to establish the lateralization in the tortuosity index, elicited by stroke: the vessel tortuosity in the ipsilesional cortex was 15% higher than in the contralesional cortex (1.182 ± 0.054 ipsilesional vs. 1.031 ± 0.059 contralesional, p < 0.0001).
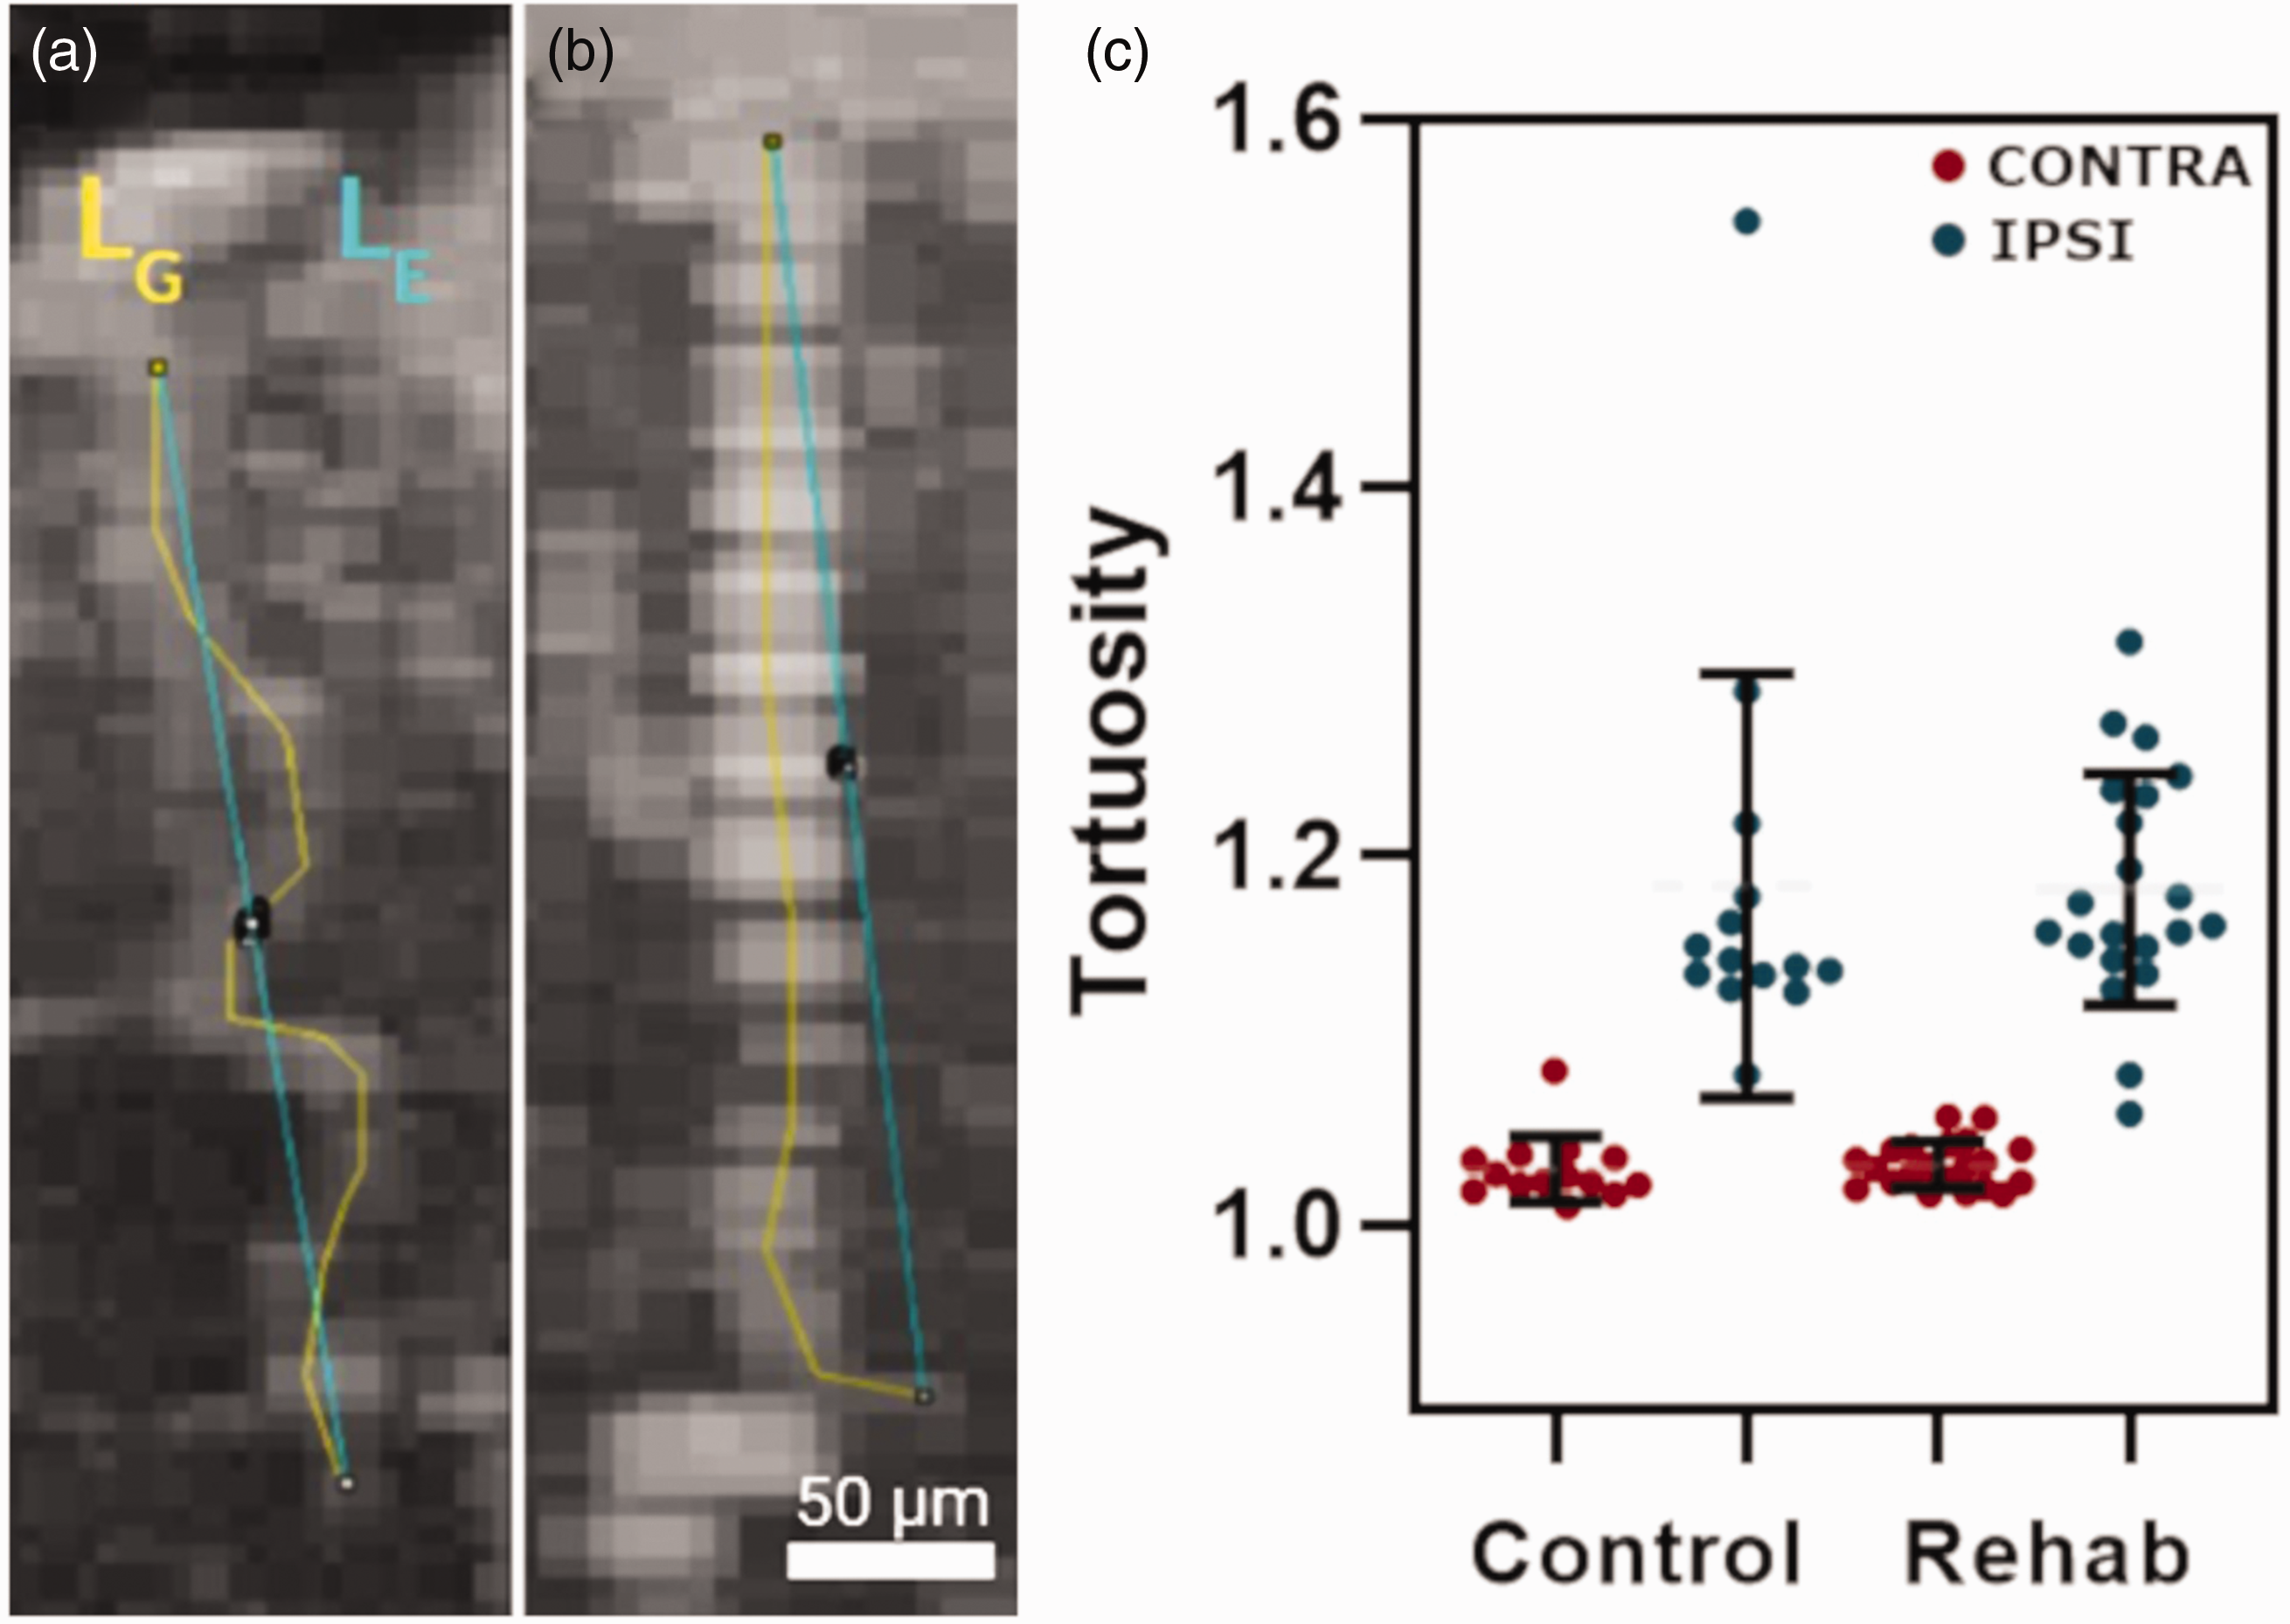
Tortuosity measurements in the cortical penetrating vessels. Representative maximum intensity projection of micro-ultrasound images (a and b) of ipsilesional cortical penetrating vessels, with geodesic (LG) and Euclidean distances (LE) outlined. (c) Measurements of vessel tortuosity indices in the control and rehabilitated (Rehab) cohorts. Vessel tortuosity in the ipsilesional cortex of controls was 15% higher than that in the contralesional cortex of controls (1.184 ± 0.0657 vs. 1.030 ± 0.0167, p < 0.0001). Similarly, the penetrating vessels in the ipsilesional cortex of the rehabilitated rats had significantly higher, by 15%, vessel tortuosity than those in the contralesional cortex in the rehabilitated cohort (1.182 ± 0.0743 vs. 1.032 ± 0.0153 respectively, p < 0.0001). Data were collected in 6 control and 7 rehabilitated rats, with multiple vessels sampled in each rat for a total of 37 contralesional and 38 ipsilesional vessels in control rats, and 44 contralesional and 55 ipsilesional vessels in rehabilitated rats.
Focal ischemia induced perilesional hyperperfusion both at rest and during hypercapnia
The velocity of microbubbles was estimated from coronal section imaging during normocapnia and hypercapnia, illustrated in Figure 5(a). Measurements were acquired on a total of 230 cortical penetrating vessels from 12 animals (28 contralesional vessels and 63 ipsilesional vessels in 5 control rats (i.e. 18 vessels/animal) and 45 contralesional and 94 ipsilesional vessels in 7 rehabilitated rats (i.e. 20 vessels/animal)). As no significant difference was observed between rehabilitated and control cohorts, data were pooled to increase the power of the assessment of the lateralization of the hypercapnic response. With the data thus pooled, during normocapnia, ipsilesional and contralesional vessels had microbubble velocities of 5.33 ± 0.50 (mean ± SD) and 5.09 ± 0.43 mm/s, respectively, so that the ipsilesional velocities were 4.72 ± 0.66% higher (p < 0.001) than those on the contralateral side. During hypercapnia, ipsilesional and contralesional vessels had microbubbles velocities of 5.34 ± 0.50 and 5.18 ± 0.51 mm/s, respectively (Figure 5(b)), resulting in the ipsilesional microbubble velocities being elevated by 3.09 ± 0.71% (p = 0.03) when compared to those on the contralesional side. Comparing normo- to hypercapnia, the contralesional cortex showed a significant response to hypercapnia: the velocities contralesionally increased by 2.43 ± 0.92% higher (p = 0.03) during hypercapnia than during normocapnia. In contrast, there was no significant microbubble velocity response to hypercapnia in the ipsilesional cortex (p = 1.0).
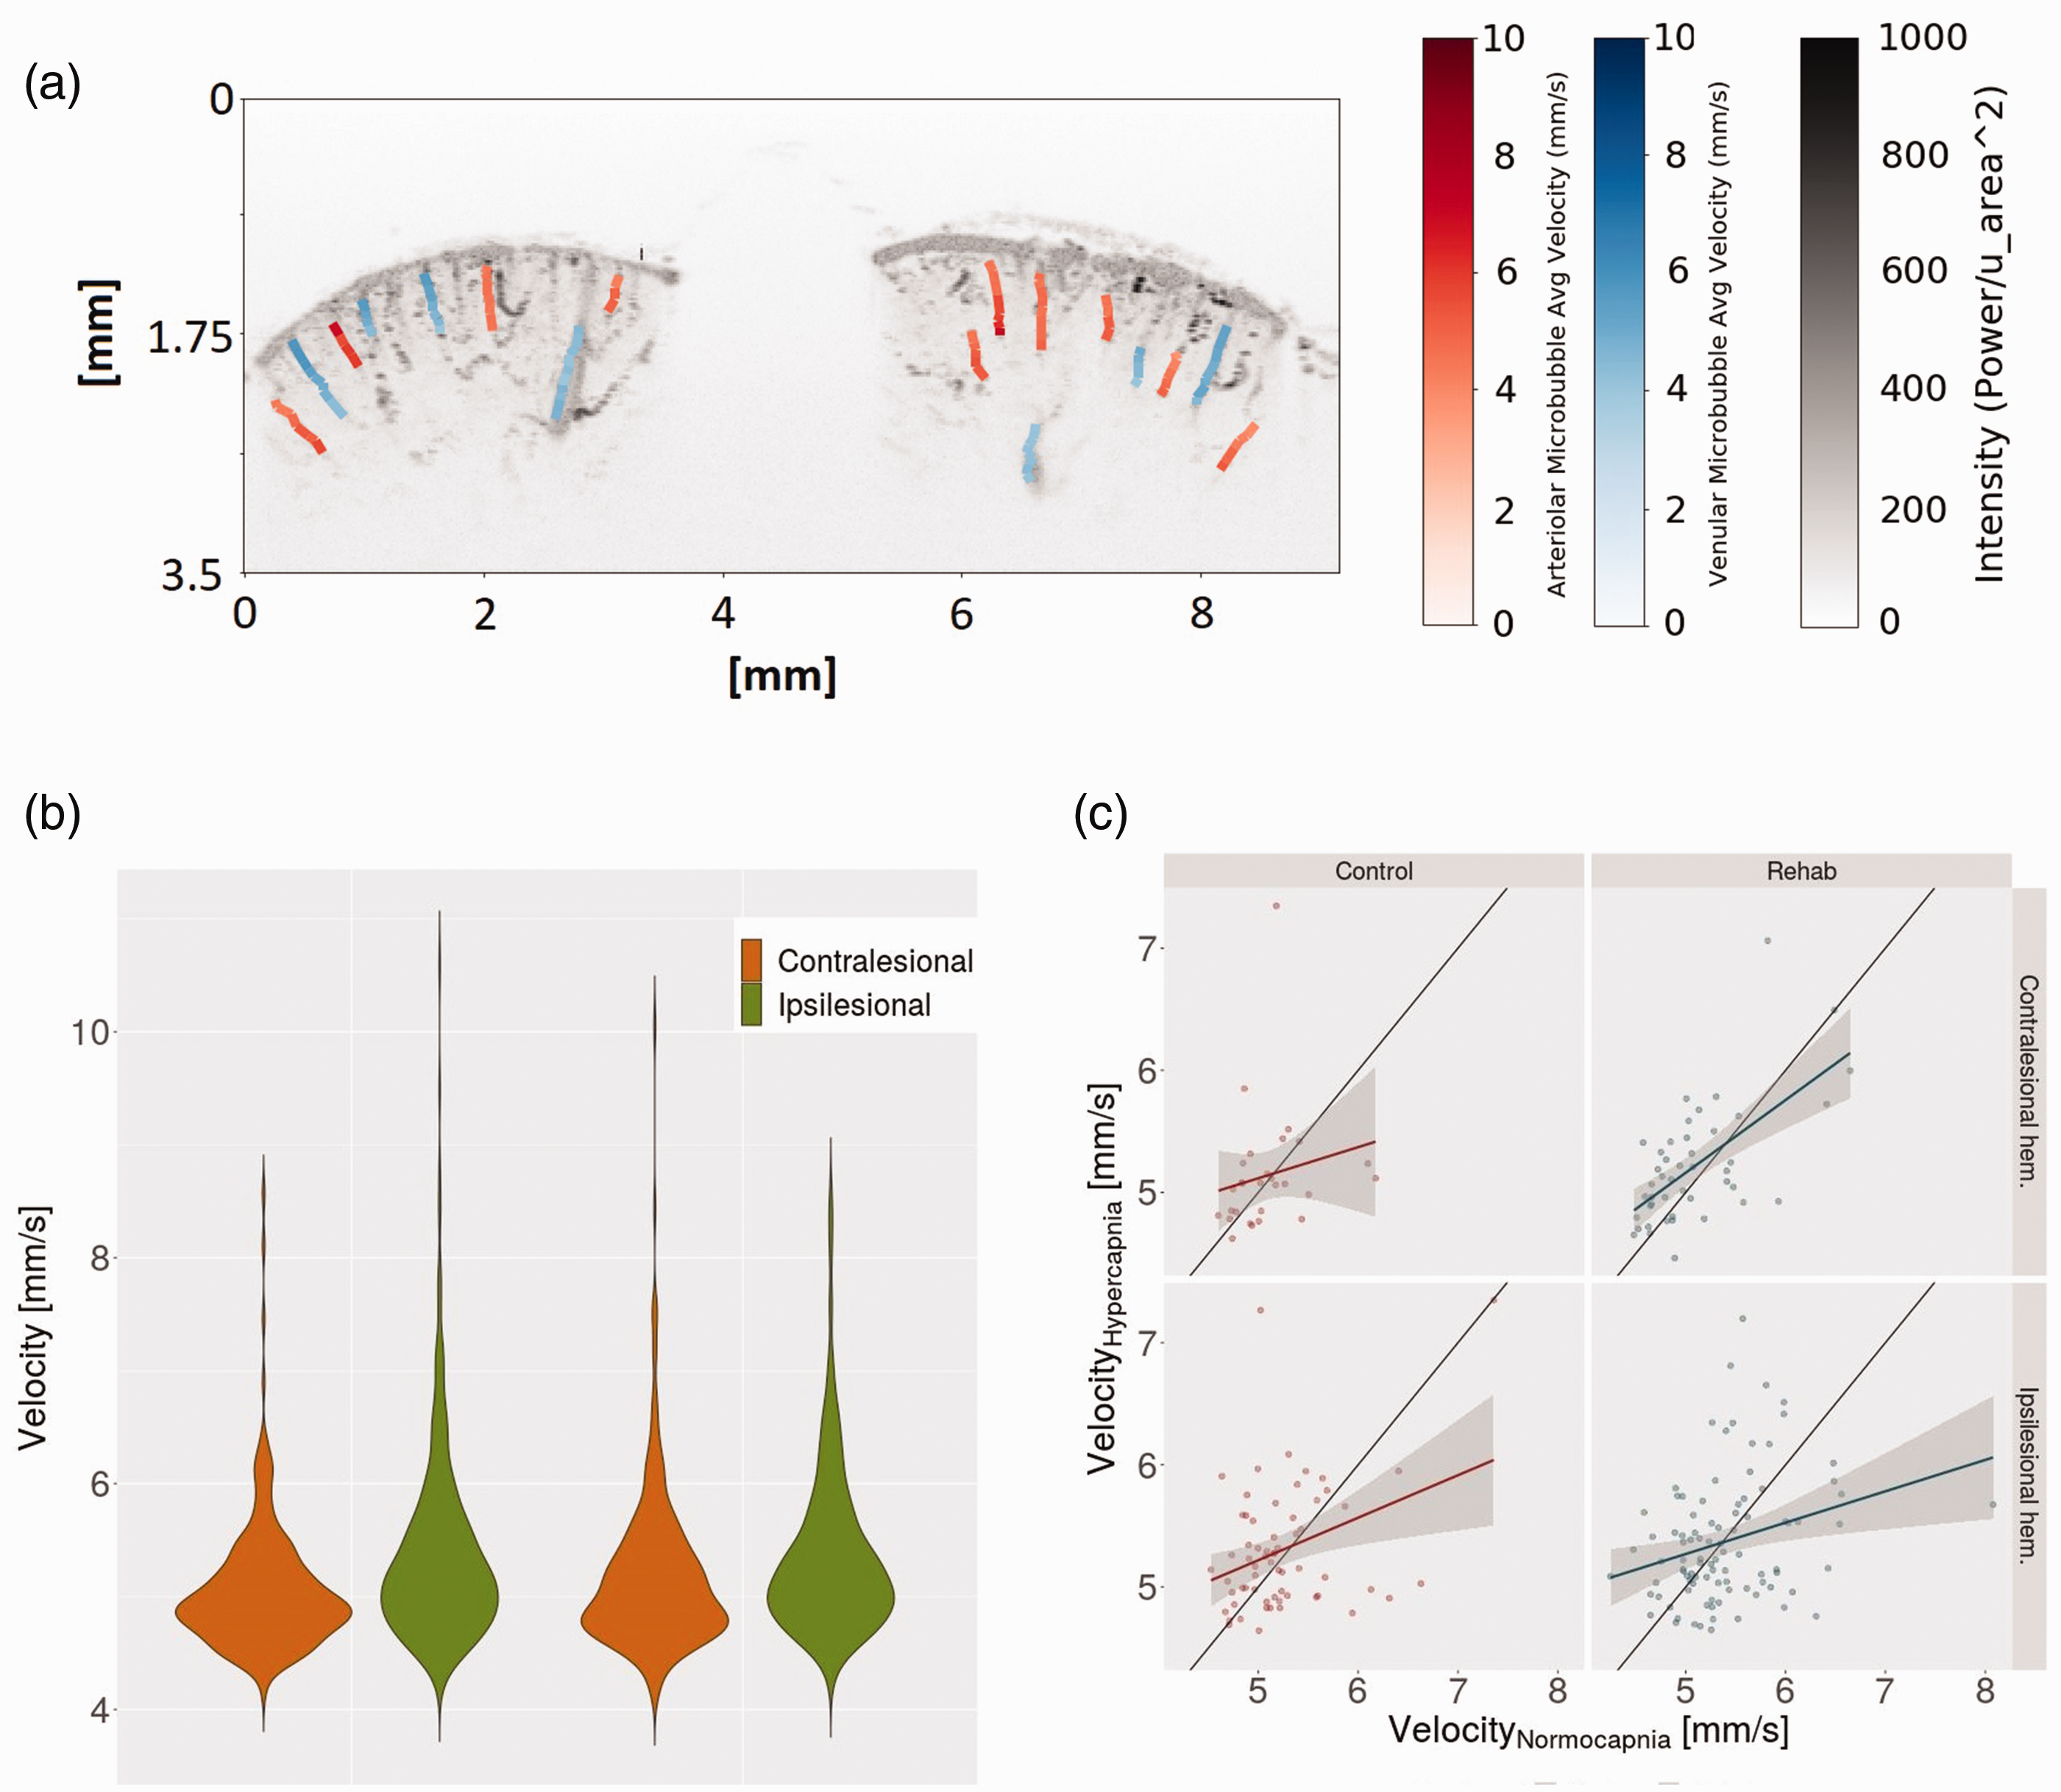
Cerebral hemodynamics. Velocities of microbubbles traveling through cortical penetrating vessels during normocapnia (0% CO2, 31% O2 and 69% N2) and hypercapnia (10% CO2, 31% O2 and 59% N2). (a) Representative coronal ultrasound maximum intensity projection overlaid with velocity estimates. (b) Violin plot of distribution of velocities measured in vessel segments during normocapnia and hypercapnia. Velocities within ipsilesional vessels were higher than those of the contralesional vessels in both normocapnic (4.72 ± 0.66% higher, mean ± SD, p < 0.001) and hypercapnic states (3.09 ± 0.71%, p = 0.03). In response to hypercapnia, microbubble velocities increased in the contralesional cortex (p < 0.03) but not in the ipsilesional cortex (p = 1) and (c) Regression to the microbubble velocities along the length of vessels during hypercapnia vs. during normocapnia, with the shaded gray area encompassing the 95% confidence interval for each vessel type in ipsilesional and contralesional hemispheres.
In the absence of pooling of data between control and rehabilitated rats, further differences were observed: the disaggregated by treatment velocity distributions are thus shown in (Supplementary Figure 1
The homogenization of velocity induced by hypercapnia was evaluated by calculating the variance in the measured velocities under normocapnia vs. that during hypercapnia. A slope of less than 1 indicates homogenization of velocities in the hypercapnic state compared to baseline, which is expected in healthy tissue. Homogenization of microbubble velocity was observed in the vessels of both ipsilesional (arterioles: n = 61, p=<0.001; venules: n = 96, p < 0.001) and contralesional cortices (arterioles: n = 35, p = 0.004; venule: n = 38, p = 0.002). In the control cohort, the slope of this regression was not lateralized (p = 0.35; contralesional cortex: slope = 0.27 ± 1.38 (n = 28), p = 0.3; ipsilesional cortex: slope = 0.35 ± 0.97 (n = 63), p = 0.006). In the rehabilitated rats, however, the slope was lower (greater homogenization) ipsi- vs. contra-lesionally (p = 0.047; contralesional cortex: slope = 0.58 ± 0.75 (n = 45 vessels), p < 0.001; ipsilesional cortex: slope =0.26 ± 0.90 (n = 94 vessels), p = 0.007; Figure 5(c)).
Rehabilitation induced a decrease in the baseline vascularity index
The vascularity index (VI) during normocapnia did not show lateralization (p = 0.6328), so the baseline VI data were pooled across ipsi- and contralesional cortices in each cohort. The cortical vascularity index at baseline was significantly lower, by 25.75 ± 1.93%, in the rehabilitated vs. control group (p = 0.050; Figure 6(a)). (In the absence of data pooling by hemisphere: contralesionally control vs. rehab: p = 0.1596; ipsilesionally control vs. rehab: p = 0.3573.) Hypercapnia-induced change in the vascularity index, a putative measure of cerebrovascular reserve,32,33 showed a strong trend toward being elevated by rehabilitation (by 6.77%, p = 0.0655; Figure 6(b)).
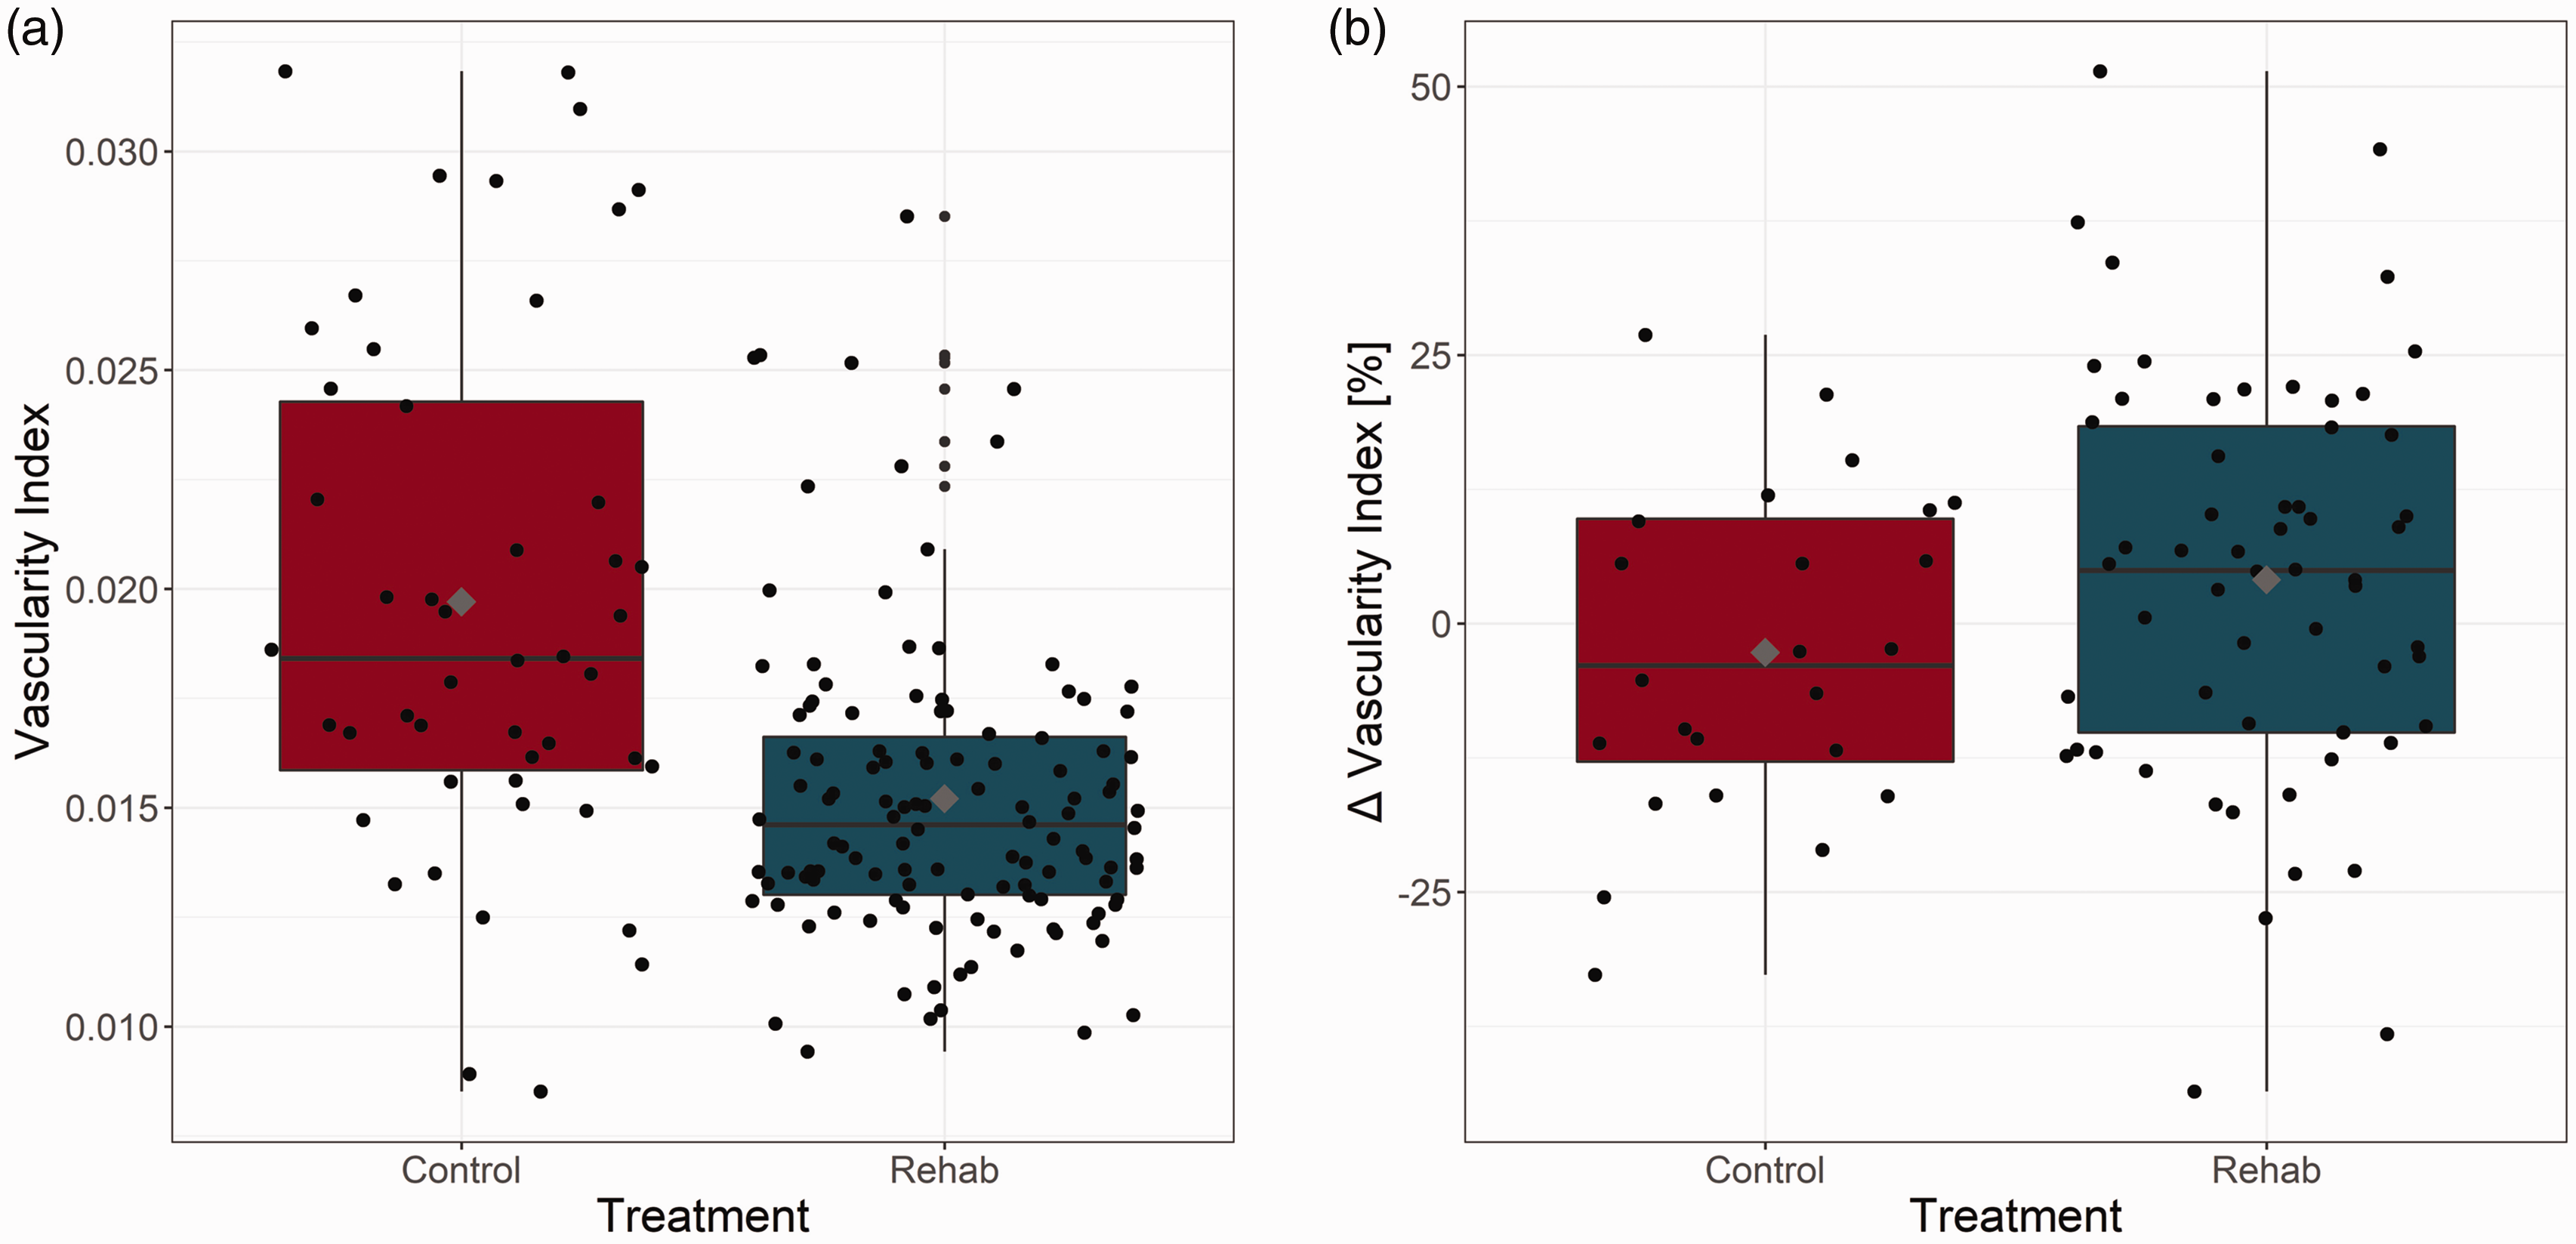
Vascularity Index. (a) The normocapnic cortical vascularity index (of either hemisphere) was significantly (p = 0.050) lower, by 25.75% ± 19.02% (mean ± SD), in the animals that underwent rehabilitation (Rehab) compared to the control cohort. There was no significant difference in the VIs of these two cohorts during the hypercapnic challenge (p = 0.9025) and (b) The hypercapnia-elicited change in the vascularity index trended toward being elevated in the animals that underwent rehabilitation compared to the controls (by 6.77% ± 1.93%, p = 0.0655). Grey diamond marks the mean power ratio of each frequency band for control and rehabilitated rats.
Discussion
The present work investigated the neurophysiological sequelae of skilled reaching rehabilitation and validated the utility of micro-ultrasound for assessment of cerebrovascular dysmorphology and dysfunction in an experimental model of focal ischemia induced via direct cortical injection of endothelin-1. While the presently employed preclinical model did not incorporate comorbidities to limit attrition and enable optimization of the imaging parameters and protocol, successful clinical translation of preclinical research is predicated on continued development, both of sensitive quantitative assays of brain function, and of incorporation of relevant comorbidities in the preclinical models. 34 Stroke elicited a 60% decrease in skilled forelimb reaching ability, a 14% elevation in perilesional vessel tortuosity, and a 5% elevation in perilesional blood velocities at baseline. The rehabilitation improved forelimb reaching by almost three fold; doubled ipsi- vs. contra-lesional neuronal activity in the theta, alpha, and beta frequency bands; decreased the baseline vascularity index by 26%, and was associated with lateralized hypercapnia-elicited homogenization in microvascular flow.
Focal ischemic stroke targeting the right sensorimotor cortex significantly impaired contralesional forelimb reaching performance while the ipsilesional forelimb remained unaffected. The level of impairment observed here (56%) is on the higher end of those reported in the literature in this model. Karthikeyan et al., reported nearly a 30% drop in reaching skill on the Montoya staircase test following a cortical stroke 35 while Ragas et al., reported declines varying between 76% to 93% following stroke. 36 In the current study, the rehabilitated group showed a gradual improvement up to ∼91% of their pre-stroke performance by day 14 (Figure 5(b)). Our control group, on the other hand, did not show a significant difference between day 1 and 14 of the rehabilitation period following stroke, with 17% and 23% of total pellets eaten respectively, indicating minimal spontaneous recovery in this model, in line with the literature. 35 In contrast to reaching performance on the Montoya staircase test, earlier work did report improved performance on the cylinder test between a test date immediately following stroke and two weeks thereafter, 35 underscoring the need for a battery of behavioral tests to capture the full extent of spontaneous recovery. 35 Repetitive training of the affected limb over weeks has been shown to expand the lesioned forelimb representation areas into the periphery of the infarcted core. 37 Forelimb performance on the affected side has been observed to positively correlate with forelimb representation area. 38 Conversely, training of the unaffected forelimb reduces the representation of the affected forelimb in the lesioned cortex. More importantly, forelimb representation expansion has been positively correlated with motor functional recovery. 39 Improvements gained from repetitive training have been observed to last for weeks to months following stroke. 40
Advancements in imaging modalities assessing micro-vessel function and integrity are providing new insights into rehabilitative mechanisms in post-stroke recovery. Pre-clinical investigations have predominantly focused on the acute phase of up to 4 weeks 41 with fewer reports beyond 8 weeks. Analysis during the acute onset to days post-stroke has identified complex molecular cascades disrupting microvessel and blood-brain-barrier integrity, 42 while functional ultrasound allowed measurement of hemodynamic perturbations during the ischemic event propagating spreading depolarizations. 43 Both patients and rodents develop compensatory motor skills to provide coping mechanisms in daily activities. 44 True deficits are challenging to define due to this compensation, 45 and therefore a body of reports encourage detailed assessment of fine movements as the animal completes a task 46 as well as specific tests to characterize the anatomical region of damage. 44 We previously demonstrated that an inflammatory response (GFAP, Iba-1) spreading beyond the perilesional territory, neuronal loss (NeuN) and increased endothelial cell density (RECA-1) up to 21 days after stroke, correlated with compromised fine-skilled reaching on Montoya Staircase. 4 Furthermore, Shiromoto et al. showed that suppression of neurogenesis by Ara-C decreased motor recovery in a reaching apparatus. 47 While some tests (e.g. adhesive tape test) are excellent methods for discerning asymmetry and tactile or dexterity impairments, they are presumed less effective for rehabilitative efforts in the rodent.44,46 Potential physical therapy candidates have included the cylinder test comparing forelimb function 35 and proprioceptive deficits on the rotarod 46 or ladder rung tests, 44 providing chronic assessment of locomotive coordination similar to some aspects of clinical physiotherapy. Significant neurovascular alterations such as VEGF mediated angiogenesis, 48 increased BDNF indicating neurogenesis, 49 and decreased apoptosis49,50 after treadmill therapy, provide additional examples of pathways modifications by rehabilitative interventions. Incorporating kinematic studies correlating fine motor deficits with rehabilitative efforts and imaging neurovascular mechanisms in the acute and chronic stages, may well aid in overcoming translational obstacles.51,52
While the use of EEG in stroke has been largely limited to that of a diagnostic tool to confirm or complement CT and MRI, there has been a slow retooling of EEG in stroke research, particularly in experimental models. The correlation between EEG and cerebral blood flow (CBF) in the context of ischemic stroke is affected by a multitude of factors that include the time period following stroke and lesion location. 53 During the acute stage following cerebral ischemia, the delta and alpha frequencies are positively correlated to regional CBF. 53 Thereafter, the correlation between the delta and alpha frequencies and CBF weakens, but a significantly positive correlation between alpha band EEG and cerebral metabolic rate of oxygen (CMRO2) arises. 53 In the chronic stage, the alpha frequency is the most tightly correlated to CBF. 53 Ipsilesional alpha frequency activity has long been known to be attenuated. 54 We observed an elevation of ipsilesional to contralesional alpha band neuronal power ratio in the rehabilitated group compared to the control group, suggesting preserved CBF levels, which may have been accompanied by ipsilesional CMRO2 upregulation.
Stroke has been shown to elicit a global decrease in the beta band activity, with the ipsilesional hemisphere being more affected than its contralesional counterpart. 53 Observations of the beta frequency changes, and its biological implications following stroke, have largely mirrored that of the alpha frequency, as corroborated by our findings. Subsequent to focal cortical ischemia, a reduction in theta and gamma frequency has been observed. 55 Then following two weeks of forelimb reaching rehabilitation, in line with present findings, beta power was elevated ipsilesionally. In an earlier clinical study, lateralization of theta and delta activity was observed in patients with unilateral cortical infarction. 56
Contrast-enhanced micro-ultrasound imaging with spatio-temporal filtering was used to segment the vascular structure for vessel tortuosity and vascular index calculations, and to estimate the velocity of blood flow within the penetrating venules and arterioles. Microbubble velocities serve as a proxy for RBC velocities, having comparable distributions. 57 Consequently, microbubbles are routinely used to both enhance the ultrasound contrast between vasculature and tissue, and allow estimation of flow velocity. 58 While color Doppler can be used to estimate blood flow velocities, it has limited resolution and sensitivity to smaller vessels for the tortuosity and vascularity metrics also evaluated. Recently developed ultrafast ultrasound imaging approaches are more sensitive to higher velocities than the B-mode imaging used in this study, and may be able to segment more and deeper vessels,43,59 yet require specialized hardware with customized software that is not yet widely available. Here, we used a commercial micro-ultrasound system that is commonly used in preclinical research, and were able to measure velocities over the depth of the cortex: the technique presented is thus an accessible approach for estimating cortical microvessel blood velocity and vascular structure. Furthermore, it is possible to detect higher velocities with the micro-ultrasound system with frame rates higher than the 50 fr/s used in this study, but with shorter recording times or a smaller field of view. Nonetheless, studies of vascular branching or neurovascular reactivity would benefit from improved density and resolution of vascular data that is possible with ultrafast ultrasound imaging. Therefore, future work will include advances such as superharmonic contrast imaging and ultrafast micro-ultrasound imaging,60,61 and contrast free techniques. 62 The latter is possible because of the increased backscatter from red blood cells at high frequencies (increasing by an order of magnitude between 20 MHz and 60 MHz 63 ) Of note, scattering from red blood cells may have contributed to the vascular contrast in the present study.
When comparing the ipsilesional and contralesional cortex within treatment groups (i.e., rehabilitated and control), a significant increase in perilesional tortuosity levels was observed. Changes in cortical penetrating vessel tortuosity add to the assessment of the deterioration in microvascular integrity and neurovascular coupling competence. The cortical penetrating vessels are of particular interest given their importance for maintenance of healthy levels of cortical perfusion. In this study, vessel tortuosity was elevated after stroke, by 15.00 ± 0.03% (p < 0.0001) in the rehabilitated and 14.53 ± 0.01% (p < 0.0001) in the control cohorts, respectively. Although two weeks of rehabilitation did not significantly impact vessel tortuosity, chronic deleterious feedback by compromised blood flow can produce a physiological cascade exacerbating tissue damage over time. 64 Tortuous vessels have been observed to be much more leaky, 65 disrupting the blood brain barrier. These vessels increase the risk for cerebral micro-hemorrhages 64 and hypertension, potentially leading to micro-aneurisms, and even initiation of Aβ plaques 66 or atherosclerosis. 67 Even mild tortuosity may thus contribute to the progression of neurovascular pathophysiology. Our finding of increased cortical penetrating vessel tortuosity highlights the importance of pursuing multi-modal imaging techniques to assess micro-vessel morphology over a chronic time window.
Intriguingly, two weeks of rehabilitation effectively decreased cortical vascularity. Recently Williamson et al., demonstrated high rates of capillary formation and elimination with hyperemia at day 14, followed by a return of flow rates to pre-infarct levels by day 28. 65 Although rehabilitation is expected to be associated with functional neovascularization, 65 the timeline of the transition from angiogenesis to stable vessel integrity and blood flow is variable.68,69 Therefore, our observation of a difference in vascularity between rehabilitated versus no intervention cohorts is encouraging, and calls for longitudinal investigations to elucidate the interrelated time-line of vasculogenesis11,17,49,69 and remodeling,49,65 with consideration for the schedule, type, and intensity of rehabilitation. 59
Micro-ultrasound based velocity estimation also revealed significant contrasts in post-stroke cerebral hemodynamics induced by rehabilitation treatment. The control rats showed no hemispheric lateralization in the cortical penetrating vessel velocities either during normocapnia (p = 0.2) or during during hypercapnia (p = 0.2), with no significant difference (p = 0.2) between normocapnic vs hypercapnic microbubble velocities, i.e. with no significant functional reactivity to hypercapnia in the control rats. In contrast, the rehabilitated rats showed ipsi- vs contralesional velocity elevation during normocapnia (by 6.10 ± 0.84%, p = 0.001), a trend toward higher ipsi- vs contralesional velocity during hypercapnia (p = 0.08); and, finally, strong trends toward hypercapnia-elicited microbubble velocity elevation both controlesionally (p = 0.09) and ipsilesionally (p = 0.07). In toto, these measurements support the notion of partial recovery of stroke-induced deficit in cortical microvascular reactivity upon rehabilitation treatment.
Of note, with respect to the microultrasound-based absolute quantification of the microvessel velocities, the mean cortical penetrating vessel microbubble velocity of 5.09 +/− 0.37 m/s in the notionally unaffected hemisphere of the control rats is well within the range of velocities measured in the healthy rat cortex with ultrafast ultrasound localisation microscopy (1 mm/s up to 14 mm/s) 59 and with ultrafast Doppler ultrasound (up to 12 mm/s for venules and 18 mm/s for arterioles), 43 lending further support to contrast-enhanced microultrasound based measurements of microvessel velocities.
Under physiological conditions, the variance in RBC velocities is expected to decrease in the hypercapnic state relative to baseline. 70 Through such flow homogenization, oxygen delivery efficiency is elevated.71,72 An interruption or loss of this phenomenon is thought to result in reduced tissue oxygenation and/or increased susceptibility to ischemia. Hypercapnia-elicited homogenization of microbubble velocities was observed both ipsi- and contralesionally, with lateralization of this effect in the rehabilitated, but not in the control cohort.
Our current study chose young male rats equivalent in age to a young adult human 73 to establish methodology as a foundation for future longitudinal studies. There is a significant need for sex-based studies in the chronic post-stroke recovery process. It is well established that females have additional risk factors such as pregnancy and hormonal changes.74,75 Females are polymorphic across their aging process in the type of stroke and subsequent outcome, 76 and present larger strokes with greater inflammatory responses, when the neuroprotective effects are diminishing due to declining circulating estrogen. 74 Using mature peri-menopausal female rats, we previously demonstrated a significant decrease in peri-lesional cerebral blood flow with CASL-MRI, reduced peri-lesional neuronal activity, and reduced neuronal power of theta:low gamma electrophysiological recordings in ovariectomized versus intact females. 77 The clear link between neurovascular function with circulating estrogen regulating ischemic damage and recovery, supports the need for novel sex-based therapies in the chronic post-stroke recovery period. This necessitates well designed, age-matched, and physiologically relevant male versus female studies throughout all stages of life. 78
Results from this study demonstrate the utility of micro-ultrasound in studying ischemia- and rehabilitation-induced effects in rodent models of recovery from ischemic stroke. Our findings support a lasting effect of ischemic stroke on the brain vasculature despite significant recovery of the sensorimotor function, up to 90% of pre-stroke baseline by the endpoint of this study. Ipsilesional cortical penetrating vessels’ tortuosity of the rehabilitated animals remained elevated when compared to their contralesional levels. Moreover, functional reactivity to hypercapnia, assessed here via quantification of microbbuble velocities in cortical penetrating vessels, was abolished post stroke. Although spontaneous neuronal activity could not be distinguished between perilesional and contralesional cortex at 3 weeks post the ischemic insult for the control cohort, ipsi-to-contralesional neuronal power was significantly elevated in the theta, alpha and beta bands in the rehabilitated cohort. Rehabilitation was also associated with lateralization in the level of normocapnic cortical penetrating vessel velocities and the level of hypercapnia-induced flow homogenization (with increased ipsi- vs contralesional vessel velocities and increased homogenization ipsi- vs. contra-lesionally) as well as strong trends toward reinstatement of functional reactivity of cortical microvessels both ipsi- and contralesionally. Our multimodal assessment thus revealed neurophysiological correlates of sustained pathology (cerebrovascular dysmorphology and dysfunction), and treatment-elicited changes in neuronal and vascular function in the rehabilitated cohort. Sustained cerebrovascular dysmorphology and dysfunction metrics based on micro-ultrasound may be highly valuable for defining long term susceptibility of the brain to later pathologies. Moreover, as rehabilitation on its own rarely produces a full recovery, sensitive means of quantifying the brain state alterations in the chronic stage post stroke are key for developing more effective combinatorial treatments for stroke recovery.
Supplemental Material
sj-pdf-1-jcb-10.1177_0271678X231215004 - Supplemental material for Micro-ultrasound based characterization of cerebrovasculature following focal ischemic stroke and upon short-term rehabilitation
Supplemental material, sj-pdf-1-jcb-10.1177_0271678X231215004 for Micro-ultrasound based characterization of cerebrovasculature following focal ischemic stroke and upon short-term rehabilitation by Johnson Yu, Illsung L Joo, Paolo Bazzigaluppi, Margaret M Koletar, Emmanuel Cherin, Andrew G Stanisz, James WC Graham, Christine Demore and Bojana Stefanovic in Journal of Cerebral Blood Flow & Metabolism
Footnotes
Funding
The author(s) disclosed receipt of the following financial support for the research, authorship, and/or publication of this article: This study had funding support from CCNA (163902), NIH (1R01AG057665-01A1), CIHR (PJT175077 & PJT148521), and CIHR (FDN148367).
Declaration of conflicting interests
The author(s) declared no potential conflicts of interest with respect to the research, authorship, and/or publication of this article.
Authors’ contributions
Supplementary material
Supplemental material for this article is available online.
References
Supplementary Material
Please find the following supplemental material available below.
For Open Access articles published under a Creative Commons License, all supplemental material carries the same license as the article it is associated with.
For non-Open Access articles published, all supplemental material carries a non-exclusive license, and permission requests for re-use of supplemental material or any part of supplemental material shall be sent directly to the copyright owner as specified in the copyright notice associated with the article.