
Abstract
Unfavorable venous outflow (VO) is associated with cerebral edema, which represents microvascular dysfunction. This study estimated the relationship between VO and microvascular function in acute ischemic stroke patients. We retrospectively included 102 MCA/ICA occluded patients with anterior circulation infarction who underwent reperfusion therapy between July 2017 and April 2022. Unfavorable VO was defined as a cortical vein opacification score of 0–3 and favorable VO as that of 4–6. The clinical characteristics, collateral status, microvascular integrity, and outcomes were compared between patients with favorable and unfavorable VO. Multivariate analysis and receiver operator characteristic (ROC) analysis were used. The patients with unfavorable VO had higher extravascular-extracellular volume fraction (Ve) in the infarct core and a lower percentage of robust arterial collateral circulation. ROC analysis revealed that Ve in the infarct core predicts unfavorable VO (AUC = 0.67, sensitivity = 65.08%, specificity = 69.23%). The higher Ve in the infarct core (odds ratio = 1.011, 95% CI = 1.000–1.021, P = 0.046) and poor arterial collateral flow (odds ratio = 0.102, 95% CI = 0.032–0.327, P < 0.001) were independent predictors of unfavorable VO. This suggests that microvascular dysfunction may be one of the mechanisms underlying impaired VO.
Introduction
In patients with acute ischemic stroke due to large-vessel occlusion (AIS-LVO) in the anterior circulation, mechanical thrombectomy is the standard treatment in the acute phase. 1 Good delivery of blood flow to the ischemic brain estimated by arterial collateral flow measurement may be hindered by poor filling of the cortical veins that drain the tissue. 2 Unfavorable venous outflow (VO) profiles are independently associated with poor functional outcomes, despite successful vessel reperfusion.3,4 Recent studies shed more light on the concept of VO,4–8 which may adequately reflect both arterial collaterals and tissue-level collaterals (TLCs) as it represents the final component of the collateral cascade after blood has permeated the brain tissue. 9 VO can also predict functional outcomes and cerebral edema regardless of arterial collateral status.6,7
The estimation of VO presents a novel approach to reflect the complex dynamics of arterial and venous microcirculation. The in-flow of arterial blood to the brain tissue, together with its outflow into the cerebral veins, modulates cerebral microvascular perfusion.10,11 VO correlates with arterial collaterals, TLC, after-treatment edema, early neurological improvement (ENI), and functional outcomes after thrombectomy treatment.4,7,12,13 The pathophysiologic mechanism underlying poor VO in ischemic stroke patients has many contributing factors, but these are still not clear. Unfavorable VO is proven to be linked to cerebral edema and reperfusion hemorrhage, which is associated with microvascular dysfunction.5,7,14 The microvascular dysfunction can hamper local tissue perfusion; 11 however, whether this is one of the mechanisms of poor VO is obscure.
The microvascular function can be measured using contrast-enhanced computed tomography (CT) and magnetic resonance imaging (MRI) through contrast extravasation in the microcirculation. 15 Comparatively, CT perfusion (CTP) takes priority because it can be routinely obtained on admission. To the best of our knowledge, there is still no data on the relationship between VO and microvascular function. We aimed to investigate the association between VO and microvascular function in AIS-LVO patients with reperfusion therapy.
Materials and methods
Study population
This retrospective study was approved by the Institutional Review Board of the First Affiliated Hospital of Sun Yat-sen University (no. [2020]332), and the requirement for written informed consent was waived. It was conducted in accordance with the ethical guidelines of the local ethics committees and the Declaration of Helsinki. We retrospectively included MCA-/ICA-occluded AIS patients with anterior circulation infarction who underwent reperfusion therapy between July 2017 and April 2022. Inclusion criteria were: (1) one-stop CTP imaging at our comprehensive stroke center prior to thrombolysis and/or thrombectomy; (2) cerebral infarction of the anterior circulation proved by follow-up CT or diffusion-weighted imaging (DWI) defined in accordance with the AIS characteristics as an acute episode of focal dysfunction of the brain or retina lasting longer than 24 h, or for any duration if CT, MRI, or autopsy shows focal infarction relevant to the symptoms; 16 (3) and MCA or ICA occlusion. Exclusion criteria were as follows: (1) lacking or incomplete clinical/imaging data, (2) inability to access data to analyse, or (3) poor perfusion imaging quality.
Baseline characteristics
Clinical data such as age, gender, National Institutes of Health Stroke Scale (NIHSS) at baseline and hospital discharge, medical history, imaging modality (CT or MRI), CTP time to onset, intravenous-thrombolysis administration, the existence of large artery occlusion, modified Rankin scale (mRS) score at hospital discharge, and hemorrhage transformation (HT) were obtained from the electronic medical records. mRS scores at 90 days after discharge were recorded in the follow-up period. We also selected data on vascular risk factors such as hypertension, hypercholesterolemia, diabetes mellitus (DM), cigarette smoking, and alcohol drinking. Hypertension was defined as either a systolic blood pressure ≥140 mmHg, a diastolic pressure ≥90 mmHg, a history of hypertension, or anti-hypertensive drug treatment. DM was determined either using a 75 g oral glucose tolerance test or as an HbA1c ≥6.0%, a medical history of diabetes, or drug treatment. Dyslipidemia was defined as a level of cholesterol >5.7 mmol/L, triglyceride >1.7 mmol/L, low-density lipoprotein (LDL) >3.62 mmol/L, high-density lipoprotein (HDL) <1.03 mmol/L, a history of hypercholesterolemia, or drug treatment. Stroke subtypes were classified according to the Trial of Org 10172 in Acute Stroke Treatment (TOAST) criteria into large artery atherosclerosis (LAA), small vessel occlusion, cardiac embolism (CE), a stroke of other determined etiology (SOE), and stroke of undetermined etiology (SUE). 17 Reperfusion status after treatment was assessed using the modified thrombolysis in cerebral infarction (mTICI) scores. Successful vessel reperfusion was defined as an mTICI of 2b-3. The mRS score is a seven-point scale ranging from 0 (no symptoms) to 6 (dead). A score of 2 or less is indicative of the functional independence of the patient. 18
One-stop CTP acquisition and post-processing protocol
One-stop CTP was obtained via a 640-slice multidetector CT scanner (Aquilion One; Canon Medical Systems Corporation). Then whole-brain volumetric CTP was acquired after excluding cerebral hemorrhage. Nineteen scan volumes, each containing 320 slices with a resolution of 0.5 mm, were obtained with a 7-s delay and between 2 and 5 s apart over a period of 60 s. Iopromide (50 mL; Ultravist 370; Bayer Schering Pharma) was injected at a rate of 5 mL/s. The tube voltage peak was 80 kVp, and the exposure was 150 mAs, yielding an average effective dose of 5.25 mSv.
Ischemic core and penumbra area measurements were conducted using automated analysis with commercial software (Olea Sphere, Olea Medical). For CTP processing, the samples were sphered down to a slice thickness of 5 mm for noise reduction. Sphere (3.0-SP26) analysis identified the ischemic core as a tissue with a relative cerebral blood flow (CBF) of <25% and a time to peak (TTP) difference of >5 s and penumbra as a tissue with a TTP difference of >5 s between the bilateral cerebral hemispheres. Additionally, the CBF, cerebral blood volume (CBV), and the volume of Tmax delay of >6 s or 10 s were recorded. All of the evaluations and grading scores were performed by two experienced radiologists who were blinded to the patient history and the follow-up images.
Evaluation of cerebral infarction
Final infarct volume (FIV)
FIV was acquired based on manual segmentation of follow-up non-contrast CT (NCCT) images (n = 60) or follow-up DWI (n = 42) acquired within a period of 48–72 h after the patients’ admission and treatment.
Infarct growth volume
Ischemic core and penumbra area measurements and segmentations were conducted using an automated analysis with commercial software (Olea Sphere, Olea Medical). The Alberta Stroke Program Early CT Score (ASPECTS) was determined on NCCT. 19 The infarct growth volume was defined as the difference between the FIV and the ischemic core volume derived from CTP.
Arterial collaterals
The arterial collateral filling was rated using a previously published method. 20 The angiography generates time-resolved images of pial arteries. The pial arterial filling was scored based on a six-point scale. The collaterals were dichotomized into robust (score of 4–5) or poor (score of 0–3). 20
Venous opacification
VO was determined by the vein opacification score (COVES), and it was scored on a six-point scale for the vein of Labbé, sphenoparietal sinus, and superficial middle cerebral vein. 4 The COVES was graded per vein with baseline CT venography of CTP by using a three-point scale, as follows: 0, a complete absence of cortical vein opacification; 1, defined as approximately half the attenuation of one of the target veins on the contralateral side; and 2, full opacification. The sum of the grades for all three veins of the affected hemisphere was calculated, and these values were in the range of 0–6.
As for the selection criteria and clinical characteristics of patients in our study, we utilized a strategy different from that of the other studies to avoid dichotomization bias, and hence, we chose the cut-off based on the interaction between COVES and the outcome. The interaction between COVES, mRS score at hospital discharge, and NIHSS score at hospital discharge were tested using the full range of 0–6 and different dichotomous cut-off values (grade 0 vs. grade >0; grade 0–1 vs. grade >1; grade 0–2 vs. grade >2; and grade 0–3 vs. grade >3). No dichotomization was performed for higher cut-off values due to the possibility of anatomic variations. 4
Tissue-level collateral
TLC was determined by the hypoperfusion intensity ratio (HIR), which is the volume of ischemic brain tissue with a time to the maximum of the tissue residue function (Tmax) delay of >10 s divided by the volume of brain tissue with a Tmax delay of >6 s.21,22 Favorable TLC was defined as an HIR of ≤0.4, and poor TLC was defined as an HIR of >0.4.22
Measurement of microvascular integrity
Perfusion CT data were post-processed into blood-brain barrier permeability (BBBP) parameters (volume transfer constant [Ktrans], extravascular-extracellular volume fraction [Ve], reflux constant [Kep], and plasma volume fraction [Vp]) offline using commercially available CTP software (Olea Sphere, Olea Medical) based on previously published recommendations and guidelines. Kep and Ktrans are viewed as the primary BBBP parameters, while Ve and Vp are descriptive of the hemodynamic conditions on the intervascular and extracellular side of the BBB. Ktrans represents the volume transfer constant from the blood plasma to the EES. Kep is found to be inversely related to the BBBP. 23 Ve reflects the volume of extravascular-extracellular space (EES) per unit volume of tissue in the microcirculation and depicts the hemodynamic conditions on the EES of the BBB. Vp represents the plasmatic volume per unit of tissue volume. 23 Besides, the mean value of Wash-in and Wash-out derived from the permeability model was also recorded.
Statistical analysis
Normal distribution was assessed using the Shapiro-Wilk test. Continuous variables were compared using Student’s t-test if normally distributed or the Mann–Whitney U test if not normally distributed. Categorical variables were compared using the Chi-squared test or Fisher’s exact test. Covariates selected for multivariate logistic regression were the variables with significant differences between the two groups in the clinical analysis. Multivariate regression analysis was further used to investigate the independent variables. The receiver operating characteristic curve (ROC) analysis was performed to determine the diagnostic value of different parameters in predicting the collateral status. Cohen’s kappa values and proportions of the agreement were calculated to define the level of inter-observer agreement in the scores. The Chi-squared test or Fisher’s exact test was used to compare the interaction between COVES and clinical outcomes. We tested the interaction between COVES and NIHSS at discharge using Mann–Whitney U-test. Statistical significance was set at P < 0.05. All statistical analyses were performed using SPSS (version 22.0; IBM Corp, Armonk, NY, USA).
Results
Patient characteristics
We assessed 345 patients with AIS who received one-stop CTP (cranial CTA CTP plus cervical CTA) before reperfusion therapy (IV thrombolysis alone or combined endovascular thrombectomy) within 24 h of onset. In total, 102 AIS patients were enrolled. The other patients were excluded for the following reasons: 120 patients were excluded due to posterior circulation stroke, 109 due to lack of large artery occlusion, and 14 due to poor image quality (Supplementary file 1). Of the 102 patients, 27 had ICA occlusion, 64 had M1 occlusion, and 11 had M2 occlusion. The distribution of patients based on COVES was as follows: COVES 0, n = 7; COVES 1, n = 16; COVES 2, n = 20; COVES 3, n = 20; COVES 4, n = 13; COVES 5, n = 7; and COVES 6, n = 19. For a COVES of 0–3 (n = 39) versus a COVES greater than 3 (n = 63), the associations with mRS at hospital discharge (P = 0.037) and NIHSS score at hospital discharge (P = 0.018) were significant. Hence, unfavorable VO was defined as a cortical vein opacification score of 0–3 and favorable VO as that of 4–6. There were 39 patients in the favorable VO group and 63 patients in the unfavorable VO group. Inter-rater agreement for VO determination was substantial (kappa = 0.85).
Patients with unfavorable VO had higher baseline NIHSS (median, 12 [IQR, 9–16] vs. 10 [IQR, 5–14]; P = 0.02) and higher NIHSS at hospital discharge (median, 10 [IQR, 2–13] vs. 7 [IQR, 1–11]; P = 0.02) than patients with favorable VO. The number of patients with good outcomes at hospital discharge was smaller in the unfavorable VO group than in the favorable VO group (median, 27 patients [42.85%] vs. 25 patients [64.10%], respectively; P = 0.04). There were no differences in age, gender, medical history, smoking, infarct growth volume, FIV, TOAST subtypes, reperfusion therapy type, good recanalization, good outcomes at 3 months after discharge, and HT between patients with favorable and unfavorable VO (Table 1).
Clinical characteristics of acute ischemic stroke patients.
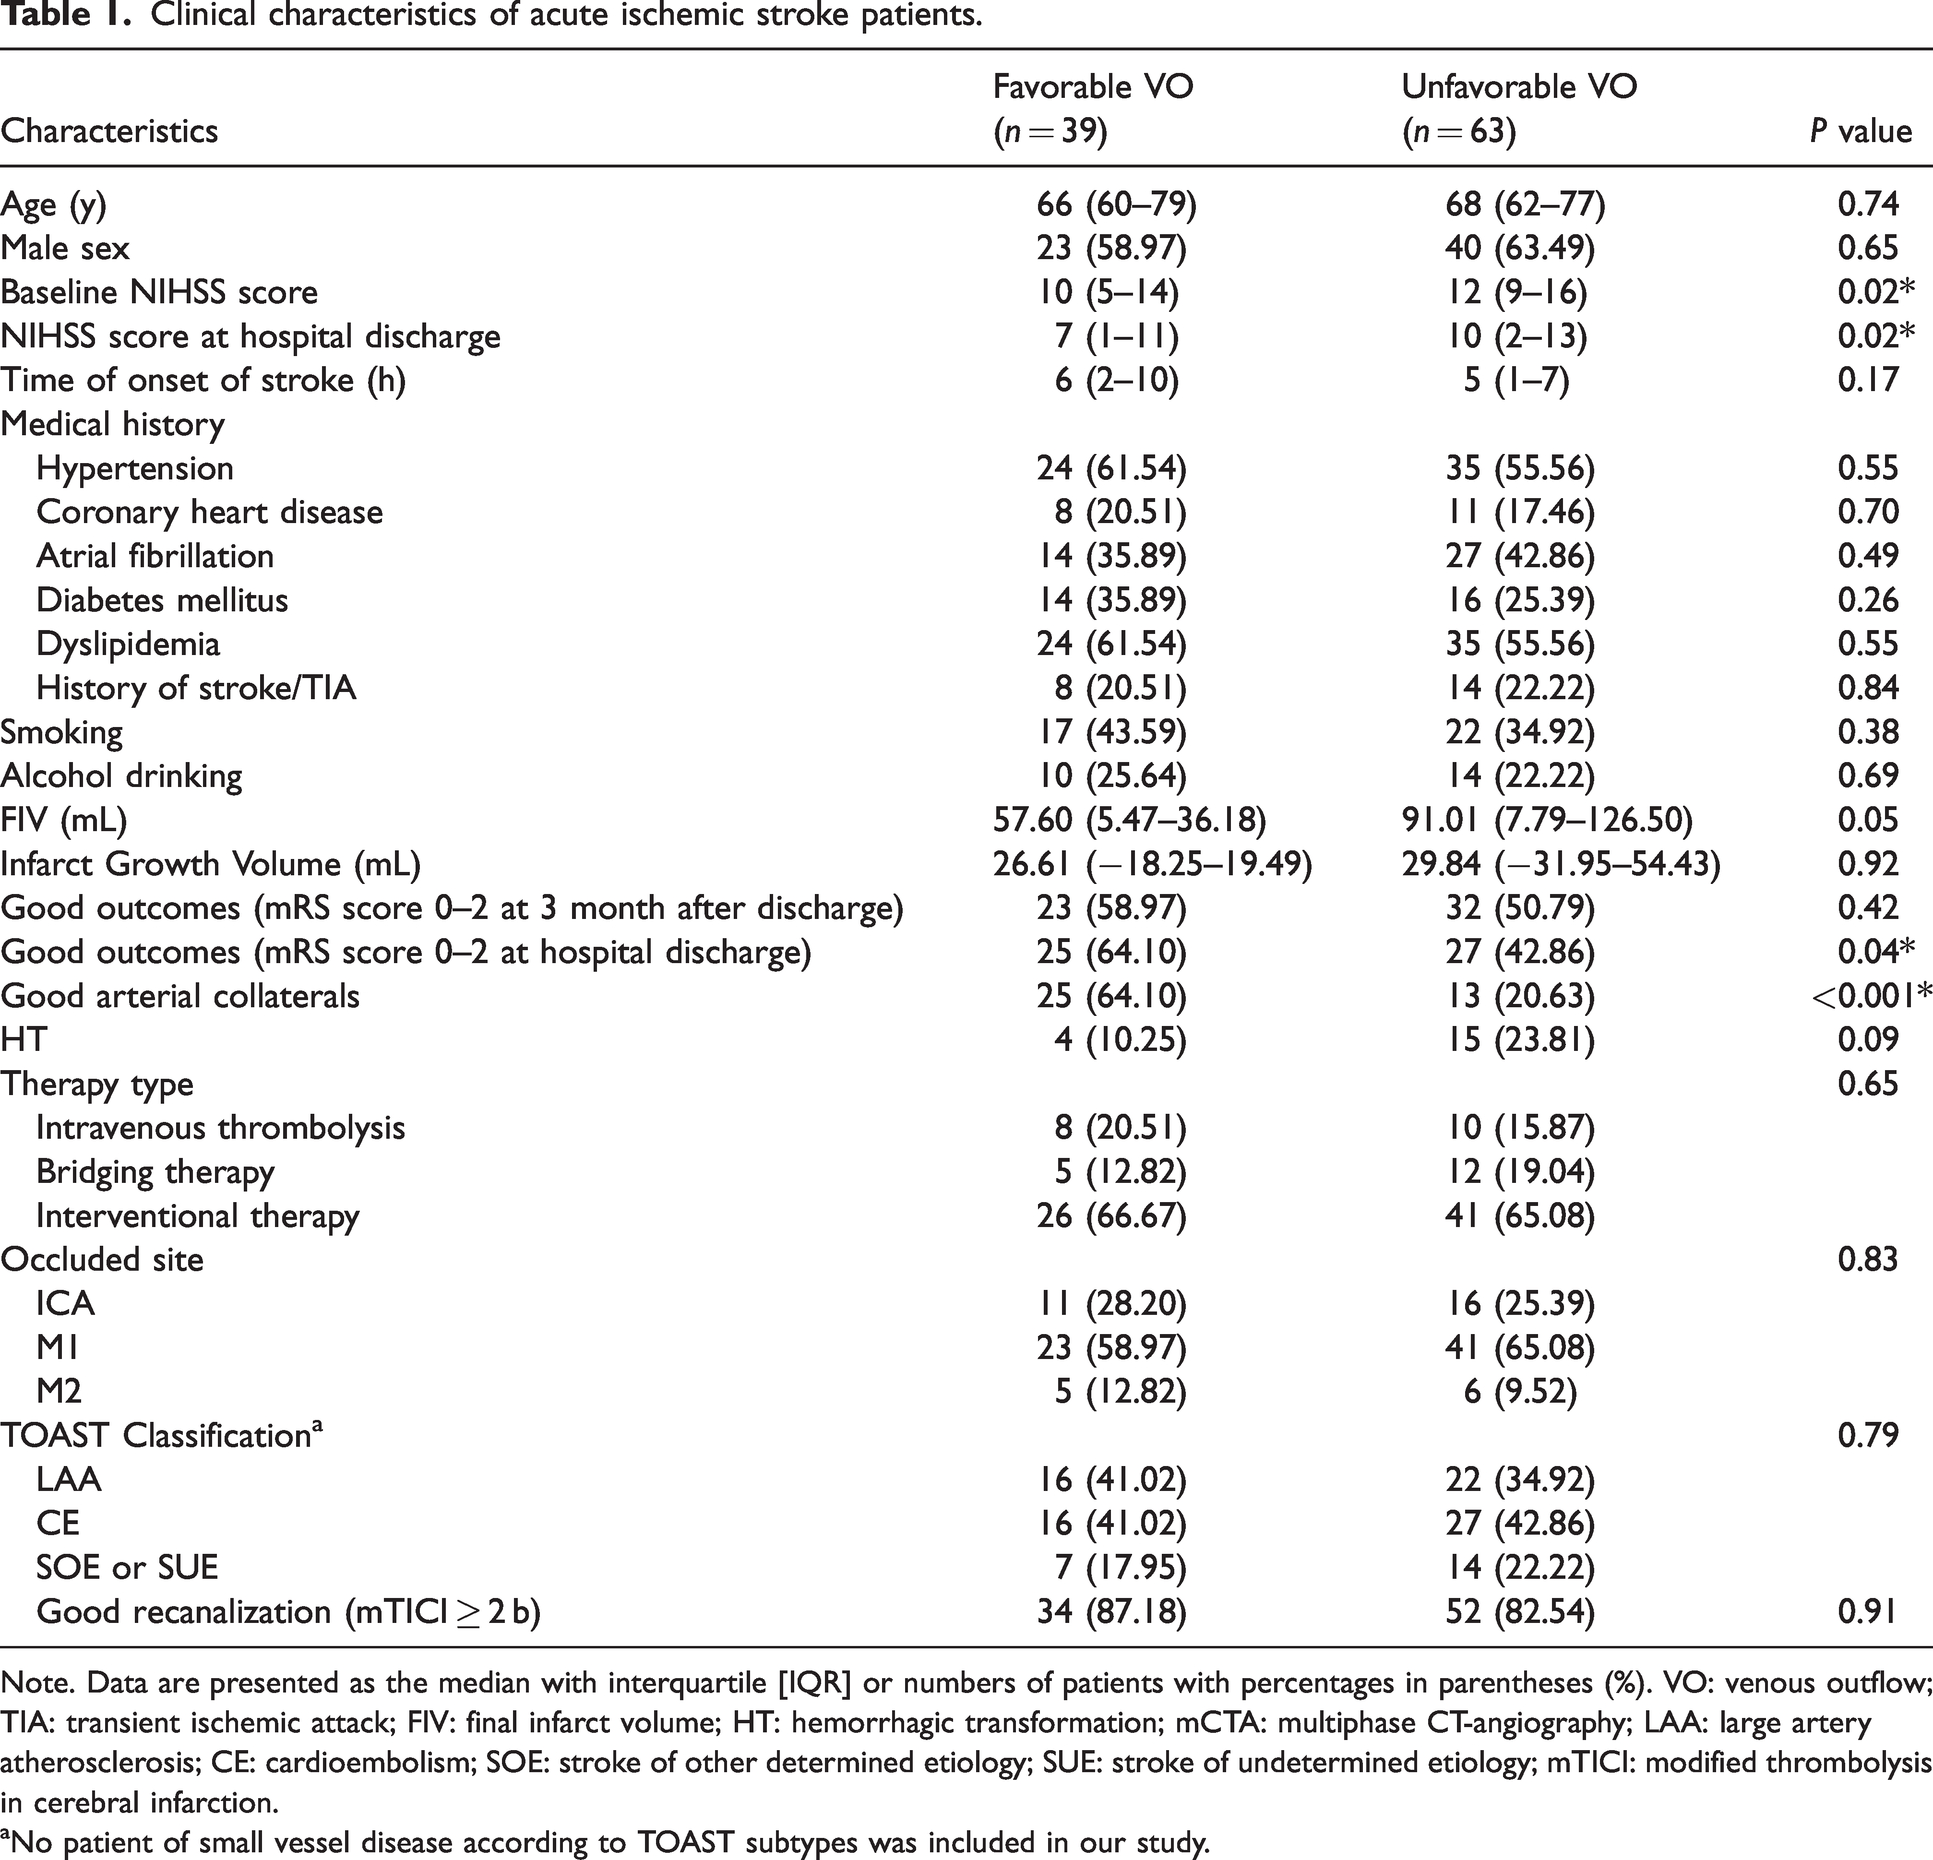
Note. Data are presented as the median with interquartile [IQR] or numbers of patients with percentages in parentheses (%). VO: venous outflow; TIA: transient ischemic attack; FIV: final infarct volume; HT: hemorrhagic transformation; mCTA: multiphase CT-angiography; LAA: large artery atherosclerosis; CE: cardioembolism; SOE: stroke of other determined etiology; SUE: stroke of undetermined etiology; mTICI: modified thrombolysis in cerebral infarction.
aNo patient of small vessel disease according to TOAST subtypes was included in our study.
Imaging characteristics in identifying VO status
mCTA- and CTP-derived metrics in predicting VO status
A lower portion of patients in the unfavorable VO group than that of patients in the favorable VO group had good arterial collaterals (median, 13 patients [20.63%] vs. 25 patients [64.10%]; P < 0.001). Patients with unfavorable VO were found to have larger ischemic core volumes (median, 61.17 mL [IQR, 25.98–92.68 mL] vs. 30.99 mL [IQR, 5.97–52.12 mL]; P = 0.001) and penumbra volumes (median, 139.95 mL [IQR, 94.41–186.28 mL] vs. 88.41 mL [IQR, 33.11–138.04 mL]; P < 0.001) than patients with favorable VO. Patients with unfavorable VO were detected to have a larger volume with respect to Tmax >6 s (median, 218.99 mL [IQR, 169.88–261.87 mL] vs. 161.10 mL [IQR, 89.39–215.91 mL]; P = 0.001) and Tmax >10 s (median, 119.98 mL [IQR, 80.11–149.79 mL] vs. 78.24 mL [IQR, 38.73–111.01 mL]; P = 0.001) than those with favorable VO (Table 2). Figure 1 was an example of the perfusion image including VO status and microvascular integrity merits.
Correlation between Ve in ischemic core area and baseline clinical and imaging features.
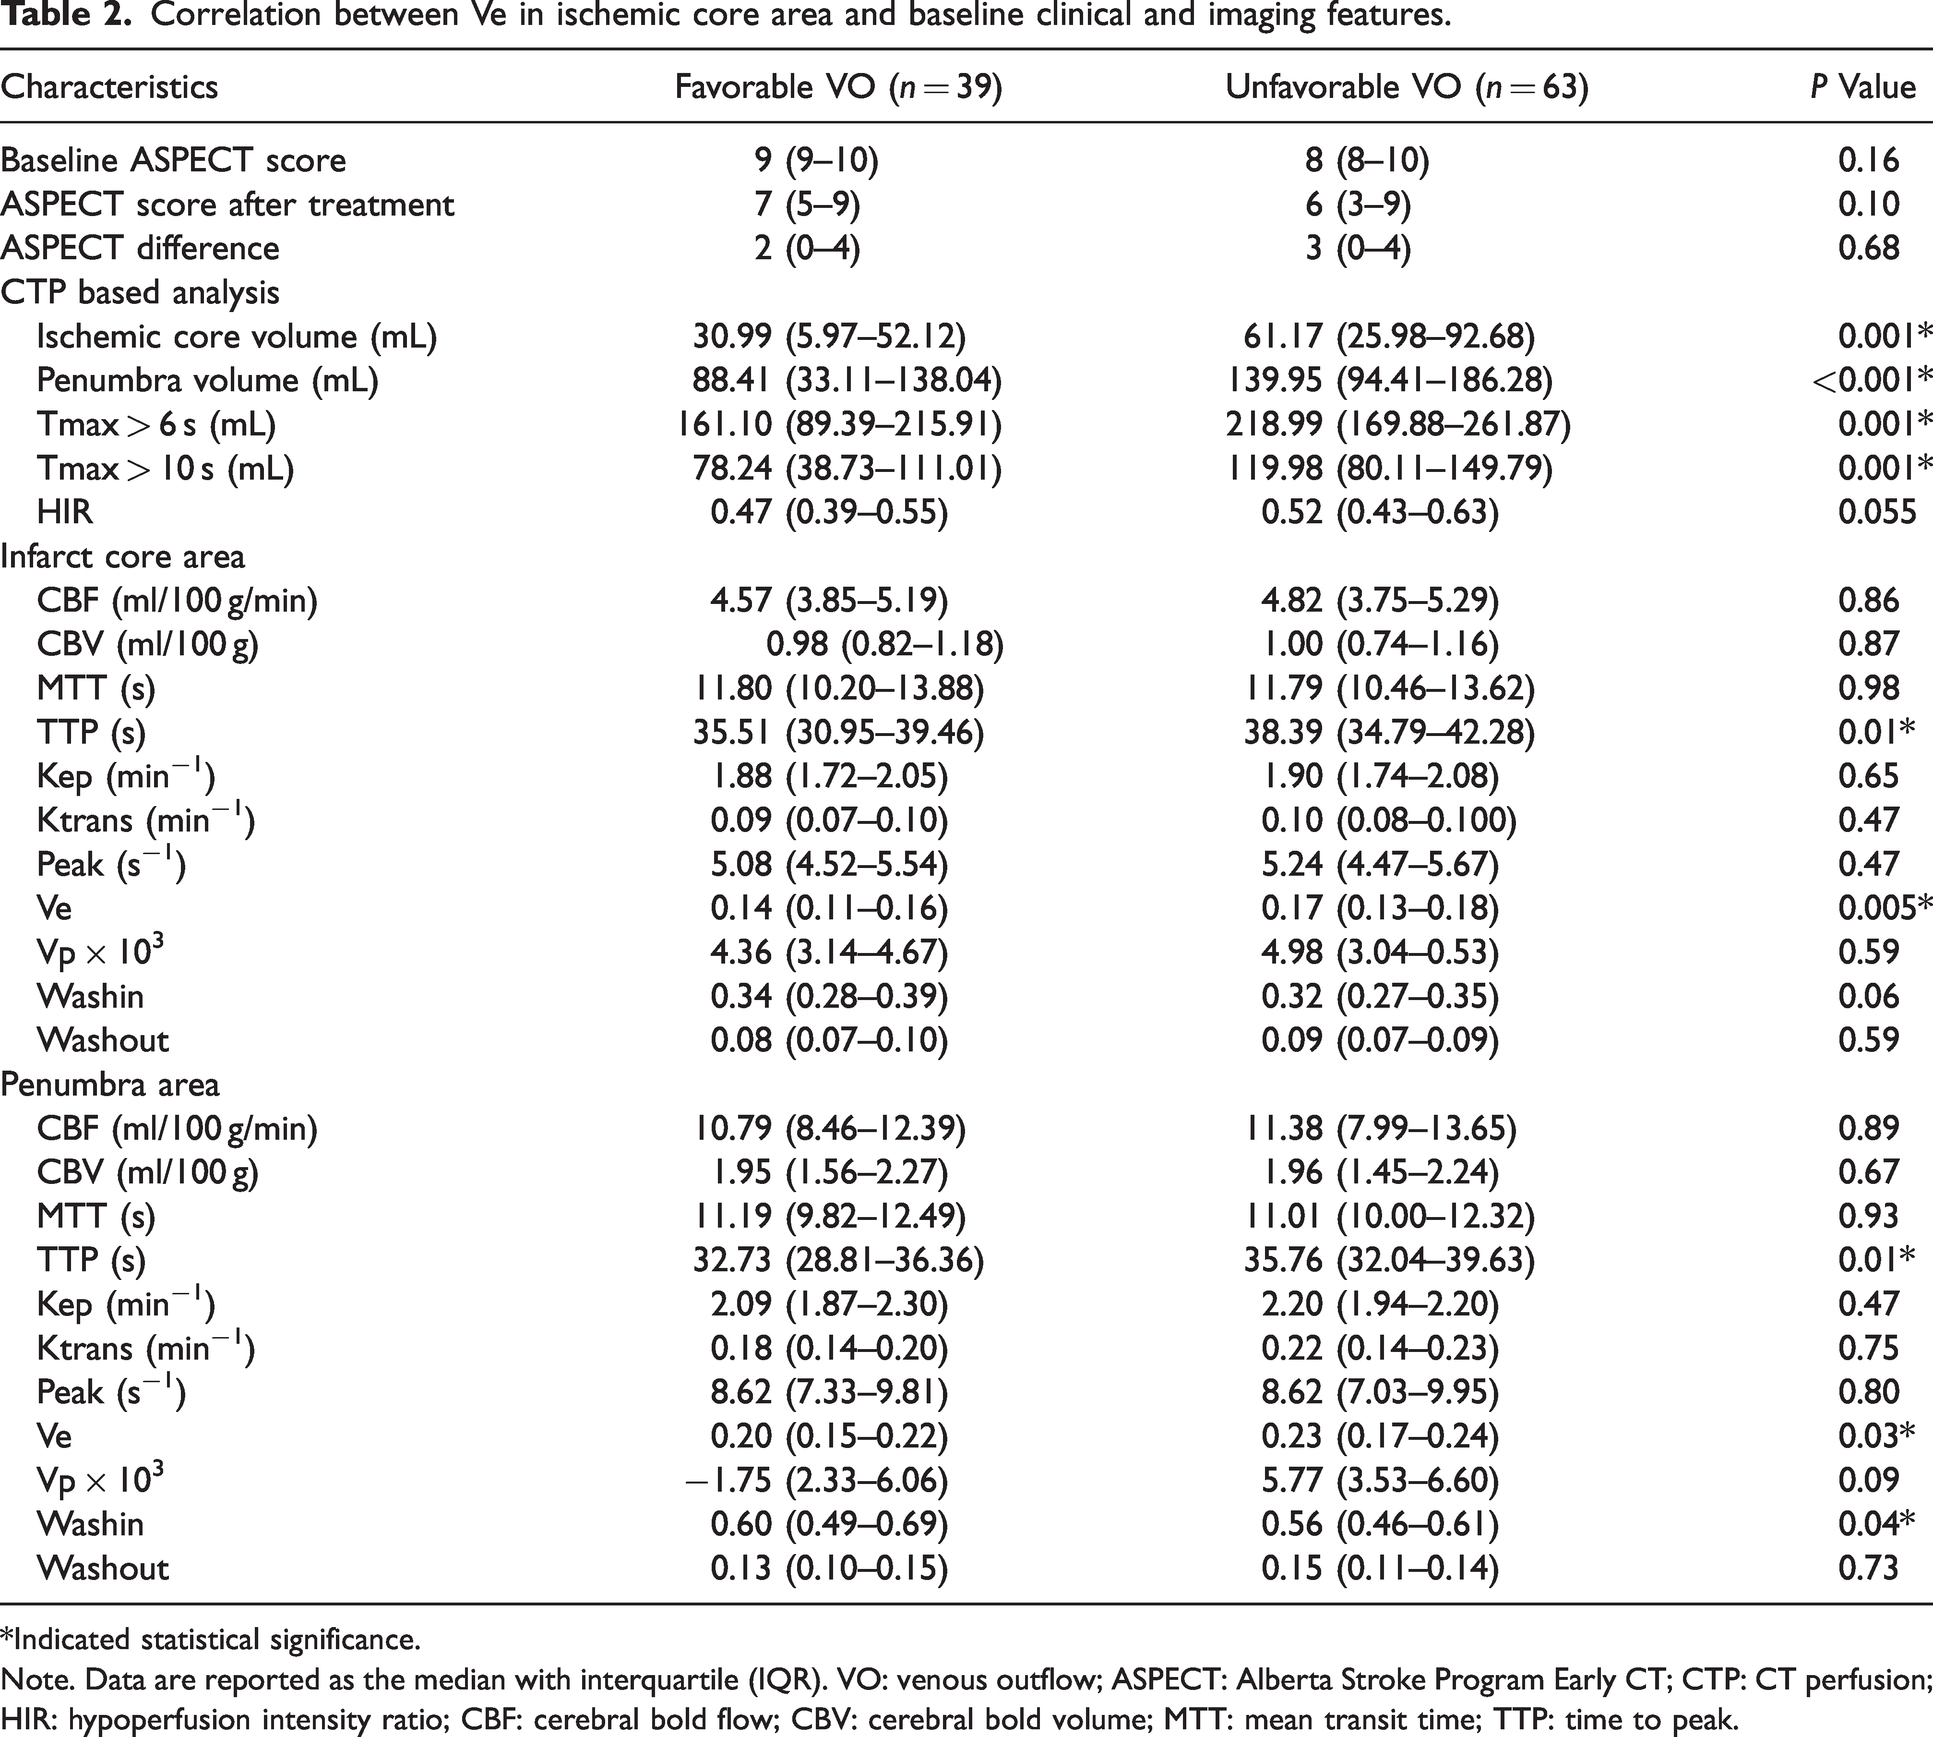
*Indicated statistical significance.Note. Data are reported as the median with interquartile (IQR). VO: venous outflow; ASPECT: Alberta Stroke Program Early CT; CTP: CT perfusion; HIR: hypoperfusion intensity ratio; CBF: cerebral bold flow; CBV: cerebral bold volume; MTT: mean transit time; TTP: time to peak.
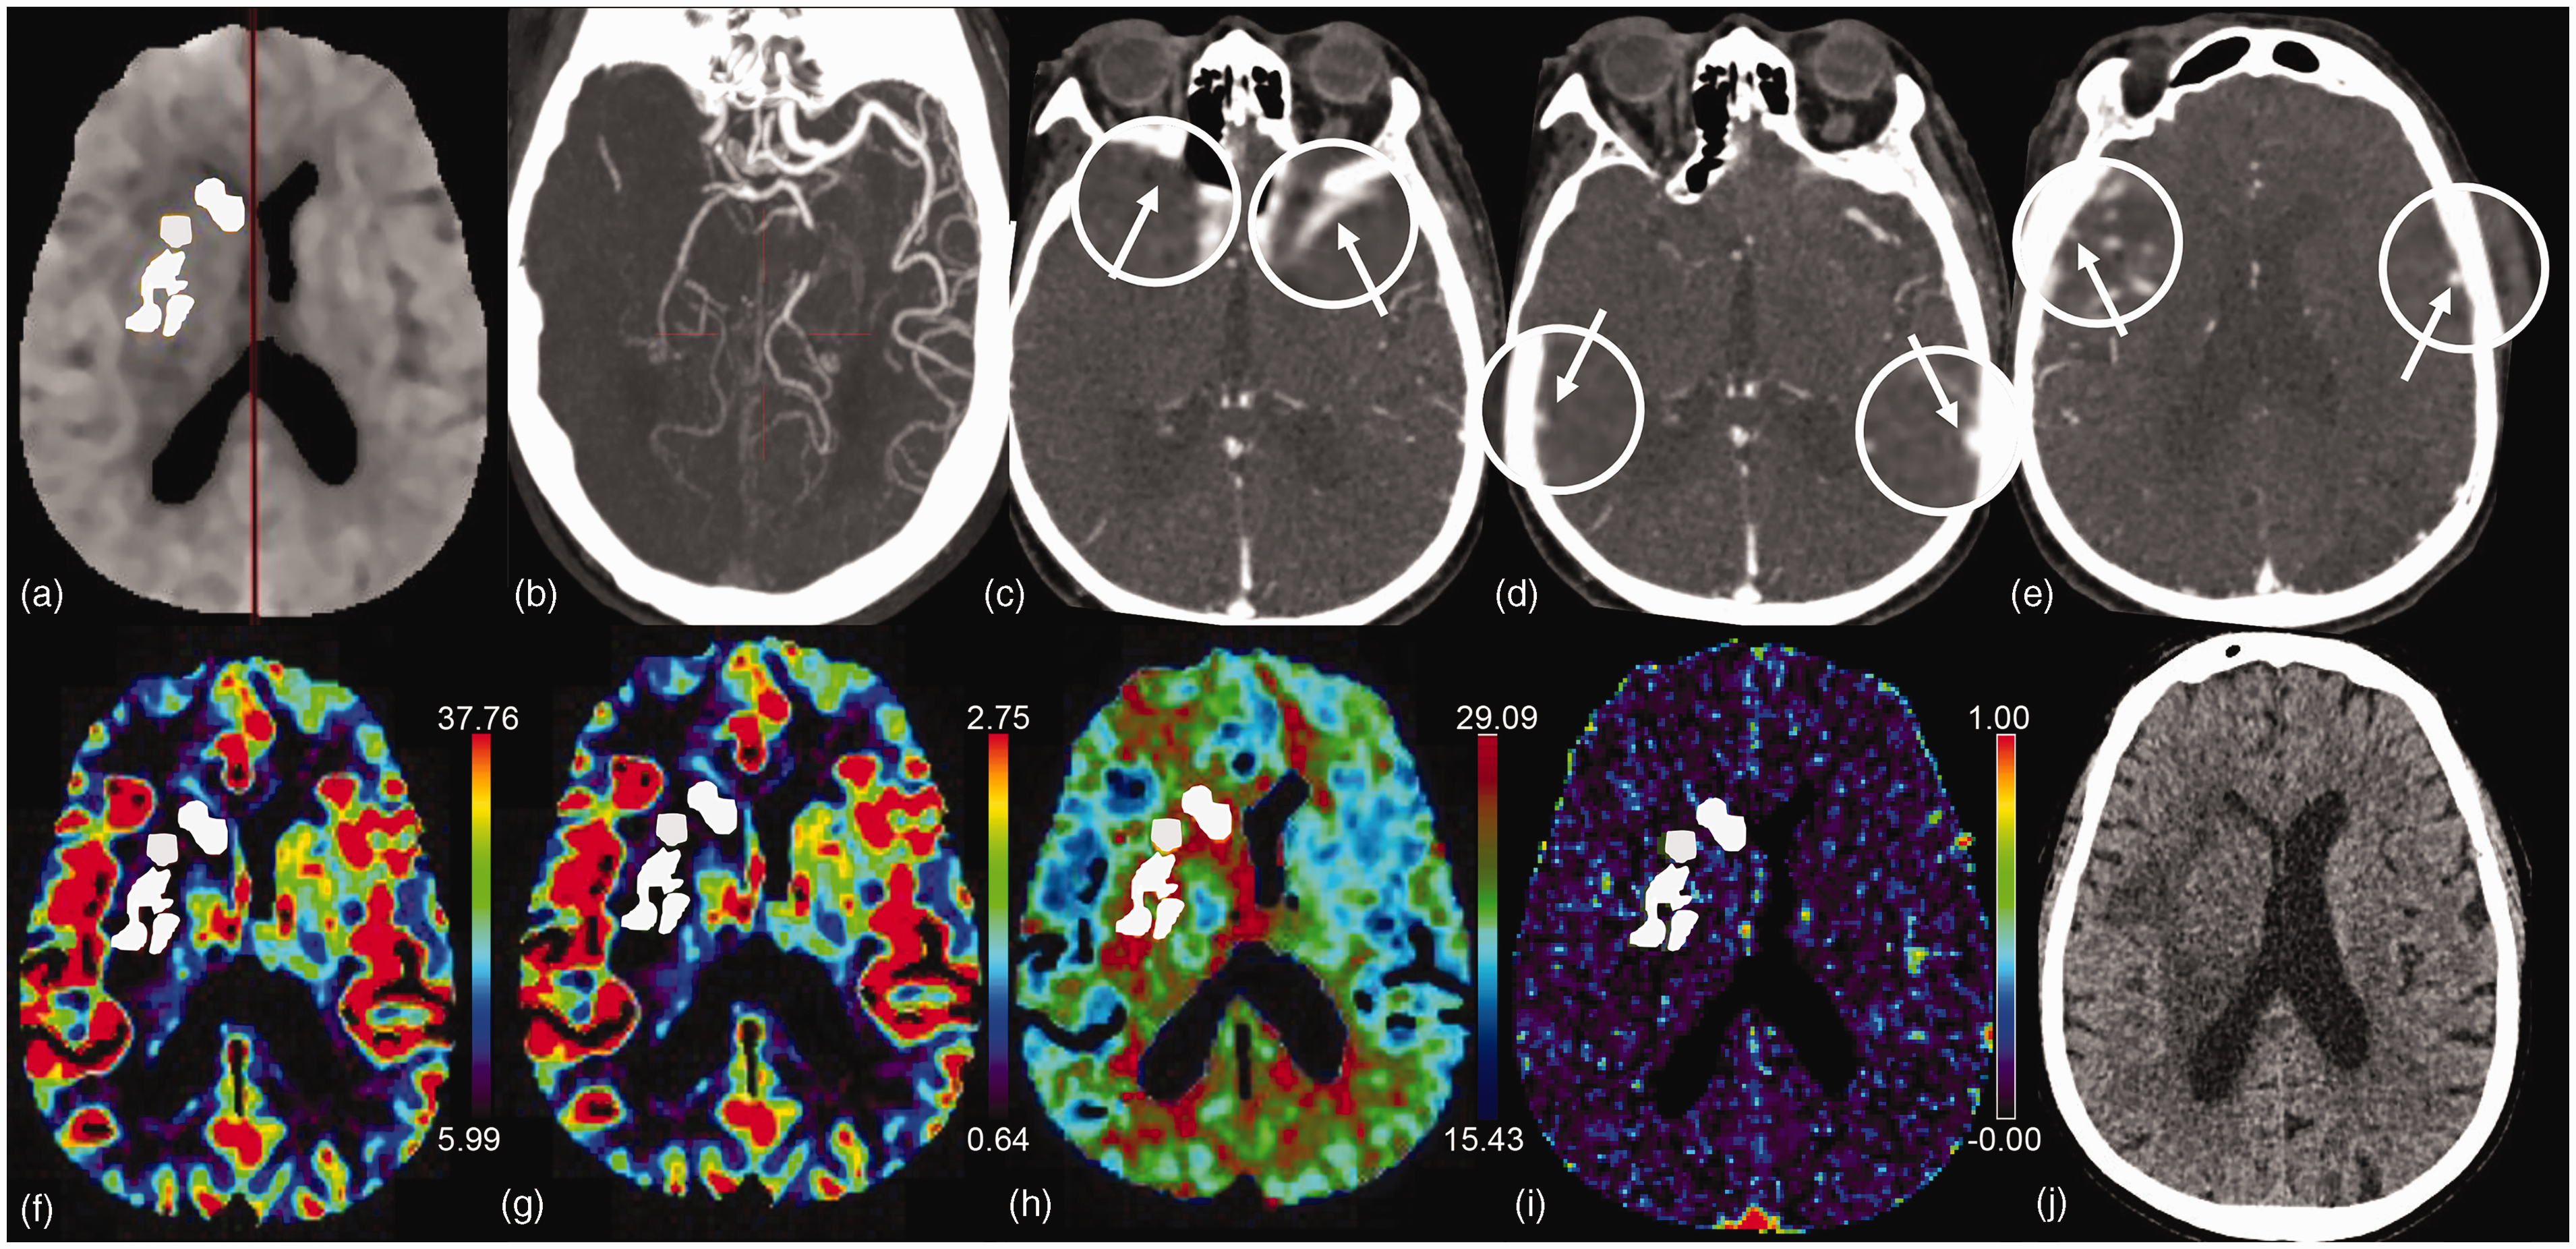
Baseline CT angiography and perfusion images and follow-up CT images in an adult patient with right M1 MCA occlusion. (a) White area presents the ischemic core volume (55.41 mL). (b) Oblique axia maximum intensity projection shows occlusion of the right M1 segment and the mCTA score is 0 suggesting the poor artery collateral status. (c–e): The COVES of this patients is 2 point indicating poor venous outflow: in the affected hemisphere, sphenoparietal sinus is not visible (c), resulting in opacification grade of 0 (white arrow); vein of Labbé (d) and superficial middle cerebral vein (e) both have moderate opacification, with opacification grade of 1 separately (white arrow). (f–i) The CBF, CBV, TTP, and Ve maps: the average value of CBF, CBV, TTP, and Ve in ischemic core area (white area) is 9.64 mL/100 g/min (f), 1.86 mL/100 g (g), 43.39 s (h), and 0.155 (i), respectively and (j) The patient underwent interventional therapy and had a final infarct volume of 99.33 mL at follow-up CT image. The 90-day modified Rankin scale score for this patient was 5.
In the infarct core, TTP was longer in the unfavorable VO group than in the favorable VO group (median, 38.39 s [IQR, 34.79–42.28 s] vs. 35.51 s [IQR, 30.95–39.46 s]; P = 0.01). However, for the penumbra area, patients with unfavorable VO had significantly longer TTP than those with favorable VO (median, 35.76 s [IQR, 32.04–39.63 s] vs. 32.73 s [IQR, 28.81–36.36 s]; P = 0.01) (Table 2).
ROC analysis showed that arterial collateral status had the highest diagnostic value (AUC: 0.72) in predicting AIS with unfavorable VO; the sensitivity, specificity, and cut-off value were 79.37%, 64.10%, and 2, respectively. The ischemic core volume and TTP in the ischemic core area demonstrated the highest specificity (71.79%) and sensitivity (85.71%) in discriminating the VO status, respectively (Figure 2).
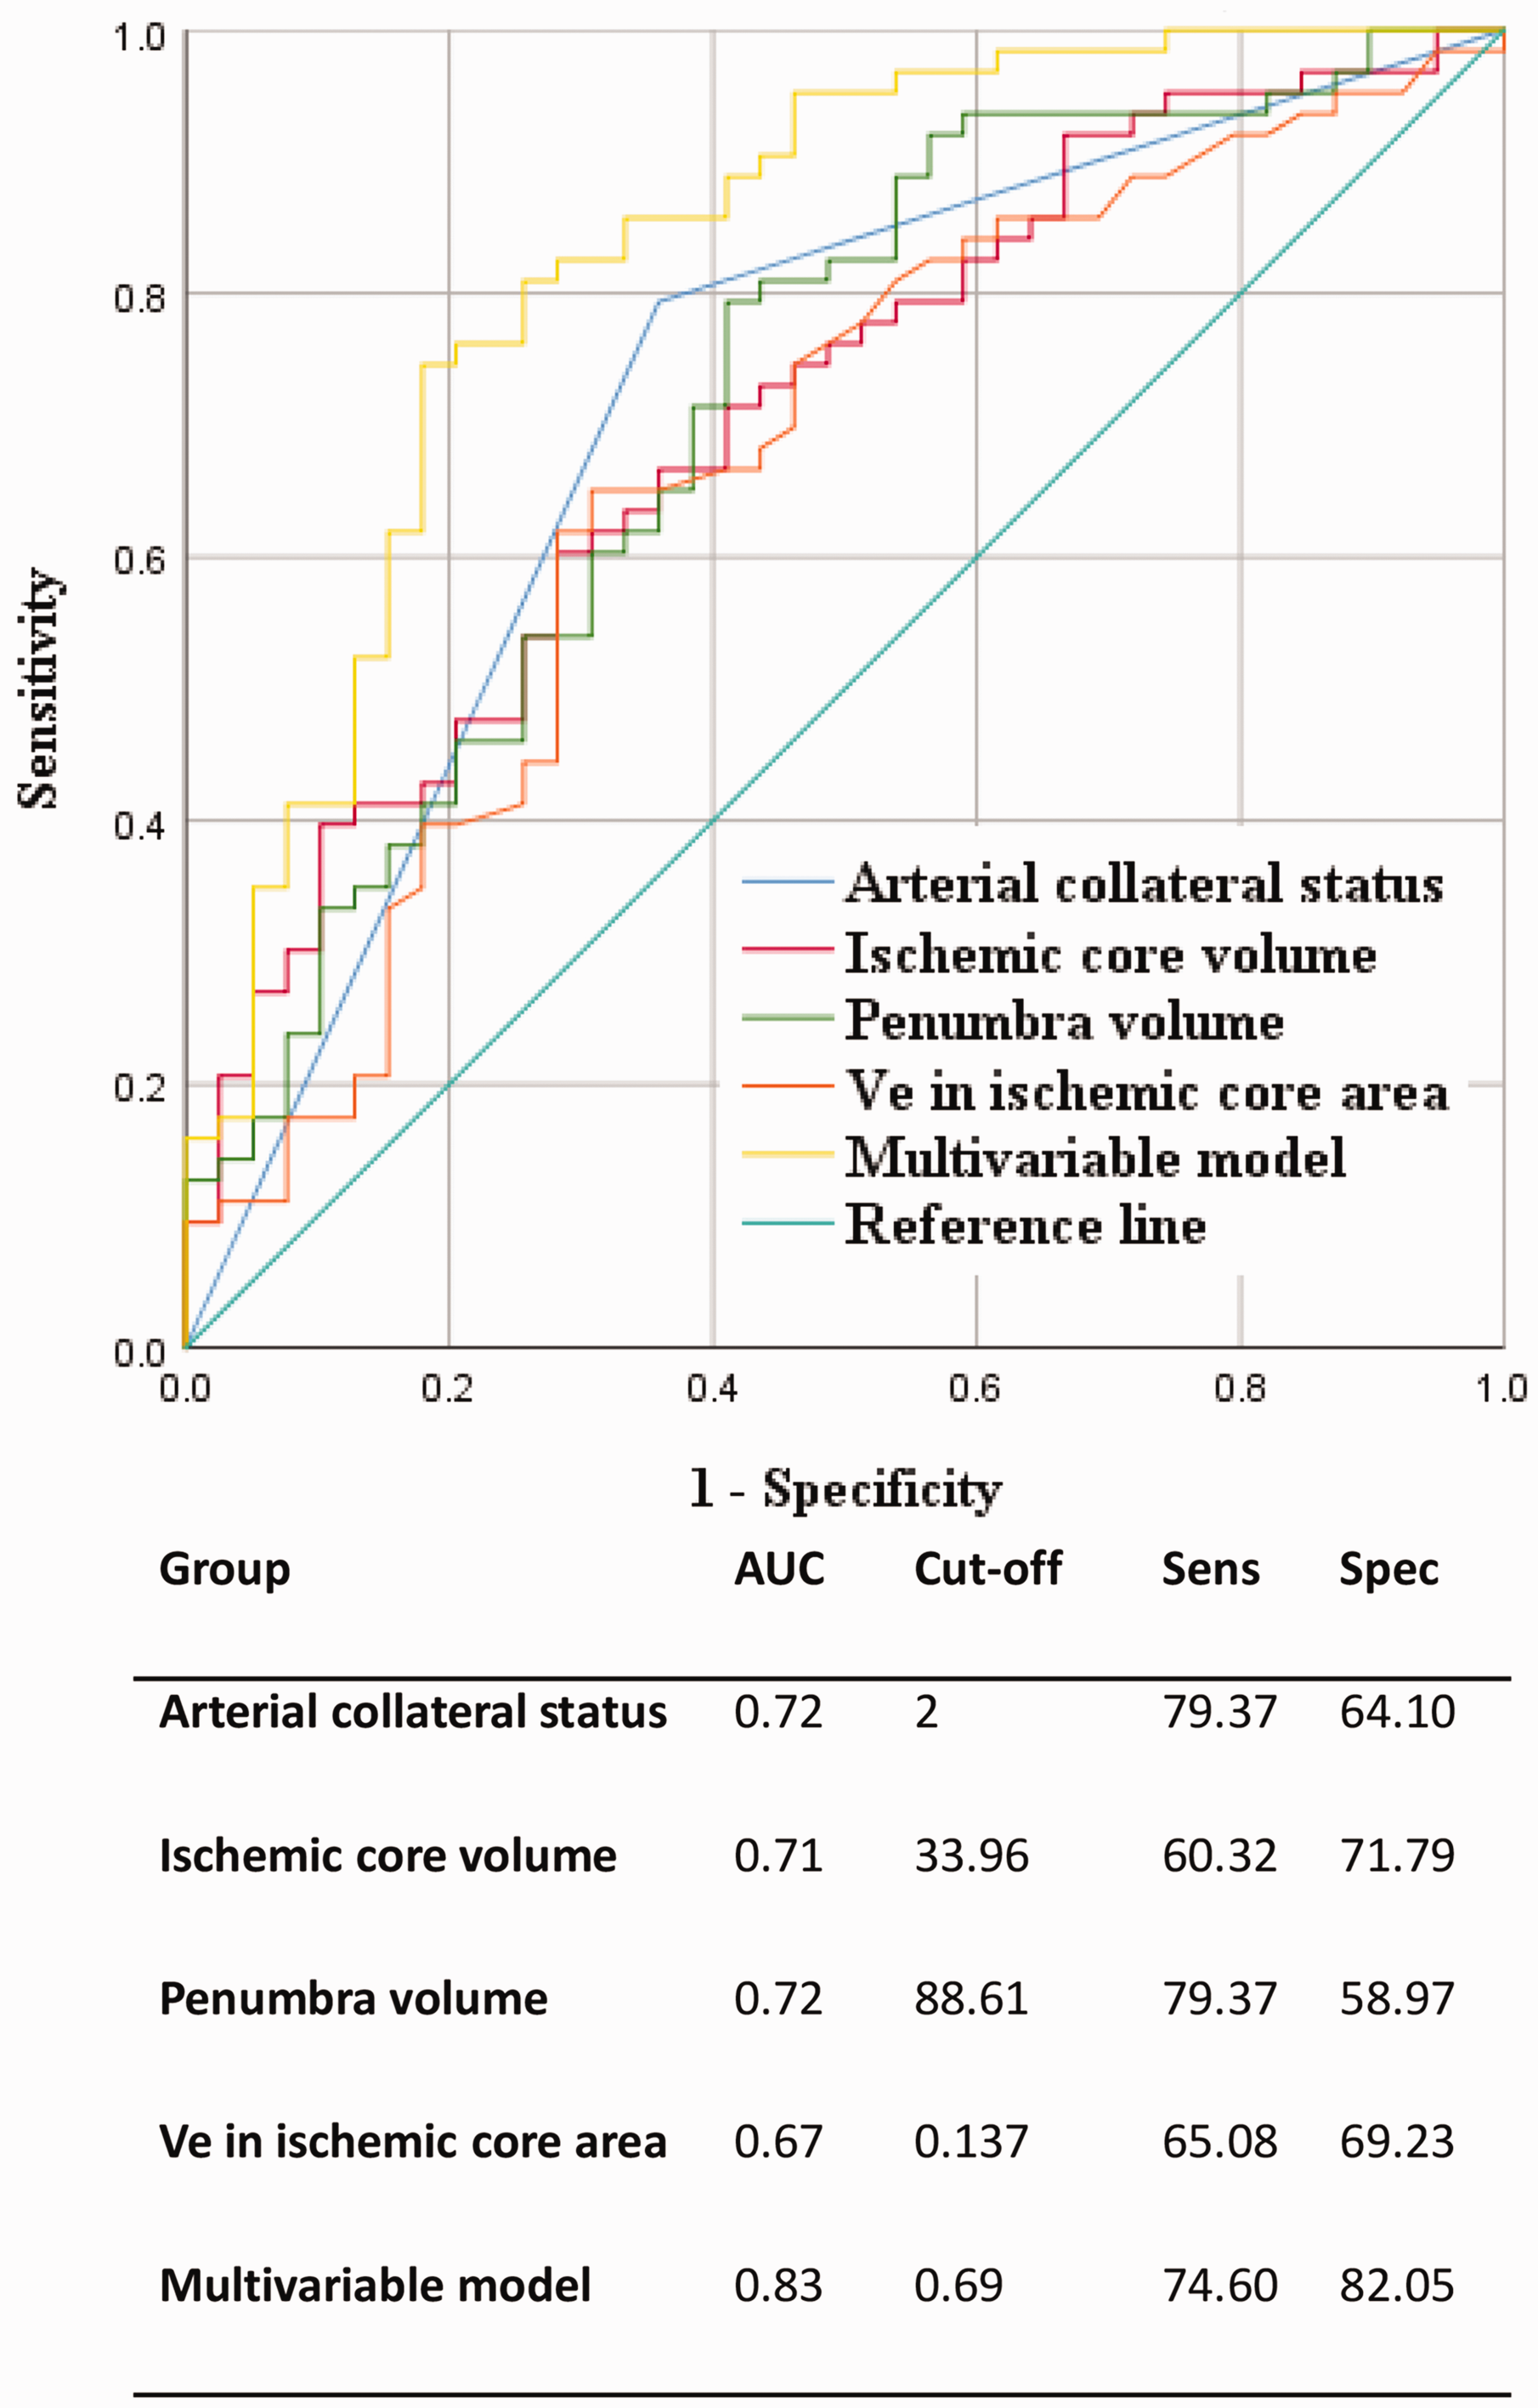
Receiver operating characteristic (ROC) analysis of the image characteristics in predicting the unfavorable venous outflow.
CTP-derived microvascular integrity measures in predicting VO status
In the infarct core, Ve was higher in the unfavorable VO group than in the favorable VO group (median, 0.17 [IQR, 0.13–0.18] vs. 0.14 [IQR, 0.11–0.16]; P = 0.005) (Table 2). In the penumbra area, patients with unfavorable VO had significantly higher Ve (median, 0.23 [IQR, 0.17–0.24] vs. 0.20 [IQR, 0.15–0.22]; P = 0.03) and lower Wash-in (median, 0.56 [IQR, 0.46–0.61] vs. 0.60 [IQR, 0.49–0.69]; P = 0.04) than those with favorable VO. The rest of the brain permeability metrics showed no significant disparity between patients with favorable VO and those with unfavorable VO (Table 2).
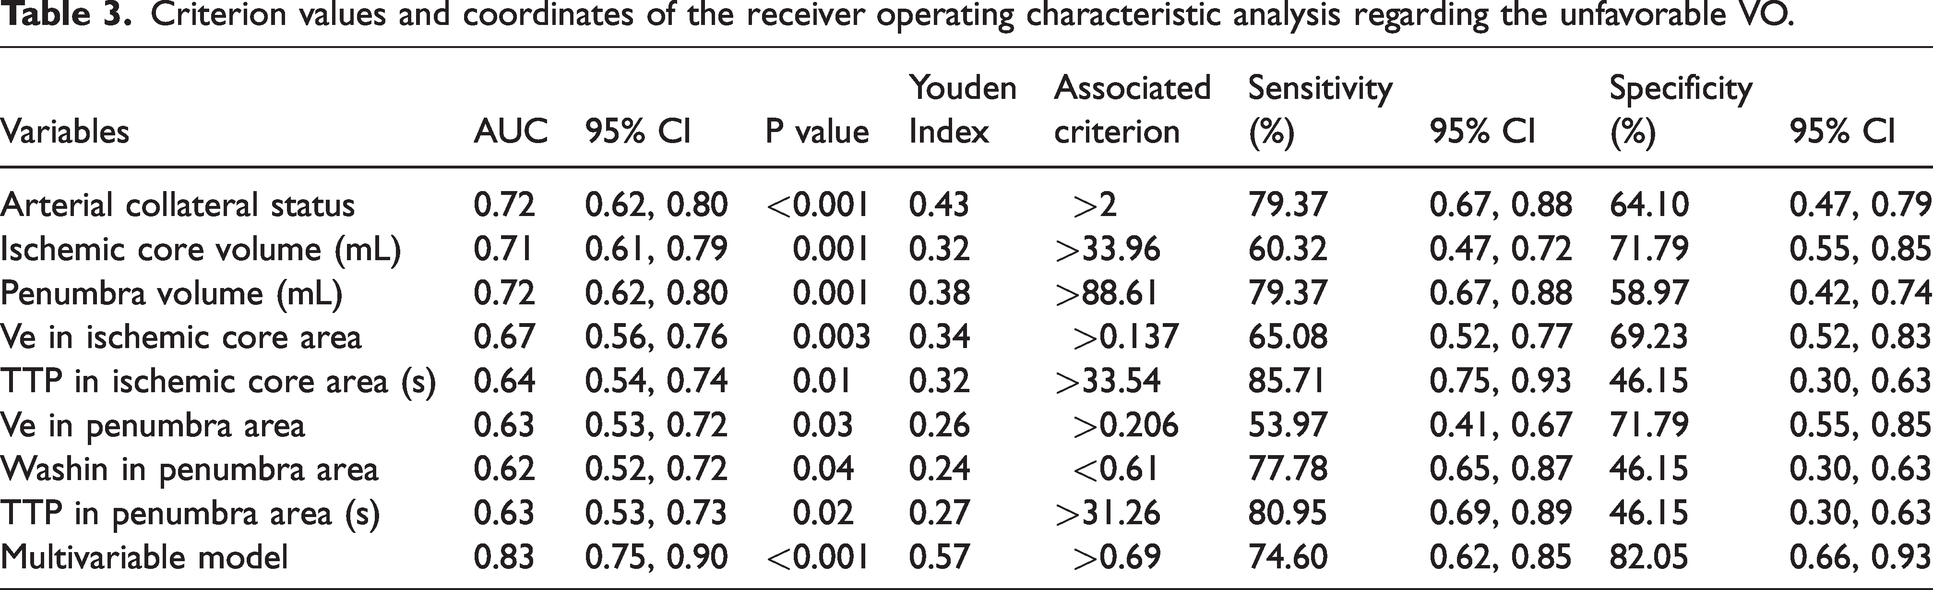
ROC analysis showed that Ve in the ischemic core had a positive diagnostic value (AUC: 0.67) in predicting AIS with unfavorable VO; the sensitivity, specificity, and cut-off value were 65.08%, 69.23%, and 0.137, respectively. Moreover, Ve in the penumbra area had relatively higher specificity (71.79%) in predicting unfavorable VO (Figure 2 and Table 3). The DeLong analysis demonstrated that there were no significant differences between CTP parameters and Ve in the ischemic core that would allow the identification of unfavorable VO (P for comparison ≥0.47).
Criterion values and coordinates of the receiver operating characteristic analysis regarding the unfavorable VO.
Multivariate assessment of CTP perfusion and microvascular integrity in predicting VO status
Multivariate analysis showed that only higher Ve of ischemic core (odds ratio = 1.011, 95% CI = 1.000–1.021, P = 0.046) and poor arterial collaterals (odds ratio = 0.102, 95% CI = 0.032–0.327, P < 0.001) were independently associated with unfavorable VO. The multivariate model demonstrated even higher diagnostic ability than single CTP parameters (y = 0.68 +0.44 x1 + 1.44 x2; y: VO; x1: arterial collaterals; x2: Ve value in the ischemic core area) in predicting unfavorable VO (AUC: 0.83) with a sensitivity, specificity, and cut-off value of 74.60%, 82.05%, and 0.69, respectively (Figure 2).
Discussion
This study investigated the clinical manifestations, collateral status, and microvascular function of AIS-LVO patients who underwent reperfusion therapy. Similar to the previous study, we proved the relationship between favorable VO and the presence of robust arterial collaterals. In addition, the main novelty of our findings is that high Ve in the infarct core can independently predict unfavorable VO in AIS-LVO patients. This indicates that microvascular dysfunction is associated with unfavorable VO and might be one of the pathophysiological mechanisms underlying impaired venous collaterals.
Cerebral perfusion depends on complex microcirculation, which includes arteries, arterioles, capillaries, venules, and veins. Although arterial collateral status is a major determinant of ischemic core growth and correlates with its volume, it only reflects the arterial component of the microcirculation. 24 VO is a sensitive parameter for evaluating micro-perfusion in AIS-LVO patients. 25 Additionally, VO assessment helps visualize the superficial veins of the affected hemisphere and further understand the potential for brain parenchyma damage caused by the obstructed blood outflow. 2 In the previous study, unfavorable VO was linked to ischemic lesion after-treatment reperfusion edema in patients with AIS-LVO.7,26 After the onset of LVO, brain edema may result in elevated interstitial pressure and lead to increased resistance of collateral in the hyperperfused area. 9 Accordingly, recent studies also pointed out the potential association between unfavorable VO and the occurrence of reperfusion hemorrhage after endovascular treatment in AIS-LVO patients. They suspected that decompensated microvascular circulation (disrupted BBB and microvascular cerebral blood flow) were contributors to the reperfusion hemorrhages. 5 As Ve represents the volume in the extravascular-extracellular space of BBB, a higher Ve could indicate a higher interstitial pressure of the cerebral microcirculation. 23 Thus, our study may serve as a bridge to understand the pathophysiological alterations that lead to the higher percentage of reperfusion hemorrhages and edema in patients with poor VO in the studies mentioned above. In another study, the authors found that patients who underwent the thrombolytic treatment had better VO since tissue plasminogen activator may reduce arteriole and venule microvascular thrombosis and restore the cerebral microcirculation. 27
We used a one-stop CTP technique to evaluate microvascular integrity, which can be completed routinely and conveniently when selecting patients for mechanical thrombectomy. Moreover, data on arterial collateral, VO, CBV, CBF, TTP, and Tmax can be collected simultaneously. Our results proved that higher Ve had priority over the other CTP parameters in predicting unfavorable VO. This result supported the concept that VO is strongly related to cerebral microcirculation, whereas other CTP parameters reflect brain circulation from the macroscopic point of view. However, most previous studies described microvascular function based on permeability parameters such as BBBP and permeability surface-area product.28,29 Few data were published about Ve in AIS patients. Ktrans and Kep are frequently used to describe the endothelial permeability and leakage of contrast across the BBB;30,31 there was no significant difference in these two values between the favorable and the unfavorable VO groups in our study. Compared to Kep and Ktrans, Ve more directly describes the fluid accumulation in the cerebral microcirculation related to edema. 23 An increased fluid accumulation in the EES may prevent venous drainage even if arterial collateralization is robust. Thus, our study might suggest that the elevated interstitial pressure (fluid accumulation in the cerebral microcirculation) is more critical than BBB integrity in causing an unfavorable VO, while further investigations are still needed to clarify the relationship between the two.
It has become increasingly clear that it is challenging for patients with AIS-LVO to maintain proper blood pressure control after reperfusion therapy. However, CTP reexamination is seldom performed immediately after thrombectomy treatment due to the associated radiation dose. Based on our result, measuring microvascular function before treatment helps evaluate the possibility of edema and the occurrence of reperfusion hemorrhage after endovascular treatment. Higher blood pressure would increase the perfusion in the ischemia area due to the disrupted BBB. Lowering the blood pressure could prevent reperfusion lesions such as intra-parenchymal hemorrhages. 32 Therefore, evaluation of microvascular function is critical in monitoring and maintaining the blood pressure parameters during and after reperfusion therapy. Furthermore, the high Ve, representing the ultra-fluid in the EES of the unfavorable VO group during the hyperacute period, may prevent venous drainage. Alleviating fluid accumulation to repair the microvascular function might be useful in improving VO. Thus, high Ve is a potential therapeutic target for AIS-LVO patients who underwent reperfusion therapy. Whether treatment of the ultra-fluid in EES can alleviate the poor VO and improve the outcome needs to be studied in the future.
The difference in the definition of unfavorable VO between our work and those in previous studies may be explained by different patient selection criteria, age, and other confounding medical comorbidities. 6 The original two articles on COVES used the cut-off of grade 0 COVES based on the results of interaction between COVES and outcomes.4,8 In the two articles following this initial study, Faizy et al. used a different COVES cut-off of 2 based on a ROC analysis, which found that the highest diagnostic performance for VO to predict tissue level collateral was COVES ≥2.5. 6 In contrast, we used a cut-off of 3 that was set based on the significant interaction between COVES and the clinical outcome. The outcome at hospital discharge was significantly better in patients with favorable VO, but the two groups had no difference in the mRs at 3 months after discharge. We suppose that this may be due to the high percentage of good recanalization (86/102, 84.3%) in both favorable and unfavorable VO groups (87.19% vs. 82.53%). Patients with higher reperfusion status after mechanical thrombectomy have been proven to have better outcomes in previous works.33,34 The difference in outcome at 3 months after discharge might be balanced by the influence of good recanalization in our study. The relatively small sample size may be another reason. Multicenter research should be performed in the future.
There were some limitations to our study. Firstly, this was a single-center retrospective study, along with relatively small sample size. Multicenter analyses with a larger population will be needed. Secondly, we would benefit from obtaining data from prospective studies with more parameters estimated on T1-contrast MRI and susceptibility-weighted imaging to support our results.
In conclusion, our study focused on the mechanisms underlying impaired venous collateral in AIS-LVO patients. We investigated the clinical manifestations, collateral status, and microvascular function of AIS-LVO patients who underwent reperfusion therapy. In addition to the previously proven relationship between VO and arterial collaterals, we also found that microvascular dysfunction is independently associated with unfavorable VO. The microvascular dysfunction represented by increased Ve may be an important mechanism of impaired venous collateral circulation.
Supplemental Material
sj-jpg-1-jcb-10.1177_0271678X231165606 - Supplemental material for Microvascular dysfunction associated with unfavorable venous outflow in acute ischemic stroke patients
Supplemental material, sj-jpg-1-jcb-10.1177_0271678X231165606 for Microvascular dysfunction associated with unfavorable venous outflow in acute ischemic stroke patients by Xiaoshuang Li, Liping Lin, Jian Zhang, Yuhua Fan, Shihui Xing, Li Jiang, Zhiyun Yang, Jing Zhao and Jingjing Li in Journal of Cerebral Blood Flow & Metabolism
Footnotes
Funding
This study was supported by grants from the Guangdong Provincial Key Laboratory of Diagnosis and Treatment of Major Neurological Diseases (2020B1212060017), Guangdong Provincial Clinical Research Center for Neurological Diseases (2020B1111170002), Southern China International Joint Research Center for Early Intervention and Functional Rehabilitation of Neurological Diseases (2015B050501003 and 2020A0505020004), Guangdong Provincial Engineering Center for Major Neurological Disease Treatment, Guangdong Provincial Translational Medicine Innovation Platform for Diagnosis and Treatment of Major Neurological Disease, Guangzhou Clinical Research and Translational Center for Major Neurological Diseases (201604020010).
Declaration of conflicting interests
The author(s) declared no potential conflicts of interest with respect to the research, authorship, and/or publication of this article.
Authors’ contributions
Conceptualization: Jingjing Li and Jing Zhao; Methodology: Liping Lin, Yuhua Fan and Zhiyun Yang; Formal analysis and investigation: Liping Lin, Li Jiang and Shihui Xing; Writing – original draft preparation: Xiaoshuang Li and Jingjing Li; Funding acquisition: Jingjing Li; Supervision: Jingjing Li and Jing Zhao.
Supplemental material
Supplemental material for this article is available online.
References
Supplementary Material
Please find the following supplemental material available below.
For Open Access articles published under a Creative Commons License, all supplemental material carries the same license as the article it is associated with.
For non-Open Access articles published, all supplemental material carries a non-exclusive license, and permission requests for re-use of supplemental material or any part of supplemental material shall be sent directly to the copyright owner as specified in the copyright notice associated with the article.